Review

Fuzzy-Based Time Series Forecasting and Modelling: A Bibliometric Analysis

by
Luis Palomero
1,2,†,
Vicente García
3,† and
José Salvador Sánchez
2,*,†
1
Declarando Asesores 3.0 S.L., 12001 Castelló de la Plana, Spain
2
Department of Computer Languages and Systems, Institute of New Imaging Technologies, Universitat Jaume I, Av. de Vicent Sos Baynat s/n, 12071 Castelló de la Plana, Spain
3
División Multidisciplinaria en Ciudad Universitaria, Universidad Autónoma de Ciudad Juárez, Av. José de Jesús Macias Delgado 18100, Ciudad Juárez 32310, Mexico
*
Author to whom correspondence should be addressed.
These authors contributed equally to this work.
Appl. Sci. 2022, 12(14), 6894; https://doi.org/10.3390/app12146894
Submission received: 10 June 2022 / Revised: 4 July 2022 / Accepted: 5 July 2022 / Published: 7 July 2022
(This article belongs to the Special Issue Emerging Feature Engineering Trends for Machine Learning)

Abstract

:
The purpose of this paper is to present the results of a systematic literature review regarding the development of fuzzy-based models for time series forecasting in the period 2017–2021. The study was conducted using a well-established review protocol and a couple of powerful tools for bibliometric analysis to know and analyse the main approaches adopted in the research field of interest. We analysed 118 articles published in peer-reviewed journals indexed in the 2020 Journal Citation Reports of the Web of Science. This allowed us to present an in-depth performance analysis and a science mapping regarding the current situation of fuzzy time series forecasting and modelling. The outputs of this study provide a practical base for further investigations that address this topic from both a methodological point of view and in terms of applicability.

1. Introduction

Time series forecasting is a very intensive research area used for real-life applications, such as finance, process and quality control, energy consumption, water demand, epidemiology and many others. A time series Z of size n can be formulated as an ordered sequence of observations Z = ( z 1 , z 2 , , z n ) distributed over time, where z i denotes the value taken by the series for the i-th time period. The series can be deterministic if the time series values are described by a mathematical function y = f ( t i m e ) , or stochastic if they incorporate a random term y = f ( t i m e , ϵ ) [1].
According to prior knowledge about data distribution, the time series forecasting models can be classified into two groups: (i) parametric or probabilistic (e.g., exponential smoothing and ARIMA), and (ii) non-parametric or computational (e.g., artificial neural networks, support vector machines and nearest neighbours). Apart from their simplicity and comprehensibility, the non-parametric approaches offer results similar to or even better than those achieved by parametric methods without a priori knowledge of data distribution [1]. However, the non-parametric models present some limitations or drawbacks regarding their accountability [2], and also because they cannot deal with the uncertainty and vagueness usually inherent in real-world time series data [3]. In addition, both probabilistic and computational models require large datasets [4].
To overcome the data uncertainty and the statistical assumptions of linearity and time invariance, Song and Chissom [5,6] introduced the fuzzy time series (FTS) model based on Fuzzy Set Theory and Fuzzy Logic, which was later simplified by Chen using arithmetic operations to reduce the computational cost associated with the complex matrix operations in Song and Chissom’s method [7]. Chen’s model, which is considered a real breakthrough in this field, consists of five sequential steps: (i) partition of the universe of discourse (UoD) into intervals; (ii) defining the linguistic terms for each interval; (iii) fuzzification of the historical time series data set; (iv) establishing the fuzzy logical relationship (FLRs) between the fuzzified time series values, and creation of the FLR groups; and (v) defuzzification. These steps can be organized into two main stages: the data partitioning phase (steps i–iii) and the forecasting or prediction phase (steps iv–v). From these general steps, partitioning the UoD, identification of FLRs and defuzzification are considered critical in the performance of the forecasting model.
An alternative, also based on Fuzzy Set Theory and Fuzzy Logic, is fuzzy inference systems (FIS) [8], which are rule-based mechanisms that establish a relationship between a series of input and output sets. There are two basic types of FIS, namely the Mamdani model [9] and the Takagi–Sugeno–Kang (TSK) model [10]; while fuzzification of input variables and application of operators in IF–THEN rules are the same in both types of FIS, they mainly differ in terms of translating the fuzzy outputs inferred from the fuzzy rules into crisp values (i.e., the defuzzification process). The Mamdani type has a better interpretation ability, whereas the TSK-type has a better approximation accuracy. Two well-developed approaches to FIS are the adaptive network-based fuzzy inference system (ANFIS) [11] and the type-1 fuzzy FIS [12]. ANFIS employs TSK-type FIS in a five-layered network structure, but it is computationally expensive and generates complex models for even relatively simple problems.
It has been argued that the main problem with the fuzzy-based time series forecasting models comes from the difficulty constructing and deconstructing the fuzzy sets, and also from the complexity of the FLRs [13]. A competitive strategy to tackle these difficulties consists of using some type of hybridization together with the fuzzy components. Among others, artificial neural networks, evolutionary algorithms, fuzzy clustering, ant colony and particle swarm optimization and rough set rule induction have successfully been applied to different steps of FTS forecasting, especially for partitioning the UoD, fuzzification and defining FLRs [14,15,16,17].
Given the proliferation of forecasting models, elaborating any up-to-date systematic review and/or bibliometric analysis offers a comprehensive understanding of the current status of the topic and allows the identification of several gaps for the development of new research. Accordingly, the purpose of this study is to provide a thorough review of articles published in peer-reviewed journals between January 2017 and December 2021 to highlight the most relevant and influential research areas, articles, authors, geographical regions and developments in the framework of time series forecasting with fuzzy-based models. To this end, we carry out a performance analysis and a science mapping of the research field that can be useful for researchers and practitioners working in time series forecasting and modelling.
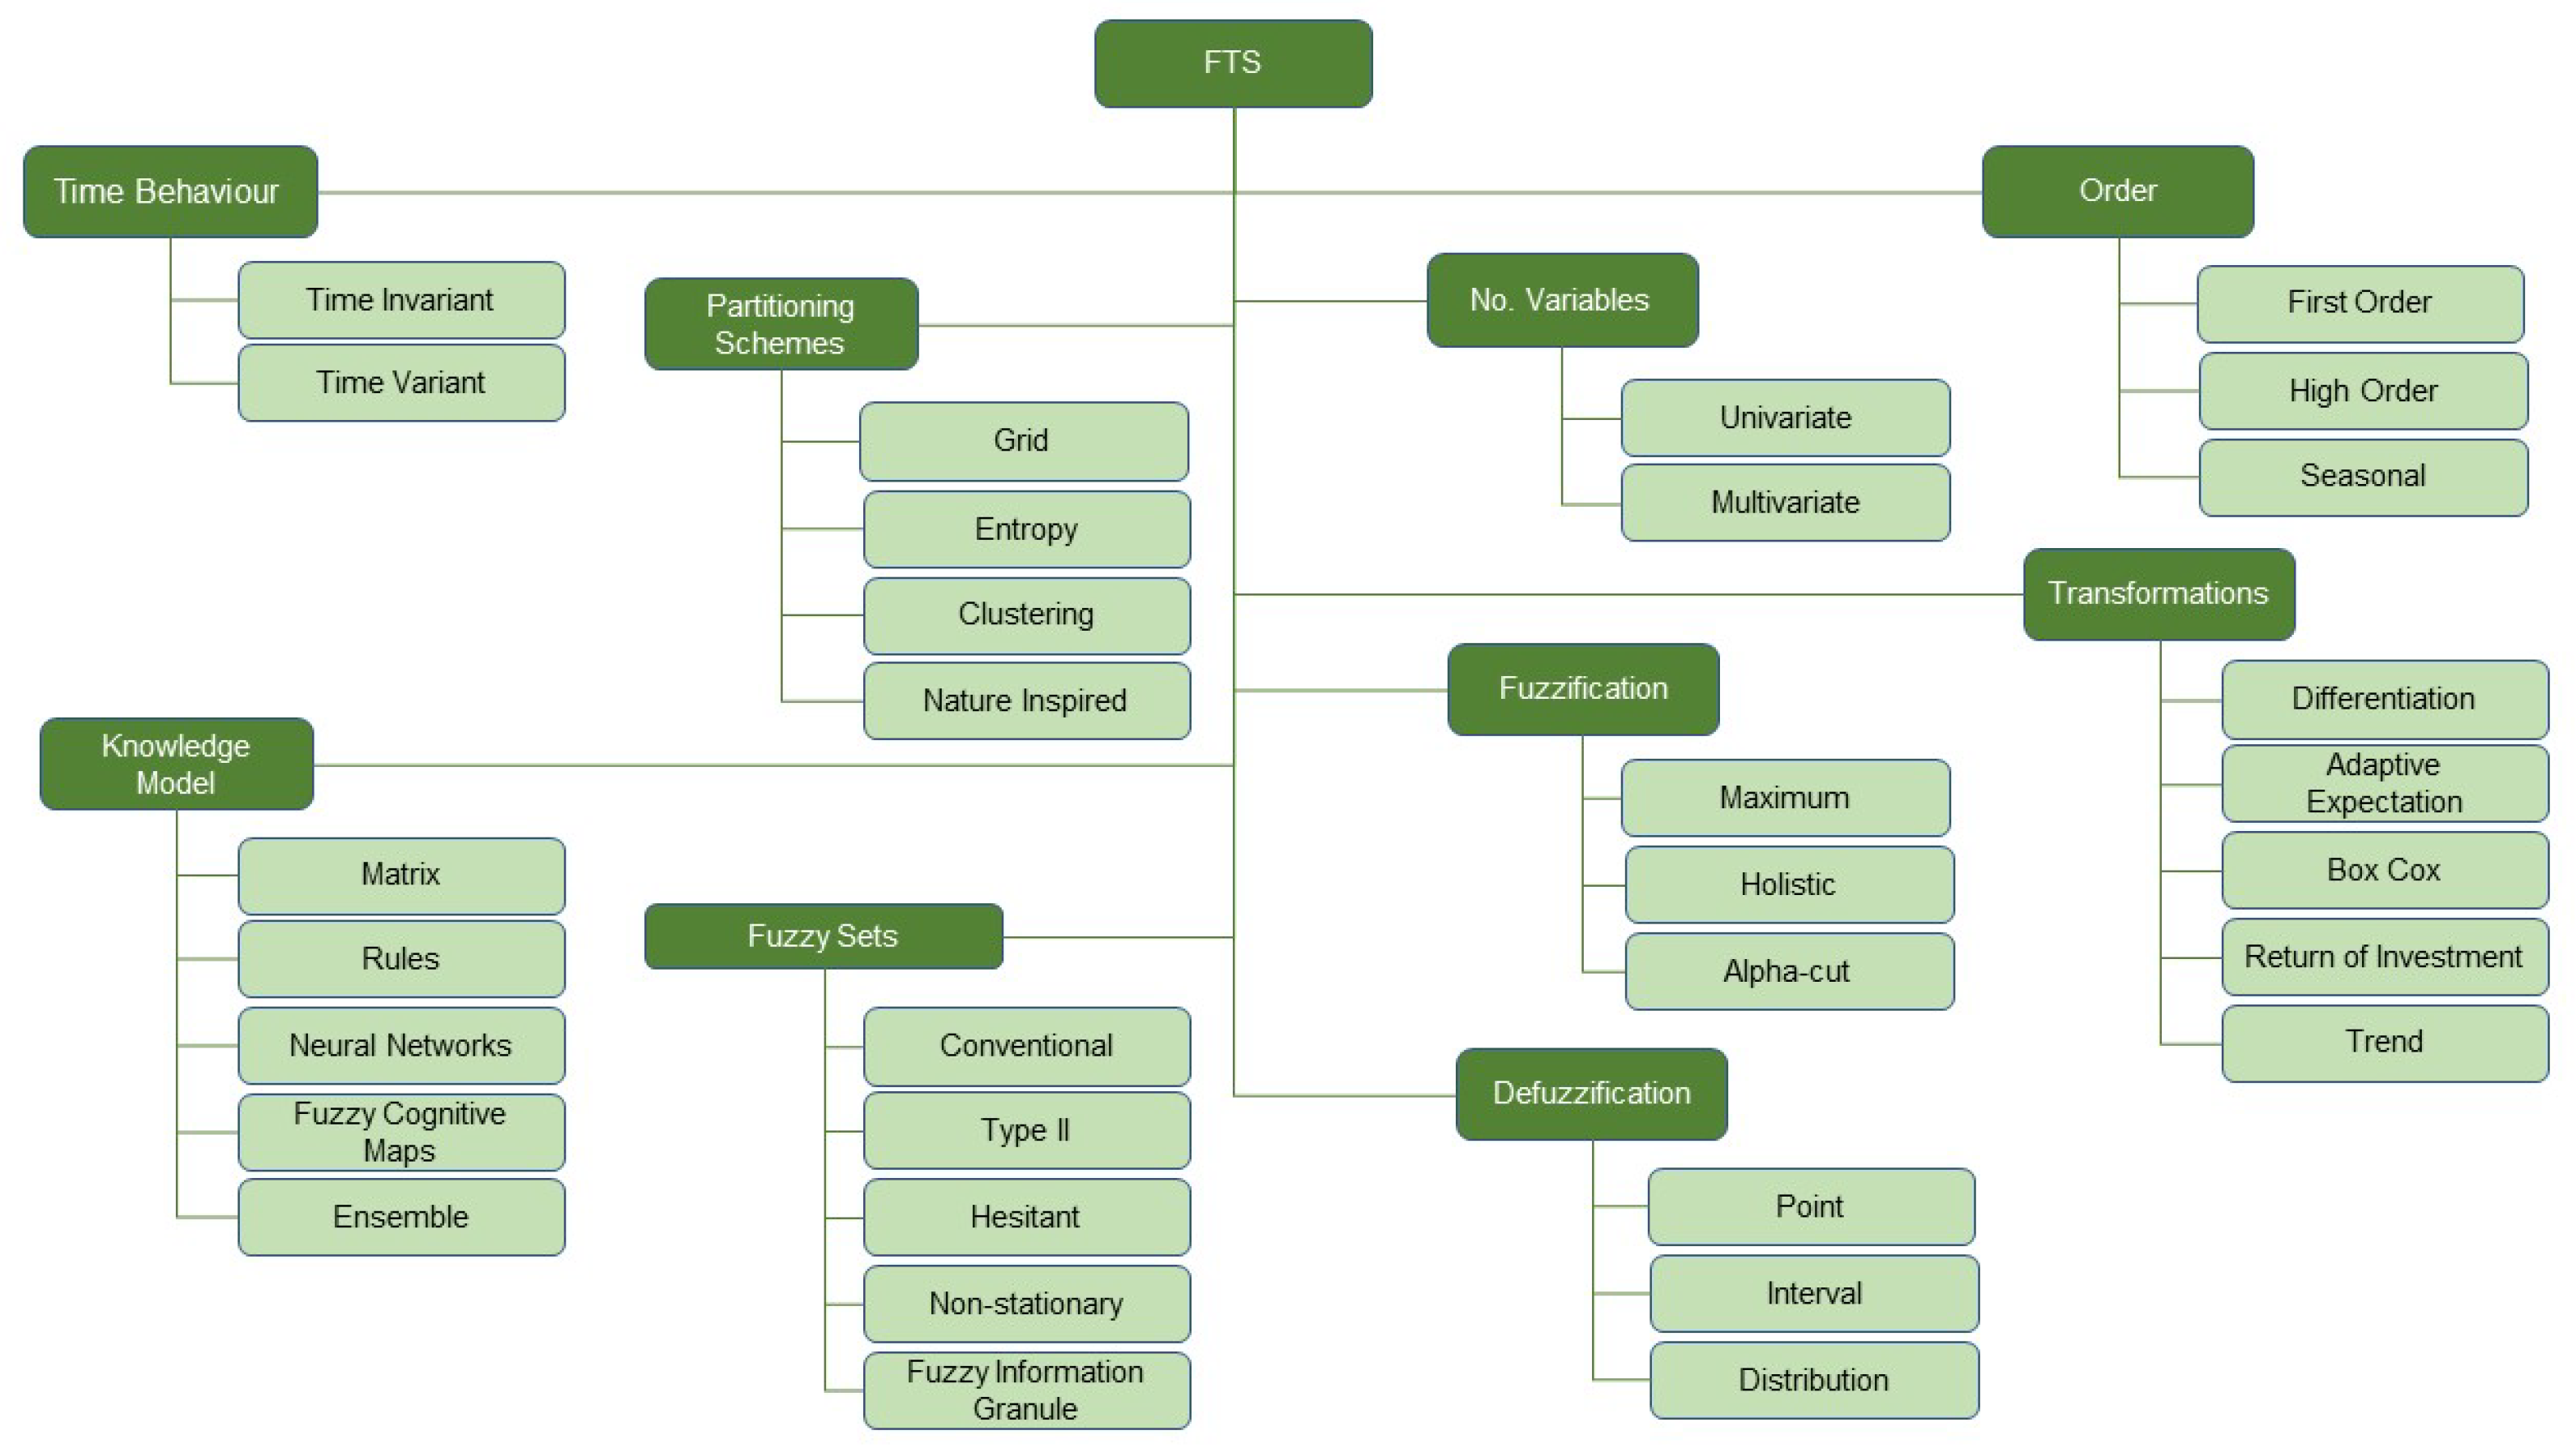
One can find several categories of FTS methods, whose main features and their variations are illustrated in Figure 1. The main difference between FTS and conventional time series is that their values are fuzzy sets. This allows the FTS models to make robust predictions even with relatively short time series or when the historical data are not adjusted [7]. However, two main problems of these models are an adjusted definition of the fuzzy sets (the concept of partitioning schemes in the taxonomy) and the depth of the transition rules between them (the knowledge models).
Henceforth, the paper is organized as follows. Section 2 summarizes some previous reviews closely related to this work. Section 3 describes the research methodology adopted to elaborate the present systematic review. Section 4 provides the research outputs through a performance analysis and a science mapping. Section 5 analyses and summarises the most cited articles. Finally, Section 6 answers the research questions formulated, whereas Section 7 remarks on the most important findings of this study and highlights some issues and research avenues that could be addressed in the future.

2. Some Related Reviews

The extensive twenty-year (1993–2013) review on FTS modelling procedures carried out by Singh constitutes one of the most thorough works [19]. The paper concluded that significant research on FTS modelling was addressed to design algorithms for the discretization of time series data, to generate rules from the fuzzified time series values, propose techniques for defuzzification and develop hybridised-based architectures to resolve complex decision-making problems.
An excellent review on linear and non-linear time series analysis and forecasting was presented by De Gooijer and Hyndman [2], summarizing works published between 1982 and 2005 with especial emphasis on exponential smoothing, ARIMA and state-space and structural models. Despite the vast amount of papers, this review included only one study based on a fuzzy system to combine a set of individual forecasts. Feng presented a survey on the design of model-based fuzzy control systems focusing on the Takagi-Sugeno fuzzy models [20]. Ahmed and Isa performed a systematic review of the literature on fuzzy information granules, which need to achieve a trade-off between interpretability and accuracy [21]. Zhu et al. presented a survey on a collection of methods to predict the water-level fluctuation in lakes, including ANFIS and hybrid wavelet–ANFIS [22].
Han et al. reviewed the state of the art of classical and deep learning models for time series forecasting that were designed to capture temporal relationships explicitly, and categorized them into three groups [23]: discriminative, generative and hybrid models. The authors also described the pros and cons of each model, including a comparison between classical (e.g., least-square support vector machine, shallow neural networks, Bayesian networks, fuzzy C-means) and deep learning (e.g., long short-term memory, auto-encoder, restricted Boltzmann machine, generative adversarial nets) fuzzy-based time series models. In addition, the paper gives a set of experiments on both benchmarks and real-world data to evaluate the performance of the most representative deep learning models. Felix et al. focused their review on methods and software for fuzzy cognitive maps applied to time series forecasting [24]. A review on the state-of-the-art applications of interval type-2 fuzzy neural networks to chaotic time series forecasting was carried out by Han et al., summarizing the main contributions and some hardware implementations for speeding up computation [25].
A comprehensive review of machine learning techniques for forecasting time series’ energy consumption was presented by Deb et al. [26]; although this work was not explicitly focused on fuzzy models, the authors included an extensive part to address FTS prediction and modelling. Gurtler and Paulsen performed a meta-analysis in a literature review from 2000 to 2015, covering 86 empirical studies on the time series modelling and forecasting of electricity spot prices [27]. Hajirahimi and Khashei examined more than 150 papers based on three different hybrid structures (parallel, series, and parallel–series) for time series modelling and forecasting, concluding that the parallel–series hybrid structure performed better than the other two hybrid models [28]. Bose and Mali summarised and reviewed the contributions to FTS forecasting in the time period 1993–2018, published in Elsevier journals [4]; in addition, this work provided a list of different error estimation metrics, major application areas and the most used databases in the topic of fuzzy models for time series forecasting.
Ojha et al. provided an in-depth review of the optimal design of type-1 and type-2 FIS using five computational frameworks [29]: genetic fuzzy systems, neuro-fuzzy systems, hierarchical fuzzy systems, evolving fuzzy systems and multi-objective fuzzy systems. Hamza et al. reviewed the 100 most frequently cited papers published on the design and application of type-2 fuzzy logic systems from 1980 to 2016, including an exhaustive bibliometric analysis [30].

3. Research Methodology

This work was carried out following the PRISMA statement [31], which constitutes a guideline to report a systematic review while offering enough information to make it reproducible. The steps of performing a systematic review include the formulation of the research questions and methods, the development of a research protocol (methods for literature searching, screening, data extraction and analysis) and the definition of strict inclusion and exclusion criteria for studies, the search of literature papers using bibliographic databases, the extraction of relevant data, the analysis of data and the interpretation of outputs by summarizing the findings and discussing the strengths and weaknesses of the included studies.
This study has been addressed and organized to answer the following research questions:
RQ1
Which journals are used the most as sources to disseminate the research results?
RQ2
What is the evolution of publications per year?
RQ3
Which countries are the most active?
RQ4
What are the main research domains?
RQ5
Who are the most cited authors?
RQ6
What is the co-occurrence of words?
RQ7
What are the most influential works?
With the support of the Web of Science (WoS) database, the collection of records was carried out by cross-searching a comprehensive set of keywords (time series AND fuzzy AND (forecast* OR predict* OR analysis OR modelling)) appearing in the title or keywords of an article. In addition, the abstracts of all identified papers were checked to verify that they were directly related to the topic addressed here. To be included in the review, the articles had to report on the development, adaptation or important additions to existing models and be published in peer-reviewed journals indexed in the 2020 Journal Citation Reports (JCR) of the WoS between 1 January 2017 and 31 December 2021. Papers were excluded if they met one or more of the following criteria: (i) written in a language other than English; (ii) reported in conference proceedings, letters, books, technical reports or dissertations; (ii) published in a non-JCR journal; and (iv) reviews, early access papers or studies without any new proposal.
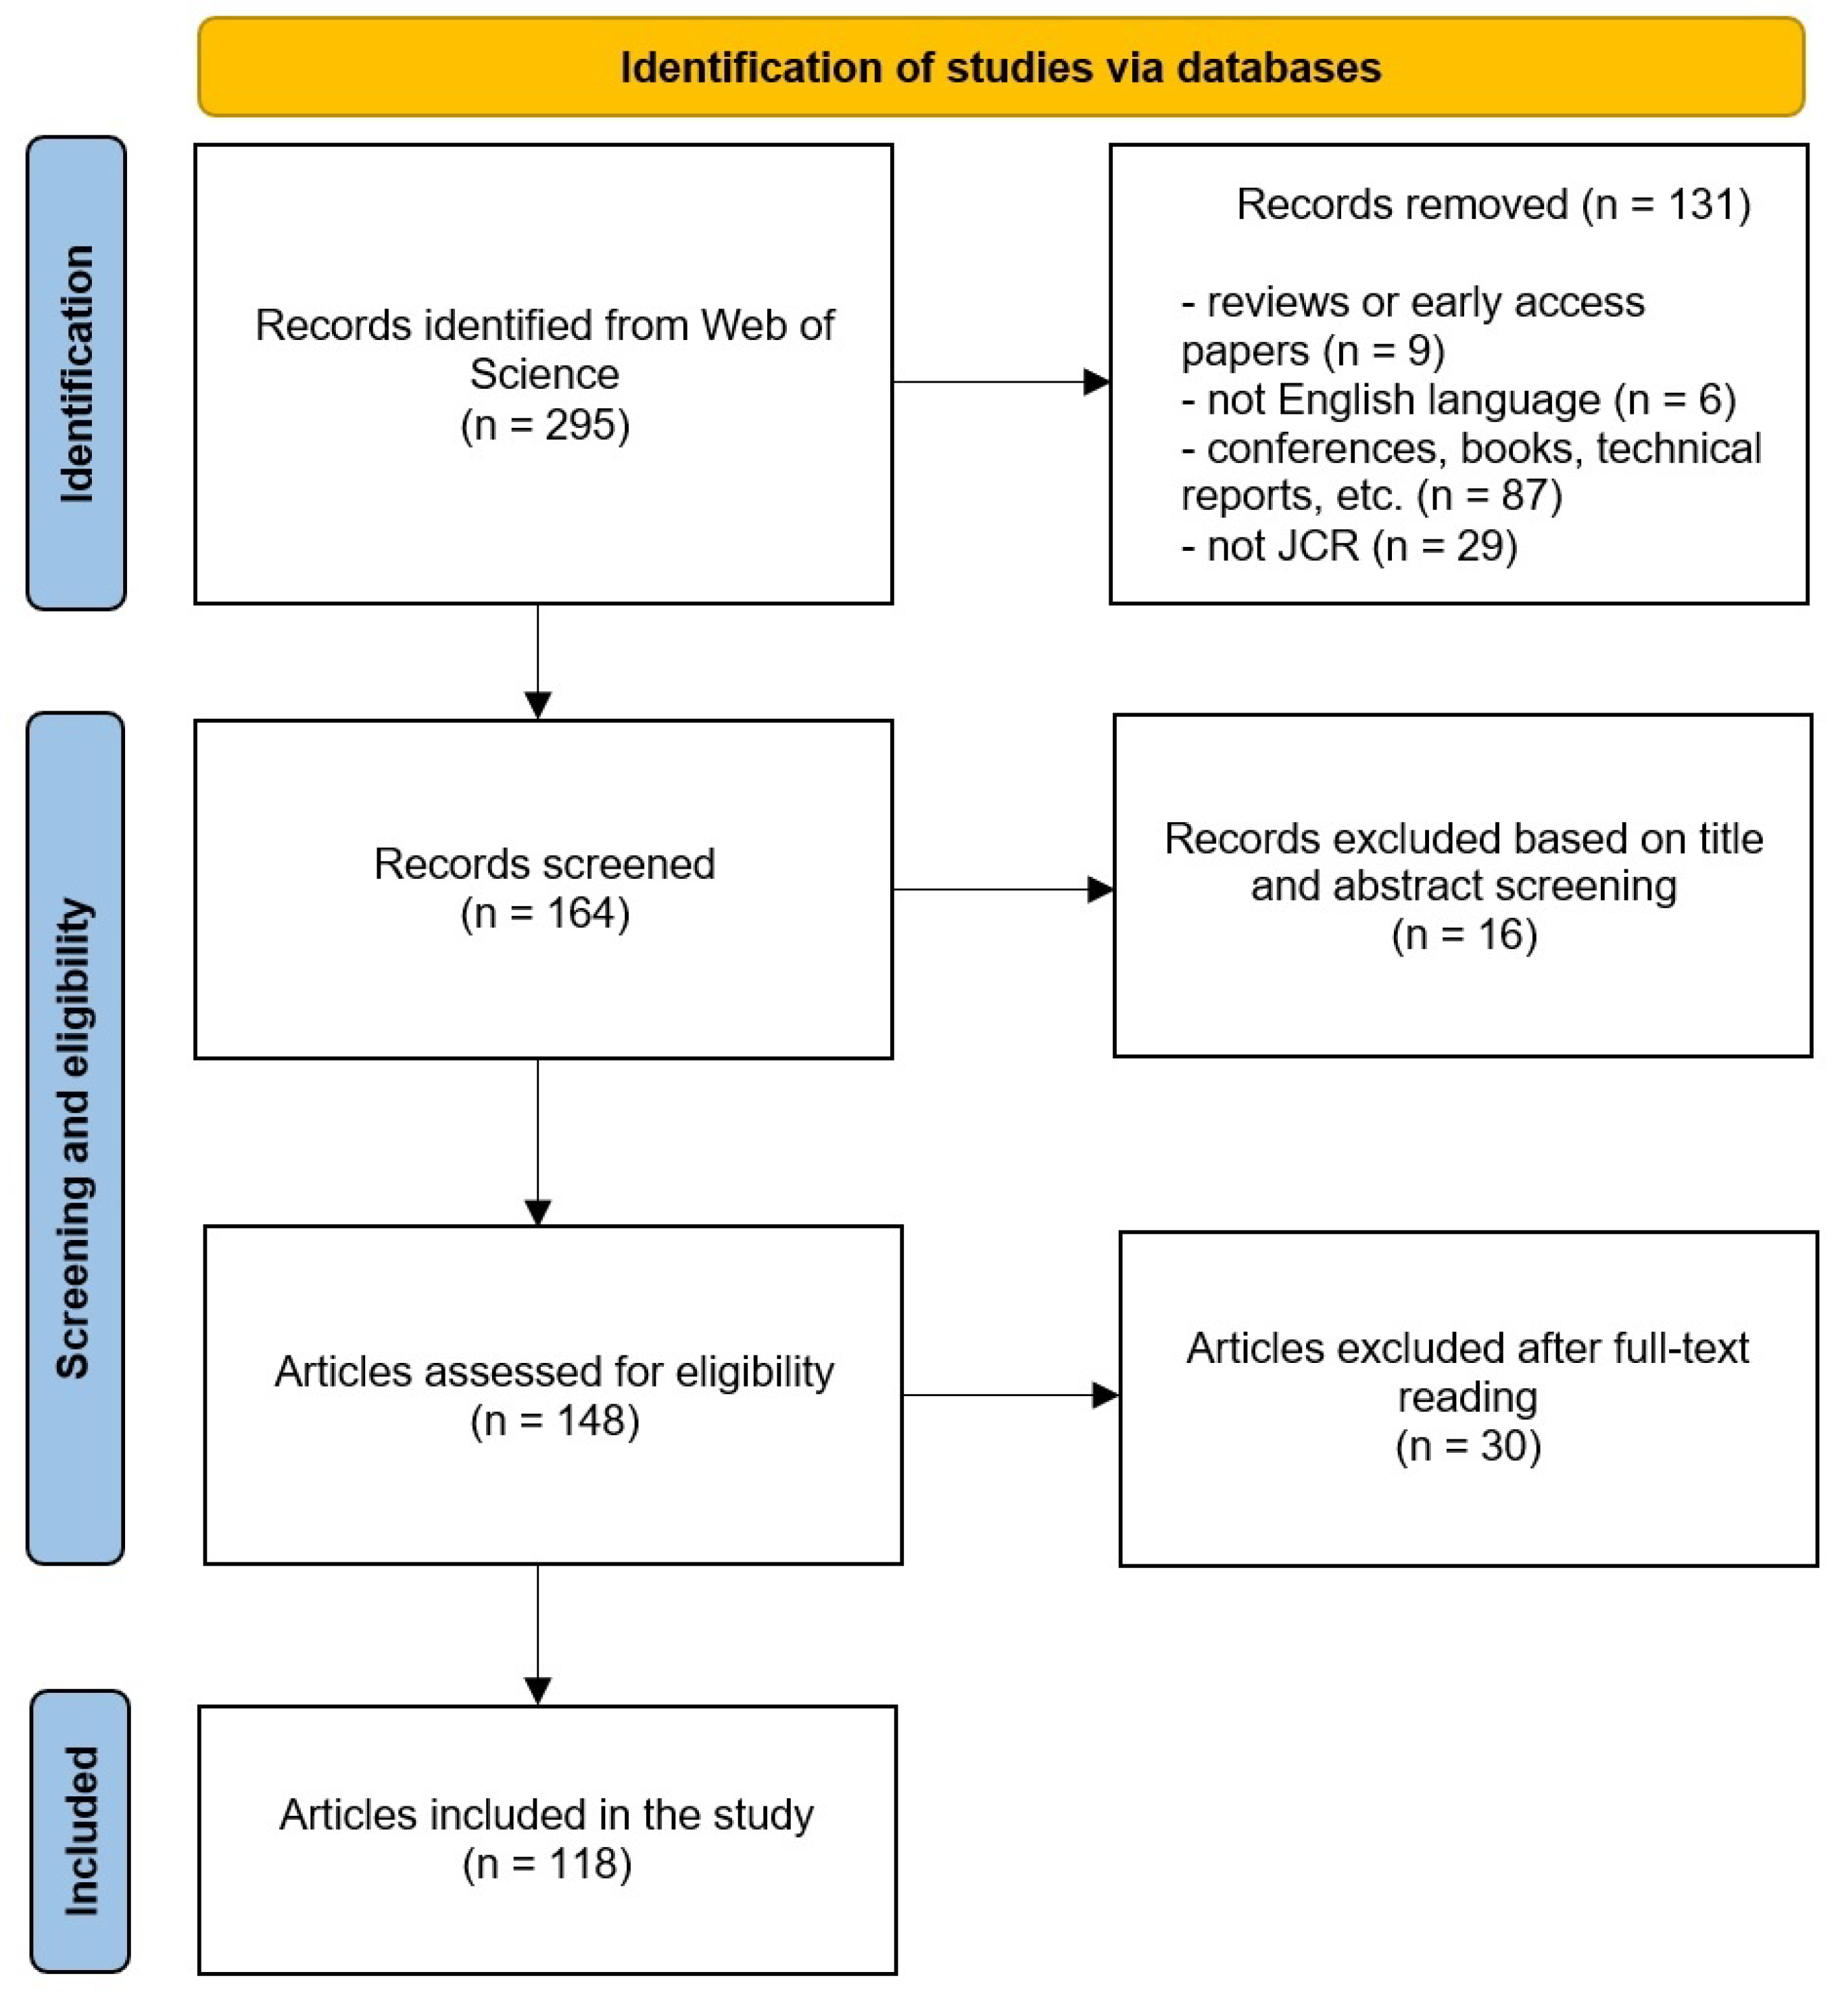
Using the sample of articles given by the protocol just described, the data extraction step was designed to gather data pertinent to the systematic review. The data items recorded were the characteristics of the articles (title, authors’ name and affiliation, publication year, journal, number of citations received and research domain). Apart from these general study items, we also put down the forecasting models used and some characteristics of the experimental design. These data were then organized in a standardised table to make the analysis of outputs easier. The PRISMA flowchart of the research protocol is shown in Figure 2.

4. Research Outputs

The search strategy identified 295 records from the WoS database. After removing 131 records, 164 were included for screening. We excluded 16 records based on title and abstract screening because they did not meet the inclusion criteria, leaving 148 full-text articles to be checked for eligibility. From the full-text reading, we excluded 30 articles that were a mere empirical comparison of existing models without any formal development. Finally, we put a total of 118 articles published in highly rated journals in quartiles Q1 and Q2 in the study. Full references of the articles supporting this study are given in Supplementary Table S1.
Bibliometric indicators are especially useful for carrying out performance analyses and generating scientific maps. These procedures allow us to quantify, measure and visualise the development, potential trends and impact of a scientific research field or topic by studying published papers across a time period [32]. We employed Publish or Perish [33], BibExcel [34] and VOSviewer [35] tools to conduct the bibliometric analysis. We examined several metrics and indicators to gain some insight into the topic of interest for the present study and shed some light on the research questions outlined in Section 3.

4.1. Performance Analysis

Performance analysis, which is descriptive in nature, evaluates the contributions of research elements to a given field or topic [36]. Table 1 presents several basic metrics that are especially meaningful for performance analysis [32]. ACC denotes the annual citation count (i.e., citations per years since its publication).
The articles gathered from the searching process were published in a total of 46 different journals. To address the second research question, Table 2 summarizes the top 20 journals with the highest number of citations and papers to discover the most used and influential sources. Although Applied Soft Computing with 13 papers, followed by the International Journal of Fuzzy Systems and Soft Computing with nine and seven papers, respectively, can be highlighted as the journals with the largest number of works focused on the topic of this study, many other refereed international journals also contributed to the development of fuzzy-based models for time series forecasting in the period 2017–2021.
The top 20 journals accounted for 80% of the total number of citations. Journals such as Applied Energy, Energy and International Journal of Approximate Reasoning exhibited the highest average number of citations per document (47.00, 43.50 and 35.00, respectively). Spearman’s rank correlation coefficient between the number of publications and citations was 0.37396, indicating that the most prolific journals are not always the most influential sources.
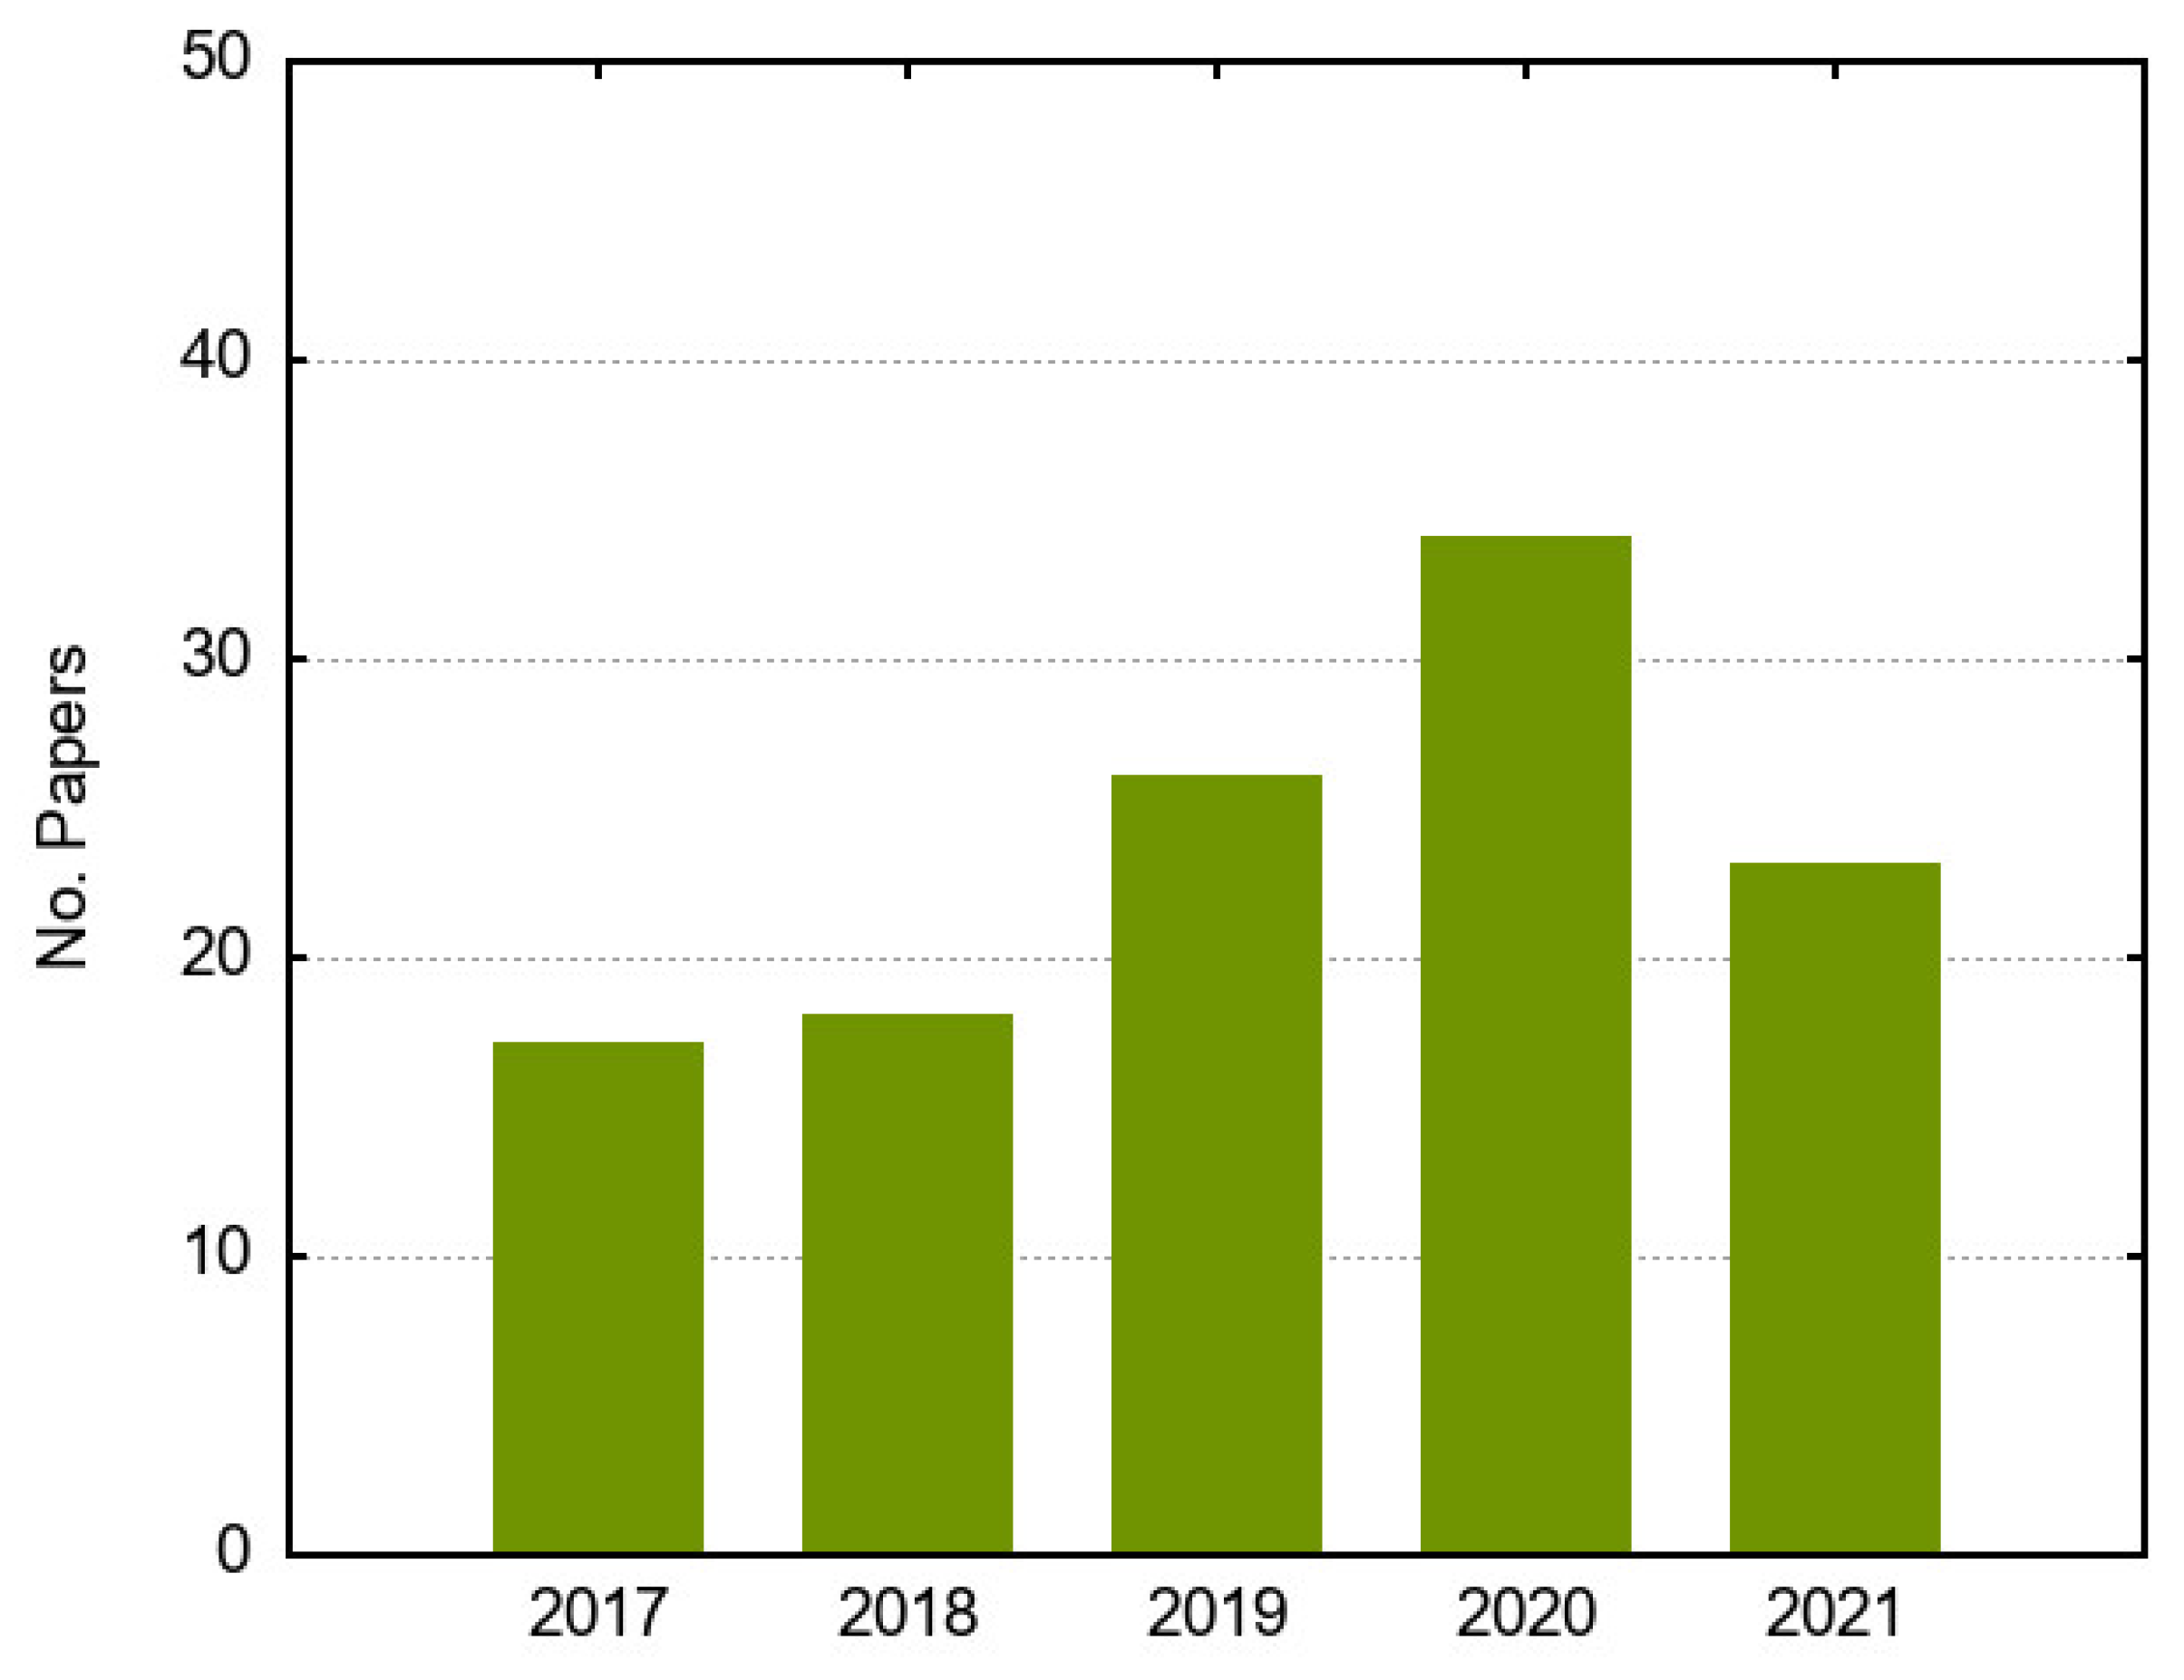
Figure 3 displays a distribution bar chart with the number of papers published per year, thus allowing us to analyse to what extent the interest in the topic is rising or falling. Visual inspection revealed that the annual number of publications was relatively low (≤26 per year), with a peak in 2020, when 34 papers were published, representing 28.81% of the works in the study.
Table 3 provides the number of papers and citations per year. As expected, the total amount of citations was higher in the period 2017–2019 than in 2020 and 2021 because older papers had more time to receive citations. Spearman’s rank correlation coefficient between the number of publications and the number of citations was −0.3, indicating a low correlation between the number of papers and the number of citations.
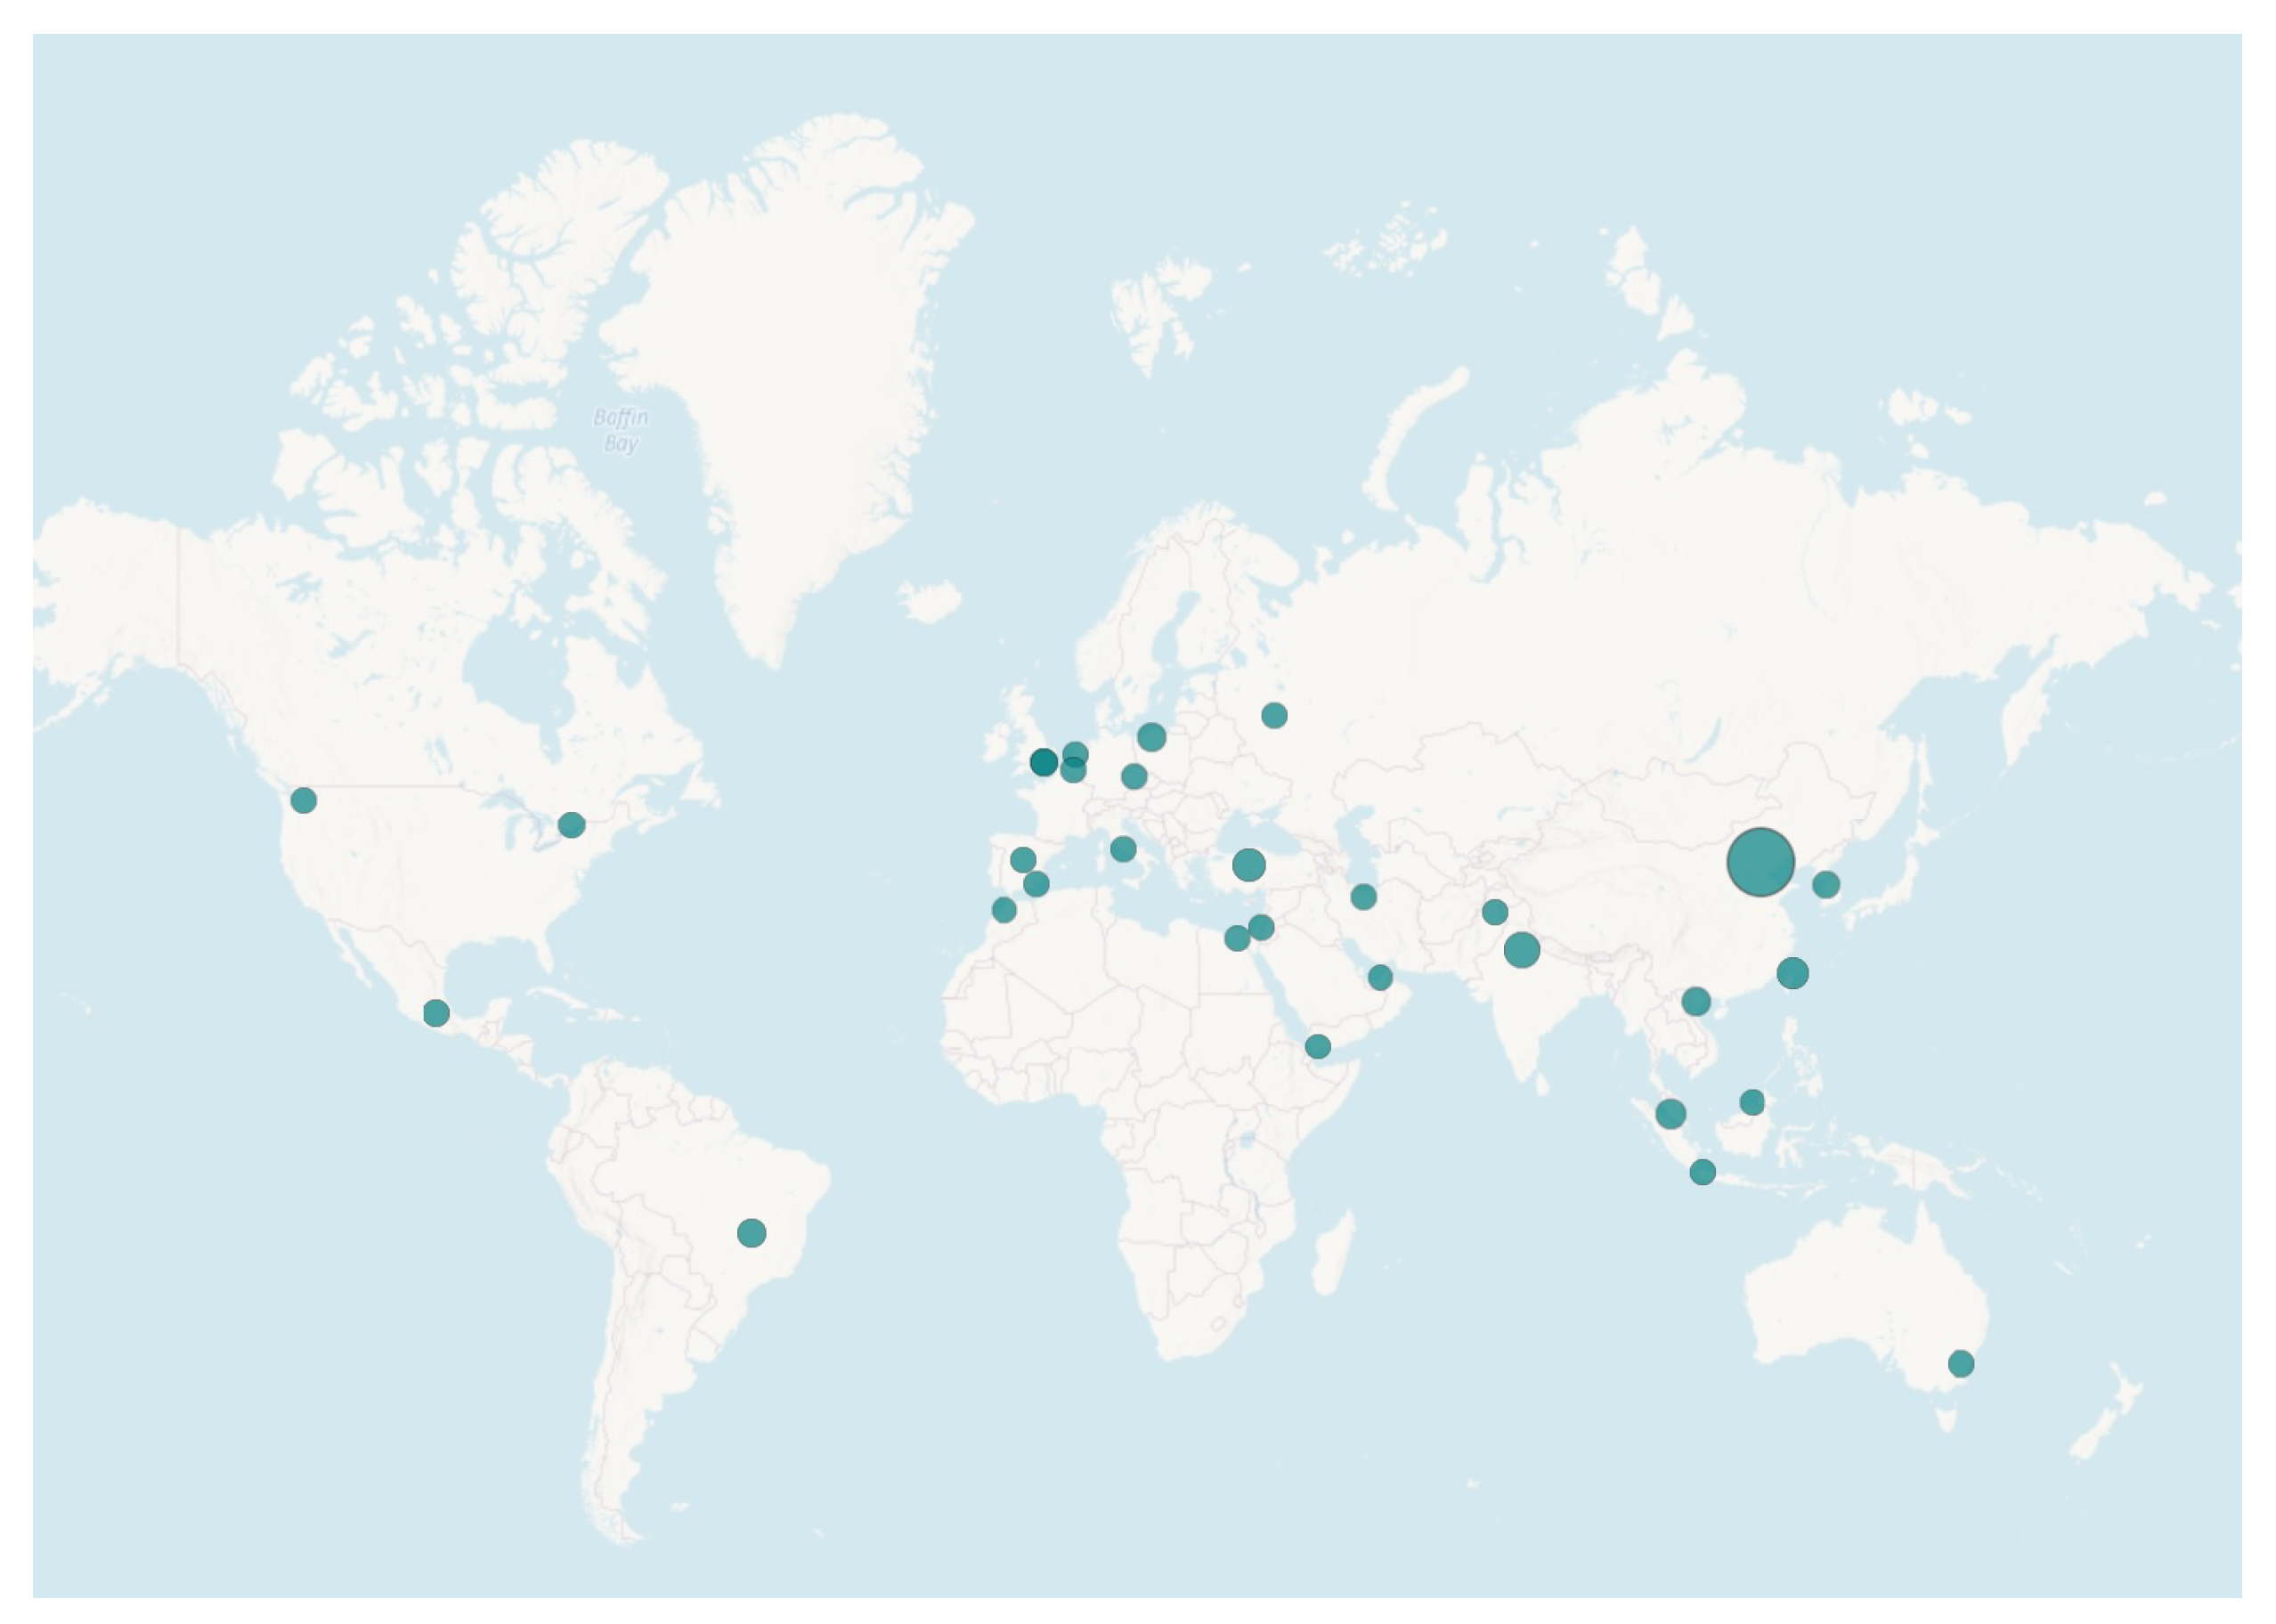
To find out the leading countries performing research on fuzzy set theory applied to time series forecasting, Figure 4 distributes the authors of publications around the world. It shows that China was the country with the highest number of articles published in the period 2017–2021, but it also allows us to see that many countries from all continents published papers on the topic of this study.
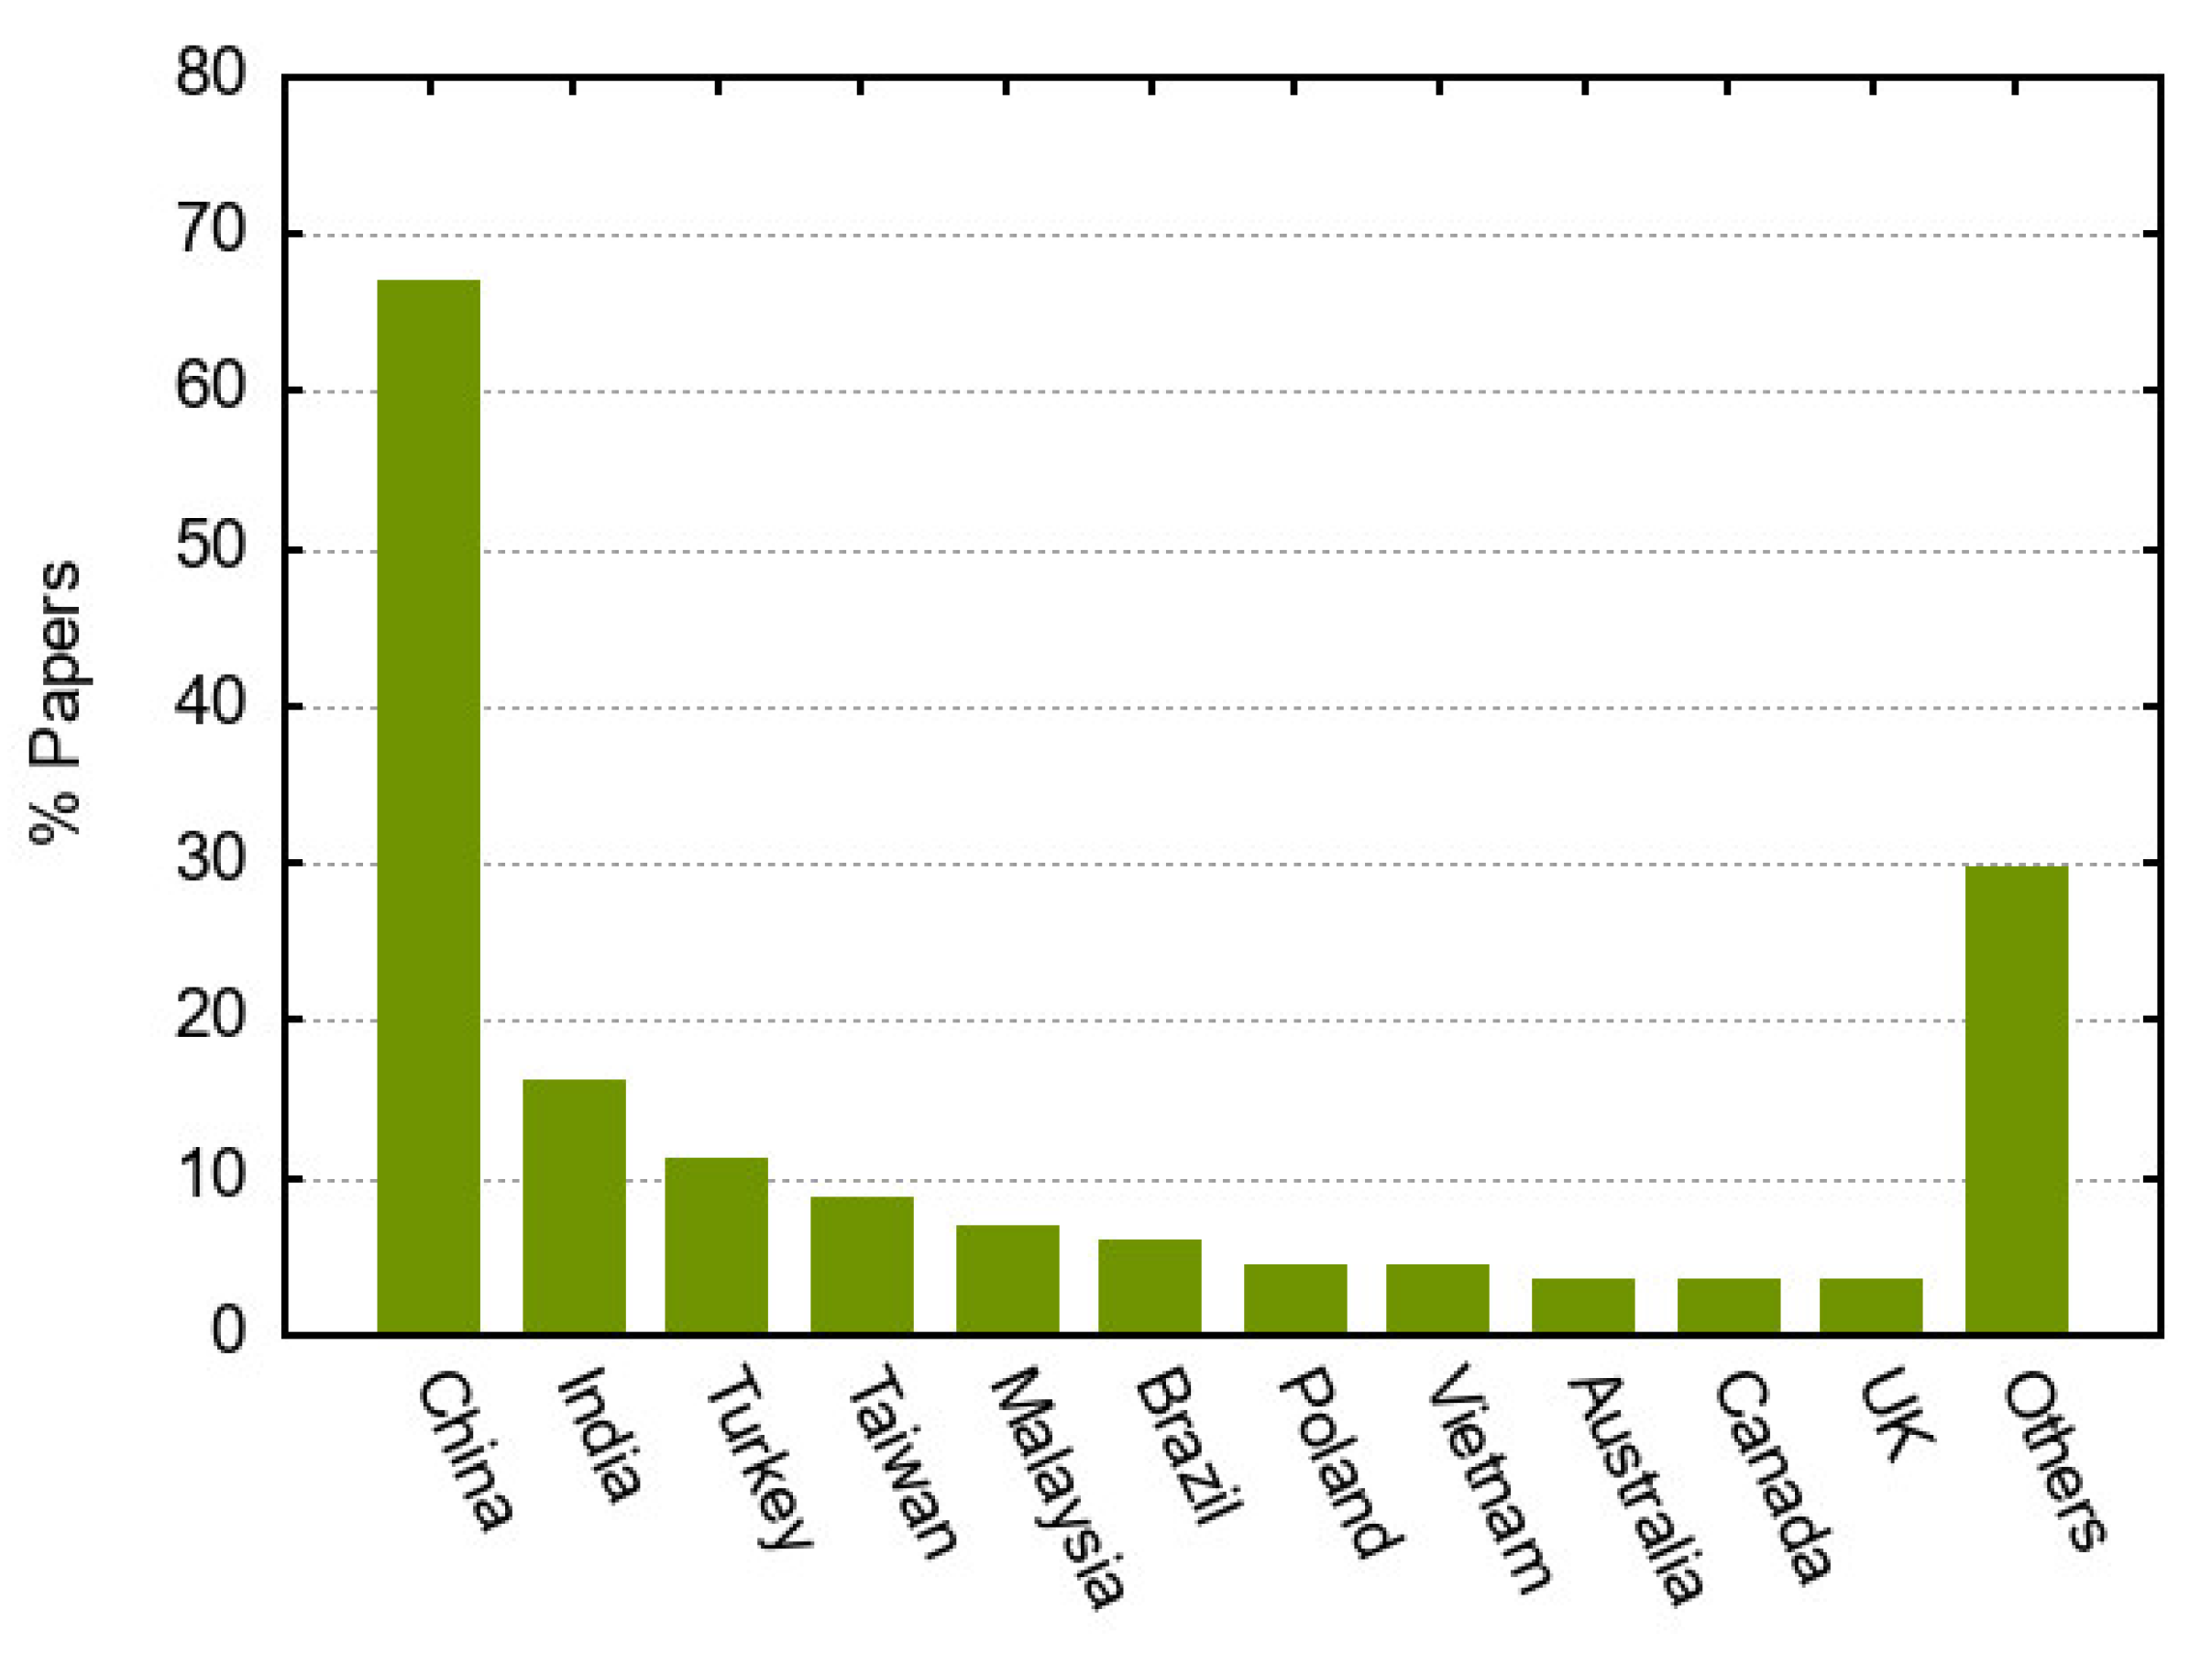
Figure 5 depicts a histogram summarising the papers based on the authors’ country (countries with less than four papers were represented together in a single box). Note that the sum of percentages exceeds 100% because a publication could arise from international collaborations between authors located in different countries. A total of 32 countries participated in publications during the period 2017–2021. China was by far the most productive country, with 79 papers in the sample, followed by India and Turkey with 19 and 13 publications, respectively. Paradoxically, countries such as the USA and the UK, which are typically very prolific in research publications, did not appear to stand out in the topic of this study.

4.2. Science Mapping

Science mapping analyses the relationships between research elements [36]. It puts its attention on monitoring a scientific field and determining research areas to understand its cognitive structure and time evolution.
When analysing the research areas, we identified a great variety of domains that spanned from Computer Science to Communication, Neuroscience or Philosophy, just to mention a few examples. Table 4 presents the main areas from a total of 38 domains identified. Note that the sum of percentages exceeds 100% because papers could be classified into more than one research area. As expected, most articles lay in the Computer Science (90.68%) and Mathematics (68.64%) areas due to the complexity of time series and fuzzy set theory. Another important group can be formed by several applied research areas such as Control Systems, Economics, Environmental Sciences, Telecommunications or Meteorology and Atmospheric Sciences, where time series forecasting has traditionally been a hot topic for both scientists and practitioners.
With the aim of answering the research question RQ5 regarding the most cited authors, the citation analysis examines the number of citations and articles per author. In total, 259 researchers authored the works included in the present study, with each article being co-written by 2.19 authors on average. Table 5 reports the number of papers and the sum of all citations for the top 10 most cited authors in the sample. For the period analysed in this work, Frederico G. Guimaraes was the author with the highest number of citations, whereas Chao Luo was the most productive author (i.e., with the highest number of publications). Spearman’s rank correlation coefficient between the number of citations and articles was not statistically significant (p (two-tailed)= 0.20251).
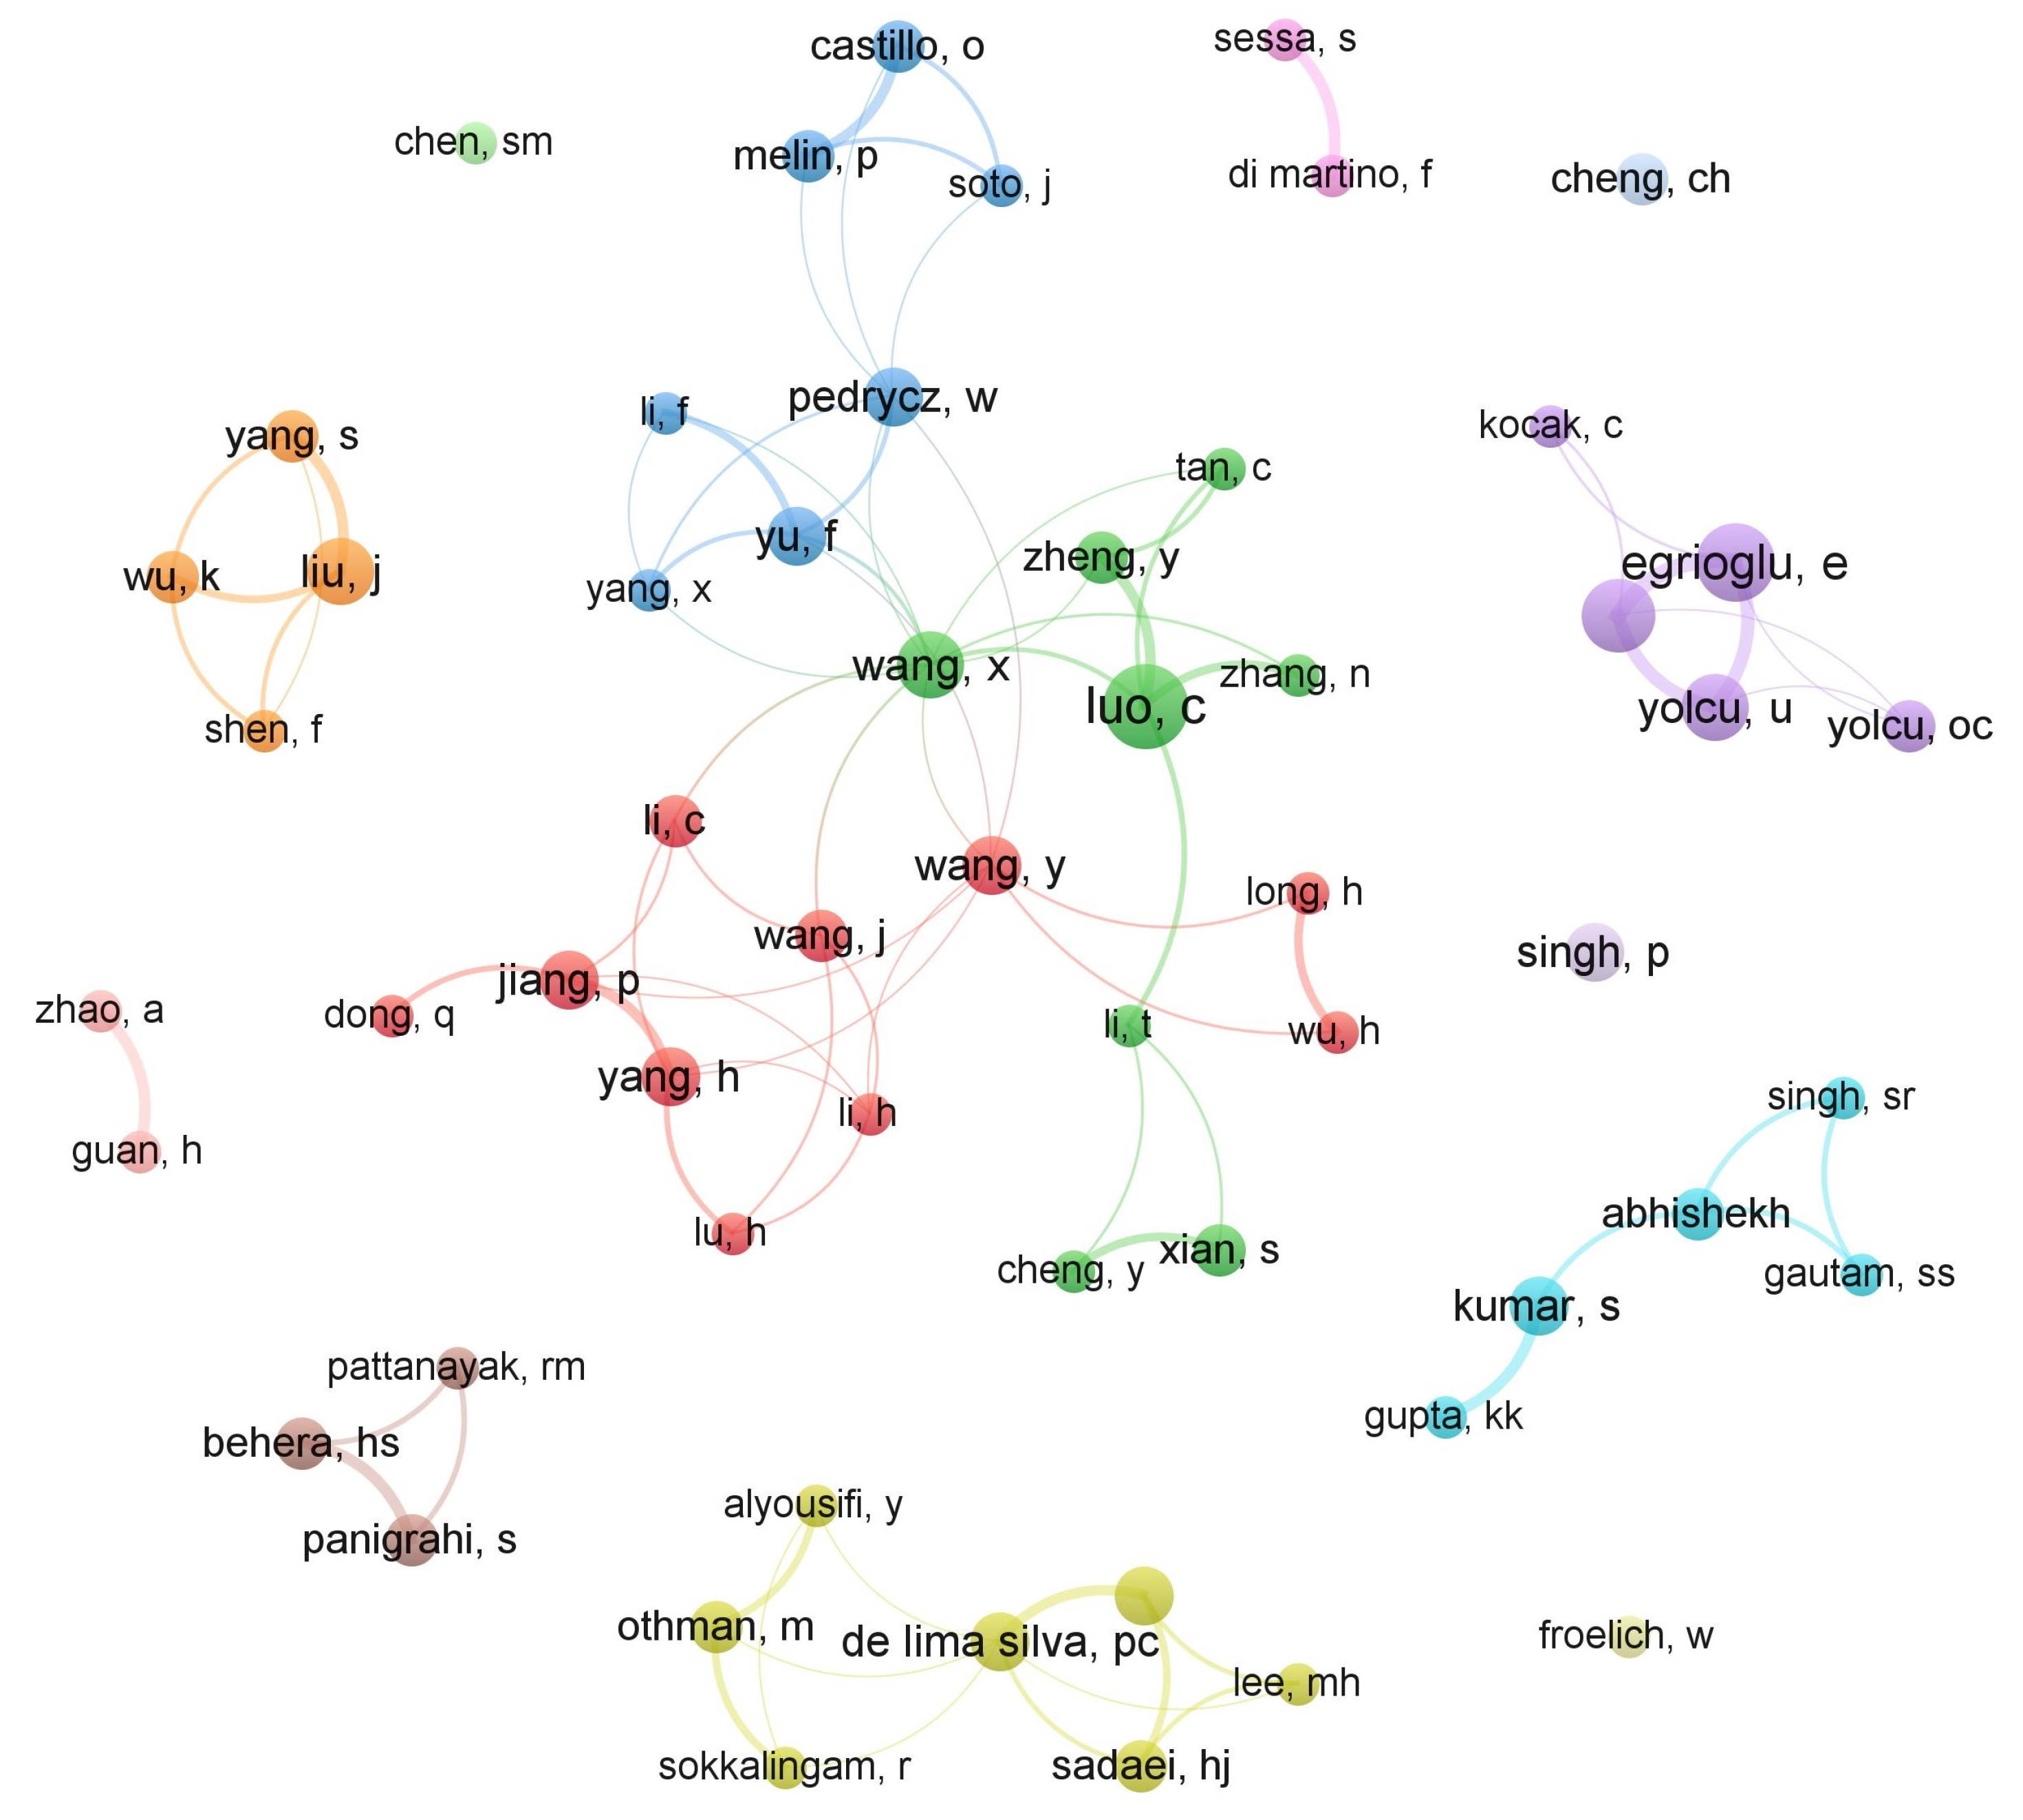
A co-authorship network constitutes a proxy measure for the analysis of research collaborations. The network in Figure 6 highlights the relationships between different researchers based on their publications; here, we represented only those authors with at least two publications. Each node of the figure represents an author, and the links between the nodes represent the collaborative relationships between authors.
A total of 43 researchers with 88 co-authored papers met this condition and were included in the network. E. Bas and E. Egrioglu were the researchers with the highest number of co-authored articles (6), followed by U. Yolcu collaborating with E. Bas and E. Egrioglu in five works. When examining the level of international cooperation, we observed that only a few articles were co-written by authors from different countries. In fact, most works were produced by inter-institution cooperation; for instance, E. Bas, E. Egrioglu and U. Yolcu are all at the Giresun University (Turkey). Another group was identified for papers written by authors from different institutions, but located in the same country: H.S. Behera and S. Panigrahi (with four co-authored articles) are at the Veer Surendra Sai University of Technology and the Sambalpur University Institute of Information Technology, both from India. From the authors in the co-authorship network, the only international collaboration was between F. Yu and W. Pedrycz, who are at the Beijing Normal University (China) and the University of Alberta (Canada), respectively.
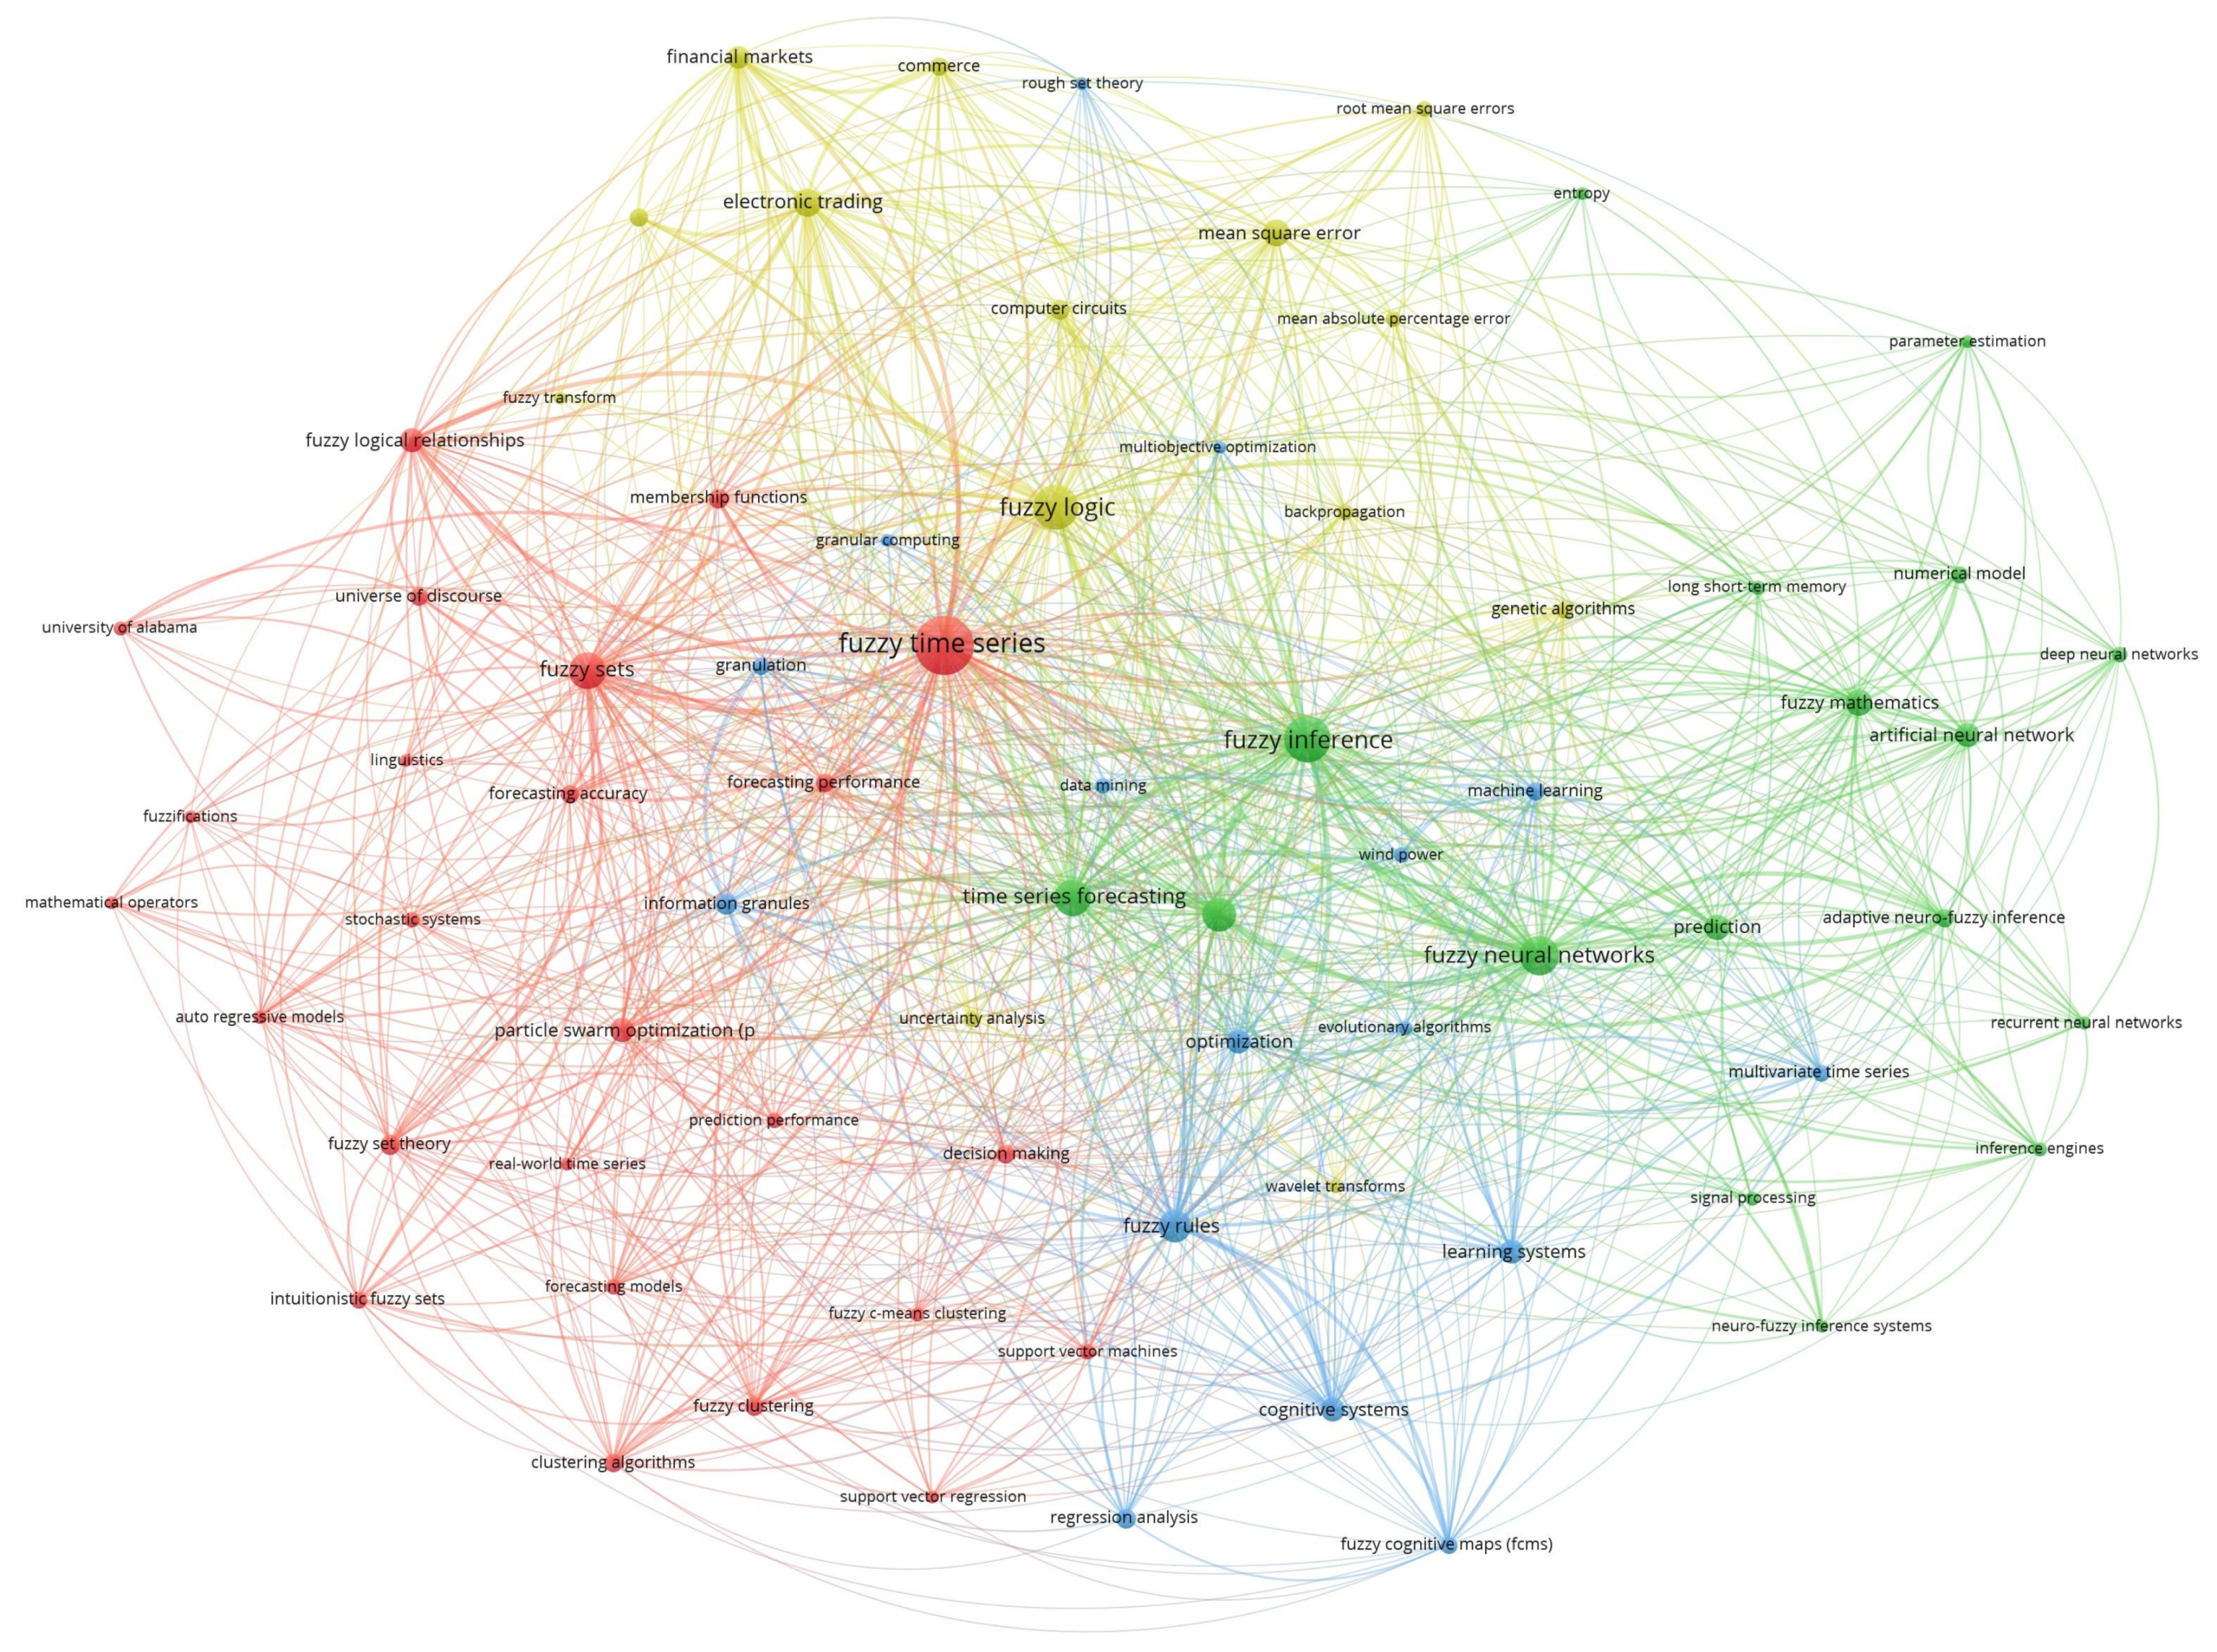
Regarding the analysis of co-occurrence of words (research question RQ6), it allows for identifying clusters of keywords that can be viewed as subjects [36]. In co-word analysis, a commonly used tool is a network that represents the relatedness of terms using two dimensions: distance and colour. Thus, terms that share the same colour (cluster) appear more frequently together than terms with a different colour, whereas the distance between two terms in the network approximately indicates the relatedness of the terms (the closer two terms are located to each other, the stronger their relatedness). The network was constructed using the association strength to measure the similarity between co-occurrence data [37] and a weighted and parametrised variant of modularity-based clustering [38].
Figure 7 depicts the co-word network, in which the terms were extracted from the title and keywords of the publications; only the terms with at least seven occurrences were considered to generate the network. Out of the 115 terms that met the inclusion condition, about 60% of the most relevant terms based on a score were selected and four clusters were identified in the network: (i) the red cluster with 25 items centred at the term “fuzzy time series”; (ii) the green cluster with 17 items centred at “fuzzy inference”; (iii) the blue cluster with 13 items centred at “fuzzy rules”; and (iv) the yellow cluster with 14 items centred at “fuzzy logic”.

5. Analysis and Overview of the Most Cited Articles

For the last research question, we intended to identify works considered important by other researchers, assuming that citations indicate relevance. To this end, a bibliometric indicator based on a relative weighted citation index was applied to evaluate the impact of an article. The relative weighted citation index W ( i ) of an article i was calculated as follows:
W ( i ) = C i Y s t u d y Y i
where C i is the number of times that article i was cited, Y s t u d y is the year of the present systematic review (i.e., 2022) and Y i refers to the publication year of article i.
Note that this relative index weights the number of citations by the article age, thus not penalizing the young publications. Otherwise, by using the absolute number of citations, the old articles would likely be ranked at the top of the most influential works, since a longer time would allow them to accumulate more citations than recent publications.
Table 6 provides the top 10 most cited papers according to the relative weighted citation index W ( i ) . The work by Sadaei et al. [39] published in the Energy journal was the most cited article, with 80 citations and a relative weighted citation index of 26.67, followed by the paper by Jiang et al. [40] in Applied Energy and the paper by Castillo and Melin [41] in Chaos, Solitons & Fractals with 73 and 43 citations and scores of 24.33 and 23.00, respectively. It is also worth remarking that five of the most cited articles were published in journals that belong to Computer Science, and other four research areas (Energy and Fuels, Mathematics, Engineering and Automation and Control Systems) were represented by two papers each.

A Technical Overview of the Most Cited Articles

Using the list of papers given in Table 6, this section highlights some technical subjects, including the proposed development, the time series data used in the experiments and the metrics applied to evaluate the performance in each article.
Sadaei et al. proposed a hybrid model based on FTS and convolutional neural networks for short-term load forecasting [39], in which multi-variate time series were converted into multi-channel images to be processed by the deep neural network and FTS was used to apply regularization in the input layer to decrease the effect of overfitting. The algorithm was applied to temperature time series data and hourly load data of the power supply company of the city of Johor in Malaysia in the years 2009 and 2010. The metrics used to evaluate the performance of the model were absolute percentage error (APE), mean absolute percentage error (MAPE), root mean squared error (RMSE) and median relative absolute error (MdRAE).
Jiang et al. developed a three-stage system for wind speed time series, which comprised a data preprocessing module, an optimisation module and a forecasting module [40]. In the data preprocessing phase, ensemble empirical mode decomposition [49] was used to split the wind speed data into several intrinsic mode functions, eliminate the highest-frequency signal to reduce volatility and assemble the remaining signals to provide a new time series for forecasting. A multi-objective differential evolution algorithm and weighted FTS were applied in the optimisation and forecasting modules to achieve both accurate and stable results. The experiments were carried out over three short-term wind speed datasets from local wind farms in Penglai (China) and the performance was evaluated with mean absolute error (MAE), RMSE, MAPE, Theil’s inequality coefficient (TIC), variance of the forecasting error and direction accuracy of forecasting results (DA). This work presented compared different optimization algorithms (particle swarm optimisation, cuckoo search, harmony search and firefly algorithm) and several prediction models (three different neural network architectures, support vector regression, ARIMA and double exponential smoothing). In addition, hypothesis testing was used to verify statistically significant differences between the proposed forecasting system and the other models.
In the article by Castillo and Melin, a hybrid model based on fractal theory and fuzzy logic was applied to COVID-19 time series forecasting [41]. The model was built with fuzzy rules that employed the fractal dimensions as input values and produced the predictions. The approach was evaluated over time series data related to confirmed, recovered and fatal cases of COVID-19 from 22 January 2020 to 31 March 2020 in 10 countries, taken from the Humanitarian Data Exchange website. The only metric used to assess the performance of the model was the forecasting error (the difference between the actual and predicted values).
Luo et al. introduced an evolving recurrent interval type-2 intuitionistic fuzzy neural network for time series forecasting and regression [42]. In this model, the antecedent part of each fuzzy rule was defined using intuitionistic interval type-2 fuzzy sets, while the consequent rested upon the TSK-type FIS. The proposed model also employed a modified density-based clustering algorithm that allowed self-evolution of the intuitionistic fuzzy rules and adjustment of the network structure. The performance was compared to various variants of type-1 and type-2 fuzzy neural networks (both recurrent and feed-forward structures) using seven well-known benchmark databases and some high-frequency financial price prediction problems. The metrics used for performance evaluation were MAE, RMSE and MAPE.
Hybridisation of granular computing and bio-inspired computing for M-factors time series data forecasting was proposed by Singh and Dhiman [43]. Granular computing was employed to discretize M-factors time series data set and obtain granular intervals, which were also used to fuzzify the time series data set; on the other hand, a bio-inspired algorithm was used to adjust the lengths of the intervals (both granular and non-granular) in the UoD. The proposed method was empirically compared to 12 existing models using the mean, standard deviation, RMSE and TIC to forecast the stock index prices of various companies obtained from https://in.finance.yahoo.com/, accessed on 20 October 2016.
Zhang et al. presented a method based on two primary steps [44]. First, the time series data were converted into a visibility graph (network) [50] and an initial forecasting was made using link prediction [51]. Then, the second step enhanced the initial predictions with the support of fuzzy logic (defining the fuzzy sets and fuzzy rules according to inter-relationship among the historical data). The method was applied to forecast three time series databases: the construction cost index, the Taiwan stock exchange index (TAIEX) and historical enrolment of the University of Alabama. The performance evaluation metrics used in the experiments were mean absolute difference (MAD), MAPE, symmetric mean absolute percentage error (SMAPE) and normalised root mean square error (NRMSE).
Wang et al. developed a hybrid air quality forecasting and early warning system consisting of a deterministic prediction module and an uncertainty analysis module [45]. On the one hand, the deterministic prediction module defined the UoD and the fuzzy sets, fuzzified the observed rules, identified the FLRs, built a trend-weighted matrix where each row was for the occurrence frequency of the FLRs and predicted the output values by multiplying the defuzzified matrix and the trend-weighted matrix. On the other hand, the uncertainty analysis module applied interval forecasting based on the deterministic prediction to forecast the uncertainty of pollution concentrations. Two air pollution datasets from two cities in the Jing-Jin-Ji region (China) were used in the experiments and the performance of the forecasting system was assessed with MAPE, MAE, RMSE, median absolute percentage error, DA, fractional bias of forecasting results, index of agreement of forecasting results, Pearson’s correlation coefficient and interval forecasting average width.
A probabilistic intuitionistic fuzzy time series forecasting model using support vector machine to cope with both uncertainty and non-determinism associated with real-world time series was introduced by Pattanayak et al. [46]. In addition, this work also proposed a new trend-based discretization method to determine the UoD and the number of intervals. The FLRs were identified by using the ratio trend variation of crisp observations and the mean of aggregated membership values, which were modelled through a support vector machine. The experiments were carried out over 16 benchmark time series datasets and the performance of the new method was compared to seven FTS models using RMSE, SMAPE and MAE.
Guler and Akkus proposed an FTS based on the fuzzy K-medoid clustering algorithm for the fuzzification step to remove outliers and abnormal observations [47]. The new method was compared to two existing FTS models based on the fuzzy C-means and Gustafson–Kessel [52] clustering algorithms to predict air pollution time series data consisting of weekly SO2 concentrations measured at 65 monitoring stations in Turkey. RMSE and percent bias were used to assess the performance of the forecasting models.
Soto et al. designed a method for multiple time series forecasting using many inputs/many outputs (MIMO) fuzzy aggregation models (FAM) with modular neural networks [48]. In this work, different MIMO-FAM approaches were used: (i) one based on the use of ANFIS with subtractive clustering and fuzzy C-means; (ii) one based on type-1 FIS of Mamdani type; and (iii) one based on interval type-2 FIS. The experiments were carried out over the Mexican stock exchange index, TAIEX and data from the National Association of Securities Dealers Automated Quotation and the performance was evaluated with MAE, RMSE and mean squared error.
From these articles, some comments can be made: (i) most works focused on proposing some kind of hybridisation to improve the performance of the FTS model; (ii) the most practical works corresponded to ad hoc solutions for specific problems, ranging from air pollution data to stock index prices and COVID-19 time series; (iii) the most used benchmark datasets were TAIEX and the University of Alabama enrolment; and (iv) many different metrics were applied to performance assessment.
6. Discussion

An in-depth performance analysis and a comprehensive science mapping allowed us to answer the research questions initially formulated:
RQ1
The two leading journals with research on this topic were Appl Soft Comput and Int J Fuzzy Syst. Nevertheless, a total of 46 journals were identified as sources that address the topic of this study, not only from a methodological perspective but also with real-life applications.
RQ2
The number of papers published per year was less than 26, except in 2020, when a total of 34 articles was published.
RQ3
China was clearly dominant in this field of research, as measured by the number of authors affiliated with institutions of each country.
RQ4
We observed that journals belong to a great variety of research areas, although Computer Science and Mathematics were the research areas with the largest number of publications.
RQ5
The most cited authors were F. G. Guimaraes, H. J. Sadaei and P. Singh, whereas the most prolific author was C. Luo.
RQ6
Four clusters of co-occurrences of words were identified, whose centres were located at the terms “fuzzy time series”, “fuzzy inference”, “fuzzy rules” and “fuzzy logic”.
RQ7
The three articles with the highest number of citations were the works by [39,40,41], which are all focused on the development of hybrid FTS models.
In addition, a co-authorship network has made it possible to see that most works in the sample were produced by inter-institution cooperation, and only a few came from some kind of international collaboration between authors from different countries. On the other hand, a co-word network has shown the main terms used in the articles that constitute the sample of this study.

7. Conclusions

The purpose of this study was to review the literature from 2017 to 2021 in the area of FTS forecasting and modelling. Using the PRISMA methodology and some bibliometric software tools, we reviewed 118 articles published in refereed JCR journals that were identified following a cross-search in the WoS database through a collection of specific inclusion criteria.
It has to be recognized that this study can present some limitations due to the research methodology used, thus producing a limited sample of relevant publications: (i) only the articles indexed by WoS were considered, and therefore, other relevant papers indexed by databases such as Scopus and IEEE Xplore were neglected; (ii) other types of publications such as conference proceedings, technical reports, theses and dissertations could enrich the analysis, but they were not included in the review; (iii) the study was limited to a 5-year coverage; and (iv) citation counts may be affected by several factors (e.g., articles in open access format, the reputation of authors) that have not been taken into account in this study. Although the use of other databases such as Scopus could provide some additional articles not covered by WoS, it has been shown that 99.11% of the journals indexed in WoS are also indexed in Scopus [53]. Therefore, the inclusion of other databases for bibliometric analyses should not lead to outcomes different from those obtained in the present study.
It is expected that this study can help academics and practitioners understand the current state of research on FTS forecasting and modelling, and also acts as a meaningful reference for those who are interested in this research field.

Supplementary Materials

The following supporting information can be downloaded at: https://www.mdpi.com/article/10.3390/app12146894/s1, Table S1: Full references supporting this bibliometric study.

Author Contributions

Conceptualization, V.G.; methodology, V.G. and J.S.S.; software, L.P.; validation, V.G. and J.S.S.; formal analysis, L.P., V.G. and J.S.S.; investigation, L.P.; resources, J.S.S.; data curation, L.P.; writing—original draft preparation, L.P. and V.G.; writing—review and editing, J.S.S.; visualization, L.P. and V.G.; supervision, V.G. and J.S.S.; project administration, J.S.S. All authors have read and agreed to the published version of the manuscript.

Funding

This research received no external funding.

Institutional Review Board Statement

Not applicable for studies not involving humans or animals.

Informed Consent Statement

Not applicable.

Data Availability Statement

The data that support the findings of this study are available from the corresponding author upon reasonable request.

Conflicts of Interest

The authors declare no potential conflict of interest.

Abbreviations

The following abbreviations are used in this manuscript:
FTSFuzzy time series
UoDUniverse of discourse
FLRFuzzy logical relationship
FISFuzzy inference systems
TSKTakagi–Sugeno–Kang
ANFISAdaptive network-based fuzzy inference system
WoSWeb of Science
JCRJournal Citation Reports 2020
APEAbsolute percentage error
MAPEmean absolute percentage error
RMSERoot mean squared error
MdRAEMedian relative absolute error
MAEMean absolute error
TICTheil’s inequality coefficient
DADirection accuracy of forecasting results
TAIEXTaiwan stock exchange index
MADMean absolute difference
SMAPESymmetric mean absolute percentage error
NRMSENormalized root mean square error
MIMOMany-inputs many-outputs
FAMFuzzy aggregation models

References

  1. Parmezan, A.R.S.; Souza, V.M.; Batista, G.E. Evaluation of statistical and machine learning models for time series prediction: Identifying the state-of-the-art and the best conditions for the use of each model. Inf. Sci. 2019, 484, 302–337. [Google Scholar] [CrossRef]
  2. De Gooijer, J.G.; Hyndman, R.J. 25 years of time series forecasting. Int. J. Forecast. 2006, 22, 443–473. [Google Scholar] [CrossRef] [Green Version]
  3. Guo, H.; Pedrycz, W.; Liu, X. Fuzzy time series forecasting based on axiomatic fuzzy set theory. Neural Comput. Appl. 2019, 31, 3921–3932. [Google Scholar] [CrossRef]
  4. Bose, M.; Mali, K. Designing fuzzy time series forecasting models: A survey. Int. J. Approx. Reason. 2019, 111, 78–99. [Google Scholar] [CrossRef]
  5. Song, Q.; Chissom, B.S. Forecasting enrollments with fuzzy time series–Part I. Fuzzy Sets Syst. 1993, 54, 1–9. [Google Scholar] [CrossRef]
  6. Song, Q.; Chissom, B.S. Forecasting enrollments with fuzzy time series–Part II. Fuzzy Sets Syst. 1994, 62, 1–8. [Google Scholar] [CrossRef]
  7. Chen, S.M. Forecasting enrollments based on fuzzy time series. Fuzzy Sets Syst. 1996, 81, 311–319. [Google Scholar] [CrossRef]
  8. Zadeh, L.A. Fuzzy logic. Computer 1988, 21, 83–93. [Google Scholar] [CrossRef]
  9. Mamdani, E.; Assilian, S. An experiment in linguistic synthesis with a fuzzy logic controller. Int. J. Man-Mach. Stud. 1975, 7, 1–13. [Google Scholar] [CrossRef]
  10. Takagi, T.; Sugeno, M. Fuzzy identification of systems and its applications to modeling and control. IEEE Trans. Syst. Man. Cybern. 1985, SMC-15, 116–132. [Google Scholar] [CrossRef]
  11. Jang, J.S. ANFIS: Adaptive-network-based fuzzy inference system. IEEE Trans. Syst. Man, Cybern. 1993, 23, 665–685. [Google Scholar] [CrossRef]
  12. Tak, N. Type-1 possibilistic fuzzy forecasting functions. J. Comput. Appl. Math. 2020, 370, 112653. [Google Scholar] [CrossRef]
  13. Singh, P. High-order fuzzy-neuro-entropy integration-based expert system for time series forecasting. Neural Comput. Appl. 2017, 28, 3851–3868. [Google Scholar] [CrossRef]
  14. Cagcag Yolcu, O.; Alpaslan, F. Prediction of TAIEX based on hybrid fuzzy time series model with single optimization process. Appl. Soft Comput. 2018, 66, 18–33. [Google Scholar] [CrossRef]
  15. Cai, Q.; Zhang, D.; Zheng, W.; Leung, S.C. A new fuzzy time series forecasting model combined with ant colony optimization and auto-regression. Knowl.-Based Syst. 2015, 74, 61–68. [Google Scholar] [CrossRef]
  16. Egrioglu, E.; Aladag, C.H.; Yolcu, U. Fuzzy time series forecasting with a novel hybrid approach combining fuzzy c-means and neural networks. Expert Syst. Appl. 2013, 40, 854–857. [Google Scholar] [CrossRef]
  17. Teoh, H.J.; Cheng, C.H.; Chu, H.H.; Chen, J.S. Fuzzy time series model based on probabilistic approach and rough set rule induction for empirical research in stock markets. Data Knowl. Eng. 2008, 67, 103–117. [Google Scholar] [CrossRef]
  18. Silva, P.C.d.L.e. Scalable Models For Probabilistic Forecasting With Fuzzy Time Series. Master’s Thesis, Machine Intelligence and Data Science Laboratory, Federal University of Minas Gerais, Belo Horizonte, Brazil, 2019. [Google Scholar] [CrossRef]
  19. Singh, P. A brief review of modeling approaches based on fuzzy time series. Int. J. Mach. Learn. Cybern. 2017, 8, 397–420. [Google Scholar] [CrossRef]
  20. Feng, G. A survey on analysis and design of model-based fuzzy control systems. IEEE Trans. Fuzzy Syst. 2006, 14, 676–697. [Google Scholar] [CrossRef] [Green Version]
  21. Ahmed, M.M.; Isa, N.A.M. Knowledge base to fuzzy information granule: A review from the interpretability-accuracy perspective. Appl. Soft Comput. 2017, 54, 121–140. [Google Scholar] [CrossRef] [Green Version]
  22. Zhu, S.; Lu, H.; Ptak, M.; Dai, J.; Ji, Q. Lake water-level fluctuation forecasting using machine learning models: A systematic review. Environ. Sci. Pollut. Res. 2020, 27, 44807–44819. [Google Scholar] [CrossRef] [PubMed]
  23. Han, Z.; Zhao, J.; Leung, H.; Ma, K.F.; Wang, W. A Review of Deep Learning Models for Time Series Prediction. IEEE Sens. J. 2021, 21, 7833–7848. [Google Scholar] [CrossRef]
  24. Felix, G.; Nápoles, G.; Falcon, R.; Froelich, W.; Vanhoof, K.; Bello, R. A review on methods and software for fuzzy cognitive maps. Artif. Intell. Rev. 2019, 52, 1707–1737. [Google Scholar] [CrossRef]
  25. Han, M.; Zhong, K.; Qiu, T.; Han, B. Interval Type-2 Fuzzy Neural Networks for Chaotic Time Series Prediction: A Concise Overview. IEEE Trans. Cybern. 2019, 49, 2720–2731. [Google Scholar] [CrossRef]
  26. Deb, C.; Zhang, F.; Yang, J.; Lee, S.E.; Shah, K.W. A review on time series forecasting techniques for building energy consumption. Renew. Sustain. Energy Rev. 2017, 74, 902–924. [Google Scholar] [CrossRef]
  27. Gürtler, M.; Paulsen, T. Forecasting performance of time series models on electricity spot markets: A quasi-meta-analysis. Int. J. Energy Sect. Manag. 2018, 12, 103–129. [Google Scholar] [CrossRef]
  28. Hajirahimi, Z.; Khashei, M. Hybrid structures in time series modeling and forecasting: A review. Eng. Appl. Artif. Intell. 2019, 86, 83–106. [Google Scholar] [CrossRef]
  29. Ojha, V.; Abraham, A.; Snášel, V. Heuristic design of fuzzy inference systems: A review of three decades of research. Eng. Appl. Artif. Intell. 2019, 85, 845–864. [Google Scholar] [CrossRef] [Green Version]
  30. Hamza, M.F.; Sani Shehu, G.; Umar, M.M.; Ismail, A. Global Research Performance on the Design and Applications of Type-2 Fuzzy Logic Systems: A Bibliometric Analysis. J. Appl. Mater. Technol. 2019, 1, 20–30. [Google Scholar] [CrossRef] [Green Version]
  31. Page, M.J.; McKenzie, J.E.; Bossuyt, P.M.; Boutron, I.; Hoffmann, T.C.; Mulrow, C.D.; Shamseer, L.; Tetzlaff, J.M.; Akl, E.A.; Brennan, S.E.; et al. The PRISMA 2020 statement: An updated guideline for reporting systematic reviews. BMJ 2021, 372, n71. [Google Scholar] [CrossRef]
  32. Donthu, N.; Kumar, S.; Mukherjee, D.; Pandey, N.; Lim, W.M. How to conduct a bibliometric analysis: An overview and guidelines. J. Bus. Res. 2021, 133, 285–296. [Google Scholar] [CrossRef]
  33. Harzing, A.W. Publish or Perish. 2007. Available online: https://harzing.com/resources/publish-or-perish (accessed on 2 May 2022).
  34. Persson, O.; Danell, R.; Schneider, J.W. How to use Bibexcel for various types of bibliometric analysis. In Celebrating Scholarly Communication Studies: A Festschrift for Olle Persson at his 60th Birthday; International Society forScientometrics and Informetrics: Bloomington, IN, USA, 2009; pp. 9–24. [Google Scholar]
  35. Van Eck, N.J.; Waltman, L. Software survey: VOSviewer, a computer program for bibliometric mapping. Scientometrics 2010, 84, 523–538. [Google Scholar] [CrossRef] [PubMed] [Green Version]
  36. Cobo, M.; López-Herrera, A.; Herrera-Viedma, E.; Herrera, F. An approach for detecting, quantifying, and visualizing the evolution of a research field: A practical application to the Fuzzy Sets Theory field. J. Inf. 2011, 5, 146–166. [Google Scholar] [CrossRef]
  37. Eck, N.J.v.; Waltman, L. How to normalize cooccurrence data? An analysis of some well-known similarity measures. J. Am. Soc. Inf. Sci. Technol. 2009, 60, 1635–1651. [Google Scholar] [CrossRef] [Green Version]
  38. Waltman, L.; van Eck, N.J.; Noyons, E.C. A unified approach to mapping and clustering of bibliometric networks. J. Inf. 2010, 4, 629–635. [Google Scholar] [CrossRef] [Green Version]
  39. Sadaei, H.J.; de Lima e Silva, P.C.; Guimarães, F.G.; Lee, M.H. Short-term load forecasting by using a combined method of convolutional neural networks and fuzzy time series. Energy 2019, 175, 365–377. [Google Scholar] [CrossRef]
  40. Jiang, P.; Yang, H.; Heng, J. A hybrid forecasting system based on fuzzy time series and multi-objective optimization for wind speed forecasting. Appl. Energy 2019, 235, 786–801. [Google Scholar] [CrossRef]
  41. Castillo, O.; Melin, P. Forecasting of COVID-19 time series for countries in the world based on a hybrid approach combining the fractal dimension and fuzzy logic. Chaos Solitons Fractals 2020, 140, 110242. [Google Scholar] [CrossRef]
  42. Luo, C.; Tan, C.; Wang, X.; Zheng, Y. An evolving recurrent interval type-2 intuitionistic fuzzy neural network for online learning and time series prediction. Appl. Soft Comput. 2019, 78, 150–163. [Google Scholar] [CrossRef]
  43. Singh, P.; Dhiman, G. A hybrid fuzzy time series forecasting model based on granular computing and bio-inspired optimization approaches. J. Comput. Sci. 2018, 27, 370–385. [Google Scholar] [CrossRef]
  44. Zhang, R.; Ashuri, B.; Deng, Y. A novel method for forecasting time series based on fuzzy logic and visibility graph. Adv. Data Anal. Classif. 2017, 11, 75–783. [Google Scholar] [CrossRef]
  45. Wang, J.; Li, H.; Lu, H. Application of a novel early warning system based on fuzzy time series in urban air quality forecasting in China. Appl. Soft Comput. 2018, 71, 783–799. [Google Scholar] [CrossRef]
  46. Pattanayak, R.M.; Behera, H.; Panigrahi, S. A novel probabilistic intuitionistic fuzzy set based model for high order fuzzy time series forecasting. Eng. Appl. Artif. Intell. 2021, 99, 104136. [Google Scholar] [CrossRef]
  47. Guler Dincer, N.; Akkus, O. A new fuzzy time series model based on robust clustering for forecasting of air pollution. Ecol. Inform. 2018, 43, 157–164. [Google Scholar] [CrossRef]
  48. Soto, J.; Castillo, O.; Melin, P.; Pedrycz, W. A New Approach to Multiple Time Series Prediction Using MIMO Fuzzy Aggregation Models with Modular Neural Networks. Int. J. Fuzzy Syst. 2019, 21, 1629–1648. [Google Scholar] [CrossRef]
  49. Wu, Z.; Huang, N.E. Ensemble empirical mode decomposition: A noise-assisted data analysis method. Adv. Adapt. Data Anal. 2009, 1, 1–41. [Google Scholar] [CrossRef]
  50. Lacasa, L.; Luque, B.; Ballesteros, F.; Luque, J.; Nuño, J.C. From time series to complex networks: The visibility graph. Proc. Natl. Acad. Sci. USA 2008, 105, 4972–4975. [Google Scholar] [CrossRef] [Green Version]
  51. Lü, L.; Zhou, T. Link prediction in complex networks: A survey. Phys. Stat. Mech. Its Appl. 2011, 390, 1150–1170. [Google Scholar] [CrossRef] [Green Version]
  52. Egrioglu, E.; Aladag, C.; Yolcu, U.; Uslu, V.; Erilli, N. Fuzzy time series forecasting method based on Gustafson-Kessel fuzzy clustering. Expert Syst. Appl. 2011, 38, 10355–10357. [Google Scholar] [CrossRef]
  53. Singh, V.; Singh, P.; Karmakar, M.; Leta, J.; Mayr, P. The journal coverage of Web of Science, Scopus and Dimensions: A comparative analysis. Scientometrics 2021, 126, 5113–5142. [Google Scholar] [CrossRef]
Figure 1. A taxonomy of FTS models [18].
Applsci 12 06894 g001
Figure 2. Flowchart of the research protocol.
Applsci 12 06894 g002
Figure 3. Year-wise distribution of publications.
Applsci 12 06894 g003
Figure 4. Global geographic distribution of publications based on the country of authors.
Applsci 12 06894 g004
Figure 5. Distribution of papers at country level.
Applsci 12 06894 g005
Figure 6. Co-authorship network.
Applsci 12 06894 g006
Figure 7. Co-word network.
Applsci 12 06894 g007
Table 1. Basic metrics for performance analysis.
MetricValue
Publication-related metrics
    Total publications118
    Number of contributing authors259
    Sole-authored publications8
    Co-authored publications110
    Productivity per year23.6
    Number of journals46
    Number of countries32
Citation-related metrics
    Total citations1701
    Average citations per paper14.42
    Average citations per year340.20
    Average citations per journal36.98
Citation-and-publication-related metrics
    Collaboration index2.19
    Collaboration coefficient0.54
    Number of cited publications105
    Proportion of cited publications0.89
    Citations per cited publication16.20
    h-index23
    g-index35
    Papers with ACC ≥ 1, 2, 5, 10, 20101, 79, 40, 15, 3
Table 2. Analysis of the top 20 journals.
JournalPapers% PapersCit Av.Cit
Applied Soft Computing1311.8022916.36
Int. Journal of Fuzzy Systems97.6311212.44
Int. Journal of Approximate Reasoning32.5410535.00
Applied Energy21.699447.00
Energy21.698743.50
Granular Computing65.088714.50
IEEE Trans. on Fuzzy Systems65.087913.17
Neurocomputing32.546923.00
Information Sciences54.245611.20
Knowledge-Based Systems43.395513.75
Expert Systems with Applications21.695125.50
Soft Computing65.08477.83
Engineering Applications of Artificial Intelligence54.24469.20
Energies21.694422.00
Neural Computing and Applications32.544414.67
Applied Sciences-Basel21.694221.00
Int. Journal Machine Learning and Cybernetics21.693919.50
Journal of Intelligent & Fuzzy Systems54.24367.20
Applied Intelligence21.693115.50
IEEE Access43.39174.25
Citations (as of March 2022).
Table 3. Number of papers, percentage of papers over the total, number of citations, mean of citations and standard deviation.
YearPapers% PapersCitationsMeanStd. Dev.
20171719.4945126.5320.655
20181815.2546325.7218.770
20192622.0346018.4020.537
20203428.812719.038.716
20212319.49602.403.189
Table 4. Summary of the main research areas.
Research AreaCount%
Computer Science10790.68
Mathematics8168.64
Automation & Control Systems5950.00
Robotics4941.53
Engineering3731.36
Business & Economics2218.64
Energy & Fuels1210.17
Telecommunications108.48
Environmental Sciences & Ecology54.24
Computational Biology54.24
Physics54.24
Chemistry43.39
Geography32.54
Materials Science32.54
Meteorology and Atmospheric Sciences32.54
Operations Research and Management32.54
Table 5. Number of citations (Cit) and articles published by the top 10 most cited authors.
AuthorCit%Papers%h-Index
Guimaraes, F. G.1599.3543.3925
Sadaei, H. J.1538.9932.5412
Singh, P.1398.1743.3913
Lee, M. H.1337.8221.6934
Melin, P.1176.8832.5462
Castillo, O.1176.8832.5462
Yang, H.1166.8243.3910
de Lima Silva, P. C.1146.7043.397
Luo, C.1126.5886.7817
Jiang, P.1066.2343.3919
Table 6. List of the most influential articles.
ArticleCitations W ( i ) AuthorsResearch Area
[39]8026.674Thermodynamics; Energy and Fuels
[40]7324.333Energy and Fuels; Engineering
[41]4623.002Mathematics; Physics
[42]5117.004Computer Science
[43]6616.502Computer Science
[44]7815.603Mathematics
[45]5413.503Computer Science
[46]1212.003Automation and Control Systems; Computer Science; Engineering
[47]4411.002Environmental Sciences, Ecology
[48]3210.674Automation & Control Systems; Computer Science
Publisher’s Note: MDPI stays neutral with regard to jurisdictional claims in published maps and institutional affiliations.