1. Introduction
The word “Accessibility” indicates the quality of being easy to reach, enter or use. In discussions of the health care systems, it specifies a multidimensional concept which includes the meanings of affordability, acceptability, availability and spatial accessibility [
1]. It is closely related to our daily life and work, and research on it has continued for a long time [
2]. The accessibility of medical services is an important measure of the equity of medical care for the population, which guarantees the rights and interests of citizens. At the same time, it helps to optimize the allocation of medical resources, promotes the equitable development of medical services, and improves the overall level of medical services. Often, it is used to identify lower (or higher) access rates from some areas to others, such as in public policies for planning and providing services [
3,
4].
Since health care is one of the most basic necessities needed to maintain a civilized society and a normal quality of life [
5], experts have studied methods for measuring the geographical accessibility of the services and facilities in residential areas, typically such as health care services [
5,
6,
7,
8,
9,
10]. The accessibility of health facility services has been divided into two categories: explicit accessibility, which focuses on the actual use of health services, and potential accessibility [
11,
12], which emphasizes the total supply of available health resources. The geographical accessibility of urban resources has received increasing attention in urban health research, reflecting the ease with which residents of a given area can reach services and facilities [
13]. Various methods to measure accessibility have been proposed, such as location-based and population-based methods [
14,
15], space-based and time-based methods [
16,
17]. All these methods can be used to study the accessibility of healthcare facility services.
The two-step floating catchment area (2SFCA) approach is gaining prominence, especially for measuring the accessibility of basic health services [
18,
19]. Travel impedance (distance or time), gravity models, and supply-to-population ratios have been introduced for the construction of 2SFCA [
20,
21,
22,
23,
24]. D. Dai introduced the Gaussian distance decay function into 2SFCA [
25] and proposed the Gaussian two-step floating catchment area (Ga2SFCA) method, which further considers that the supply capacity of the supply site decreases with increasing distance. The distance decay is also optimized by applying different weights to different travel time periods, which in turn improves the 2SFCA [
26], known as the enhanced two-step floating catchment area (E2SFCA), and solves the uniform access problem within the catchment. Based on this, the three-step floating catchment Area (3SFCA) was proposed, where the ratio of the spatial access index (SPAI, sum of the ratio of physician-to-population in the corresponding service sites) of a single census tract to the average SPAI of all census tracts was calculated to overcome the uncertainty problem of the E2SFCA approach [
27,
28]. To moderate the over- or underestimation of the residents’ demands, a new approach was proposed to adjust the residents’ demands for health care services by a selection probability based on the Huff model that reflects the effects of distance cost and service capacity and retains continuous distance weights [
28]. More granular data, such as demographic data and real-time traffic data, have been used in accessibility studies [
29,
30,
31], and the use of these data can effectively improve the analysis results.
These previous methods have not taken into account the uncertainty of actual travel time and residents’ habits in choosing hospitals to visit, which often lead to overly idealized analysis results that are far from the actual feelings of the residents. To address these challenges, this paper proposes a method for analyzing the accessibility of medical facility services based on time cost and distance cost preferences, which combines Gaussian decay and the 2SFCA method to replace theoretical travel time with actual travel time, which can reflect the actual accessibility of medical facility services more realistically and is more in line with residents’ subjective feelings.
2. Method
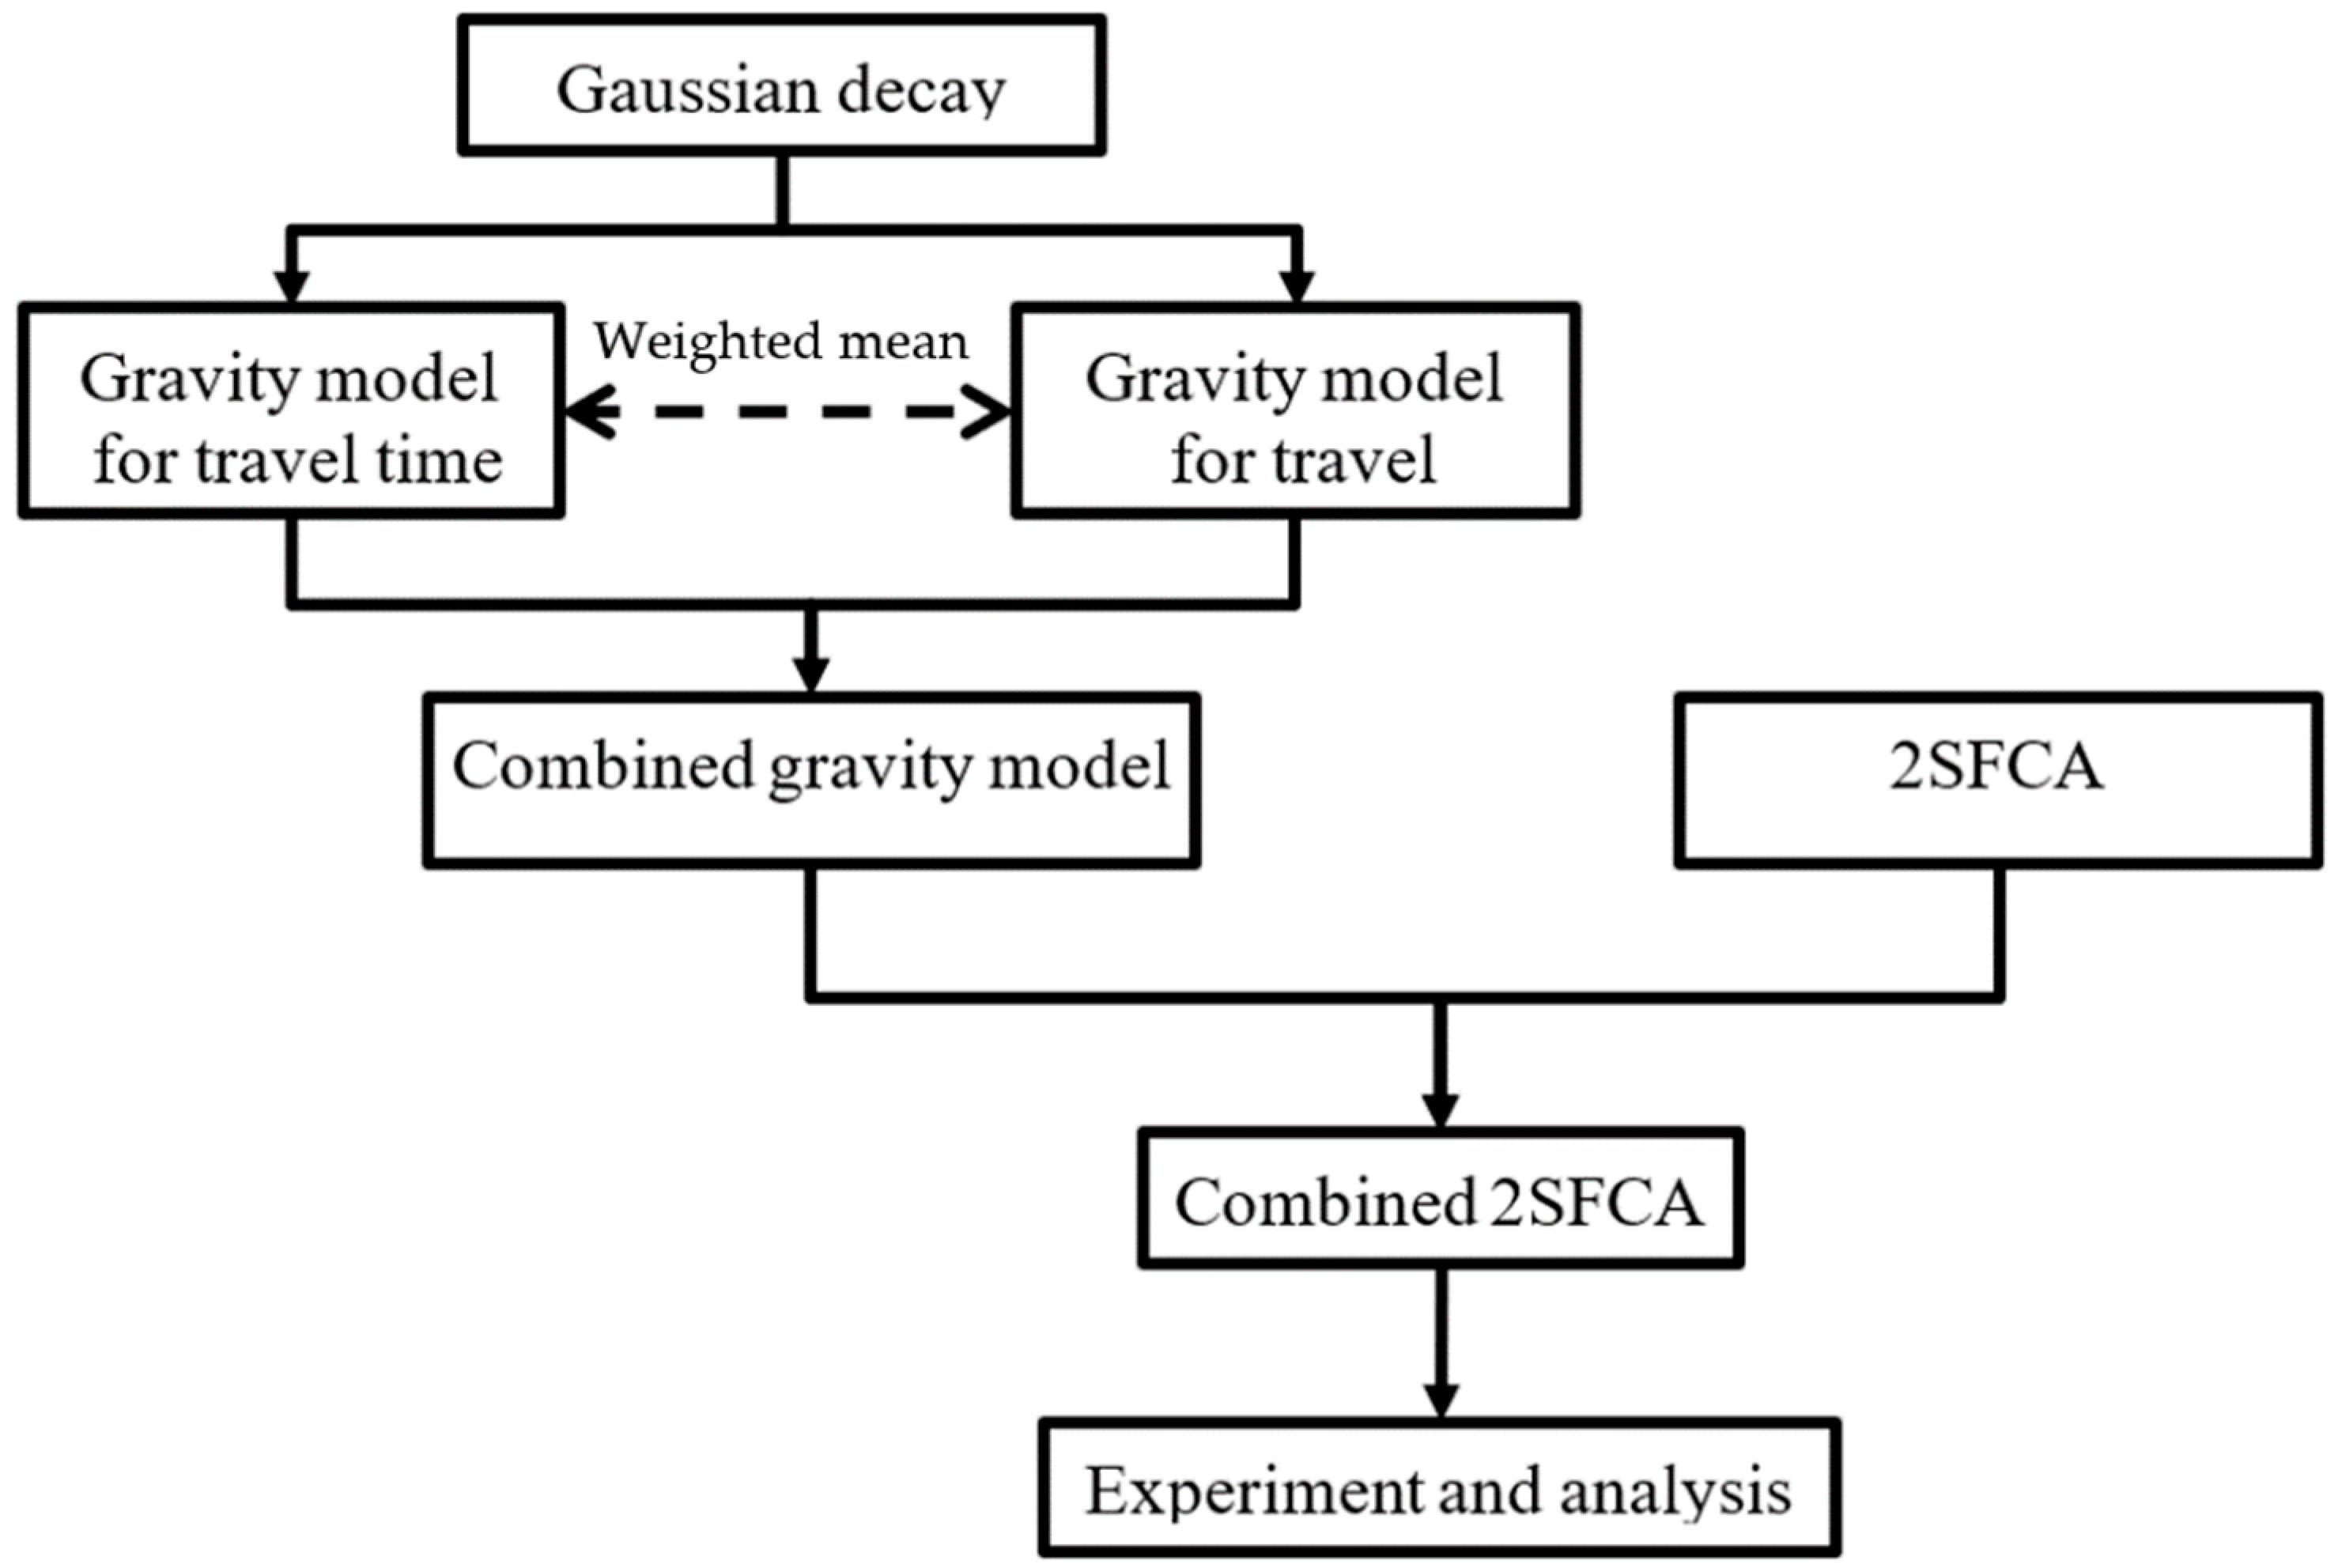
This study is an extension of the 2SFCA method. First, the gravitational models of travel time and travel distance are constructed separately using the Gaussian decay model. Then, gravity models of travel time and travel distance are combined into a weighted mean to construct a combined gravity model, and the new combined 2SFCA is implemented. Finally, it is verified and analyzed by specific experiments.
Figure 1 shows the flow chart of this study.
2.1. SFCA Method
Compared with accessibility calculation methods based on spatial location such as network analysis method and shortest distance method, the 2SFCA method considers the influence of both supply and demand, and its advantages of being easy to understand and convenient to calculate are very obvious, so it is widely used for accessibility calculation in urban geography research. It is a basic accessibility analysis and assessment method. On this basis, the accessibility analysis methods such as Ga2SFCA, E2SFCA and 3SFCA have been gradually evolved to make the accessibility analysis results more accurate by conducting a more in-depth analysis of the spatial distribution patterns of accessibility, different application scenarios and other factors. However, these methods rarely take into account human behavior.
In theory, to accurately calculate the accessibility of a hospital, one needs to use basic data such as the resident population, health status, medical staff, and the number of beds in the hospital. However, these data are often difficult to obtain. Therefore, there is an urgent need to make full use of the various data resources that are easily available and to improve existing analysis and assessment methods in order to facilitate a more realistic reflection of the real world.
2.2. Combined 2SFCA Method
Isochronous and isometric circles centered at a certain point will not overlap due to the uneven spatial distribution of hospitals and residential areas and the inconsistent traffic conditions in each region. In this way, different residents will choose to visit specific hospitals based on the already formed preferences of distance priority or time priority, and eventually the actual accessibility of medical facility services in the real world. For example, with equal travel time, some residents will prefer the hospital with the closest spatial distance, which will result in more people choosing hospitals near their residence for medical care, thus causing the spatial accessibility of the area to deteriorate. Conversely, temporal accessibility will also deteriorate. This result is easily perceived by the local residents.
We know that real-life residents’ choice of hospitals for medical care is not uniform but highly subjective, especially when there are multiple hospitals around their place of residence and not too far away. However, the calculation results of existing methods are mostly ideal solutions based on simple influencing factors, such as only considering time or distance, without considering the impact of residents’ subjective choices on the accessibility of medical facilities.
This study proposes a new accessibility analysis method based on the two-step floating search method with the addition of subjective behavioral factors of residents’ choice of medical care, making full use of increasingly accurate distances and travel times. In the new method, both travel time and distance are taken into account, and the weights of both are determined according to the residents’ health care habits, such as transportation distance priority or time priority.
2.2.1. Gravity Model for Travel Time and Distance
Based on a previous gravity model [
25], two gravity models
Gijt and
Gijs for travel time and travel distance were built, as shown in Equations (1) and (2).
where
dijs and
dijt are the traffic distance and travel time from demand point
I to supply point
j, respectively,
ds and
dt are the distance threshold and time threshold.
ds and
dt are closely related and comparable, where
ds is the mileage travelled at the average traffic speed in
dt time. The actual urban road conditions are complex and the average traffic speed tends to be different for each road. However, because the distance threshold for Gaussian decay must be uniform, it can be expressed as the total distance travelled at the average traffic speed of the whole study area in a certain time (see penultimate paragraph of
Section 3.2.3).
On the other hand, long distance often means more uncertainty and more energy consumption. Because uncertainty in transportation is universal, there is no standard answer to time priority or distance priority, it just varies from person to person. In addition, the two options may lead to completely different choices, which is common in the real world. This uncertainty cannot be ignored since the different choices will eventually change the accessibility calculation. Therefore, this study unifies the travel time factor and the distance factor by restricting the sum of the two weights to be equal to 1.0, thus addressing the uncertainty of traffic conditions and residents’ perceptions of hospitals in the accessibility calculation to some extent. The new cost decay function Gij is used for the calculation of the supply–demand ratio and accessibility results.
Since refined assessment is necessary for refined urban planning and management, explicit accessibility and potential accessibility are equally important. The former reflects the actual perception of residents, while the latter represents the theoretical value of accessibility. By estimating the weights Wt and Ws, the actual medical habits can be simulated to a certain extent. Although each person’s medical habits are different, once formed, they generally do not change over a long period of time. To quantify such choice habits, this study was analyzed in the form of a questionnaire that included collecting information on residents’ residential addresses, frequently visited hospitals, and tolerable time. Then, based on the results of each survey, the distance and time of residents’ travel to the hospital were calculated and compared with other hospitals in the neighborhood to determine whether residents prioritize time or distance for medical care. The proportion of the number of residents who chose time priority and the proportion of the number of residents who chose distance priority were used to determine the values of Wt and Ws.
2.2.2. Combined Gravity Model
In order to consider both time and distance,
Gijt and
Gijs were combined according to respective weights to obtain comprehensive cost attenuation function
Gij, as shown in Equation (3):
where
Wt and
Ws are the weights of traffic time Gaussian decay and traffic distance Gaussian decay, respectively, which can be analyzed and calculated by means of a questionnaire and
Wt +
Ws = 1. When
Wt approaches 0,
Gij degenerates to traffic time Gaussian decay and the final accessibility analysis changes to consider only the traffic time factor. Conversely, it becomes an accessibility analysis considering only traffic distance.
2.2.3. Accessibility Analysis
First, the supply-to-demand ratio
Rj is calculated for each supply point j for all demand points within a certain service area, as shown in Equation (4).
where
Sj is the amount of supply (beds) that can be provided by supply point
j, and
Pi the demand (population) quantity for demand point
i.
Second, the accessibility
Ai of each demand point
i is calculated by aggregating the supply-to-demand ratio of all supply points within the service area, as shown in Equation (5).
3. Case Study and Analysis
The specific research of this paper includes the following three steps. Firstly, we complete the collection and pre-processing of basic data. Secondly, we calculate the reachability before and after the improvement of the two methods. Finally, we compare and analyze the differences between the calculation results of the two methods, and conduct accuracy analysis and evaluation.
3.1. Study Area
In this paper, Wuhan is designated as the study area. As the capital city of Hubei Province and a mega-city in central China, Wuhan is located in the eastern part of the Jianghan Plain. The Yangtze and Han rivers run through the city and meet here. It divides the central city into three parts: Hankou, Hanyang and Wuchang. In this paper, five central urban areas, including Wuchang, Jianghan, Jiang’an, Hanyang and Qiaokou districts, were selected as the study area, consisting of 66 streets (757 communities) with an area of 339.90 km2 and a resident population of 4.21 million.
3.2. Data Collecting and Pre-Processing
The data used in this paper mainly include vector map data, questionnaire data, statistical data and predicted navigation data.
3.2.1. Vector Map Data
Vector map data are the basic spatial data for this study, and they are obtained in many ways. Among them, water bodies, road networks and community neighborhood data were downloaded from the Geospatial Data Cloud [
32]. The hospital locations were obtained by calling the API of Amap service. Vector map data were used as input parameters to obtain the time cost and distance cost required for the accessibility analysis through the Amap path planning API, as well as for visualization and analysis of the experimental results.
Firstly, water body, road network and community block data were downloaded from geospatial data cloud, and hospital’s location was obtained by calling the API of Amap service. Secondly, coordinate systems of these data were uniformly converted to geographic coordinates. Finally, center points of communities were extracted and used together with the hospital points as two input parameters of navigation prediction.
Water body and road network were used to carry out the auxiliary analysis of later results, and other data were directly used for analysis and calculation.
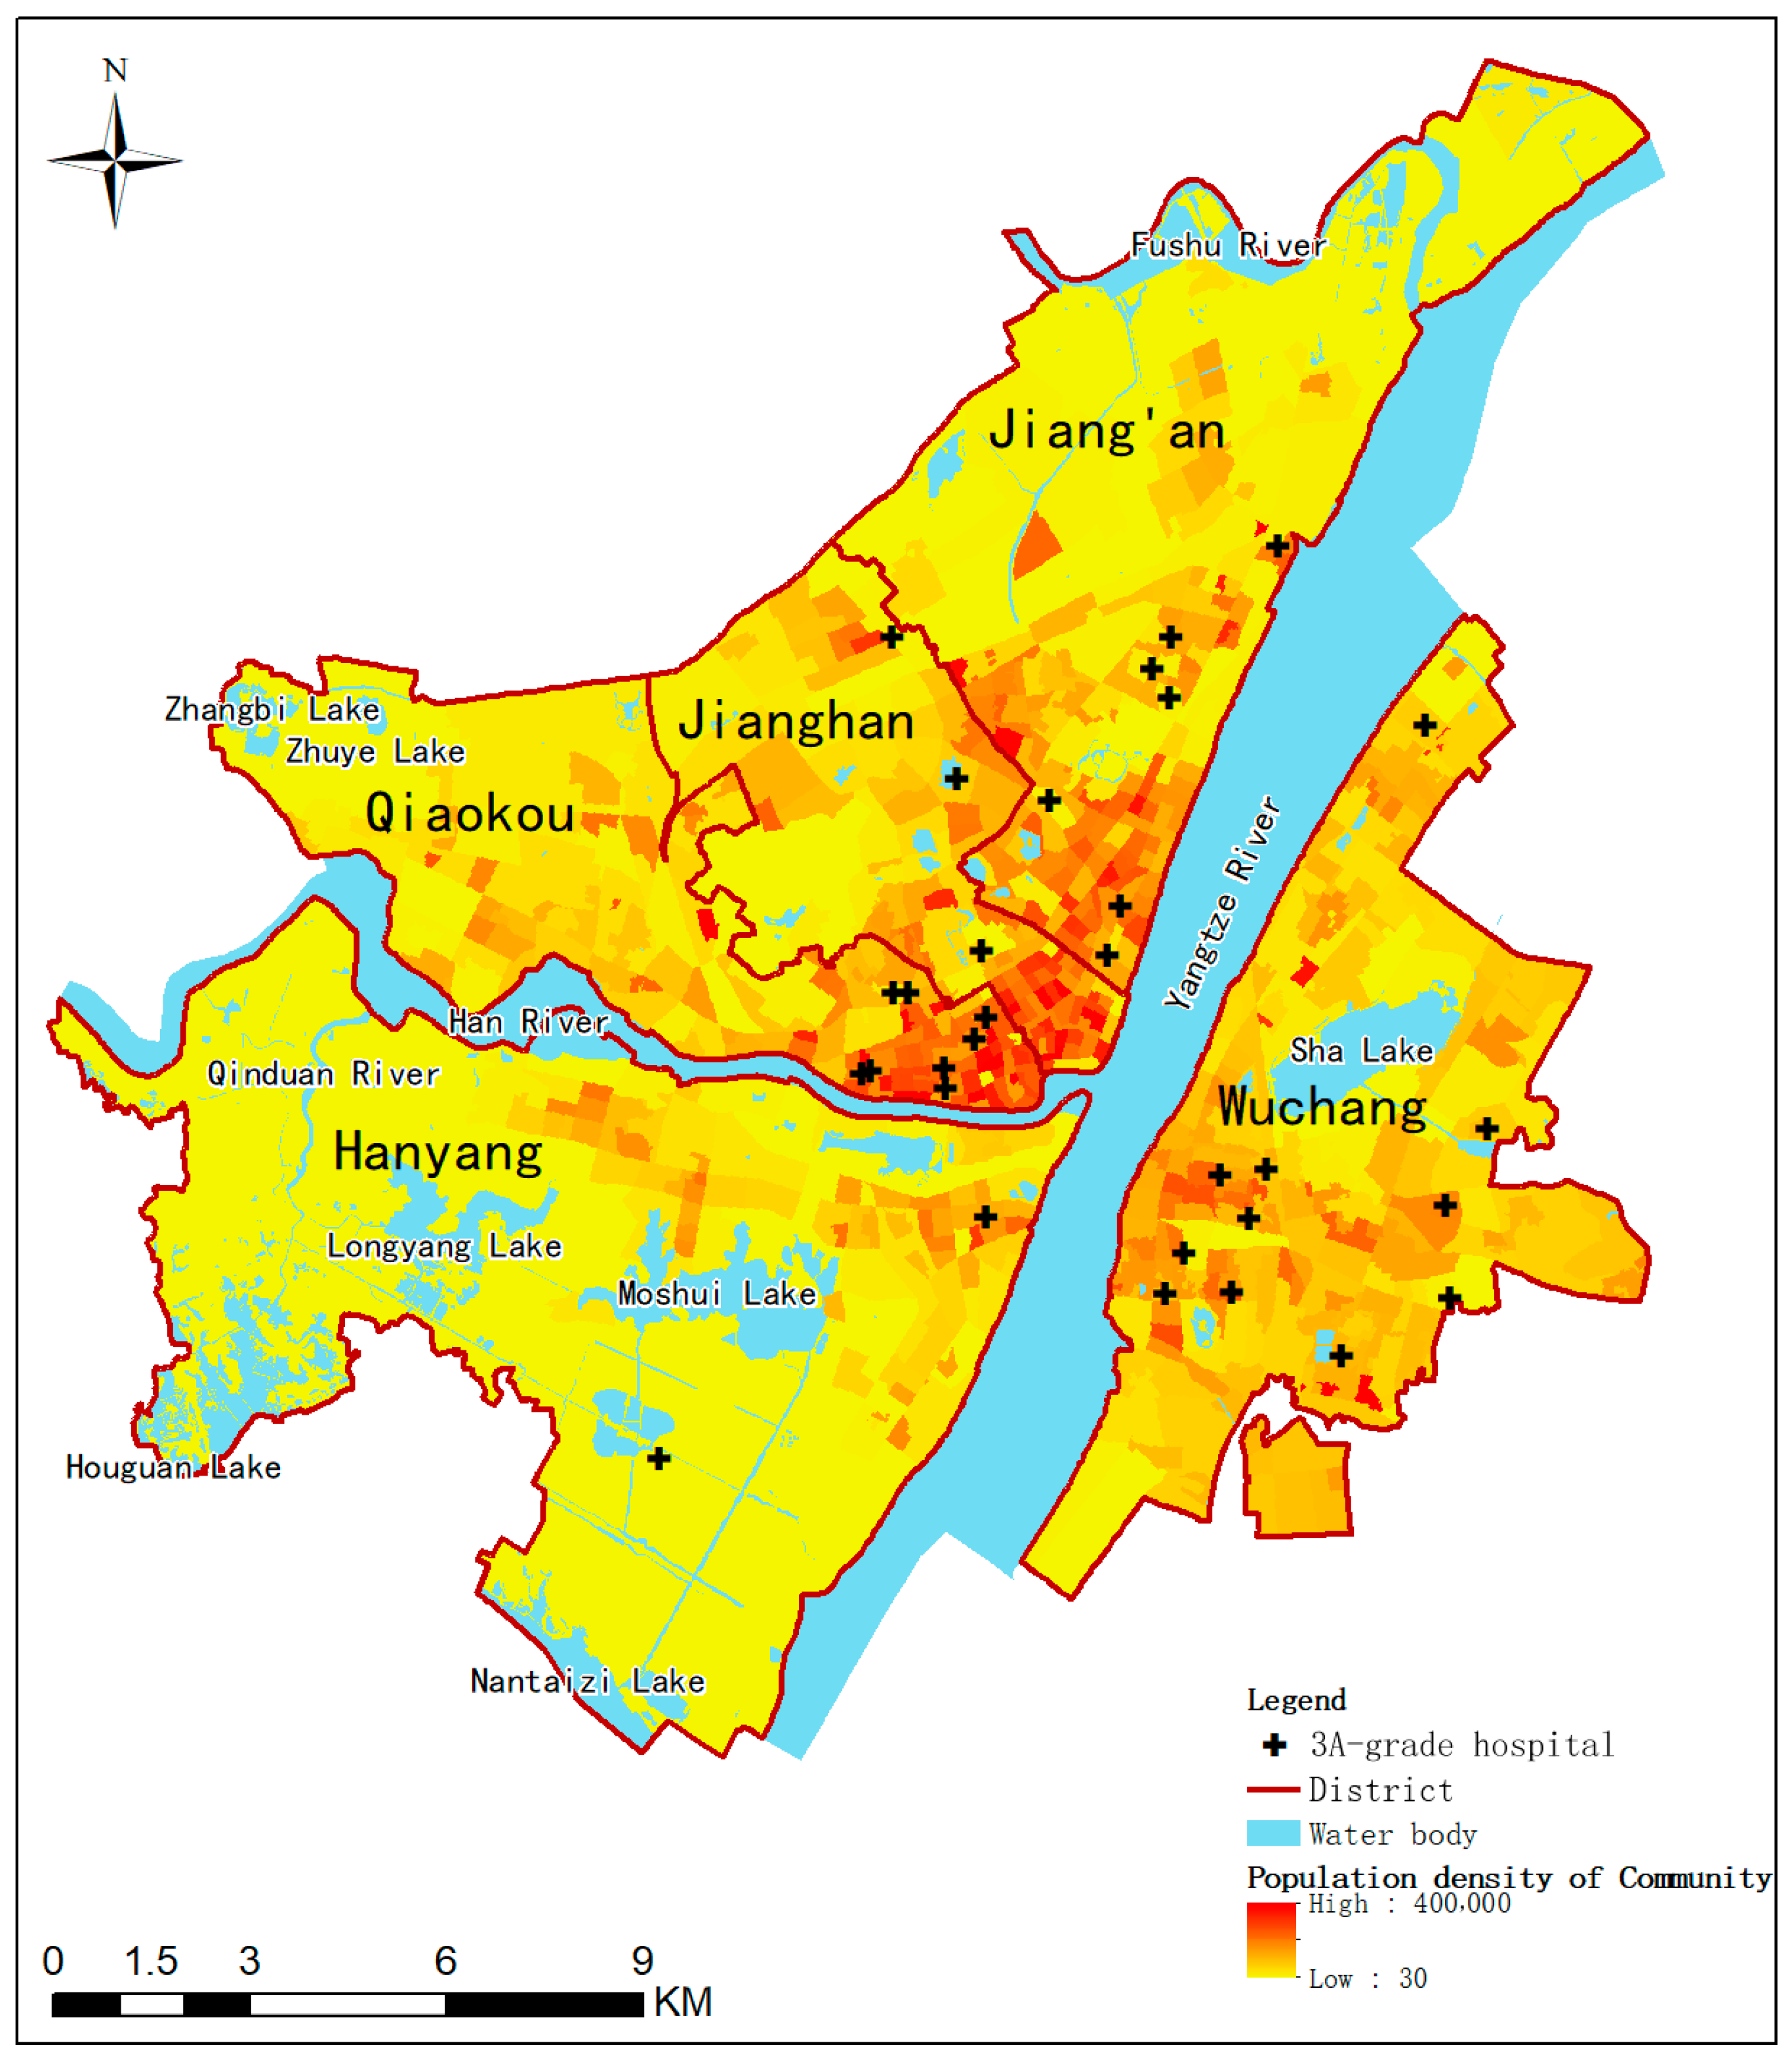
Figure 2 shows the spatial distribution of the district, community, population density and 3A-grade hospitals (3AH) of the study area. The 3AHs are the highest level of hospital in China, and they excel in healthcare services and management, quality and safety of care, and technical proficiency and efficiency. The density of population and 3AHs near the intersection of the Yangtze River and Han River are the highest, especially in Qiaokou, Jianghan and Jiang’an district.
3.2.2. Questionnaire Data
To quantify residents’ healthcare choice habits, a questionnaire form was designed for this study, including residents’ residential addresses, frequently visited hospital and tolerable travel time. A total of 98 valid online questionnaires were received, and whether the frequently visited hospital was the distance closest or the least time-consuming was analyzed. If one healthcare choice was the closest distance but not the least time-consuming, then the residents’ healthcare choice habit was considered to be distance-priority. Otherwise, the residents’ healthcare choice habit was considered to be time-priority. Finally, based on the ratio of the two types, a distance weight of 0.315 and a time weight of 0.685 were calculated.
3.2.3. Statistical Data
In this paper, two types of statistics were used: population data and statistics of the 3AHs, which were used to perform the accessibility calculation with population as the weight. The former was extracted from the 2016 census data of Wuhan, and the latter was collected from 99 Health [
33]. The total population of the entire study area is 4,398,894 inhabitants and there are 58,910 beds in 26 3AHs.
The demographic information of the community is associated with the community point, and the information of the number of hospital beds is associated with the hospital point, both by name. In this way, both the community and the hospital have both spatial location information and attribute information for the later calculation of the supply/demand ratio.
3.2.4. Predicted Navigation Data
Amap (also known as Gaode Maps) is a leading provider of digital map content, navigation and location-based solutions in China. It is known for its accuracy and good route suggestions. According to the Amap technology annual in 2020 [
34], Amap proposes a hybrid spatiotemporal map convolutional network and implements intelligent algorithms that can infer future road conditions, resulting in a 15% reduction in severe deviations. Amap is a high quality source of basic data for accessibility analysis.
When it is difficult to obtain large-scale, long-term real travel times, it is essential to use more and more accurate navigation prediction times for accessibility analysis. The predicted navigation data is obtained by calling the Amap path planning API in real time, which includes the actual distance and predicted travel time from each neighborhood to each hospital at each moment.
Travel time is one of the main factors that influence people’s daily choice of medical care, and it will indirectly affect the actual accessibility of medical facility services. In order to use more accurate travel time to analyze the actual accessibility of medical facilities, this paper obtained the predicted travel time from each community to each hospital at different time periods through Amap, which was used as the input information of the distance decay function.
First, the API of Amap was called every two hours starting from 0:00 every day to obtain the real-time traffic data from the community to the hospital. The data, including traffic time and traffic distance, were obtained continuously for 30 days from September 1 to 30 September 2021, with a total of 7,552,440 records.
Next, the traffic distance and traffic time were summarized, while the shortest traffic distance was extracted and the average of the traffic time at each moment (0, 2, 4, 6, …, 22) in the 30 days was calculated. The total traffic distance was divided by the total traffic time to get the average speed, which was determined as 40 km/h in this paper.
Third, the average tolerable time was calculated using the questionnaire results and used as a reference to determine the time threshold dt. In this study, the average tolerable traffic time was calculated as 15 min. The tolerable traffic time and the average speed were multiplied to obtain the distance threshold ds, which was 10 km in this study.
3.3. Services Accessibility Calculation
First, the traditional Ga2SFCA method was used to calculate the accessibility of 3AH services for each community using
dt as the input parameter, and the calculation results were stored as an attribute of each community. The population of the study area is much larger than the number of beds, resulting in a small bed supply-to-demand ratio, for example,
for the whole study area, so the final calculated accessibility was also small. Since the calculated values of accessibility were very small, all calculated values were uniformly multiplied by 1000 in this paper, which was convenient for future analysis, as shown in
Figure 3a.
Secondly, community polygons were transformed into points located within the corresponding polygons, and the attribute terms of the communities were retained.
Finally, the kriging interpolation algorithm [
35] was used to convert the discrete points into continuous trend surfaces. The coordinates of community points were used as location information, and the corresponding community accessibility was used as an input parameter for spatial interpolation. The interpolation cell size was 100 m, which allowed for fine analysis results. The calculation results were classified into 8 levels according to the natural breakpoint method, as shown in
Figure 3b.
In the real world, it is common for different communities to cover different sized areas. For example, in general, the further away from the city center, the larger the area covered by the community. In terms of spatial distribution, any two points within a small community are closer, so internal accessibility is less affected by distance. In addition, its accessibility is finer than that of a large community because no other processing is required, and the calculation results are used directly for visualization, which is more realistic. However, this method ignores the influence of distance and is not suitable for situations with large differences in the area of basic units. For example, for a large community, it is not accurate to use only one value to represent the accessibility of the whole area. Because the distances to the hospital in the central and peripheral areas often differ greatly, their accessibility is definitely not the same. Specifically, as in the yellow community at the bottom of
Figure 3a, there is one hospital in a large community, but this calculation with the community as the basic unit uses only one value to represent the accessibility of the whole community. The results of this large homogeneous accessibility calculation that ignores the effect of distance can easily lead to spatial misunderstandings that can influence government decisions.
The result of spatial interpolation of the data in (a) is shown in
Figure 3b. It can be seen that, firstly, the spatial distribution patterns of both are basically the same. Then, as shown in (b), the interpolated results retain the spatial distribution characteristics of accessibility of small communities. Meanwhile, the accessibility of large communities achieves refinement by distance, which is more in line with the public perception.
To overcome the shortcomings of direct calculation with communities as the basic unit, later studies in this paper consider the effect of distance and reprocess the accessibility calculation results by spatial interpolation to ensure that the continuous accessibility varies more finely with distance.
The improved method follows similar steps to complete the calculation, which use ds and dt as the input parameters.
3.4. Results
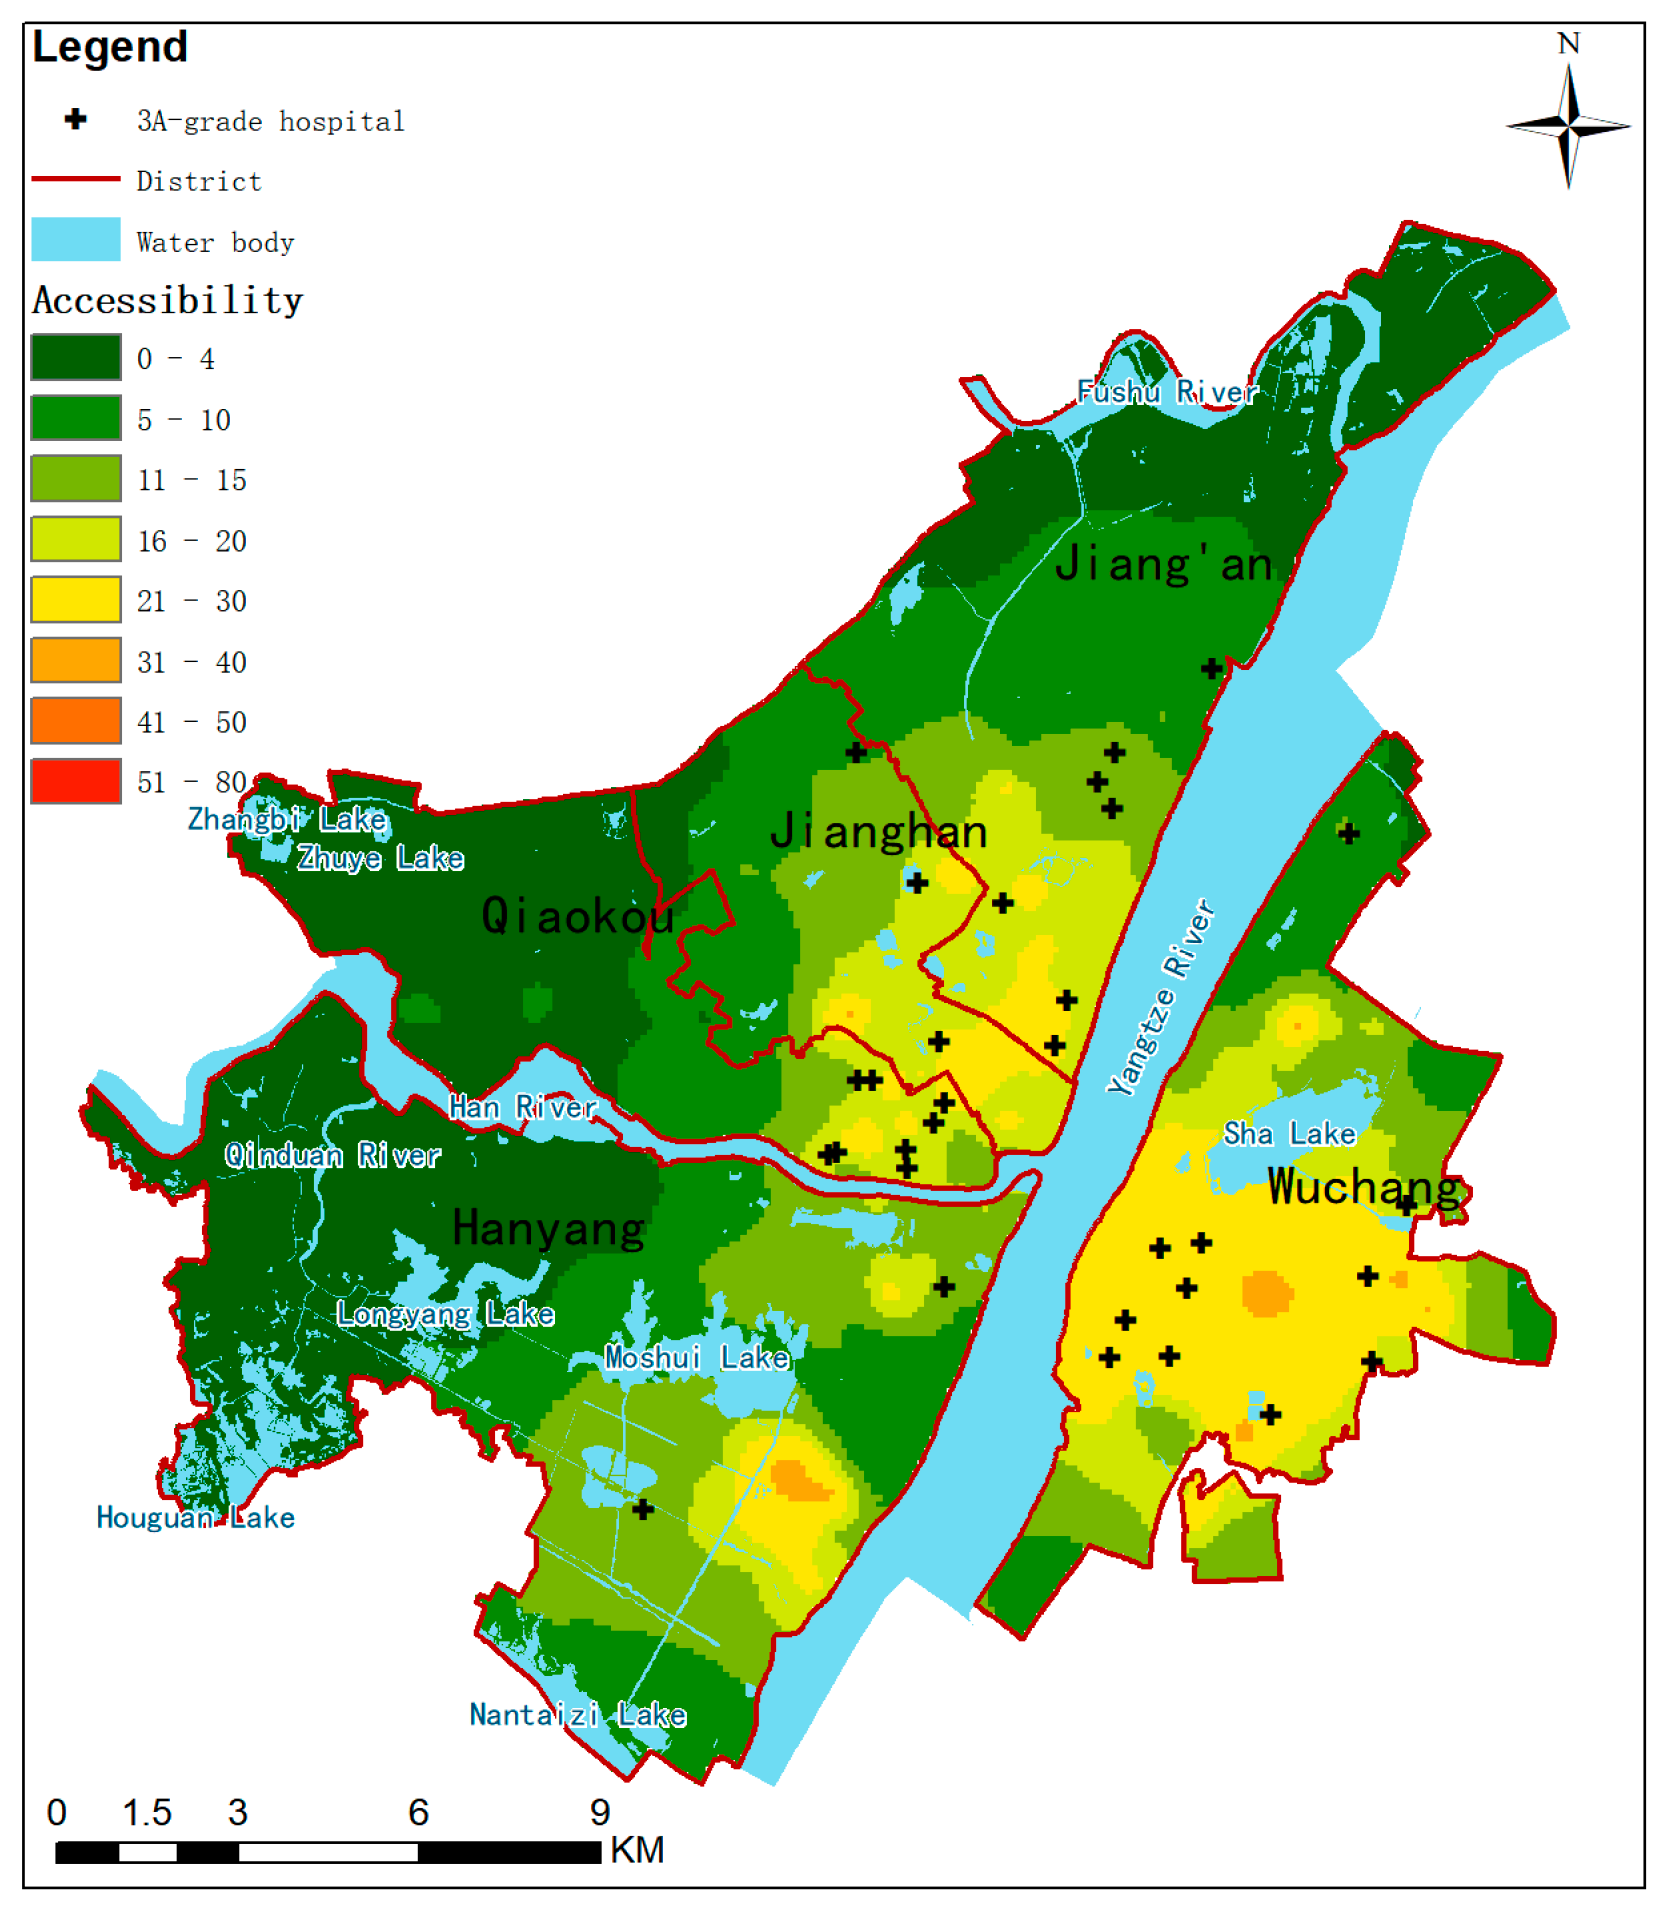
Based on the average speed (40 km/h) and tolerable time (15 min), the corresponding traffic distance can be calculated, which is 10 km. Using it as a threshold, accessibility is calculated by travel time as shown in
Figure 4. Due to the relatively low variability of urban roads, the minimum traffic distance between two points is essentially fixed in most urban areas.
Considering that the accessibility based on distance does not vary with time in the short term, the before improved method in the paper refers to the accessibility calculation based on travel time.
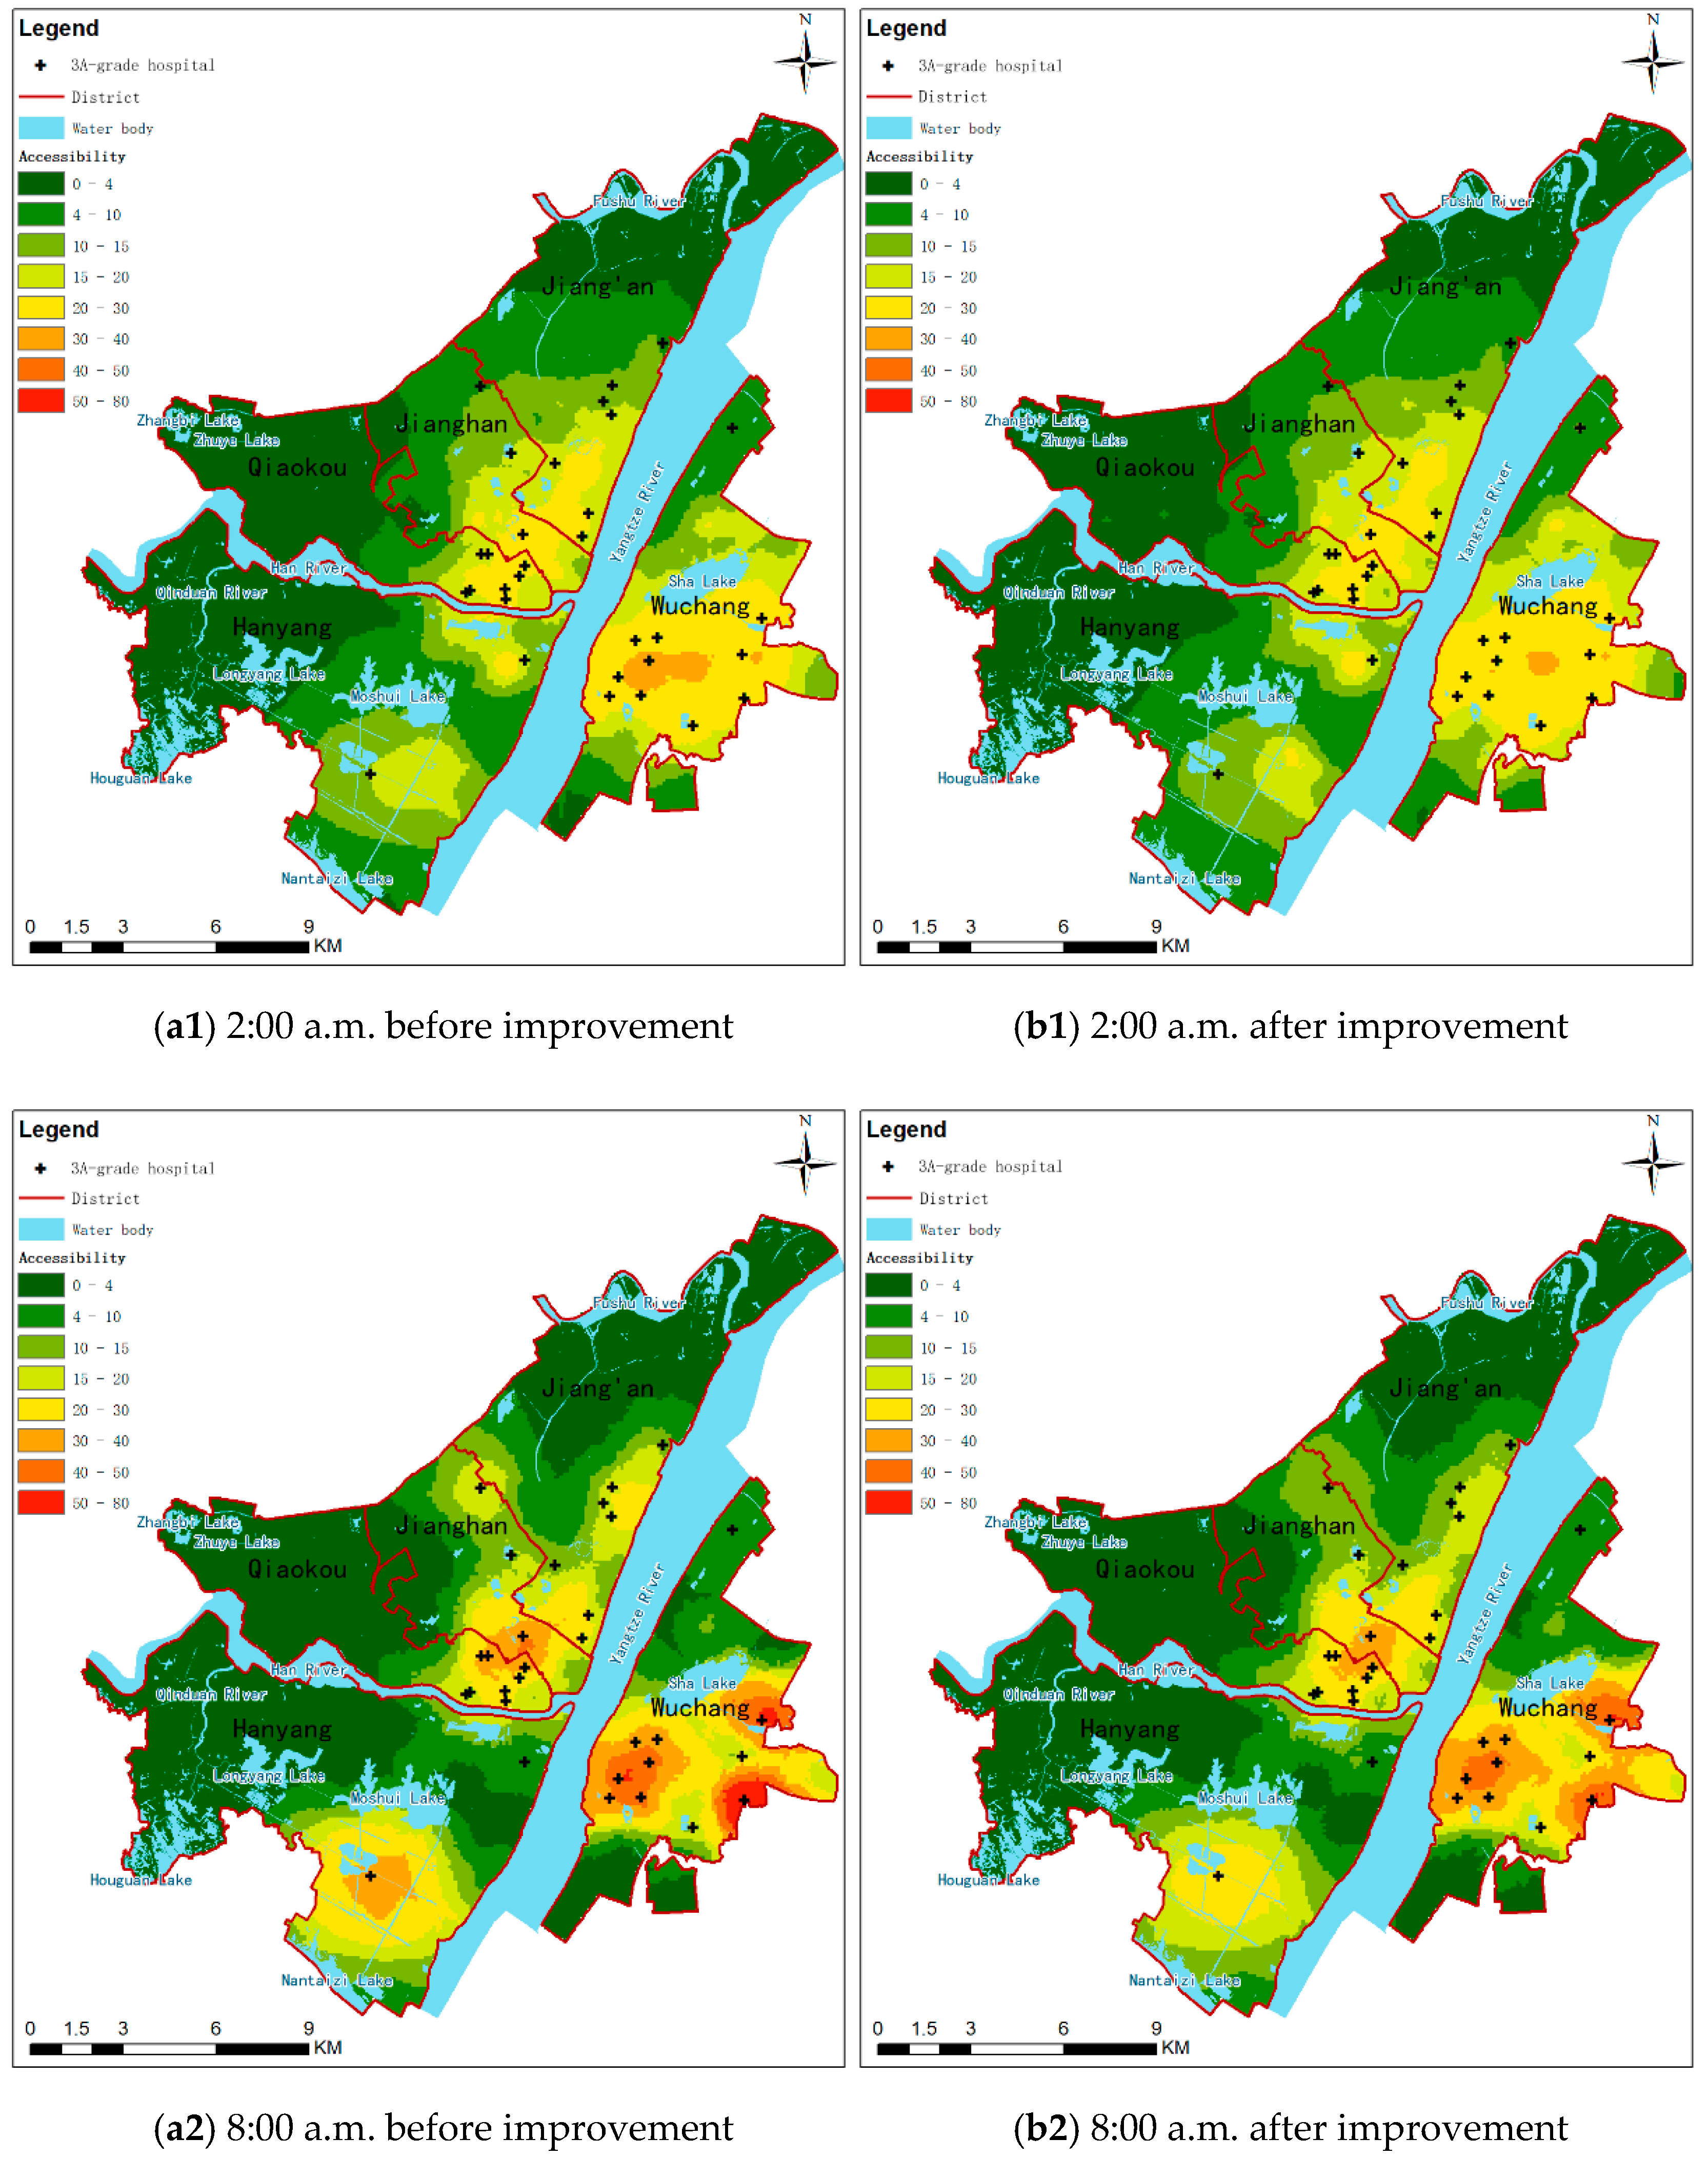
Comparing the calculation results of the two methods, the accessibility of medical facility services in the areas near the confluence of the two rivers is better at all four moments of the day, with some areas in the Wuchang District being the best. Meanwhile, the accessibility of areas near hospitals is also better. As the distance increases, the accessibility decreases accordingly. Overall, on the one hand, the temporal and spatial distribution patterns of accessibility before and after improvement are roughly the same. On the other hand, the local changes were also very obvious. This is mainly reflected in the narrowing of the accessibility gap between different areas, the significant reduction of high accessibility areas, the decrease of accessibility in areas around hospitals, and the increase in accessibility in areas between multiple hospitals. For example, as shown in
Figure 5, in the eastern part of Wuchang, the accessibility at 8:00 a.m. decreased from 50–90 (a2) to 40–50 (b2) after improvement, which also made the spatial variation of accessibility at each moment smoother.
4. Discussions
The results of the accessibility calculation based on traffic distance are shown in
Figure 4. This result was relatively similar to the accessibility results at 2:00 a.m. based on traffic times, shown as
Figure 5(a1). Since there are few vehicles on the road and traffic is smooth at 2:00 a.m., the predicted travel path is essentially the shortest path. However, the travel time for the same distance varies from region to region due to different speed limits on different levels of roads. Therefore, the two accessibilities calculated from time and distance are not exactly the same.
As can be seen in
Section 3.4, there is a significant difference between the calculated results of the two methods before and after the improvement. This difference is spatially heterogeneous. At the same time, the research in this paper also has shortcomings that need further in-depth study in the future.
4.1. Accessibility Variation between Two Methods
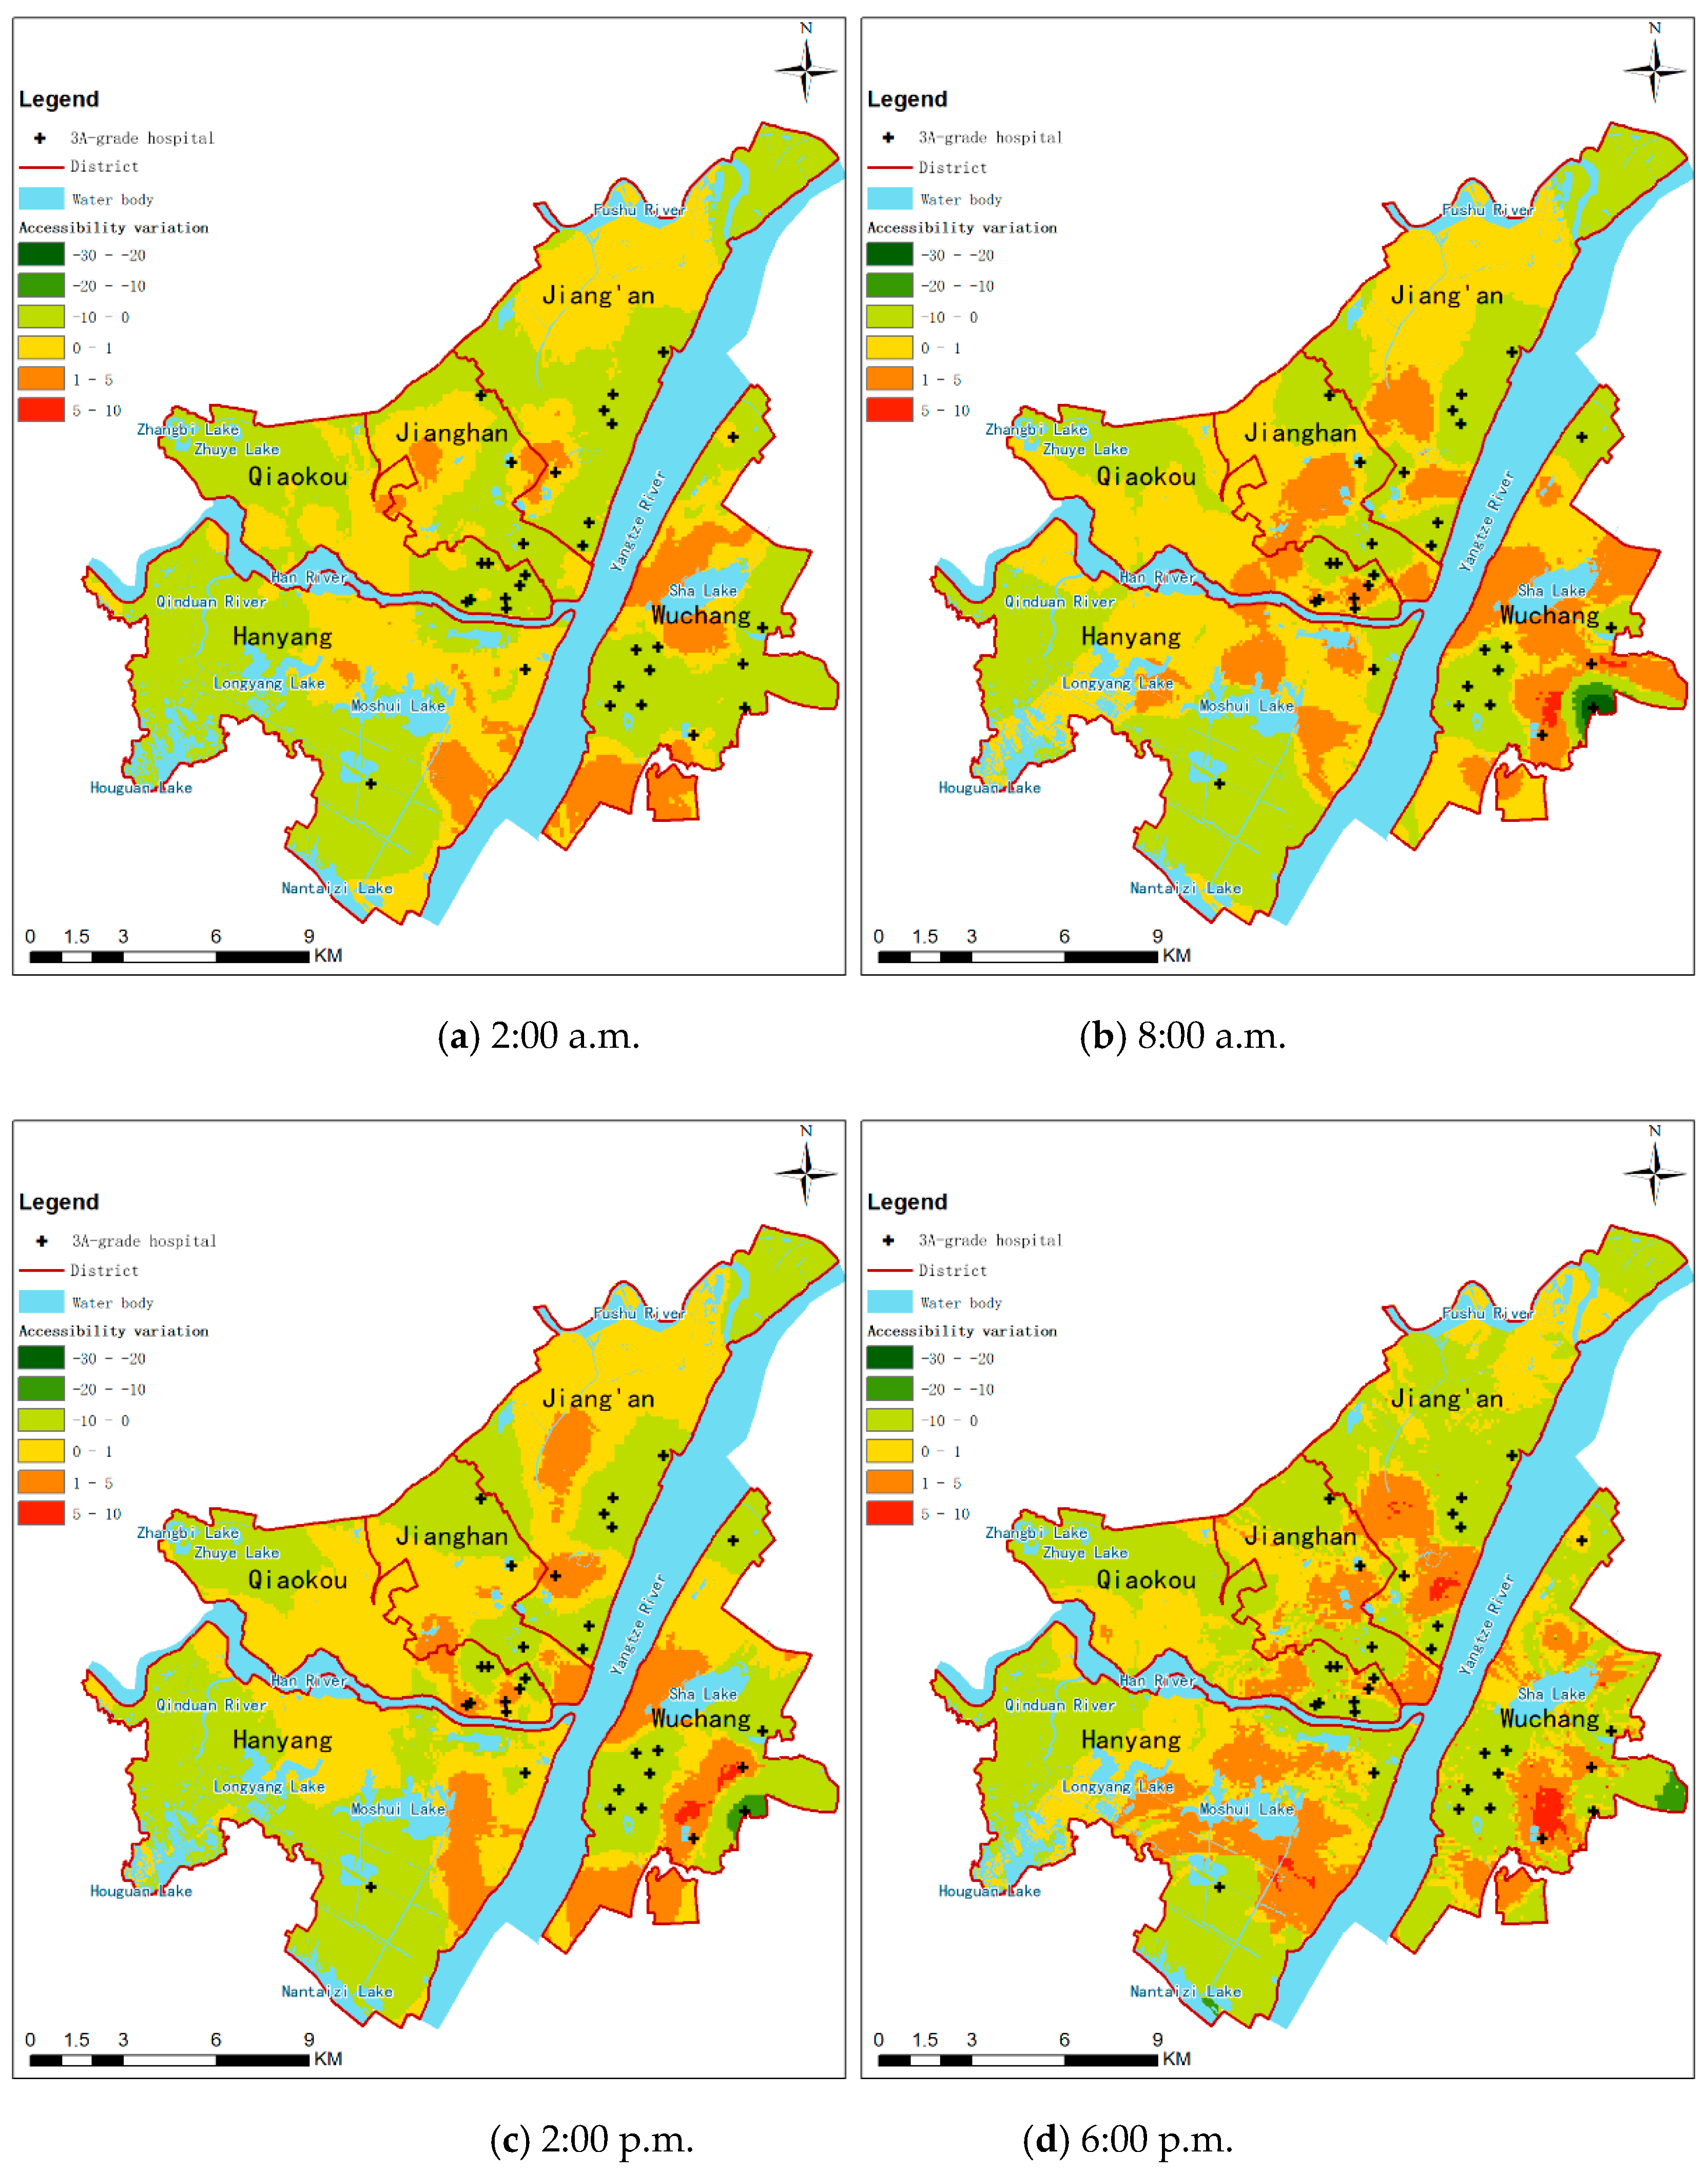
The improved accessibility interpolation results were subtracted from the pre-improved accessibility interpolation results to obtain the changes, as shown in
Figure 6. The change after improvement was global and uneven, but the overall amount of change was not significant. In general, the areas around the study area and near the hospitals became worse, while other areas got better. Regardless of whether it got better or worse, there were very few areas with large changes.
4.2. Statistical Analysis
First, the maximum and minimum values of the accessibility of the medical facility services in each community at 12 moments before and after the improvement were counted.
Second, the average accessibility of the whole study area was calculated with area as the weight, and then the amount and rate of change were calculated, as shown in
Table 1.
Finally, the proportion of area for each change level in each time period was counted, as shown in
Table 2.
The mean change reflects the absolute amount of change in the accessibility of health care facilities across the study area. Corresponding to the mean change is the mean rate of change, which reflects the relative range of change in the accessibility of medical facilities across the study area. Across the four moments, the largest mean change was 0.36 at 8:00 a.m. and the smallest was 0.09 at 2:00 a.m. Similarly, the largest mean rate of change was 3.57% at 8:00 a.m. and the smallest was 0.91% at 2:00 a.m.
As shown in
Figure 7, the change at 8:00 a.m. was divided into three levels of {[−30,1), [−1,1), [1,10]}. Considering [−30,1) and [1,10] as larger changes, it can be found that most of the larger change areas were concentrated in the area within 1.5 km of the hospital. The change is mainly due to the fact that the improved method takes into account the distance factor in addition to time. On the one hand, 1.5 km is relatively not far, and time priority and distance priority may end up taking about the same amount of time, so urban residents may be insensitive to this and thus habitually choose the distance priority. On the other hand, because 8:00 a.m. is the peak commuting time, the study area in this paper is congested with traffic and parking near hospitals is difficult. In contrast, electric bicycles and shared bicycles are currently readily available in large Chinese cities and are less affected by traffic congestion. Therefore, residents may prefer to use non-motorized vehicles to travel to the nearest hospital when the condition is not severe and the distance is not too far. This results in residents not always choosing hospital visits strictly based on travel time costs, causing communities near hospitals to prioritize visits to hospitals that are closer in distance and have slightly more travel time, ultimately resulting in a change in the accessibility of communities near hospitals compared to the time-based results. This also proves to some extent the validity of the improvement method.
The results indicate that the improvements affect accessibility throughout the study area, but the overall effect is not significant and varies by time of day.
As shown in
Table 2, the accessibility calculation results were divided into six classes, namely {(−30,−20), [−20,−10), [−10,0), [0,1), [1,5), [5,10]}, and then the proportion of area covered by each classification was calculated. On the one hand, the largest proportion of relatively small changes in area, such as [−10,10], the smallest proportion was 99.42% at 18:00 p.m., and the largest proportion was 100.00% at 2:00 a.m., which indicates that the improved method does not have too much impact on the accessibility of the whole study area. On the other hand there was also a greater variation of about twice as much, such as the presence of (−30,−20) at 8 a.m., although the area proportion is only 0.23%. This also reflects, to some extent, that the improved method responds to the effects of complex road conditions.
4.3. Limits of the Study
Transportation time cost is an important factor influencing residents’ choice of hospitals to visit, and people generally tend to choose to visit hospitals with a lower time cost. It is inaccurate to calculate the actual value of accessibility to medical facilities by time alone, because not everyone chooses their travel routes based on real-time road conditions, especially when they are familiar with their surroundings or are not too far away, and they tend to choose their travel routes based on their habits. Calculating the practical value of accessibility by distance alone is also inaccurate because it ignores the effect of actual road conditions, which are complex and variable in large cities, especially for long-distance trips, where most residents choose their travel paths based on real-time road conditions. Arbitrarily combining time and distance to calculate the actual value of medical facility accessibility is unscientific, and the weights of both must be determined scientifically. This study creatively uses the preference of hospital choice to combine the two organically, which can analyze the actual accessibility of urban medical facilities more scientifically and accurately, and enable management decision makers to understand the real situation of the urban operation. Of course, this study still has many limits.
In the study of this paper, 20,979 records needed to be crawled at each moment, and 12 moments were crawled in a day, 25,748 records need to be crawled per day. If the whole study area was subdivided according to the area of the smallest community as the threshold, the number of records to be crawled was 6,253,524 per day, which is 24.8 times more than the original scheme, and the workload increases sharply. The spatial interpolation method can retain the original refinement characteristics of the accessibility analysis results while refining the rough results on the one hand, and reduce the workload of data collection and processing on the other. Therefore, the spatial interpolation method is applicable to the accessibility optimization analysis, but the interpolation threshold is not the smaller the better. The selection of the interpolation threshold should be further studied in the future to achieve a balance of performance and quality.
For a specific disease, when patients believe that the medical level of each hospital is roughly equivalent, they mainly determine the target hospital based on distance cost or time cost. This study focuses on this situation and proposes a new accessibility calculation method to take into account both distance cost preference and time cost preference. The proposed method is based on the 2SFCA method, which is widely used in accessibility analysis. In order to fully consider the medical habits of residents, a questionnaire survey was conducted in this study to understand the current status of residents’ actual medical care choices. Since the input parameters of the new method took into account the subjective nature of residents’ medical treatment choices, the calculated results of the accessibility of medical facility services were more in line with the subjective feelings of residents. Theoretically, when Wt = 1, the new method becomes the traditional Ga2SFCA method based on travel time. When Wt = 0, it becomes the traditional Ga2SFCA method based on travel distance. Compared with the accessibility analysis method which only considers time cost, the new method which considers both time and distance can bring more realistic results. The new method had an impact on the entire study area, but this impact was slight for the vast majority of the area. Accessibility improved to varying degrees in areas between decentralized hospitals, while it decreased in areas near hospitals. In this study, we designed a questionnaire to quantify the proportion of distance-priority and time-priority in residents’ healthcare choices by analyzing information on frequently visited hospitals, but this type of information alone is incomplete. In the future, options such as different diseases and corresponding hospital choices need to be added to better match residents’ healthcare choice preferences. At the same time, the sample of the questionnaire was limited, and follow-up studies could also introduce big data such as cell phone signals to more accurately fit residents’ healthcare choice preferences.


