Featured Application
Synthesis of α-MnO2 nanowires via hydrothermal route and their properties to be successfully applied in environmental remediation and sustainable energy areas.
Abstract
Hydrothermally obtained α-MnO2 nanowire characterizations confirm the tetragonal crystalline structure that is several micrometers long and 20–30 nm in diameter with narrow distributions in their dimensions. The absorption calculated from diffuse reflectance of α-MnO2 occurred in the visible region ranging from 400 to 550 nm. The calculated band gap with Quantum Espresso using HSE approximation is ~2.4 eV for the ferromagnetic case, with a slightly larger gap of 2.7 eV for the antiferromagnetic case, which is blue-shifted as compared to the experimental. The current work also illustrates the transformations that occur in the material under heat treatment during TGA analysis, with the underlying mechanism. Electrochemical studies on graphite supports modified with α-MnO2 compositions revealed the modified electrode with the highest electric double-layer capacitance of 3.444 mF cm−2. The degradation rate of an organic dye—rhodamine B (RhB)—over the compound in an acidic medium was used to examine the catalytic and photocatalytic activities of α-MnO2. The peak shape changes in the time-dependent visible spectra of RhB during the photocatalytic reaction were more complex and progressive. In two hours, RhB degradation reached 97% under sun irradiation and 74% in the dark.
1. Introduction
Energy storage devices make it possible to store both solar and wind energy to be used whenever needed and not just when produced. The increasing energy consumption and environmental concerns have led to high demand for renewable and clean energy sources, which can reduce fossil fuel consumption and greenhouse gas emissions [1]. However, energy production from renewable energy sources, such as solar and wind energy, is uncertain since it is highly dependent on weather conditions [2]. Because of this, there is a demand for energy storage devices capable of storing excess energy during production and supplying it in times of energy shortage. Supercapacitors are a new type of green energy storage device that have a lower energy density than batteries, but a much higher power density with a wide temperature range and environmental advantages. Based on the underlying energy storage mechanism, supercapacitors can be divided into two categories: electric double-layer capacitors (EDLC), where the electricity is stored by electrostatic charge accumulation, and pseudocapacitors, in which the electrical charges are mainly stored by fast and reversible redox reactions [3,4]. EDLC can provide ultrahigh power and excellent cycle life because of the fast and non-degradation process between active electrode materials and electrolytes. However, the energy stored in EDLCs is limited by the finite electrical charge separation at the electrode materials/electrolyte interface and the availability of electrode surface area. Because of the Faradaic process underpinning the energy stored in a pseudocapacitor, it has increased energy density but at the cost of power density and cycle life compared to EDLCs [5]. The combination of their properties and their simple structure, high power density, fast charging, and pollution-free effect makes supercapacitors a new generation of green energy storage devices with higher output power and longer life than lithium-ion batteries [6,7]. The typical electrode materials used for pseudocapacitors are transition metal oxides/hydroxides. The different transition metal oxides with pseudo-capacitive behaviors include iron-based supercapacitors [8] and RuO2-based ones, which generally have several redox states or structures and contribute to charge storage by fast Faraday charge transfer between the different redox states [9]. MnO2 stands out as one of the most promising electrode materials because of its natural abundance, low cost and toxicity, environmental friendliness, and high theoretical specific capacitance (of 1370 F/g,) and because it presents various oxidation states that benefit from efficient redox charge transfer to satisfy the needs of energy storage with a long-life cycle [10]. When formed in single-phase, tetragonal MnO2 can incorporate different cations, as well as water molecules inside the “tunnels” or “channels” between the [MnO6] octahedra. α-MnO2 stabilizes in a body-centered tetragonal lattice among manganese dioxides (I4/m(87), a = 9.96 Å; c = 2.85 Å (2 × 2) tunnel type), while, β-MnO2 crystallizes as the pure tetragonal/rutile structure (P42/mnm, a = 4.39; c = 2.87 Å (1 × 1) tunnel) [11,12].
MnO2 is one of the most appealing materials because of its technological significance and potential applications in various catalytic and electrochemical processes where their properties are significantly influenced by its structure and morphology, allowing researchers to investigate the effect of the support structure on catalytic activity [13]. Different catalytic activity can be caused by the phase structure, catalyst surface, crystal facets with various surface atom configurations, metal loading and doping, and different physicochemical parameters [14,15]. Furthermore, MnO2 is an n-type semiconductor with oxidative catalytic [16] properties that depend upon its crystallographic forms. Each polymorph phase displays a specific tunnel structure or interlayer: 1D tunnel structure, 2D layered structure, and 3D spinel structures with different impacts on photocatalysis. Numerous studies have investigated the catalytic properties of MnO2 for the degradation of organic dyes under UV and Vis irradiation and in dark conditions, reporting high degradation efficiencies [17,18,19,20,21]. As a result, scientists are focusing on less expensive and non-metal catalysts as alternatives. For example, Periyasamy et al. hydrothermally prepared one-dimensional rGO-wrapped α-Mn2O3/α -MnO2 mixed phase electrocatalyst with improved oxygen reduction reaction activity [22]. Similarly, Cui et al. hydrothermally obtained a series of CuO/α-MnO2 nanowire catalysts where CuO serves as the CO oxidation’s active center creating a potent intermetallic synergistic effect on the surface of the -MnO2 nanowire support, which increased the CO oxidation activity of α-MnO2.
This work provides new insights into understanding the charge storage mechanism of MnO2 and outlines the electrochemical characteristics of a newly manufactured α-MnO2-based electrode regarding its electric double-layer capacitance, surface roughness factor, and electrochemically active surface area. Moreover, it presents a comparison between the catalytic and photocatalytic properties of α-MnO2, conducted with an emphasis on the rhodamine B (RhB) degradation mechanism. Rhodamine B is a xanthene, cationic dye that was selected for this study as a model organic compound because of its potential toxicity to different environmental media. Generally, the organic dyes are used in industries such as food, cosmetics, plastics, textiles, and others. The improperly treated effluents may contain dyes of significantly high concentration and can cause harming of reproductive systems, nervous systems, livers, and brains in humans and also shows toxicity to aquatic environments with mutagenic effects [23,24,25]. Rhodamine B is a stable dye and cannot be degraded without treatment methods such as the assistance of semiconductors under ultraviolet–visible light illumination. Many studies are found in scientific literature for the synthesis of manganese dioxide and testing for catalytic and photocatalytic activity, with a very good degradation percentage of rhodamine B in the first 90 min. In Table 1, there are presented some of the results of the catalytic and photocatalytic properties of the α-MnO2 and MnO2 aerogel in different experimental conditions carried out in several research works.

Table 1.
Degradation of RhB over manganese dioxide using various experimental conditions.
Basically, α-MnO2 nanostructures with well-controlled morphology and crystallinity were prepared at low temperature by a facile hydrothermal reaction. The as-obtained nanowires were investigated in terms of their structural, morphological, optical, and thermal properties. In addition to many conventional characterization methods, thermogravimetric analysis was carried out to explain the α-MnO2 growth mechanism. Graphite supports modified with compositions containing α-MnO2 were prepared and used in an electrochemical study aimed at identifying the electrode with the highest electric double-layer capacitance. Last, a catalytic study regarding the degradation of RhB in the acidic medium conditions and under solar irradiation was performed.
2. Materials and Methods
2.1. Preparation of α-MnO2 Materials
MnO2 was prepared by a hydrothermal method using a precursor mixture of 20 mmol KMnO4, 30 mmol Mn(NO3)2, and 40 mmol KOH in an aqueous solution. The precursors were separately dissolved in 20 mL water and the solutions were subsequently mixed under continuous stirring. The resulting mixed solution was transferred to a sealed Teflon-lined autoclave reactor, introduced into the oven at low temperature (180 °C), and maintained for 22 h, followed by cooling to room temperature. The precipitate formed in the same autoclave displayed two colors: black on the edge and brown in the middle, with both specimens being well-crystallized. The products obtained were separated and filtered, then washed several times with distilled water and finally with ethanol for the removal of soluble residues. The precipitate was dried at 80 °C for 4 h.
2.2. Preparation of the Modified Electrodes
The following materials and reagents were used for the electrochemical experiments: spectroscopic graphite bars (⌀ = 6 mm) from “Kablo Bratislava” (National Corporation “Electrocarbon Topolcany” Factory, Bratislava, Slovakia), black laboratory-synthesized α-MnO2, carbon black—Vulcan XC72 (FuelCellStore), and Nafion® 117-solution (Sigma-Aldrich, St. Louis, MO, USA), as well as potassium chloride, N,N-dimethylformamide (DMF), ethanol, and acetone (purchased from Sigma-Aldrich and Merck, Kenilworth, NJ, USA). The role of the Vulcan conductive carbon was to enhance the transfer of electrons between the electroactive species and the electrode, while the Nafion solution was used to improve the binding between the powder materials and the surface of the graphite support. All aqueous solutions were prepared using double-distilled water.
The graphite bars were fixed in polyethylene tubes that became tightly attached to the bars following heat treatment at 180 °C. During the electrochemical experiments, one of the two ends of the bars was connected to the potentiostat, while the other end was modified and subsequently immersed in the electrolyte solution. Before the modification, the surface of each graphite support was polished using silicon carbide paper with different grit sizes (600, 800, and 1200) and felt. The supports were further washed with double-distilled water, ethanol, and acetone. After drying at RT, their surface was modified by drop-casting a volume of 10 µL from suspensions prepared by ultrasonication, using the compositions specified in Table 2. This stage was followed by solvent evaporation at 40 °C for 4 h and at RT for 20 h.
Table 2.
The codes used to identify the bare electrode and each modified electrode, with the compositions of the suspensions employed in the modification process.
Ethanol and DMF were utilized to obtain the suspensions for the manufacturing of the modified electrodes based on reported studies in which the same reagents had been selected to prepare MnO2-containing suspensions for the same purpose [31,32] and also because they ensure an improved dispersion of the hydrophobic Vulcan particles.
2.3. Characterization Techniques
We confirmed the crystal structure and phase purity for α-MnO2 with powder X-ray diffraction patterns using a PANalytical X’Pert Pro powder diffractometer with a Cu Kα radiation (λ = 0.15406 nm) operating at 45 kV and 30 mA.
Infrared spectra (FT-IR) were recorded on an FT-IR spectrometer Vertex 70 (Bruker, Munich, Germany) using the KBr pellet method in the wavenumber range of 400–4000 cm−1, 128 scans, and a resolution of 8 cm−1 to study the chemical structures. Raman spectra were obtained using a multi-probe imaging MultiView 1000TM system (Nanonics Imaging, Jerusalem, Israel), and ultraviolet–visible spectroscopy was performed using UV-Vis-NIR Spectrophotometer Perkin Elmer type Lambda 950 (PerkinElmer, Waltham, MA, USA) with an integrating sphere module in the 300–1000 nm range. The morphological characterization of the samples was performed by recording scanning electron microscopy images (SEM, JEOL-6700F from FEI, Eindhoven, The Netherlands). The phase transformations were studied by thermogravimetric analysis (TGA) in an argon atmosphere in the 50 to 1000 °C range, with a heating rate of 10 °C min−1. Electrochemical measurements were performed using a VoltaLab PGZ 402 potentiostat (Radiometer Analytical, Lyon, France) together with a three-electrode conventional glass cell. A Pt plate (Sgeom = 0.8 cm2) and the Ag/AgCl (sat. KCl) electrode were the auxiliary and reference electrodes, respectively. The working electrode was the graphite support (Sgeom = 0.28 cm2), either bare or modified with the compositions specified in Table 2. The double-layer capacitance investigations at the electrode/electrolyte solution interface were carried out by recording cyclic voltammograms in 0.1 mol L−1 KCl electrolyte solution at different scan rates (v = 0.1, 0.15, 0.2, 0.25, and 0.3 V s−1) and in a potential range where no Faradic currents were present. All electrochemical experiments were performed at room temperature and all potentials are represented vs. the Ag/AgCl (sat. KCl) electrode.
Catalytic degradation of RhB from aqueous solution over α-MnO2 was studied to appreciate the catalytic properties of the MnO2 in the dark and under solar irradiation. The effect of solar light irradiation was investigated for the catalytic degradation reaction of dye in an aqueous solution using 30 mL RhB (initial concentration of 1.5 mg L−1) and 10 mg of brown α-MnO2 continuously mixed with a magnetic stirrer at 300 rpm in comparison with the absence of irradiation. The solution pH was modified by the addition of small amounts of HNO3 (0.1 M) to the suspension. The RhB degradation was evaluated by analyzing the evolution of RhB solution visible absorption spectrum over time using a UV-Vis spectrophotometer (modular Jaz spectrophotometer from Ocean Optics) connected to a cuvette holder and a light source (LS-1 from Ocean Optics). The catalytic experiments were operated for two hours and the RhB degradation (%) was calculated using the following formula (Equation (1)):
where At and A0 are absorbance values (at λ = 556 nm) at time t and at the time t = 0 min during the catalytic degradation reaction.
Moreover, the blueshift of the absorbance peak, the decrease in intensity, and the formation of other peaks were investigated as a measure to better understand the possible reaction mechanism for RhB degradation and the efficiency of the MnO2 as a catalyst.
To study properly the as-obtained MnO2 we compared the morpho-structural properties of the brown and black α-MnO2 obtained using the hydrothermal method, while in the application we used the black α-MnO2.
3. Results and Discussions
3.1. X-ray Diffraction
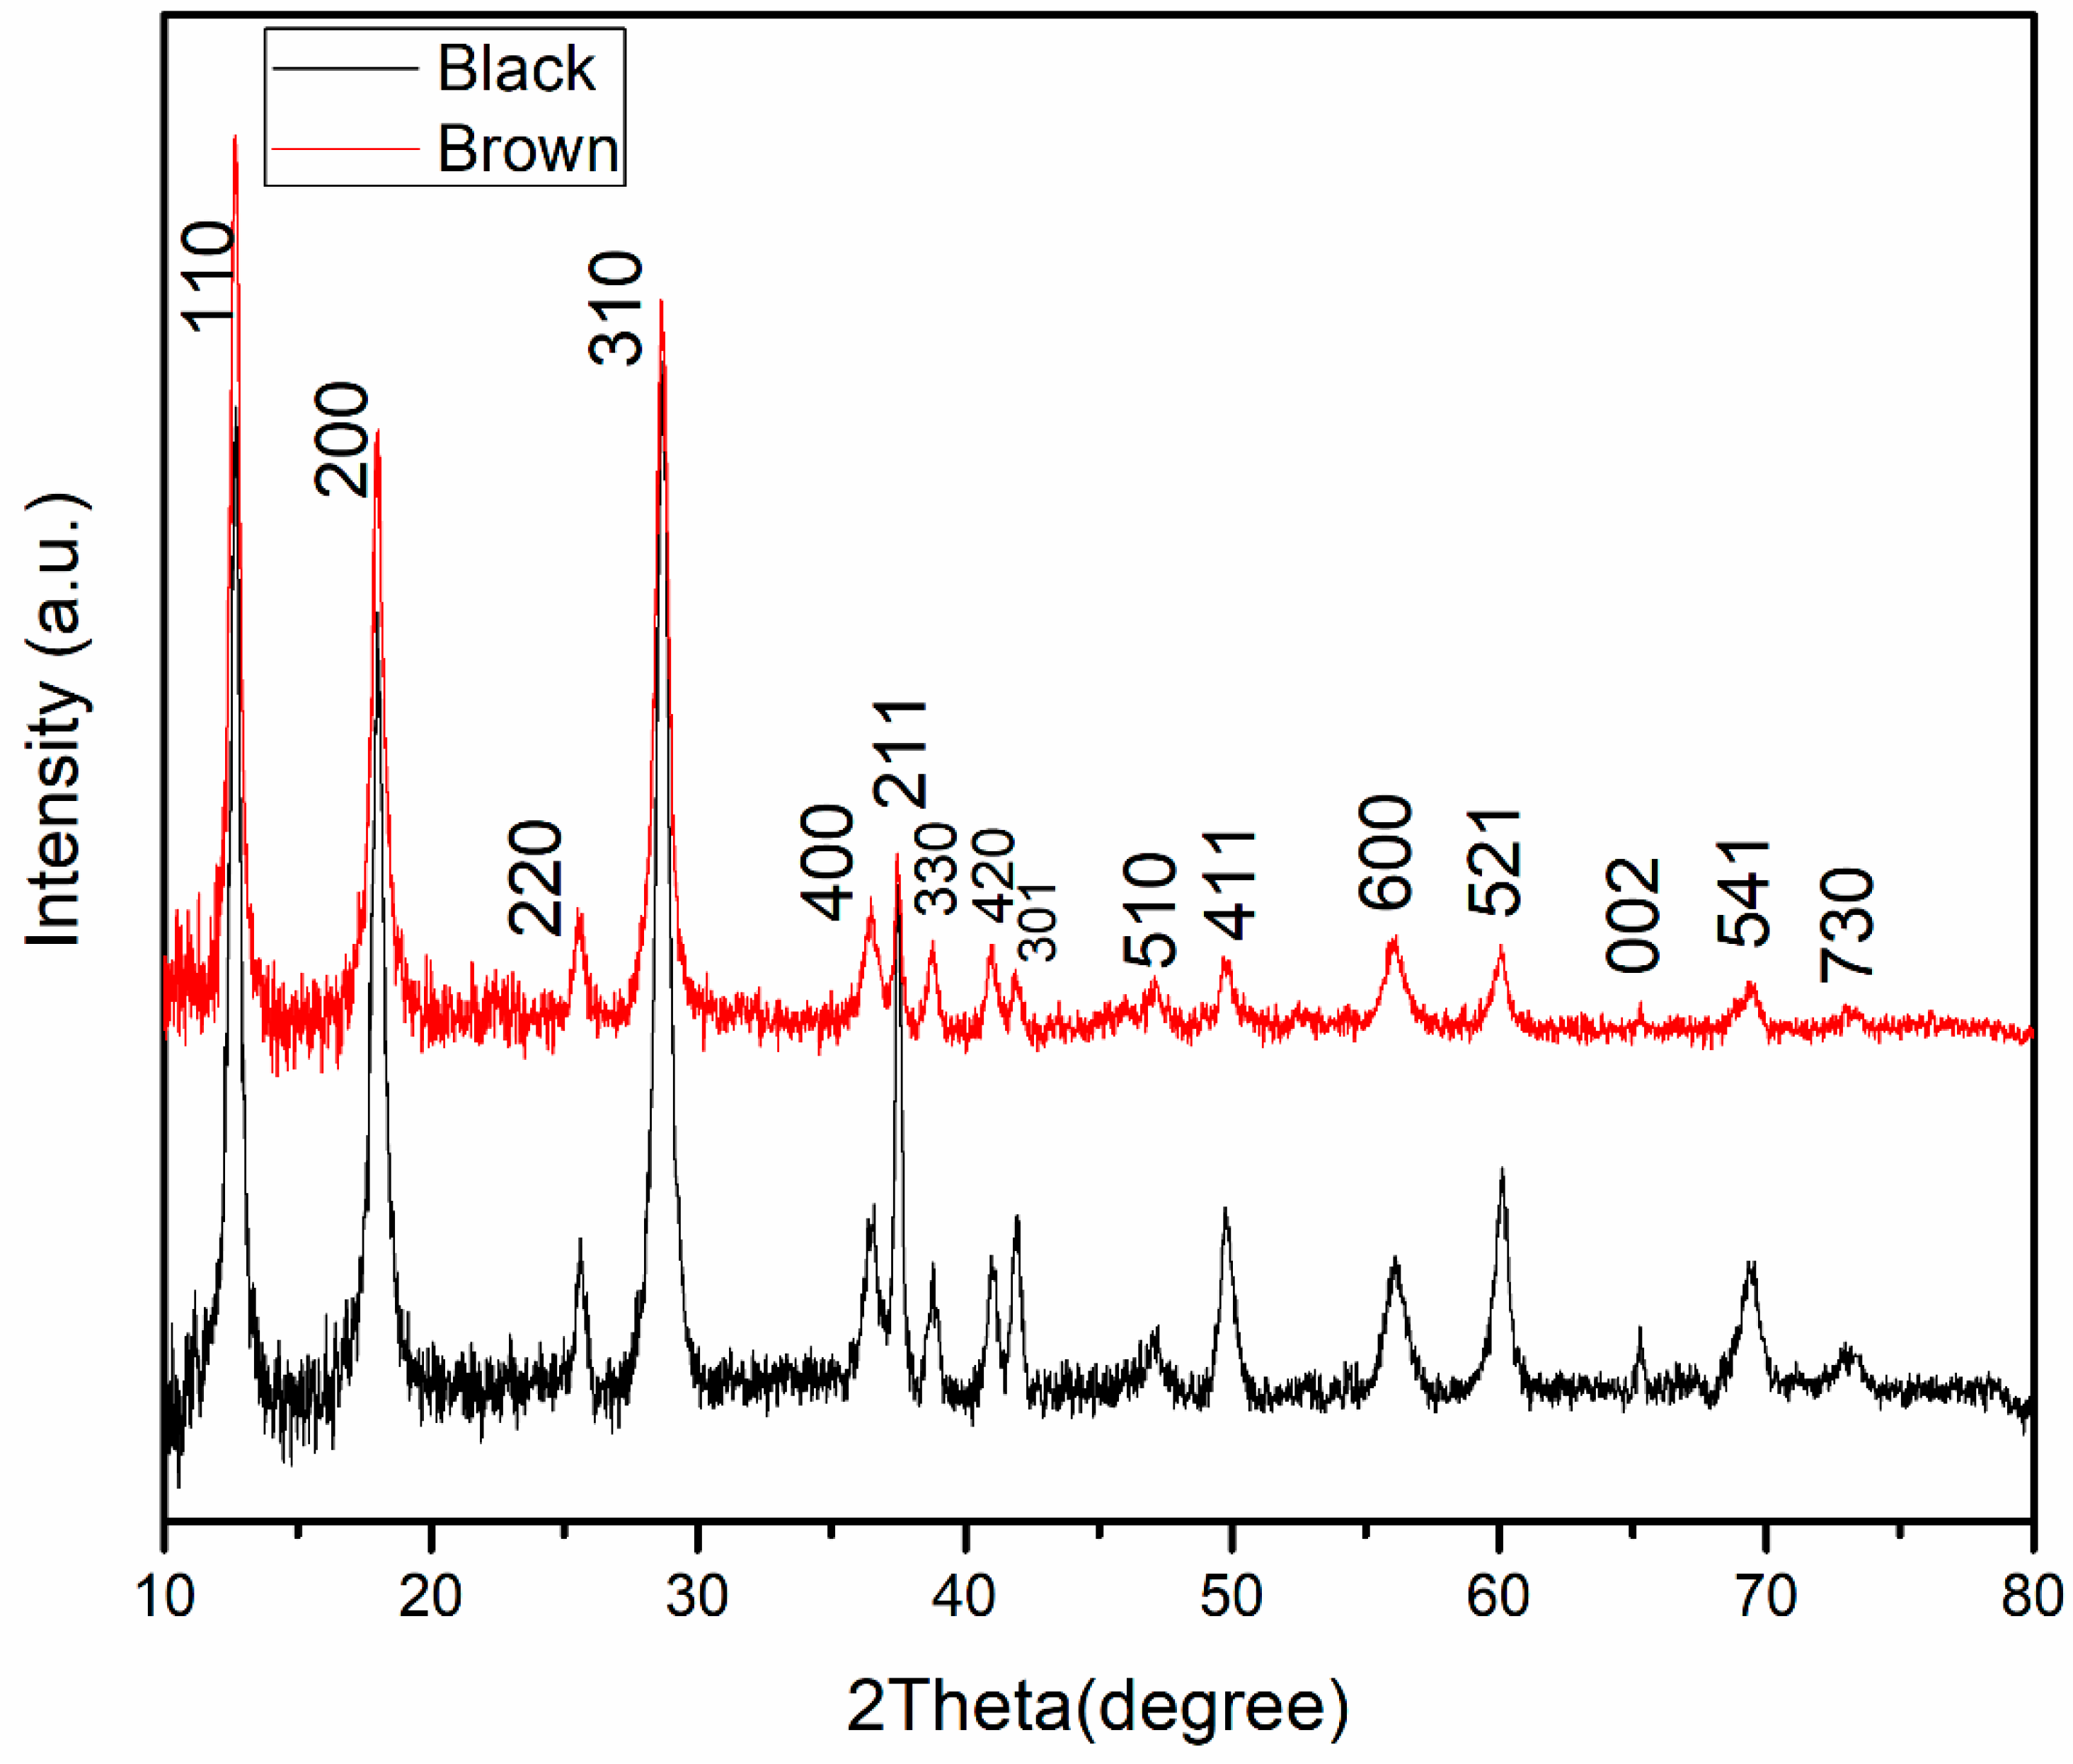
The diffraction patterns of the α-MnO2 type manganese oxide synthesized using the hydrothermal method are shown in Figure 1 and were collected at room temperature, over the 2θ range of 10 to 80°, with 0.02 degrees scan step and 0.02 s/step scan rate. The crystallography of the phase composition was confirmed with Rietveld refinement, using HighScore Plus software and the Inorganic Crystal Structure Database (ICSD). The two patterns correspond to α-MnO2 samples obtained under the same conditions, but with different colors—black (a) and brown (b).
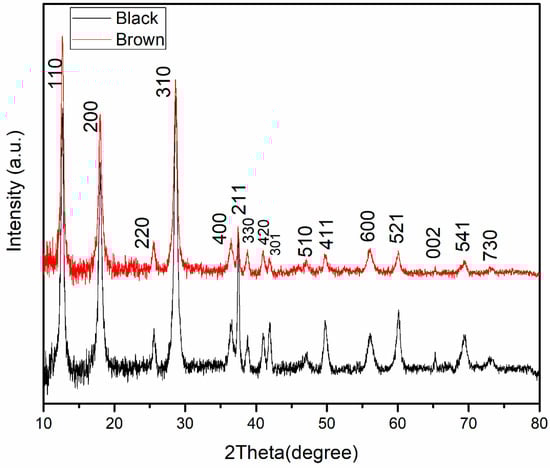
Figure 1.
X-ray powder diffraction of the black and brown α-MnO2 synthesized using the hydrothermal method.
As specified in the experimental section, the hydrothermally synthesized α-MnO2 displayed two colors: it was observed as a brown precipitate in the middle of the autoclave and as a black precipitate on the side lines. XRD analysis confirmed that both samples were well-crystallized and can be indexed in the α-MnO2 structure according to JCPDS card no. 01-072-1982.
Although the patterns indicate that the reflections of the diffraction peaks of black and brown α-MnO2 are similar, a small difference can be seen regarding the degree of crystallization. Thus, in the case of the brown sample, the XRD spectrum has a more irregular background because of the smaller size of the particles, outlined via SEM imagery. The differences in the diffraction peak intensities for brown and black α-MnO2 were reported as well in other studies, which were associated with different degrees of crystallinity and/or particle size of the compounds. Based on the literature, the properties of the α-MnO2 are affected by the physical treatments applied in the synthesis, such as lyophilization, drying, mechanical stirring, and maceration [33,34].
XRD analysis and Rietveld refinement were used to obtain the crystallographic lattice parameters of α-MnO2 a = b = 9.831(2) A°, c = 2.8557(6) A°, and α = β = γ = 90° and to confirm the I4/m space group. In the XRD spectra, the peaks observed at 12.7°, 18.1°, 28.7°, 37.4°, 49.8.1°, 60.3°, and 69.7° correspond to the hkl planes (110), (200), (310), (121), (411), (521), and (451) of α-MnO2 nanowires, respectively. XRD patterns for brown α-MnO2 exhibit a high intensity peak at 28.5°, which can be indexed as the (311) plane followed in intensity by the peaks for the planes (121) and (200). In contrast, for black samples the most dominant peak occurs at a plane (110) and a 2θ value of 12.5° followed by planes (310) and (200), suggesting a preferential growth of α-MnO2 in both cases comparable with those obtained in literature by Sanchez-Botero et al. [35].
The crystallite sizes were determined from X-ray diffraction line broadening using the Debye–Scherrer equation (Equation (2)) for the calculation of particle size:
where D is the mean size of crystallites (nm), K is the Scherrer constant, is wave length of the X-ray beam used (1.54, 184 Å), is the full width at half maximum (FWHM) of the peak, and is the Bragg angle. The calculated crystallite sizes were 17.4 nm for the black α-MnO2 sample and 15.1 nm for the brown one.
3.2. FT-IR Analysis
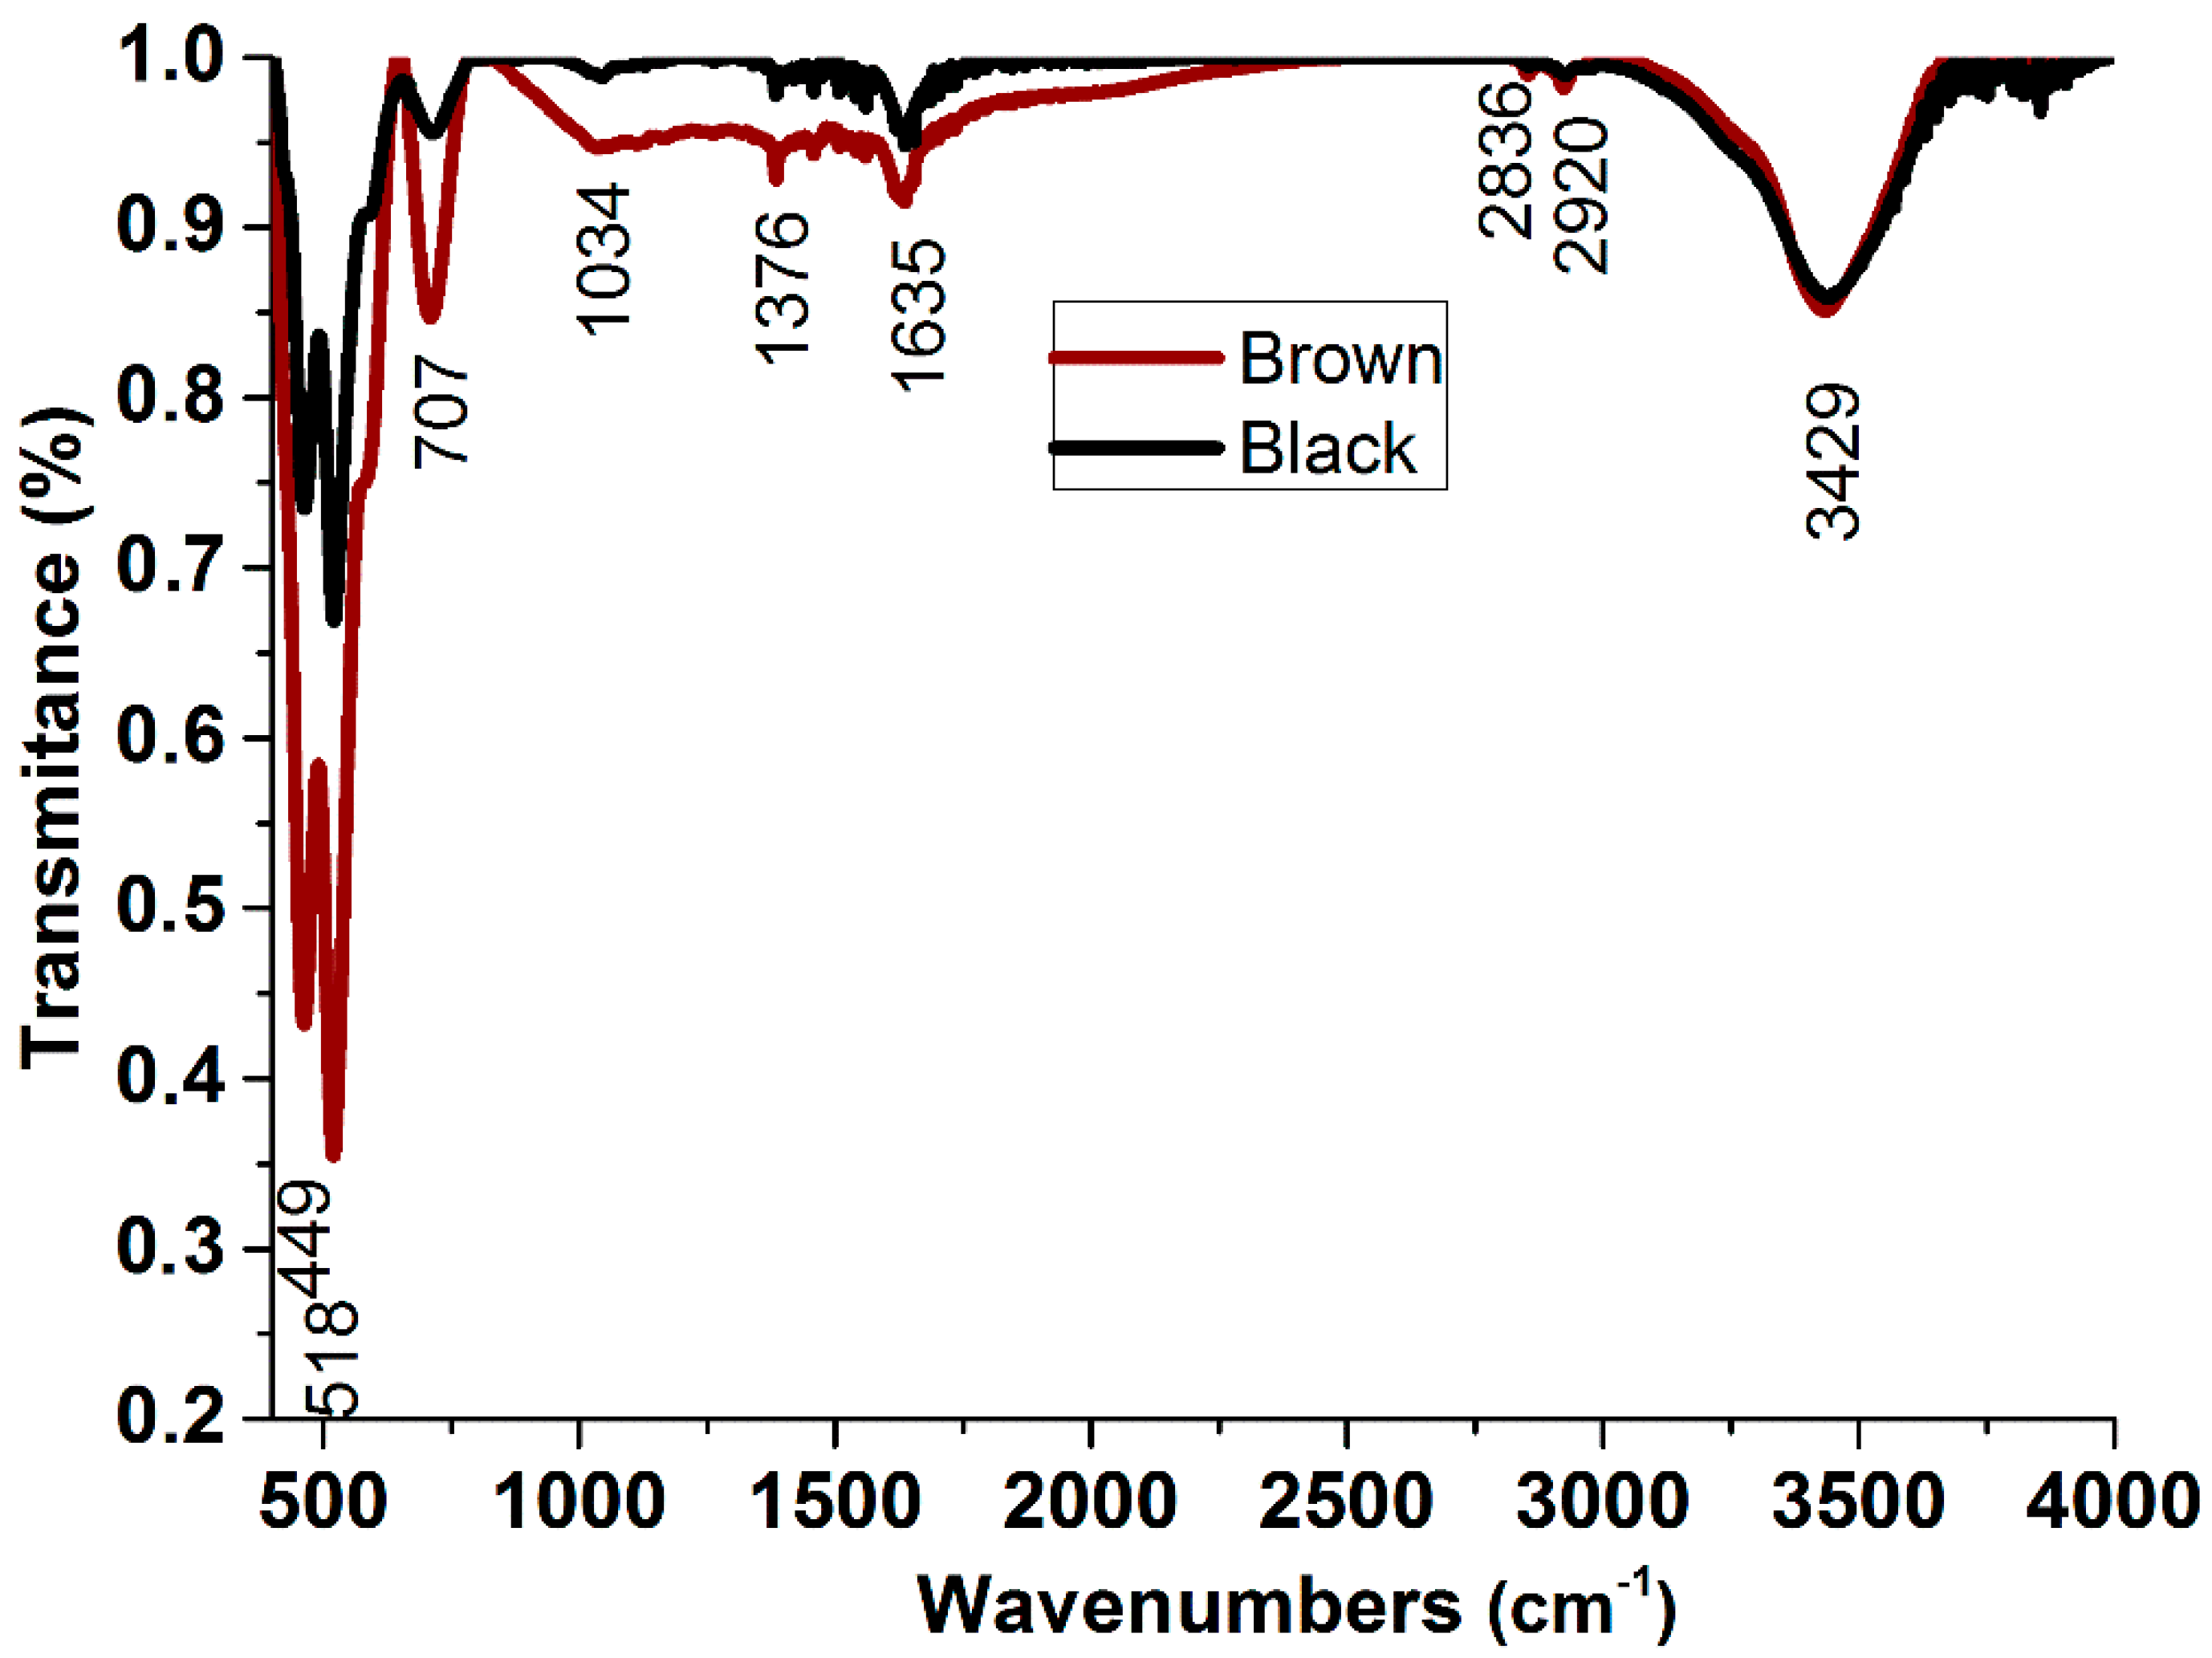
Figure 2 depicts FT-IR data in the range of 400–4000 cm−1 for the α-MnO2 nanowires (black and brown) synthesized using the hydrothermal method. The bands at 3429 and 1635 cm−1 are due to the stretching and bending vibrations of water molecules or hydroxyl groups, while the bands at 2836 and 2920 cm−1 are attributed to C–H stretching and bending vibrations. The narrowband at 1376 cm−1 is assigned to C–O vibrational mode.

Figure 2.
The FT-IR spectrum of the α-MnO2 type manganese oxide was synthesized using the hydrothermal method.
Normally, characteristic bands at 707, 518, and 449 cm−1 correspond to the Mn–O stretching modes of the octahedral in the α-MnO2 structure, while in this case, the peak at 518 cm−1 exhibits the Mn–O stretching mode, and the band at 707 cm−1 is due to O–O stretching mode, demonstrating the presence of MnO6 [36,37].
3.3. Raman Shift Spectroscopy
The results of the measurements are depicted graphically as Raman spectra recorded for α-MnO2 (black and brown) to identify the main groups of its chemical composition (Figure 3). Minerals with the hollandite structure are made up of double chains of Mn-O octahedra with chains linking corners to produce a structure with tunnels that are two octahedra on a side [38]. In general, the Raman active bands for MnO2 are at 500–510, 575–585, and 625–650 cm−1, which represent the Mn–O stretching vibration of the MnO6 octahedra [39], Mn–O stretching vibration of the basal plane of the MnO6, and the symmetric stretching vibration of Mn–O of the MnO6 group, respectively [37,40], and are indicative of a well-developed tetragonal structure with an interstitial space consisting of (2 × 2) tunnels and are assigned to the Ag mode [41].
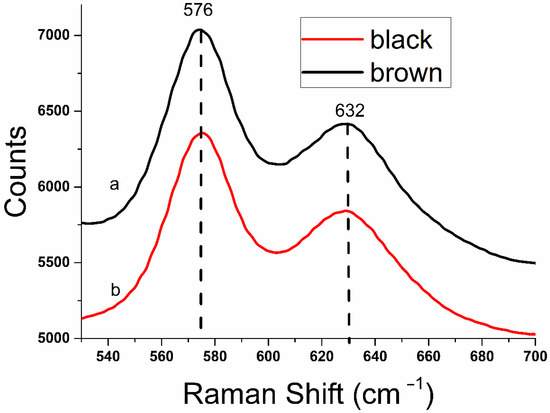
Figure 3.
Raman spectra of black (a) and brown α-MnO2 (b).
The fingerprint for α-MnO2 type at 576 cm−1 and 632 cm−1 belongs to Ag species resulting from breathing oscillations of MnO6 octahedral units. The relative intensity of these two bands is assigned to tunnel-type materials [37,42,43] indicating the crystalline nature of α-MnO2 that is in agreement with structural results. The relative intensity of these two bands is assigned to tunnel-type materials [38] indicating the crystalline nature of α-MnO2 that agrees with structural results. Therefore, α-MnO2 always has Raman spectra similar to the ones from Figure 3.
The data are in good agreement with both the number and the position of the bands (e ~ 573 and 640 cm−1) reported by Xie et al. [44] and Hernandez et al. [45]. These authors reported that the presence of heavy tunnel cations dampens the vibrational components perpendicular to the octahedral chains.
3.4. Ultraviolet-Visible Spectroscopy and Ab Initio Calculations
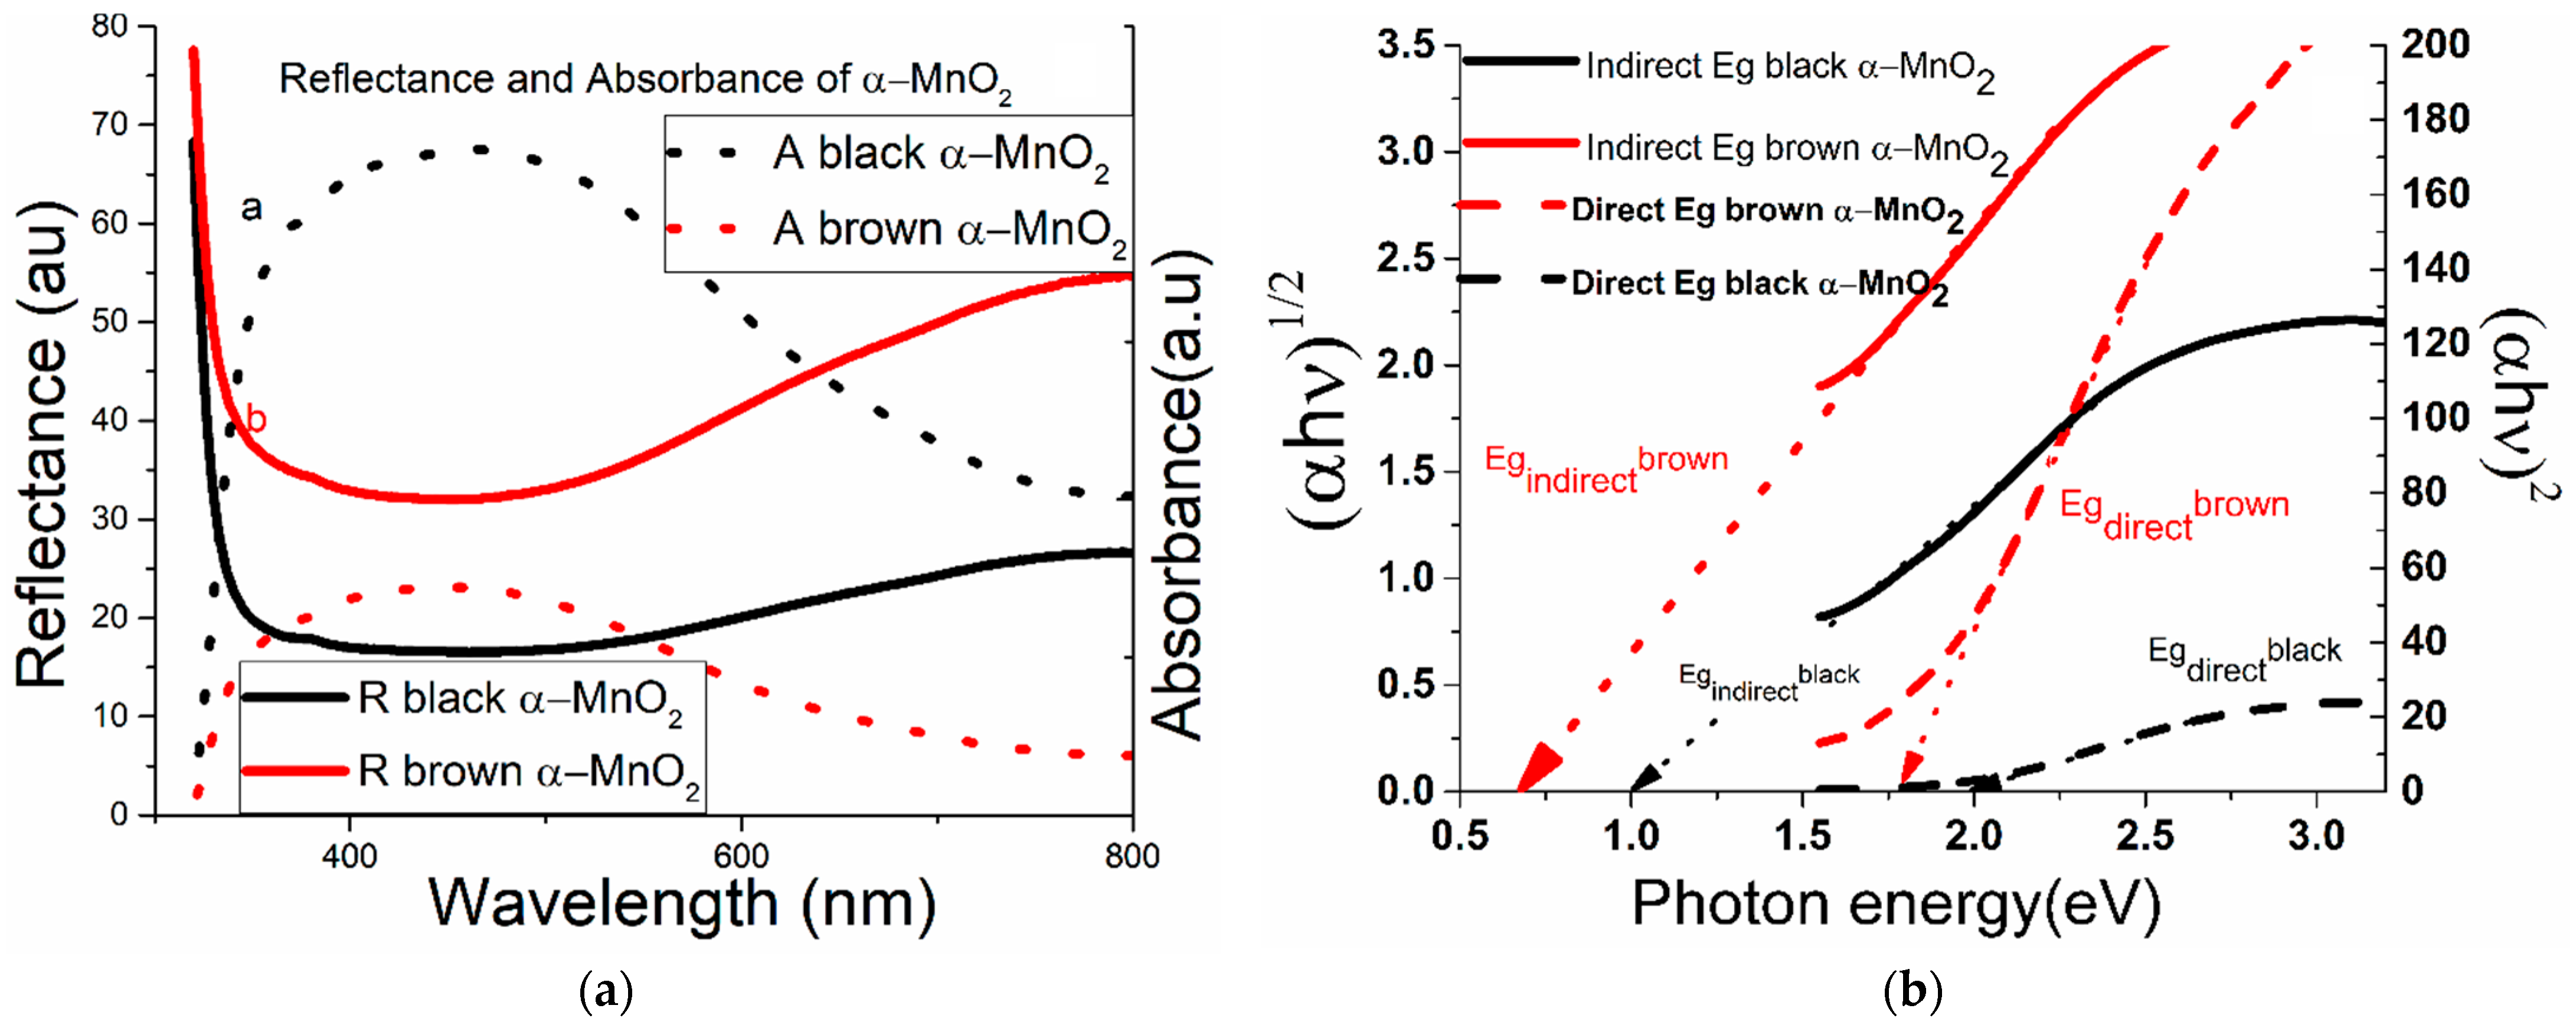
The optical study of the α-MnO2 nanowires was conducted by employing UV-Vis spectroscopy to record diffuse reflectance spectra in the 300 nm ÷ 800 nm range. The formation of the two types of α-MnO2, black and brown, are validated by a lower reflectance curve for the black α-MnO2 when compared to the brown α-MnO2, knowing that the black materials absorb more light in the visible spectrum range than materials with lighter colors, including brown. According to the theory of P. Kubelka and F. Munk, presented in 1931, the measured reflectance spectra can be transformed into the corresponding absorption spectra by applying the Kubelka–Munk function [46]. Figure 4a shows the reflectance and calculated absorbance spectrum of black (a) and brown (b) α-MnO2 nanowires transformed according to Makuła et al. [46] and plotted against the wavelength. For both samples, broad absorption bands extending from 400 to 550 nm with a peak location of 400 nm were detected. The absorption in the visible light range is caused by the d2d transitions of Mn ions in α -MnO2 nanowires. In the ligand field of MnO6 octahedra, the Mn 3d energy level separates into lower (t2g) and higher (eg) energy levels, and the energy difference between the eg and t2g states is responsible for the optical bandgap energy [47]. The Tauc plot gives an estimate of the bandgap energy. Band-to-band transition in oxide depends on the absorption coefficient α and photon energy by the following relation—(Equation (3)):
where A is the constant, hν is the photon energy, and α is the absorption coefficient, while n = 2 for direct and n = 1/2 for indirect transition, depending on whether they are allowed or forbidden, respectively. The experimental curve was fitted to obtain the band gap semiconductor absorption function with n = 1/2 for direct band gap energy values and n = 2 for indirect band gap energy values. The calculated values of the direct energy band gap from Figure 4b lie in the range of 1.70–2.05 eV. The values obtained for the indirect energy band gap lie within 0.60–1.0 eV. The value Eg is calculated by plotting (αhν)2 vs. (hν). The graph (αhν)2 versus the photon energy has a linear region, which can be extrapolated to the abscissa to yield the bandgap energy. The region showing a steep, linear increase in light absorption with increasing energy characteristic of semiconductor materials.
(αhν)n = A (hν − Eg)
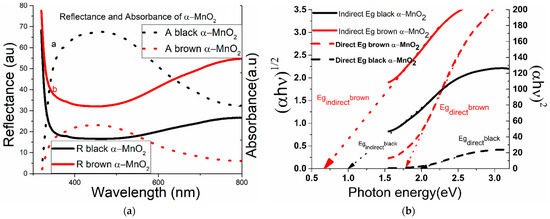
Figure 4.
(a)—Diffuse reflectance and absorbance spectra vs. wavelength, recorded for the black (a) and the brown α-MnO2 (b). (b)—Plot of (αhν2 and (αhν)1/2 vs. (hν) for the black and brown α-MnO2, with optical band gaps determination.
Figure 4b shows the Tauc [48] relation, (αhν)2 vs. photon energy (hν) for the determination of optical band gap (Eg) related to the allowed direct transition of black and brown α-MnO2 associated with (αhν)1/2 vs. photon energy (hν) for the determination of the optical band gap (Eg) related to the allowed indirect transition of black and brown α-MnO2. The calculated values for direct transitions are near 2.0 eV for both materials, which indicates wide bandgap energy, suggesting that the activation of the obtained α-MnO2 toward photocatalytic and semiconductor properties is given by light absorption in the visible range. The bandgap calculated for indirect transitions for brown and black α-MnO2 are in 0.6–1.0 eV range. Notable variations in the bandgap energies of α-MnO2 were previously observed. For example, Zahan et al. noticed a bandgap of 3.82 eV in α-MnO2 thin films [49]. The shift in the bandgap to higher energies can be attributed to the carrier confinement in the small semiconductor particles. We consider that the α-MnO2 nanowires might have a similar effect because of their small feature sizes on diameters. Based on the above results, we can realize that MnO2 nanowires can be potentially used for devices where the absorption of visible light such as solar cells and photocatalysts are required.
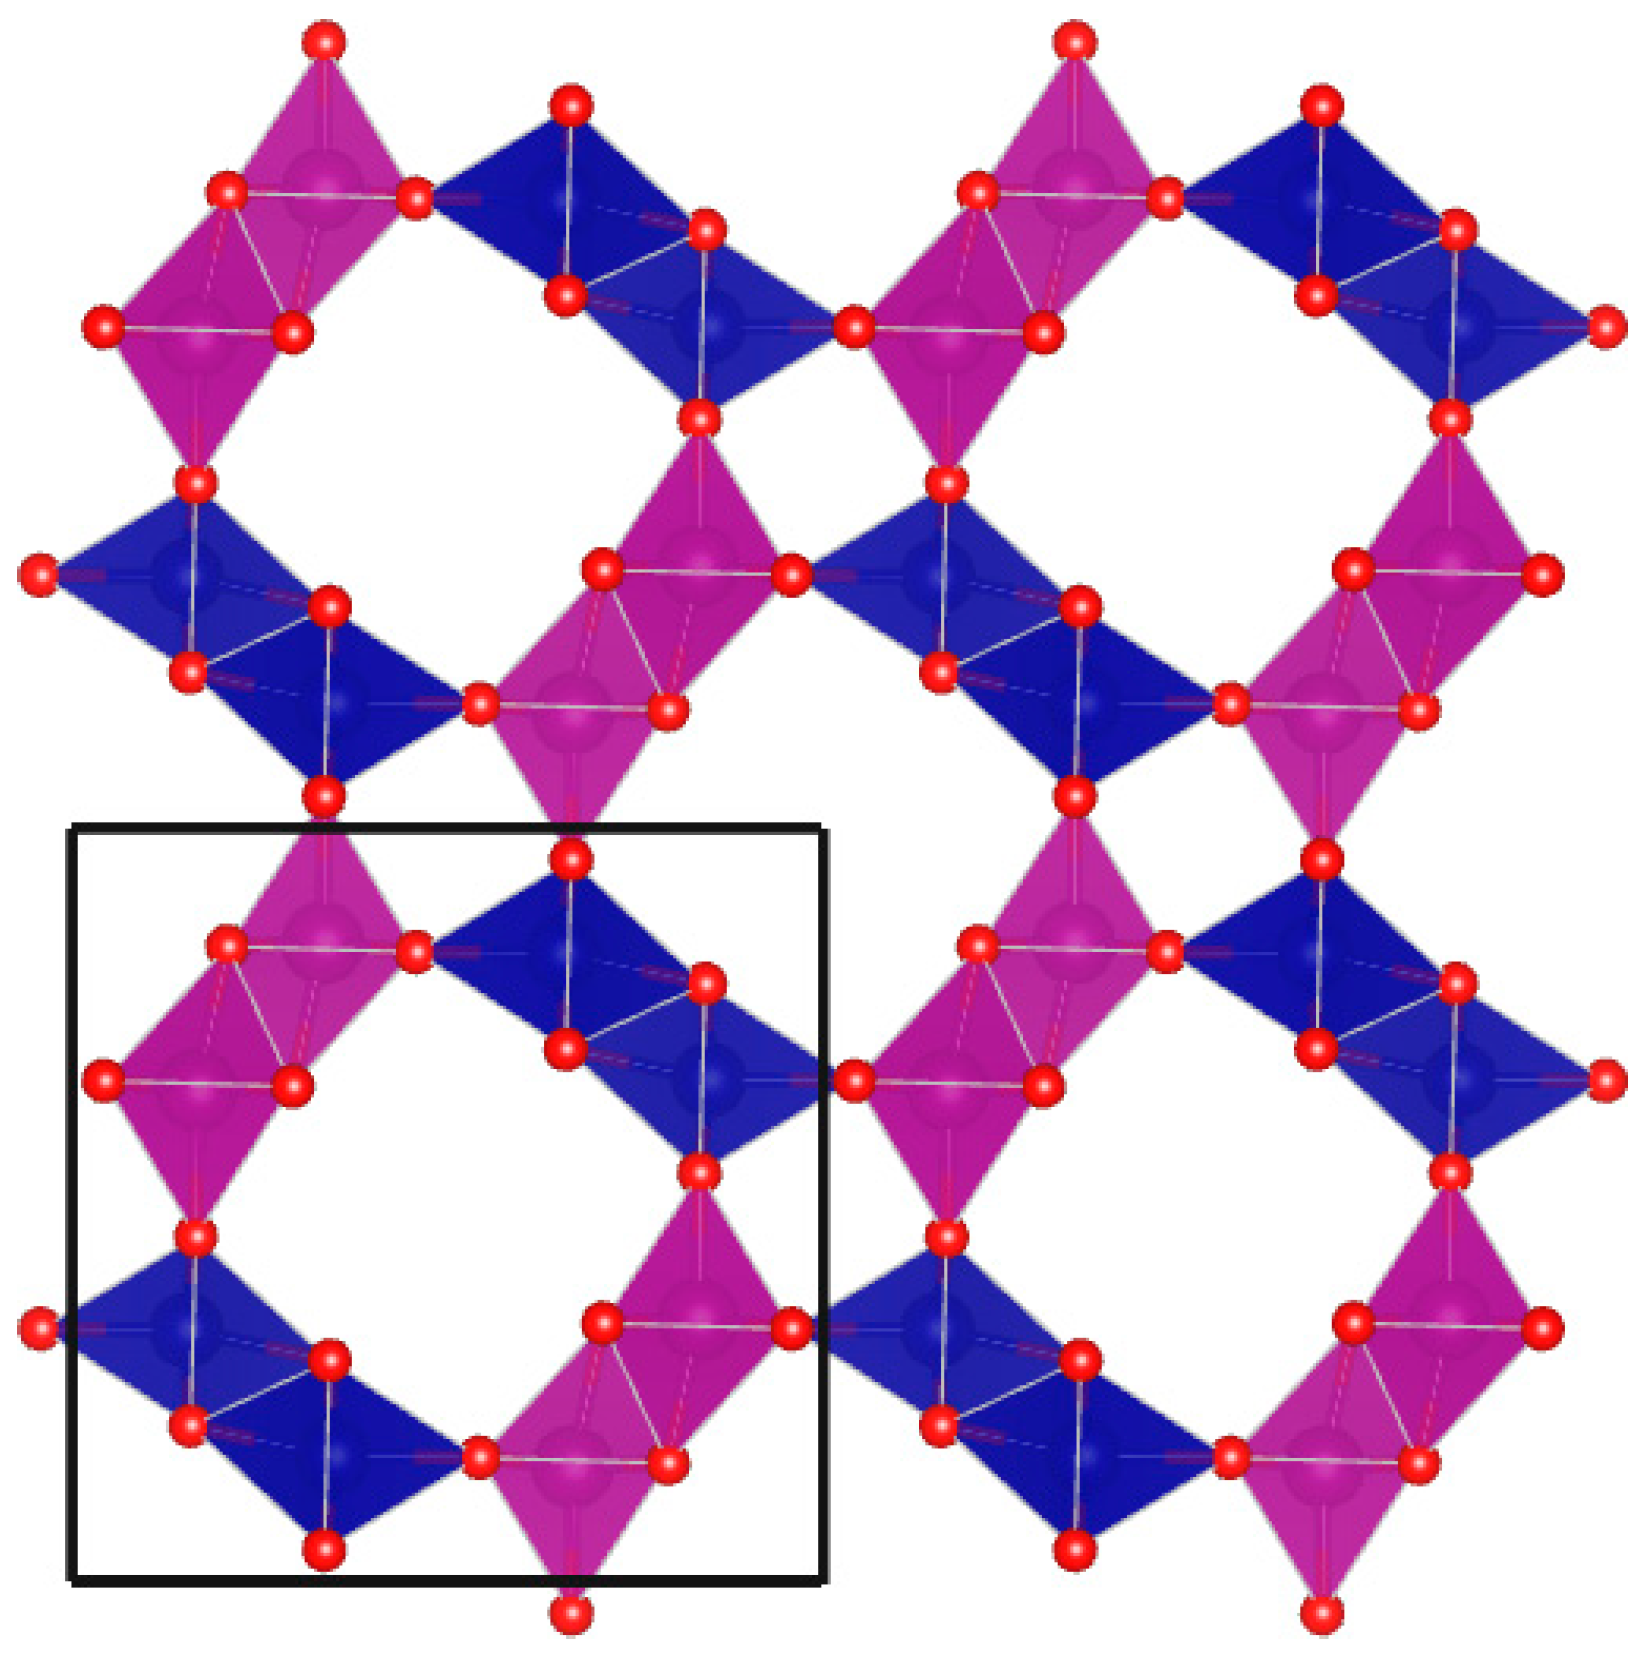
First-principles density functional theory calculations were used to investigate α-MnO2; the structure containing a framework of the corner- and edge-sharing MnO6 octahedra with tunnels in between with the view along the tetragonal axis is shown in Figure 5, showing the 2 × 2 tunnels. The Mn-O bond distances in each octahedra are approximately four of 1.93 and two of 1.91 Å. The antiferromagnetic order is shown by the different shading of the Mn O octahedra. We can see that the columns of edge-sharing octahedra have ferromagnetic coupling, but have antiferromagnetic coupling to the nearest corner sharing octahedra. This is the antiferromagnetic order found more stable in previous calculations [50].
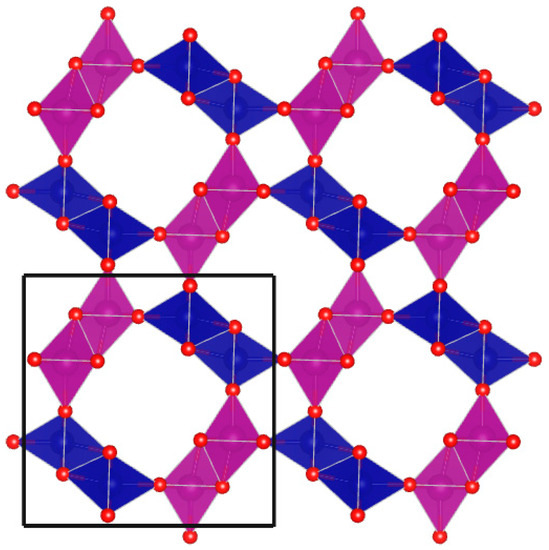
Figure 5.
MnO2 plane view perpendicular to the tetragonal axis. The unit cell used in the calculation is shown by the black borders. The oxygen atoms are red, and the purple/blue shade represents Mn octahedra with up/down spins in the antiferromagnetic order.
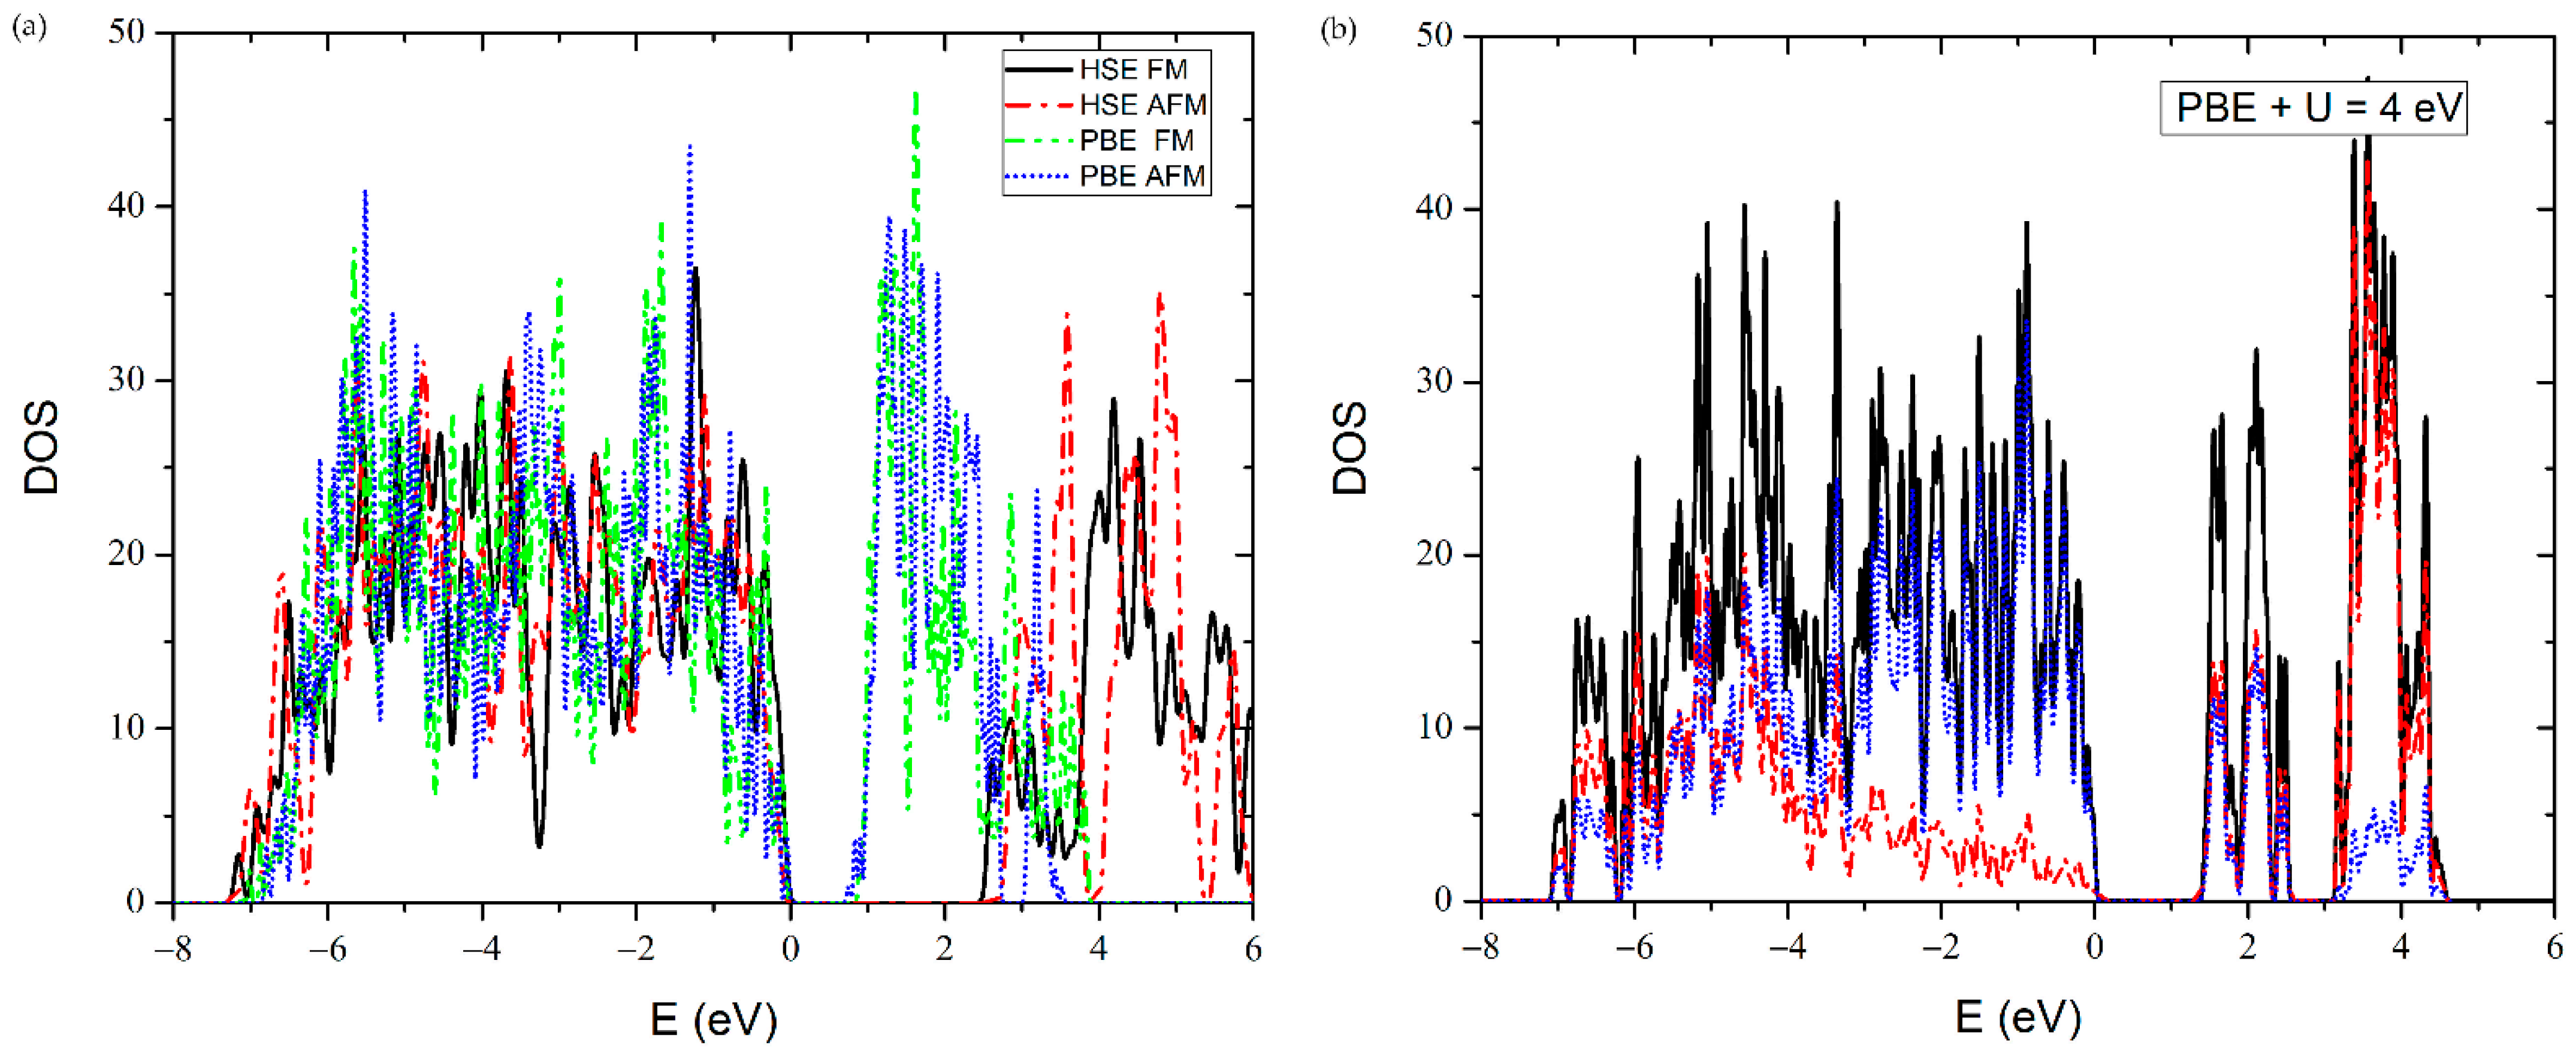
We calculated the bandgap and density of states using ab initio calculations, using the generalized gradient approximation of Perdew, Burke, and Ernzerhof (PBE) [51], PBE + U with U = 4 eV for the Mn d electrons, and screened hybrid functional from Heyd, Scuseria and Ernzerhof HSE06 [52], using norm-conserving pseudopotentials [51,53] with quantum espresso [54,55]. PBE is a semi-local density functional that provides reasonable properties; however, it usually underestimates band gaps. The DFT + U considers an additional correction that can improve the description of correlated systems. We have used the Dudarev approach [56]. HSE06, which calculates exact exchange at short-range, generally improves upon PBE, and particularly the band gaps are much closer to the experiment, but at a higher computational cost. Experimental lattice parameters were used and the ionic forces were minimized to values less than 3.3 mRy/au in the PBE approximation [57] with ferromagnetic spin polarization. The structure was left fixed for the other calculations, with both ferromagnetic and antiferromagnetic orders. The density of states is shown in Figure 6a. A bandgap of ~2.4 eV can be seen for the FM case, with a slightly larger gap of 2.7 eV for the AFM case. The values are higher than the experimental gaps. While quantum confinement in small-diameter nanowires is expected to increase the bandgap concerning bulk samples, our periodic calculations overestimate it; the difference could be due to excitonic effects, which are known to be large in nanowires [58]. PBE and PBE + U result in bandgaps closer to our experimental values, and close to 0.9 eV for the FM state and 0.8 eV for the AFM state. The PBE + U results in the band gap of 1.3 eV, also close to our experimental indirect band gap for the black sample and in line with a different calculation [50] and a different measurement [39]. The PBE + U DOS is shown in Figure 6b, in this case also with projections of the main states contributing to the density of states, Mn3d and Op. O states have a more important contribution close to the top of the valence band, but otherwise both states contribute similarly in the energy range shown.

Figure 6.
(a) The total density of states for ferromagnetic (FM) and antiferromagnetic (AFM) cases with HSE, and PBE.. The zero-energy is set to the valence band maximum. (b) PBE + U DOS with projections for Mn d (red) and O p (blue) states (AFM).
3.5. Scanning Electron Microscopy
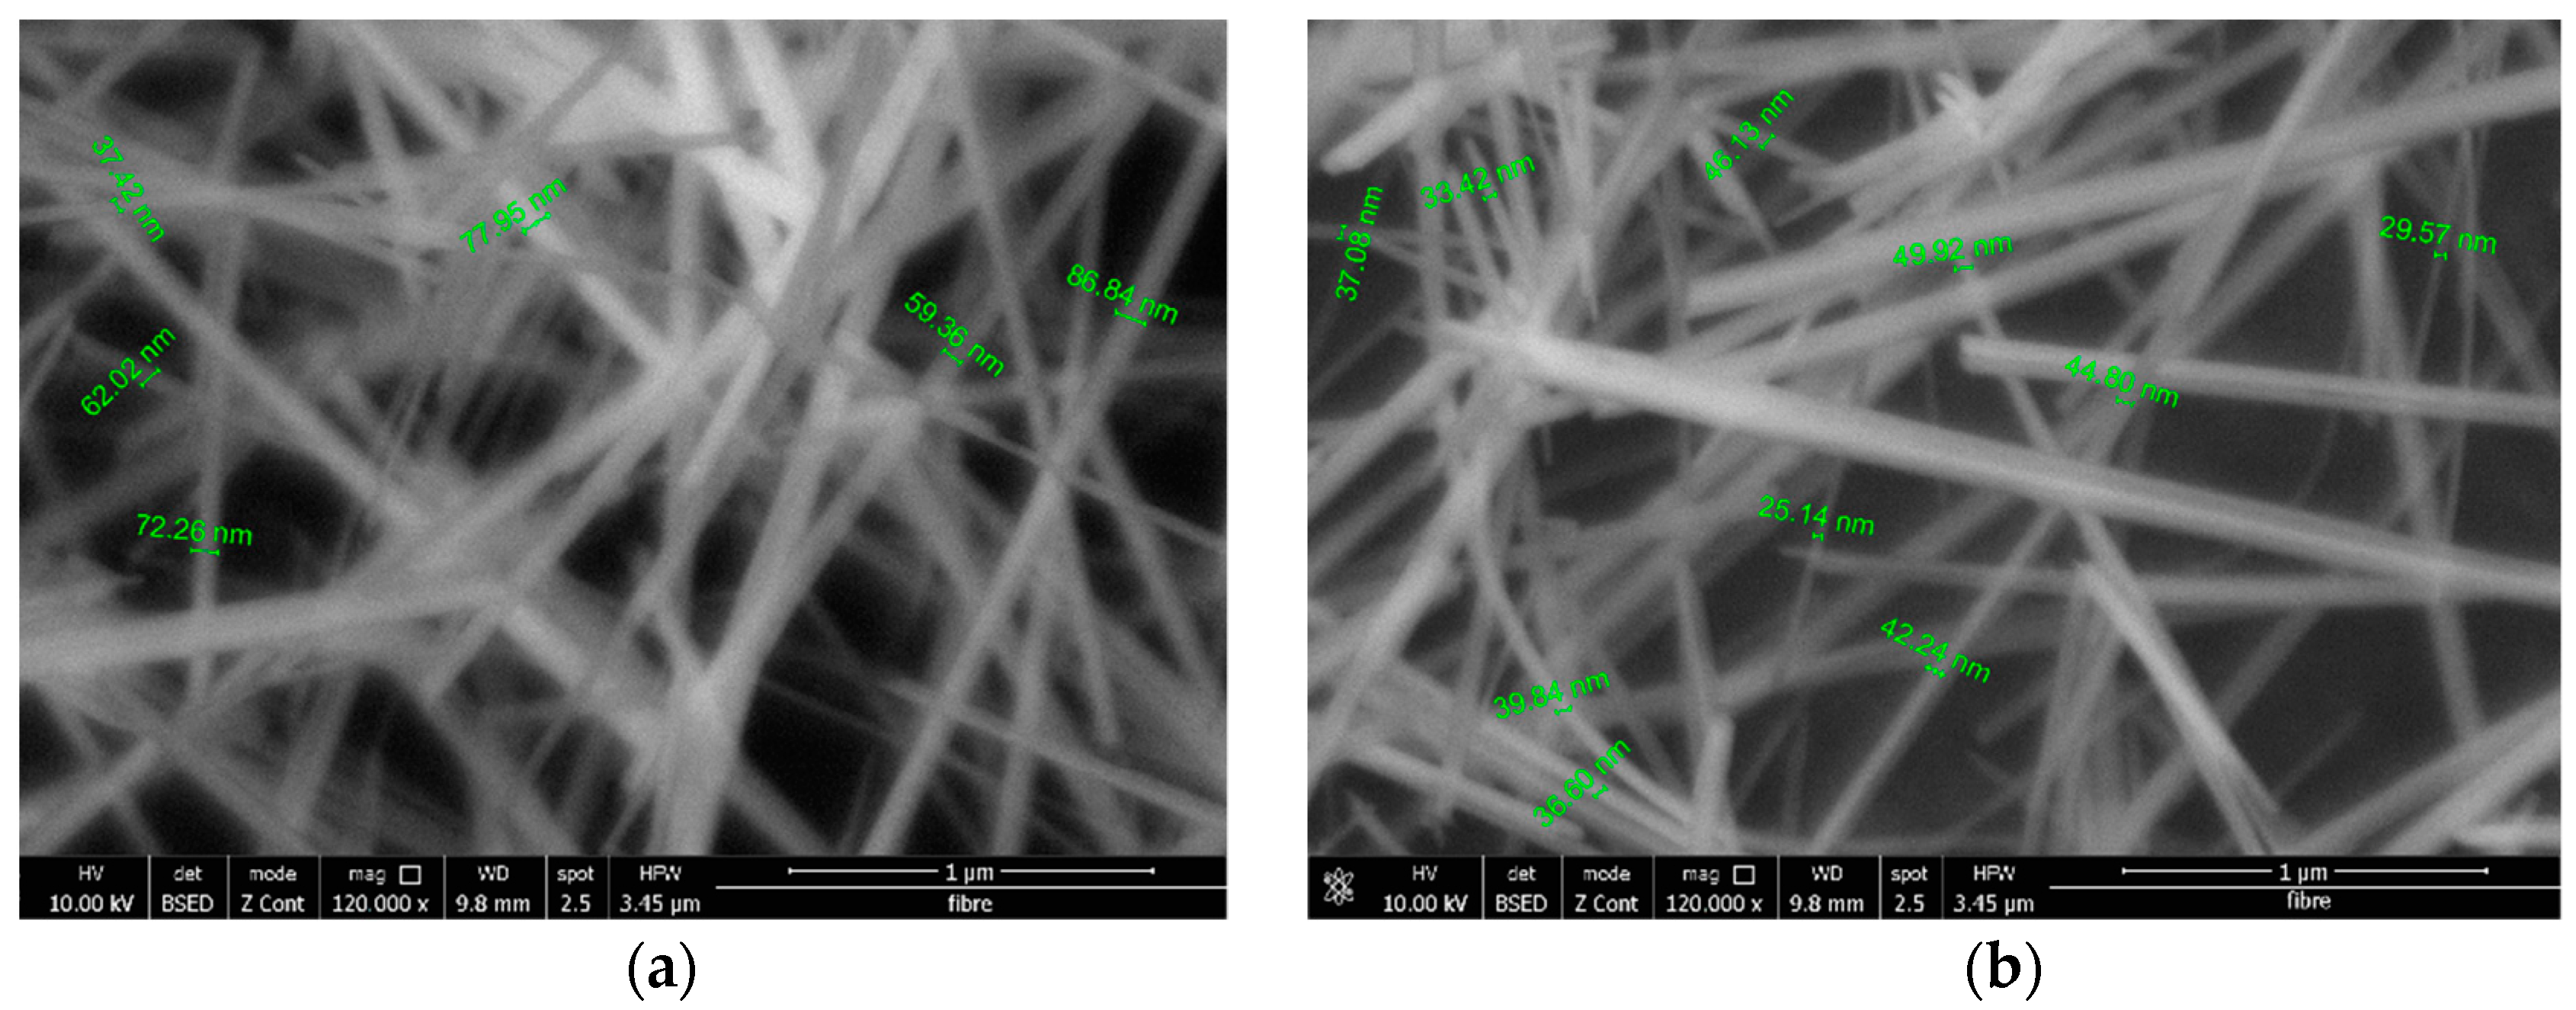
The morphologies of the black and brown α-MnO2 samples studied by SEM and recorded in micrographs are presented in Figure 7. The micrographs recorded at 120,000 magnification of both black and brown α-MnO2 present particles with nanowire morphology having a clearly-defined and uniform geometry with diameters between 20 and 90 nm and several micrometers in length.
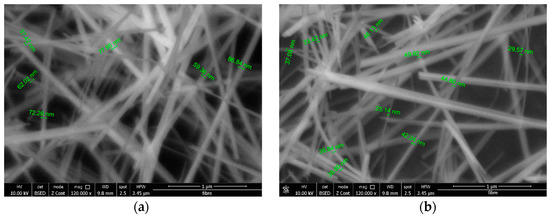
Figure 7.
SEM micrographs of nanowires were obtained on the brown α-MnO2 (a) and the black α-MnO2 (b).
The average diameters of nanowires obtained through the hydrothermal method in this paper are comparable with those obtained by Corpuz et al. [59] of 26 ± 5 nm but with mixed morphology of nanoflowers and nanowires using hydrothermal prolonged synthesis from one to seven days at T = 140 °C.
3.6. Thermal Analysis
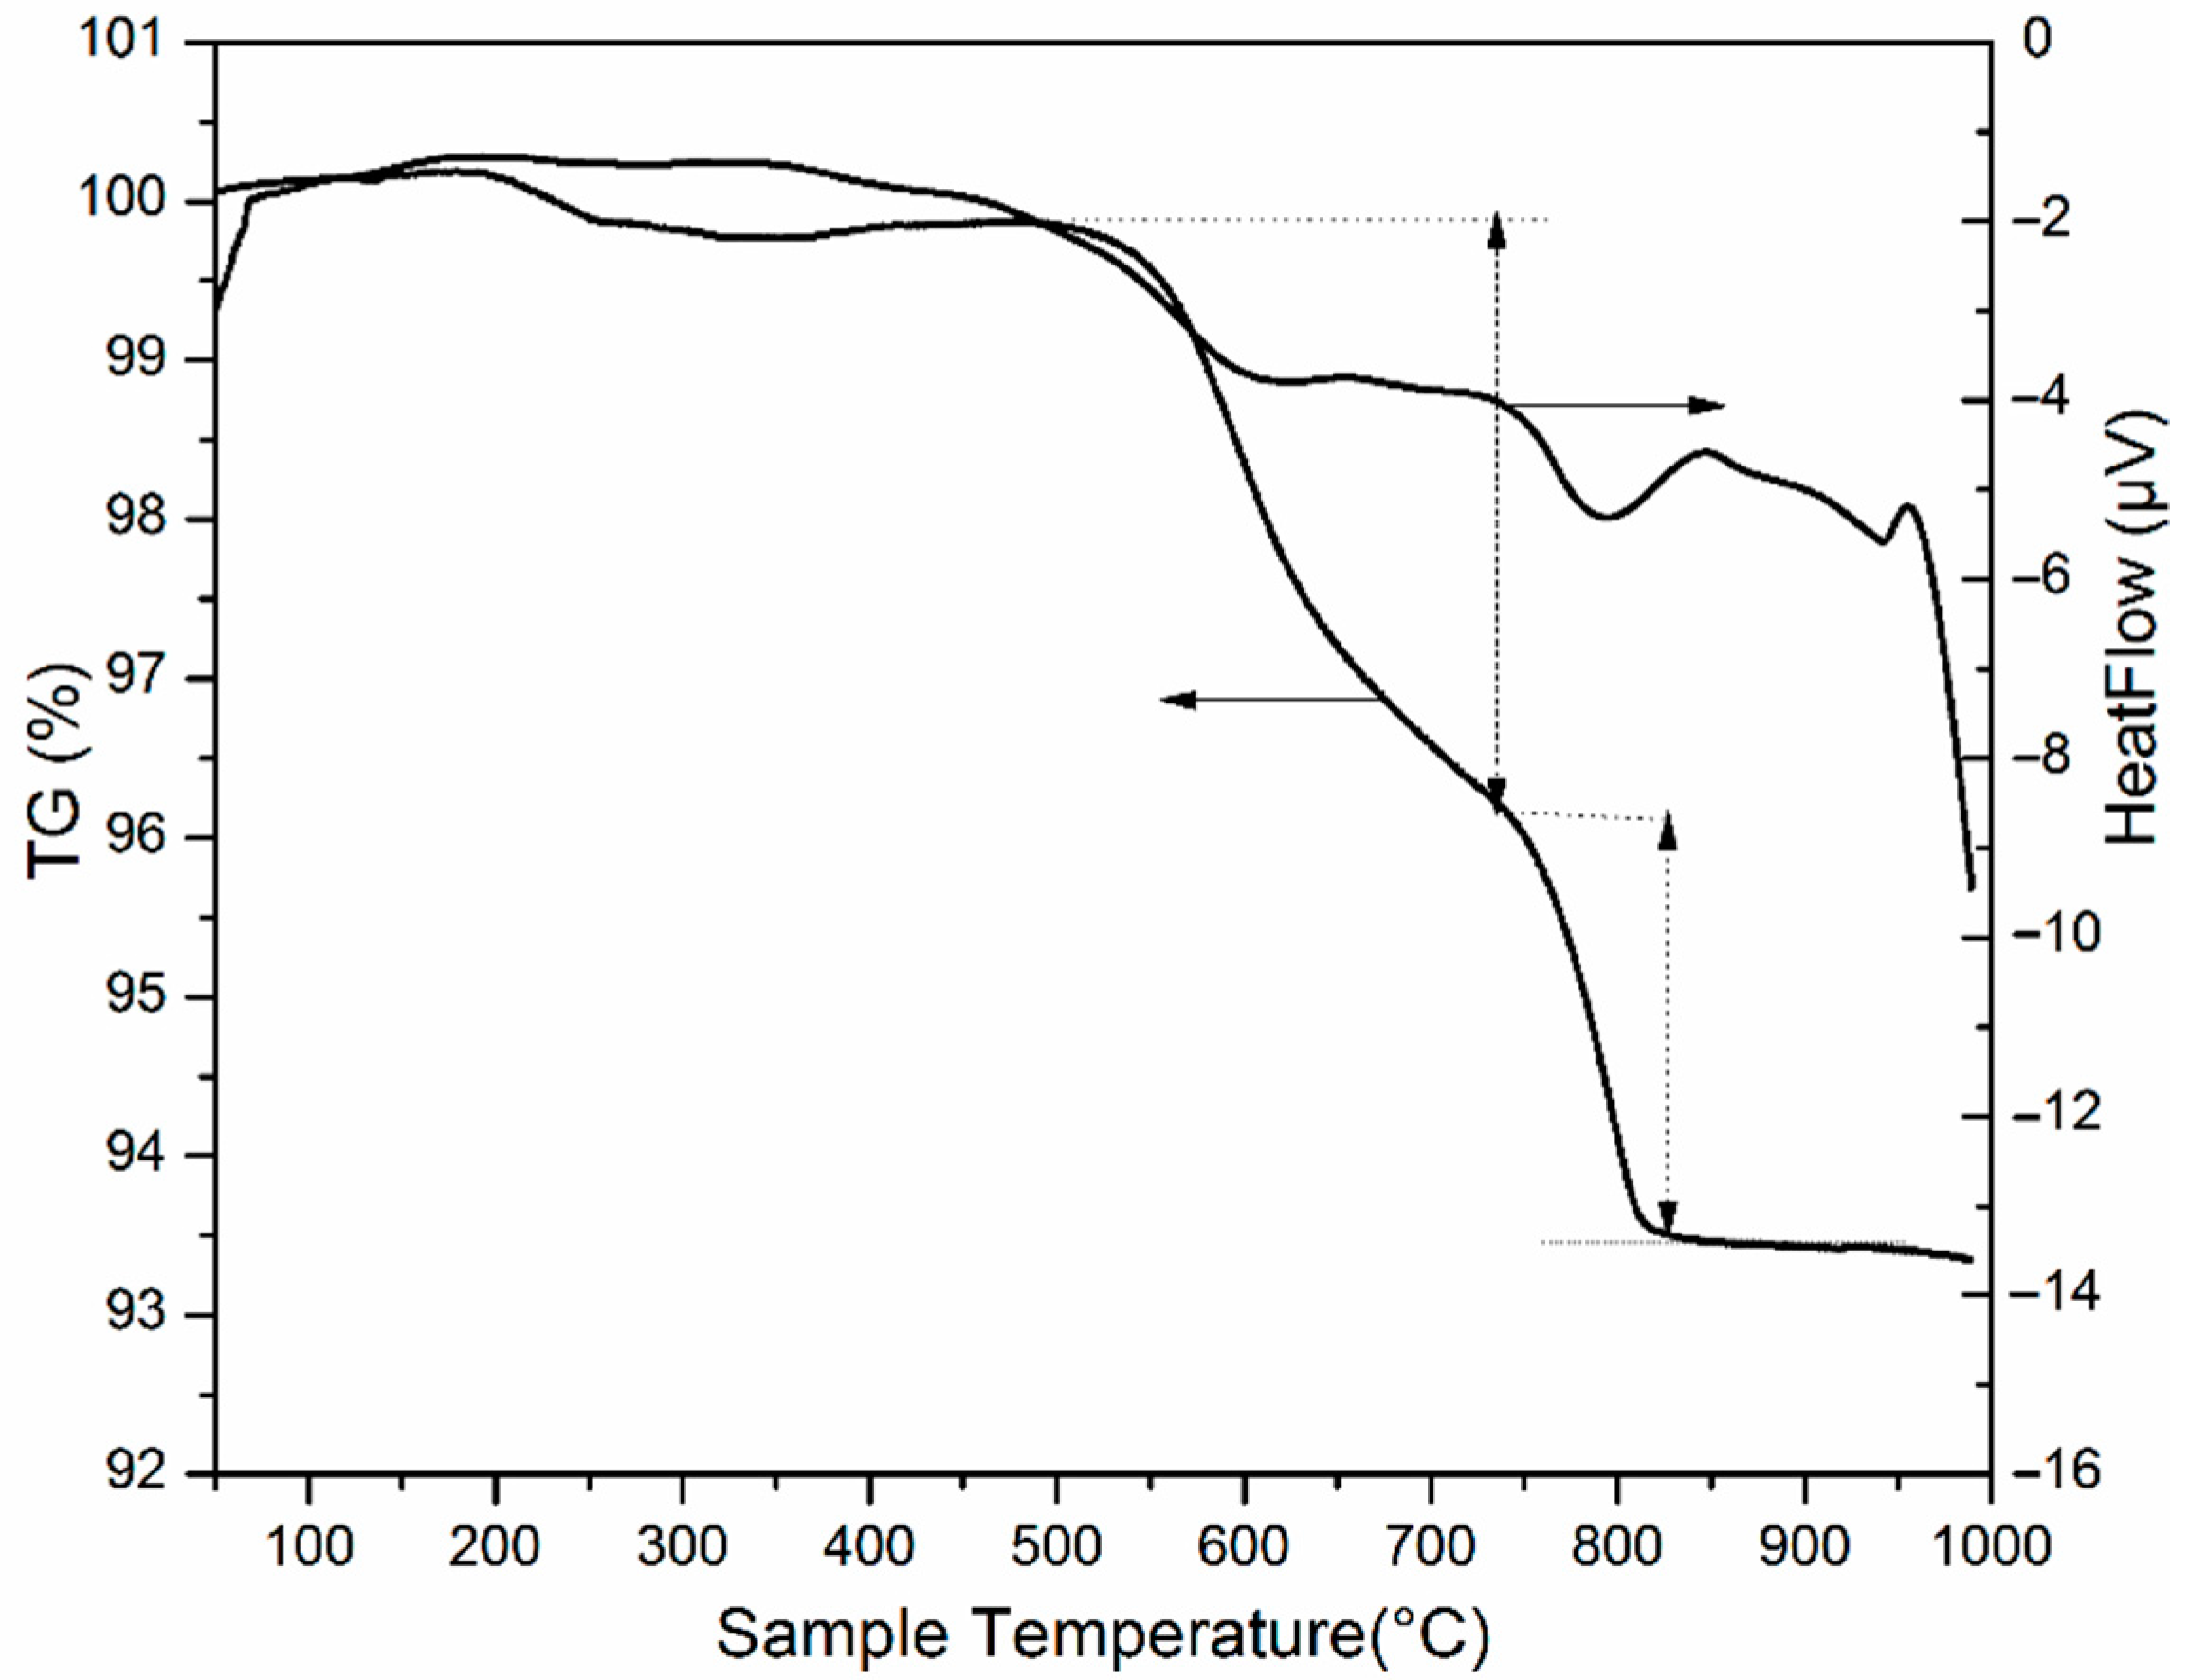
The thermal gravimetric (TG) and differential thermal analysis (DTA) curves, obtained for the powder α-MnO2 synthesized using the hydrothermal method, are presented in Figure 8 and were recorded in the 50 ÷ 1000 °C range, with a heating rate of 10 °C/min, using alumina crucibles.
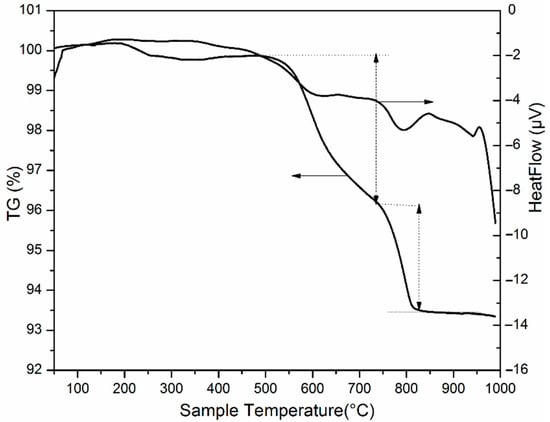
Figure 8.
Thermal gravimetric analysis (left) and DTA (right) curves for the powder MnO2 type α-MnO2 synthesized using the hydrothermal method.
The thermogram curve and its derivative show three main stages of weight loss. Under inert conditions, the DTA curve of the sample shows three endothermic peaks. These peaks, located at 260 °C, 615 °C, 795 °C, and 942 °C, indicate the phase transformations occurring in the sample.
The first step of thermal decomposition occurs between 200 °C and 260 °C with a small mass loss of ~0.35%, which is due to the loss of loosely bound water and indicates the sample is hygroscopic [35]. The second mass loss of 3.7%, in the temperature range of 500 to 735 °C, is attributed to chemical transformations such as the reduction in Mn(IV) and probably the formation of Mn2O3. The endothermic peak located at 795 °C appears in the TG curve with a further mass loss of about 2.75% in the 735 ÷ 830 °C range and indicates the second thermal decomposition of MnO2, from the remaining Mn2O3 to Mn3O4 [60].
3.7. Electrochemical Measurements
The electrochemical study conducted on graphite supports modified with compositions containing α-MnO2 led to the identification of the modified electrode with the highest electric double-layer capacitance.
The capacitive current density (idl) was calculated using Equation (4) and the value of the electric double-layer capacitance (Cdl), defined as the capacitance resulting from stored charge in the double-layer region at the electrode/electrolyte solution interface [61], was the absolute value of the slope obtained for the linear dependence between idl and the scan rate [62,63].
where idl (A cm−2) is the capacitive current density; ia (A cm−2) and ic (A cm−2) are the absolute values of the anodic and cathodic current densities, for a given scan rate, at a potential value where only double-layer adsorption and desorption features are present [64,65,66].
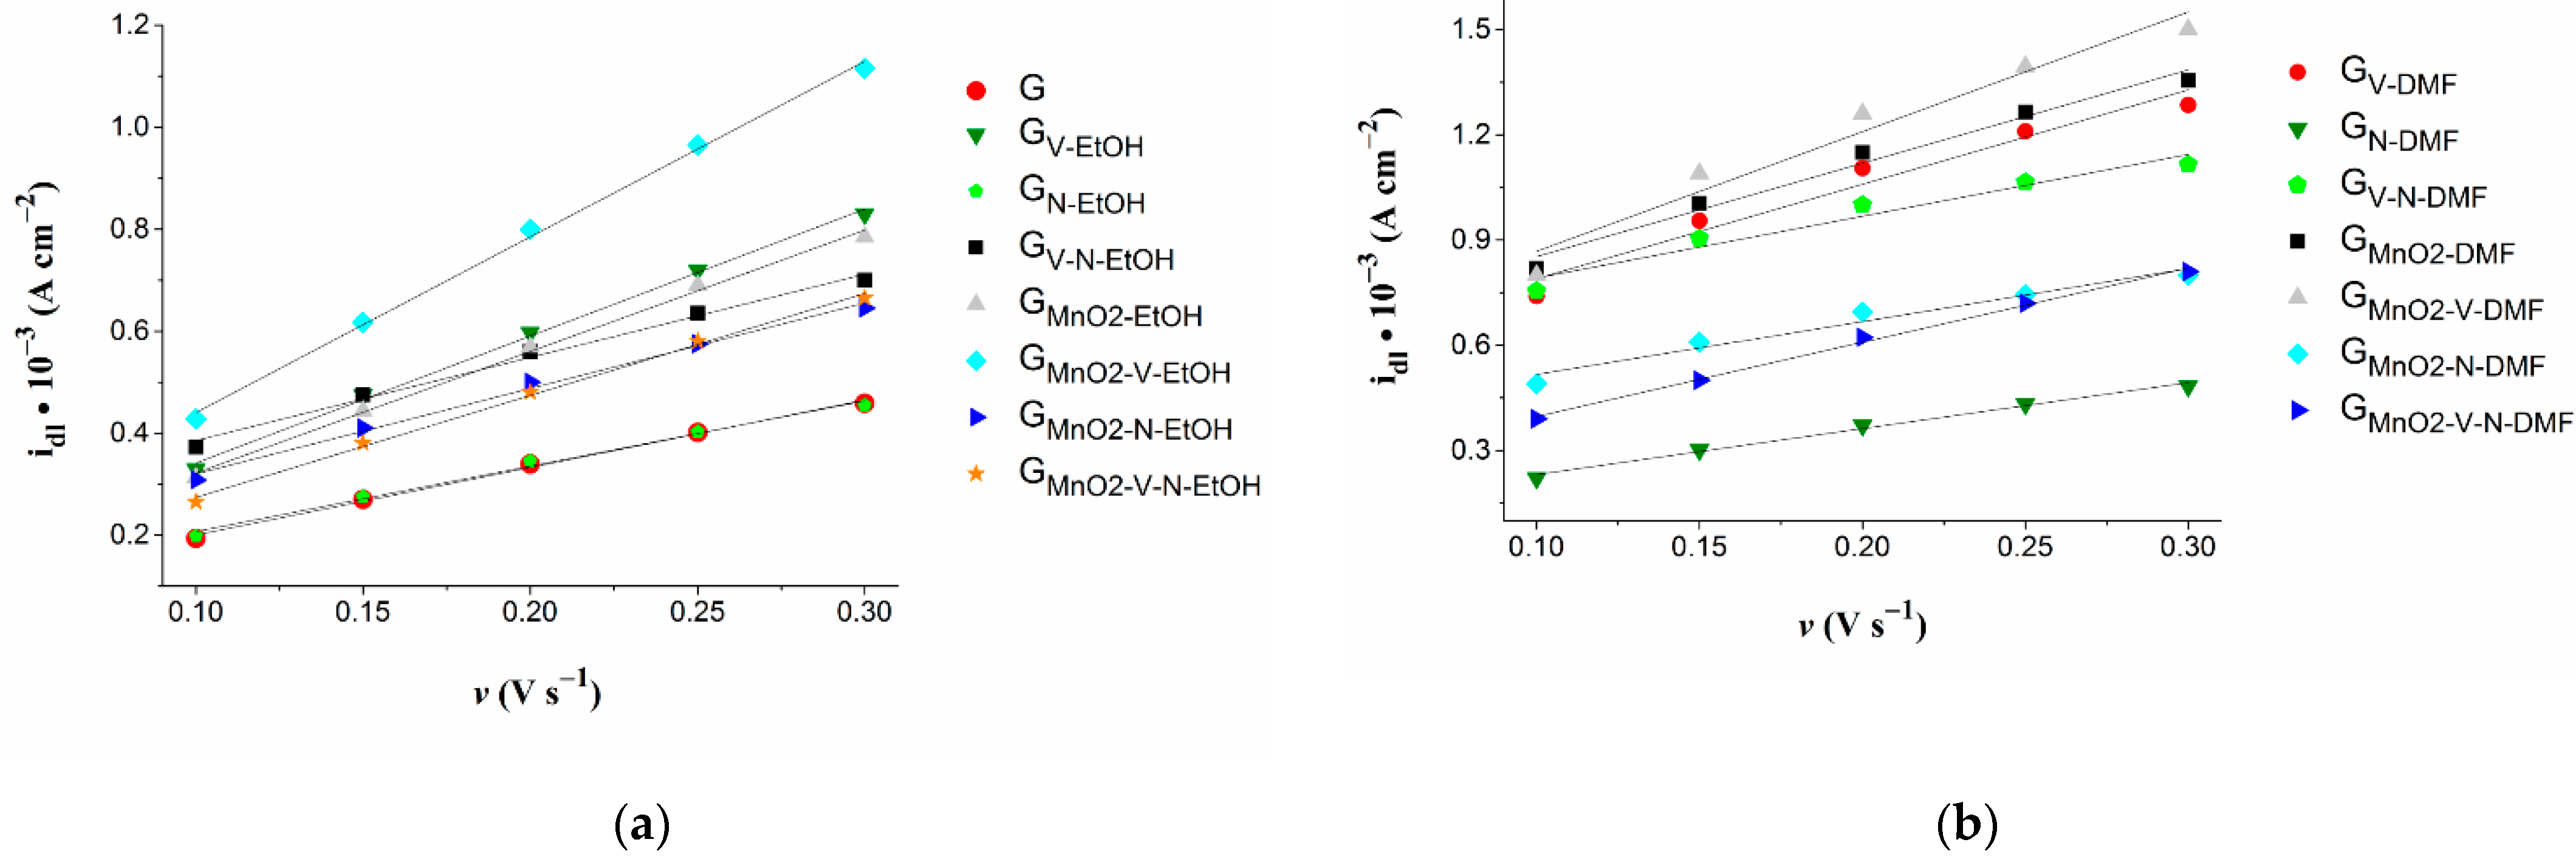
Figure 9a,b show the graphical representations of the dependence between the capacitive current density and the scan rate for the electrodes considered in the study, based on cyclic voltammograms recorded in 0.1 mol L−1 KCl electrolyte solution. The Cdl, R2, roughness factor (Rf) and electrochemically active surface area (EASA) values obtained for all samples are displayed in Table 3.
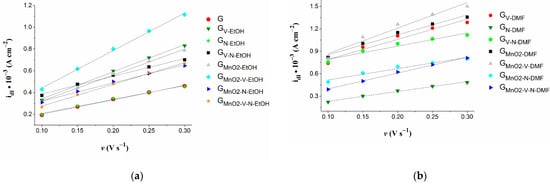
Figure 9.
(a) The plot of the dependence between idl and v for the bare electrode and for the electrodes modified using suspensions in ethanol. (b) The plot of the dependence between idl and v for the electrodes modified using suspensions in DMF.
Table 3.
The Cdl, R2, Rf, and EASA values obtained for the bare and modified electrodes.
The highest Cdl value was determined for GMnO2-V-EtOH, in which case the slope of the linear dependence between idl and v was equal to 3.444 mF cm−2. The Cdl value can also be expressed in mF by taking into account the geometrical surface of the working electrode, and for the mentioned sample it is 0.964 mF. The linear increase in idl with the scan rate indicates the charging and discharging of the Helmholtz double-layer [67] and that the composition applied on the surface of the graphite support acted as a simple capacitor in the scanned potential range [68].
A similar Cdl, of 3.41 mF cm−2, was obtained for GMnO2-V-DMF, but in this case the R2 value was quite small (0.9584).
To estimate the roughness factor, defined as the ratio between the real and geometric surface areas, the Cdl values of the studied electrodes were divided by 60 µF cm−2, which is usually considered as the specific capacitance of a smooth oxide surface [69]. The EASA was estimated by expressing the Cdl value in mF and dividing it by the specific capacitance [62]. The highest Rf and EASA values were calculated for GMnO2-V-EtOH.
Since the electrochemical characterization of the modified electrodes is in terms of their electric double-layer capacitance, and a parameter of importance in the field of supercapacitors [70] revealed that the highest value belonged to GMnO2-V-EtOH, it can be concluded that out of the investigated samples this electrode is the most likely to find application in the respective domain. However, for a conductive support modified with the synthesized α-MnO2 nanowires in a mixture with Vulcan carbon to actually be used in supercapacitors, further studies are required that include the testing of different deposition methods and amounts of materials.
3.8. Catalytic Experiments
A comparison between the RhB degradation over MnO2 under solar irradiation and in dark conditions at pH = 3 is emphasized in Figure 10. After two hours of reaction, the degradation of RhB reached 74% under dark conditions.
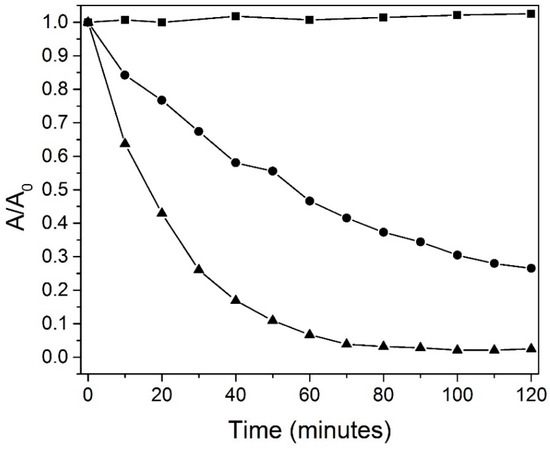
Figure 10.
The degradation of RhB at pH = 3 is expressed by the A/A0 ratio in the dark (marked with ●), under solar irradiation (marked with ▲) in the presence of a catalyst, and under solar irradiation without a catalyst (photolysis, marked with ■).
Enhanced results were obtained under solar irradiation so that only after 30 min did it reach the degradation of 74% and the maximum degradation of 97.2% was obtained after 90 min, with 50% higher than the degradation resulting under dark conditions. As the RhB aqueous solution was stable under solar irradiation, the reaction occurred because of the catalytic and respectively photocatalytic activities of MnO2.
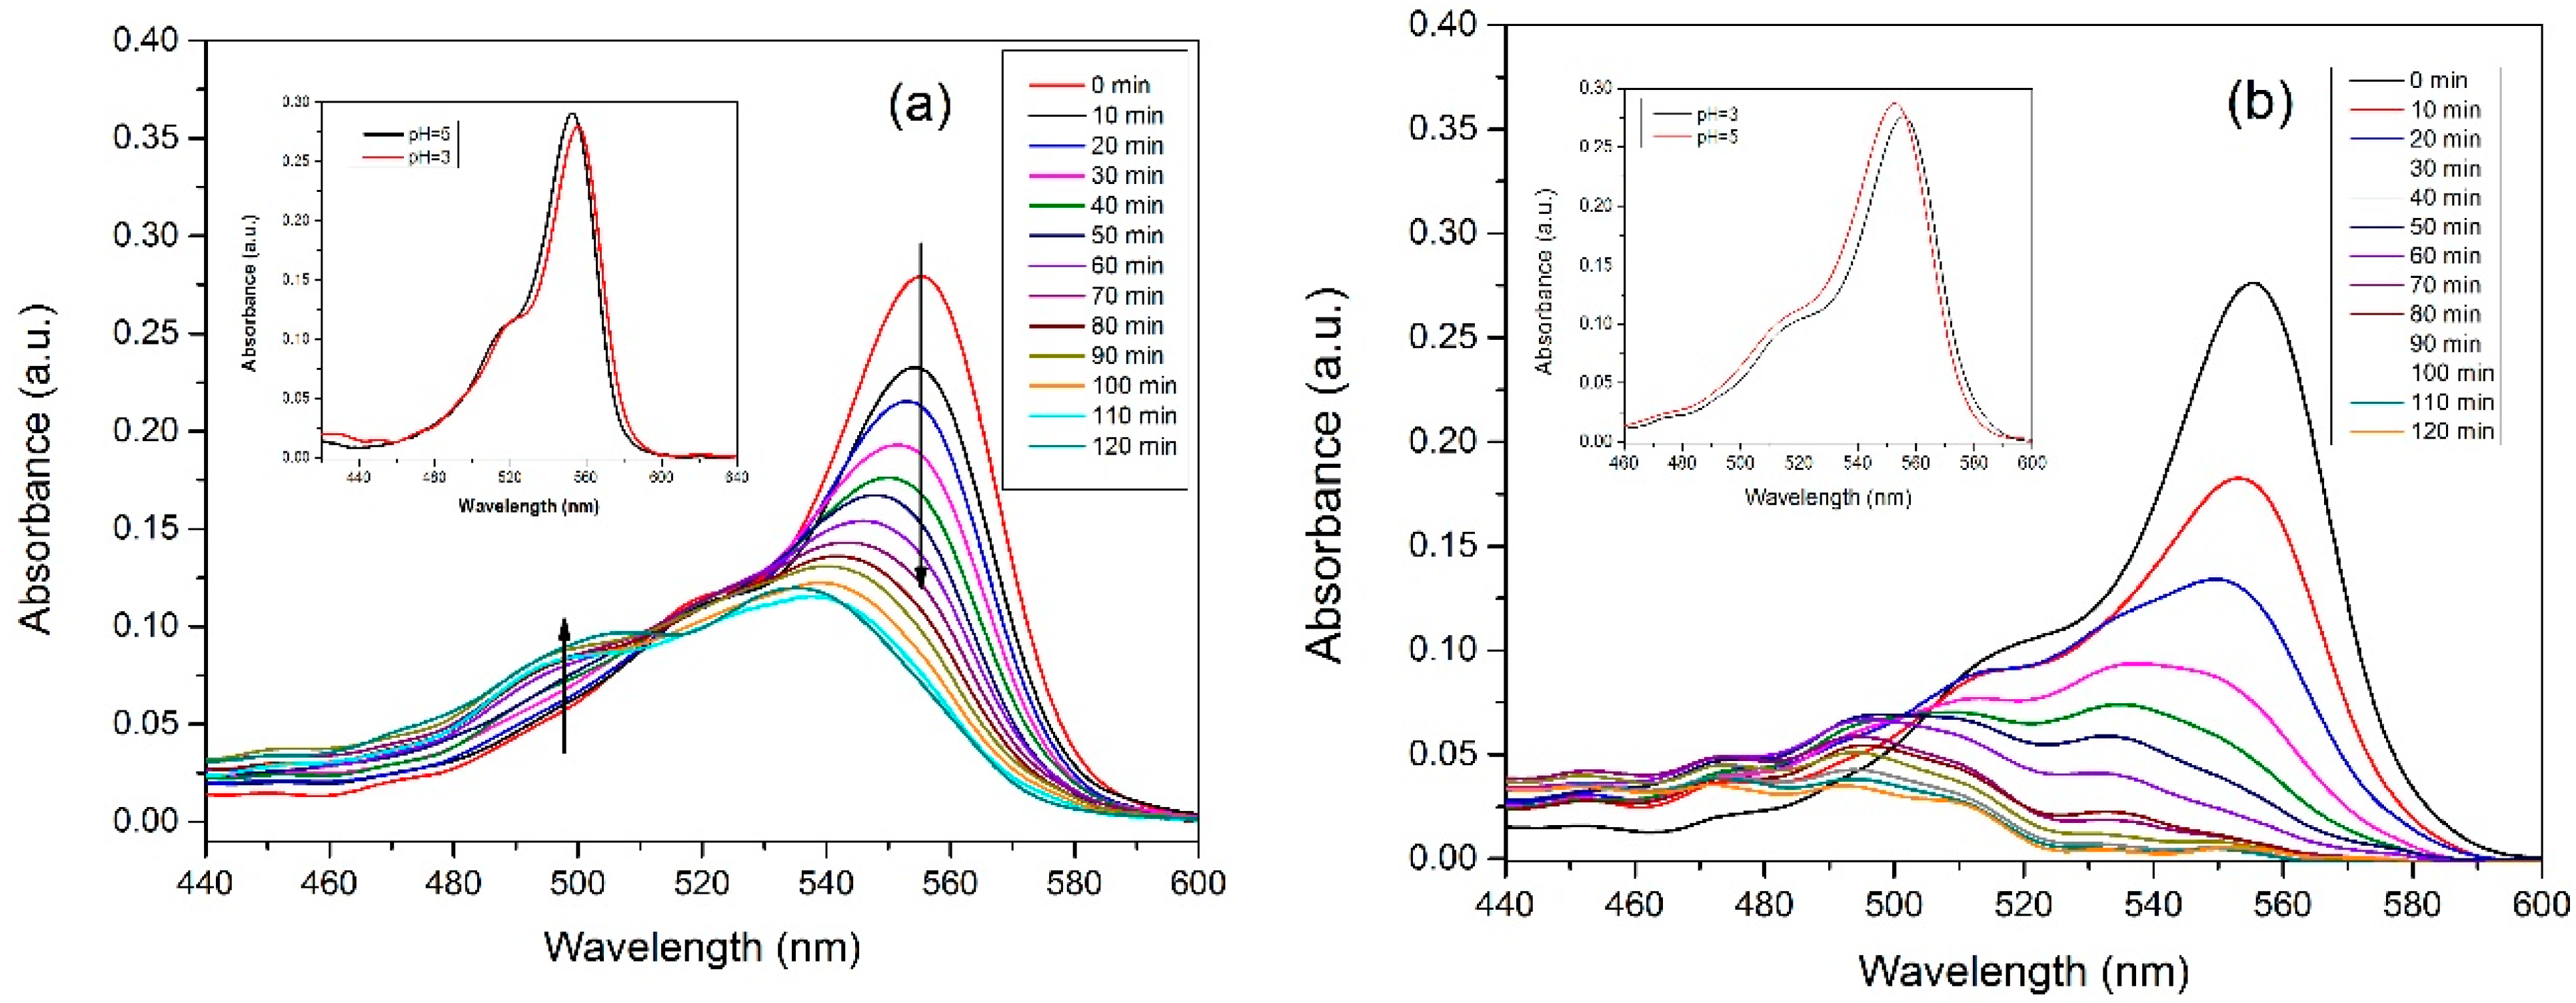
In the time-dependent visible spectra obtained for the RhB aqueous solution during the catalytic and photocatalytic reactions over α-MnO2 (Figure 11), it can be noticed that major changes in shape have occurred for the absorbance peaks with the maximum absorption at 556 nm and respectively at 498 nm. As shown in the inset of Figure 11, the rhodamine B solution displayed a large band in the visible region with the maximum absorbance at 553 nm, which can be ascribed to π→π* electronic transitions of the dye monomer and a shoulder at 515 nm corresponding to dimers [71,72]. In the acidic medium, a redshift occurred, from λmax = 553 nm to λmax = 556 nm, that was due to the carboxylic group dissociation as a result of interaction between RhB and the acid [73,74]. During the catalytic reaction, it can be observed that the characteristic peak of RhB shifted to lower wavelength values (λmax around 539 nm) simultaneously with the appearance of a peak at λmax = 498 nm. This suggests that the RhB catalytic degradation mechanism followed a deethylation pathway and the presence of the absorbance bands at λmax = 541 nm (t = 80 min) and λmax = 498 nm can be attributed, as reported in the literature, to the N-deethylated intermediates: N,N-diehyl-N’-ethyl-rhodamine 110 (DMRh) and rhodamine 110 (Rh110) [75,76,77].
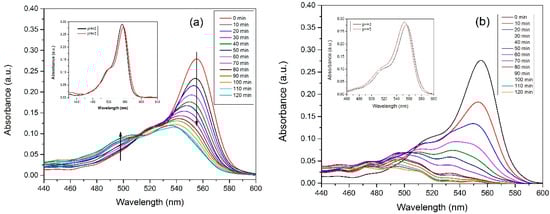
Figure 11.
The peak shape evolution of RhB aqueous solution overtime during the reaction of (a) catalytic and (b) photocatalytic RhB degradation; inset—the redshift of the absorption spectrum for the initial RhB aqueous solution with a variation of the solution pH.
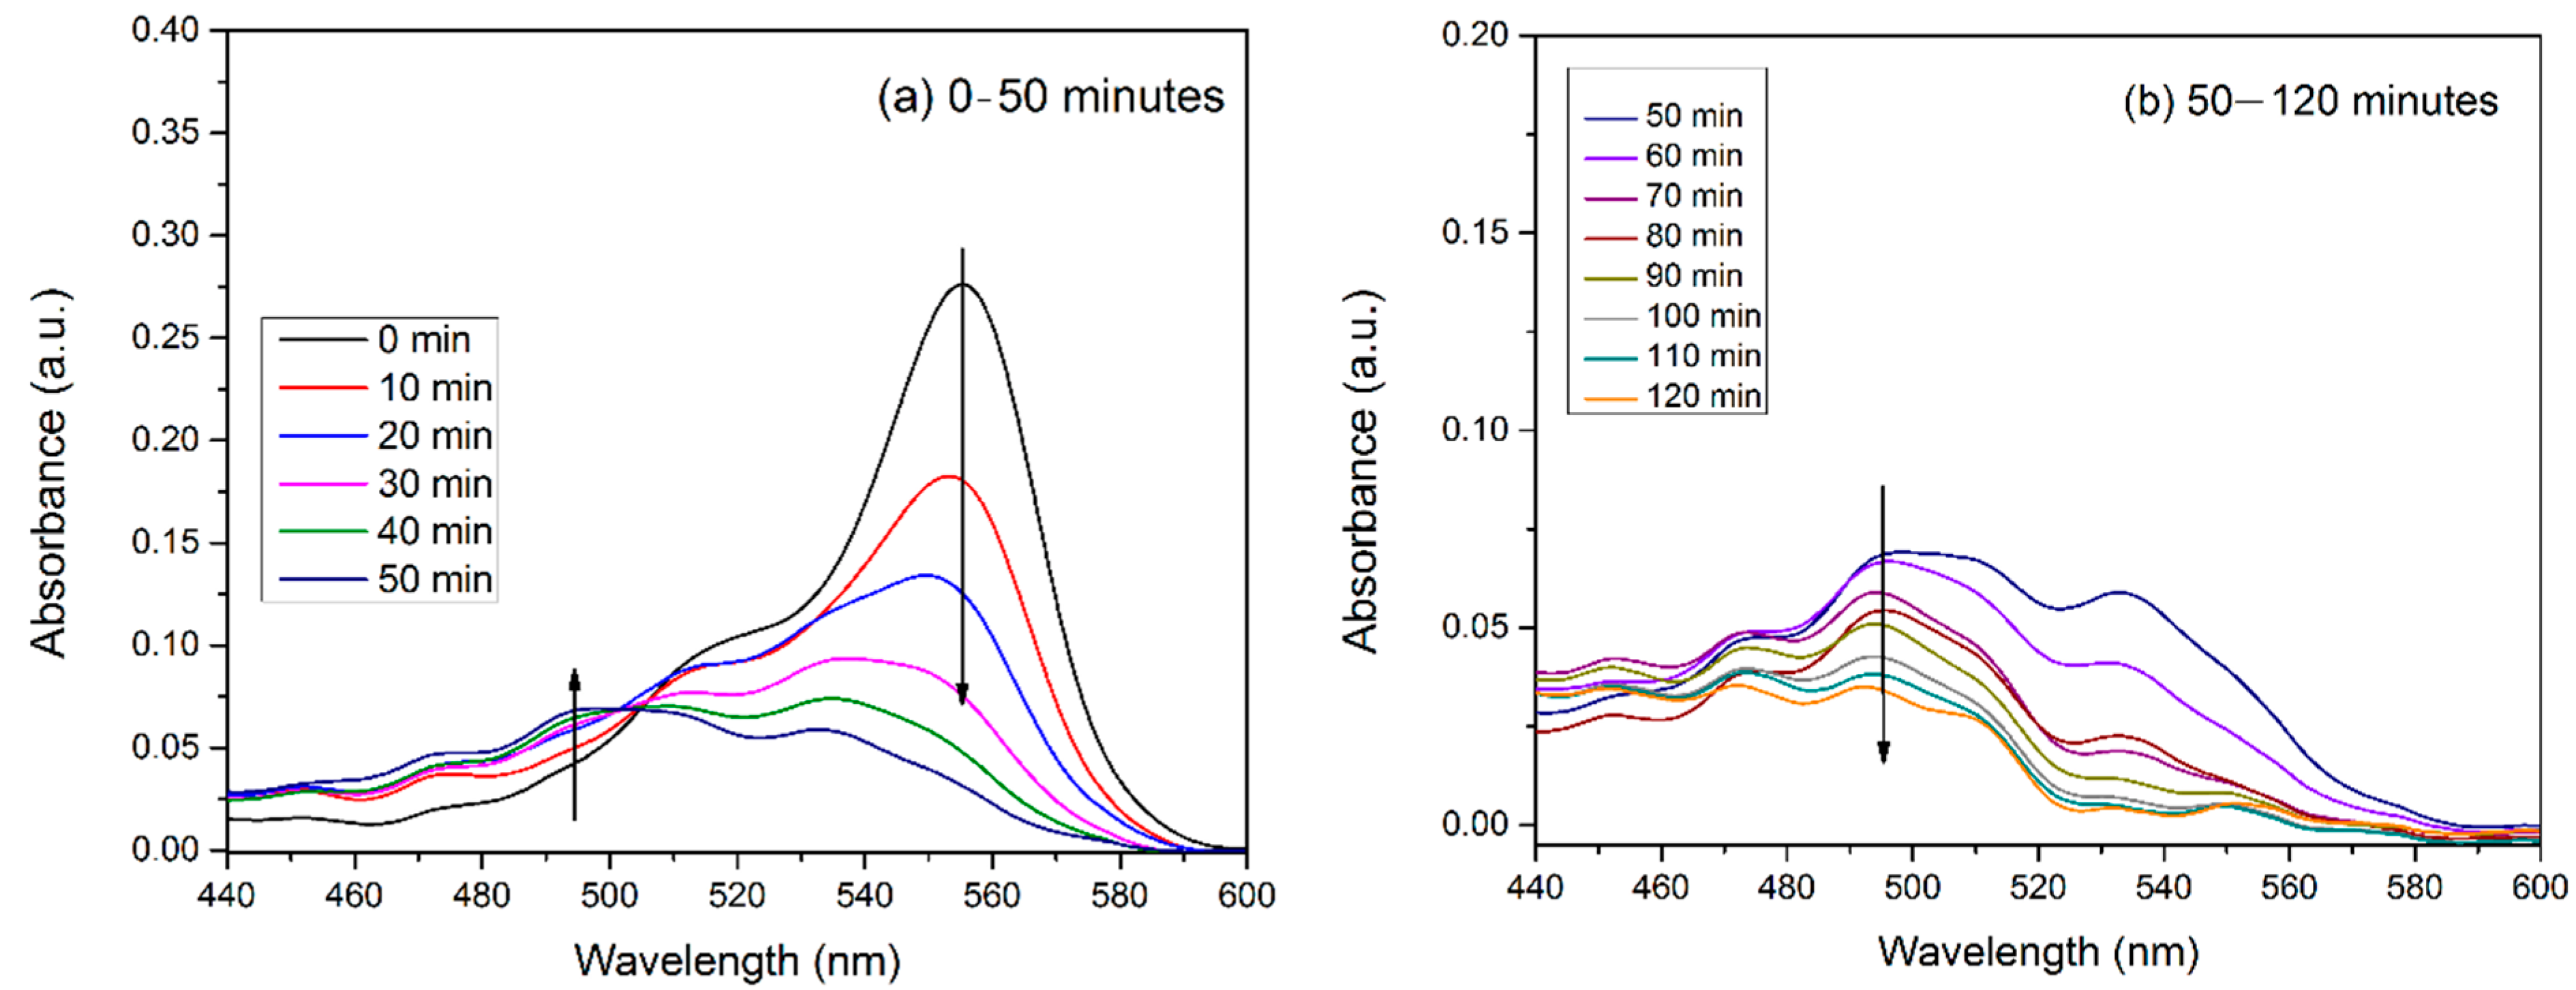
The hypsochromic shift, the decrease in the intensity of the RhB characteristic absorbance band, and the formation of peaks at λmax around 513 nm and 494 nm (Figure 12), which are associated with the deethylation process, as in the case of the catalytic reaction process, occurred also for the photocatalytic reaction of RhB degradation over the α-MnO2.
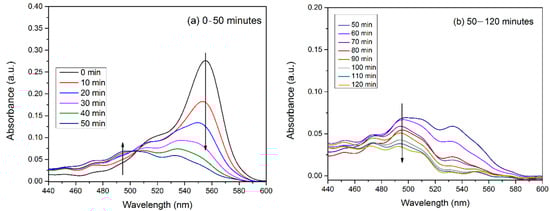
Figure 12.
The absorption spectrum evolution during photocatalytic RhB degradation with emphasis on the RhB degradation byproducts corresponding to absorbance peaks.
The multiple bands corresponding to the N-deethylation byproducts overlapped during the evolution of the photocatalytic reaction and the intermediates identified based on the visible absorbance spectrum analysis by scientific literature were N,N-diehyl-N’-ethyl-rhodamine 110 (λmax = 540 nm, t = 30 min), N-ehyl-N’-ethyl-rhodamine 110 (λmax = 529 nm, t = 90 min), and rhodamine 110 (λmax = 494 nm) [75,78].
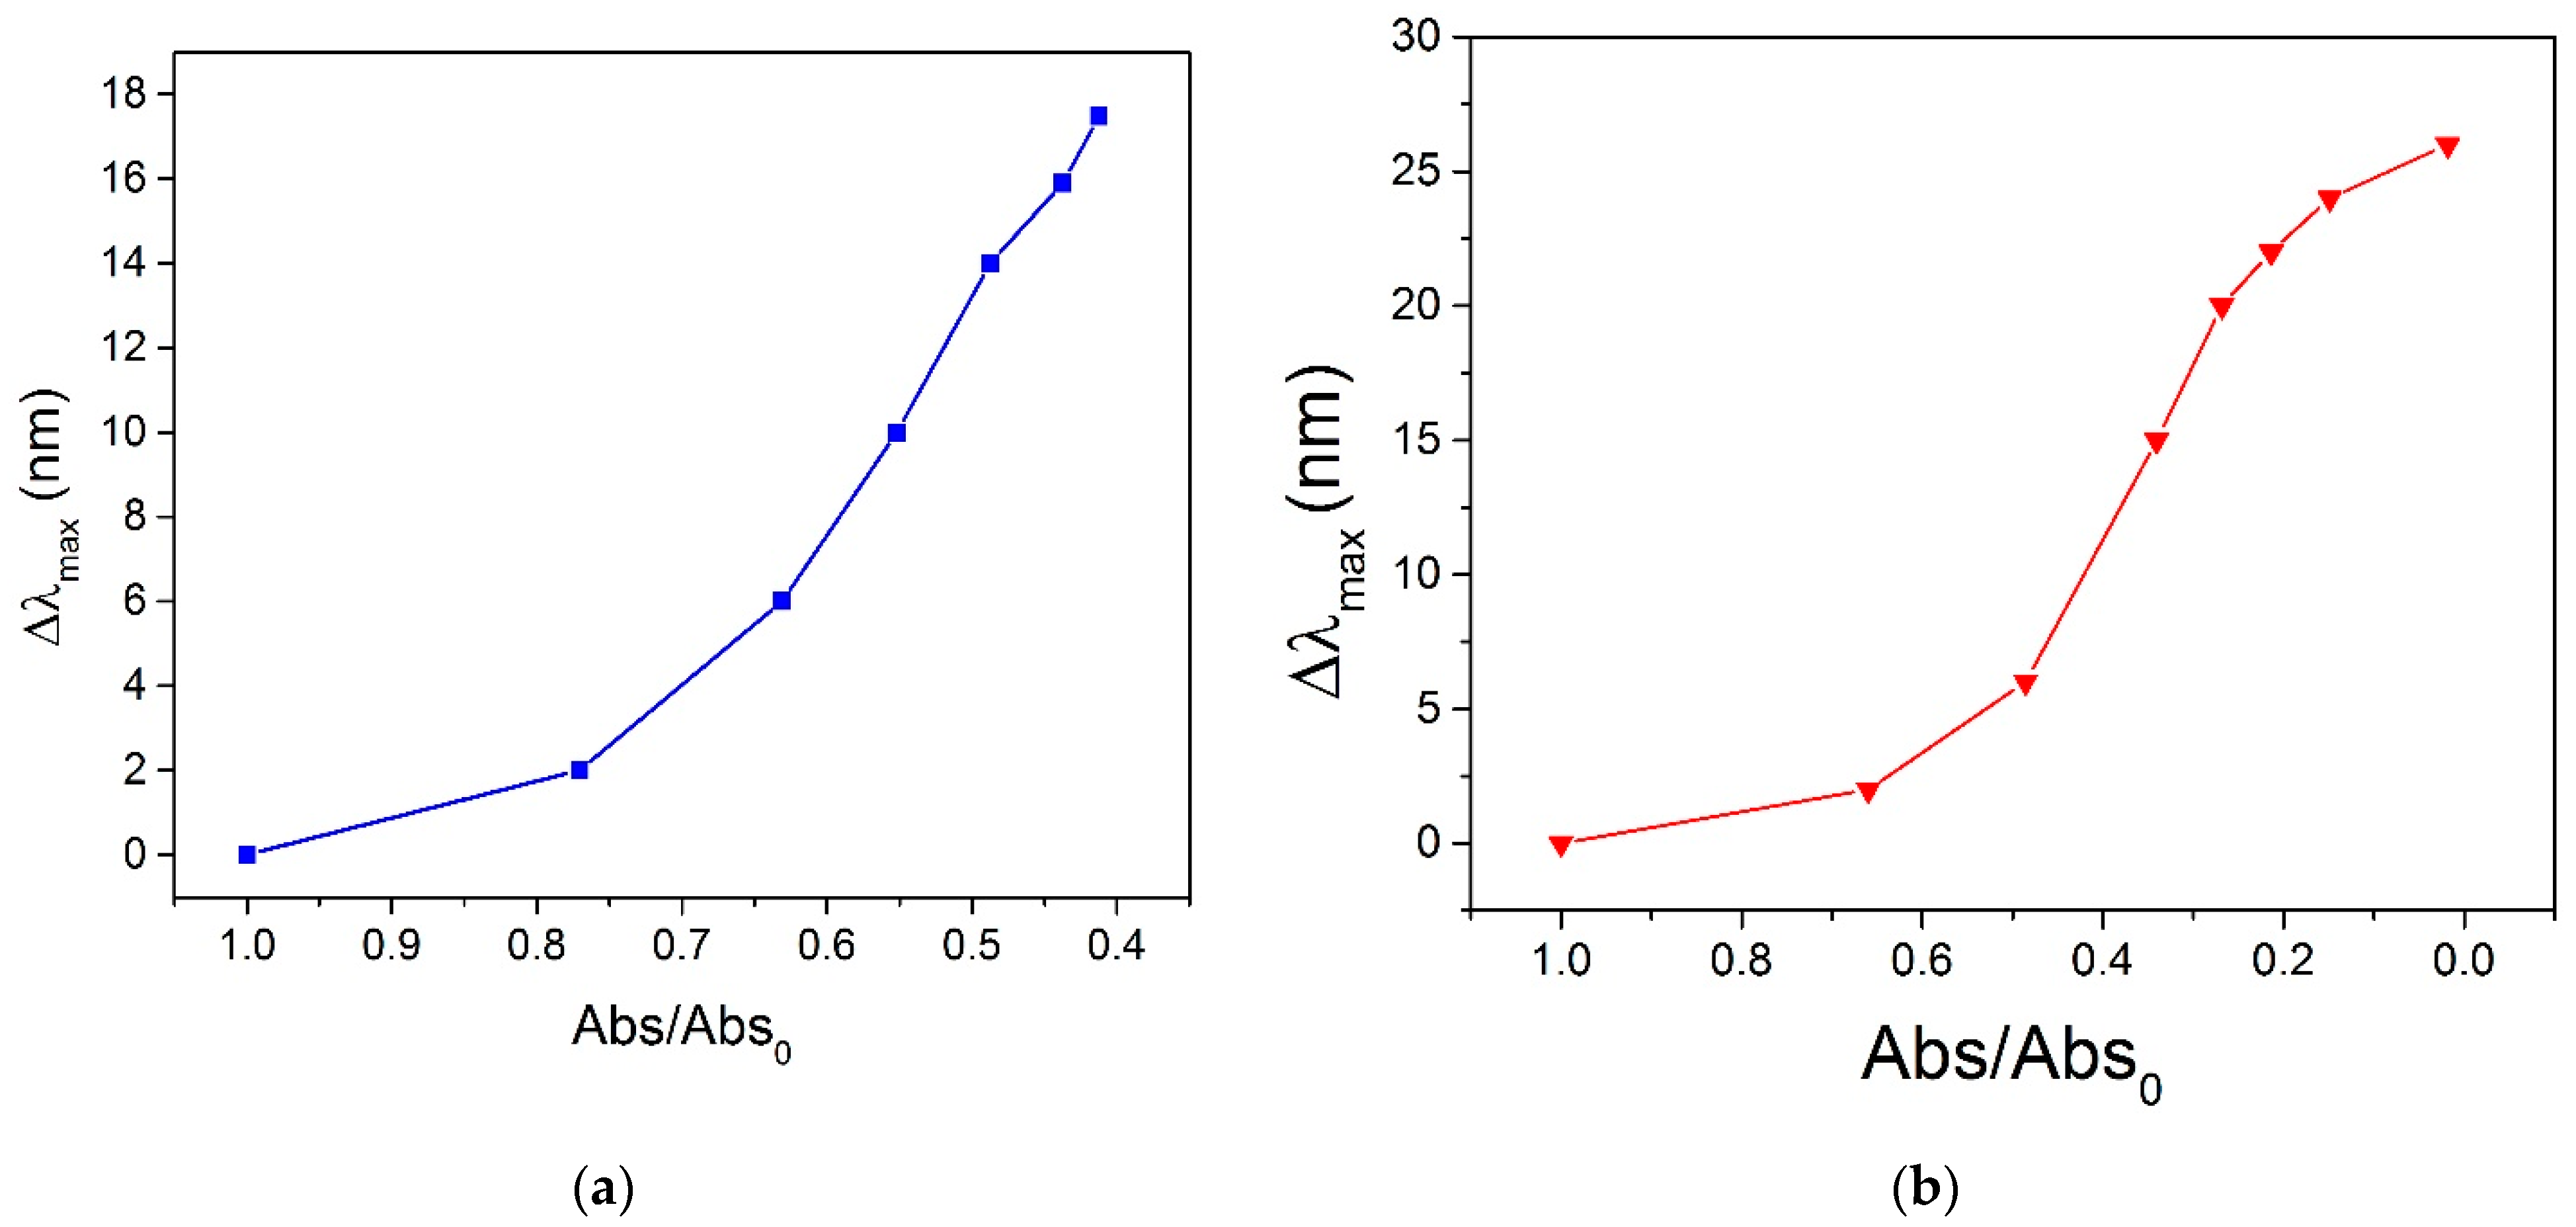
As represented in Figure 13, the hypsochromic shift and the absorbance intensity decrease are higher in the case of the photocatalytic reaction considering that the maximum hypochromic shift and the intensity decrease were 26 nm and 98% under light irradiation and, respectively, 20 nm and 57% under dark condition.
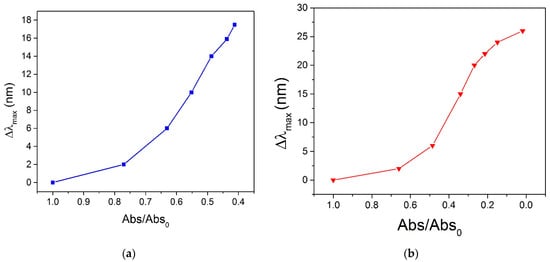
Figure 13.
Hypsochromic shift and intensity decrease of the RhB characteristic peak during (a) catalytic and (b) photocatalytic reactions.
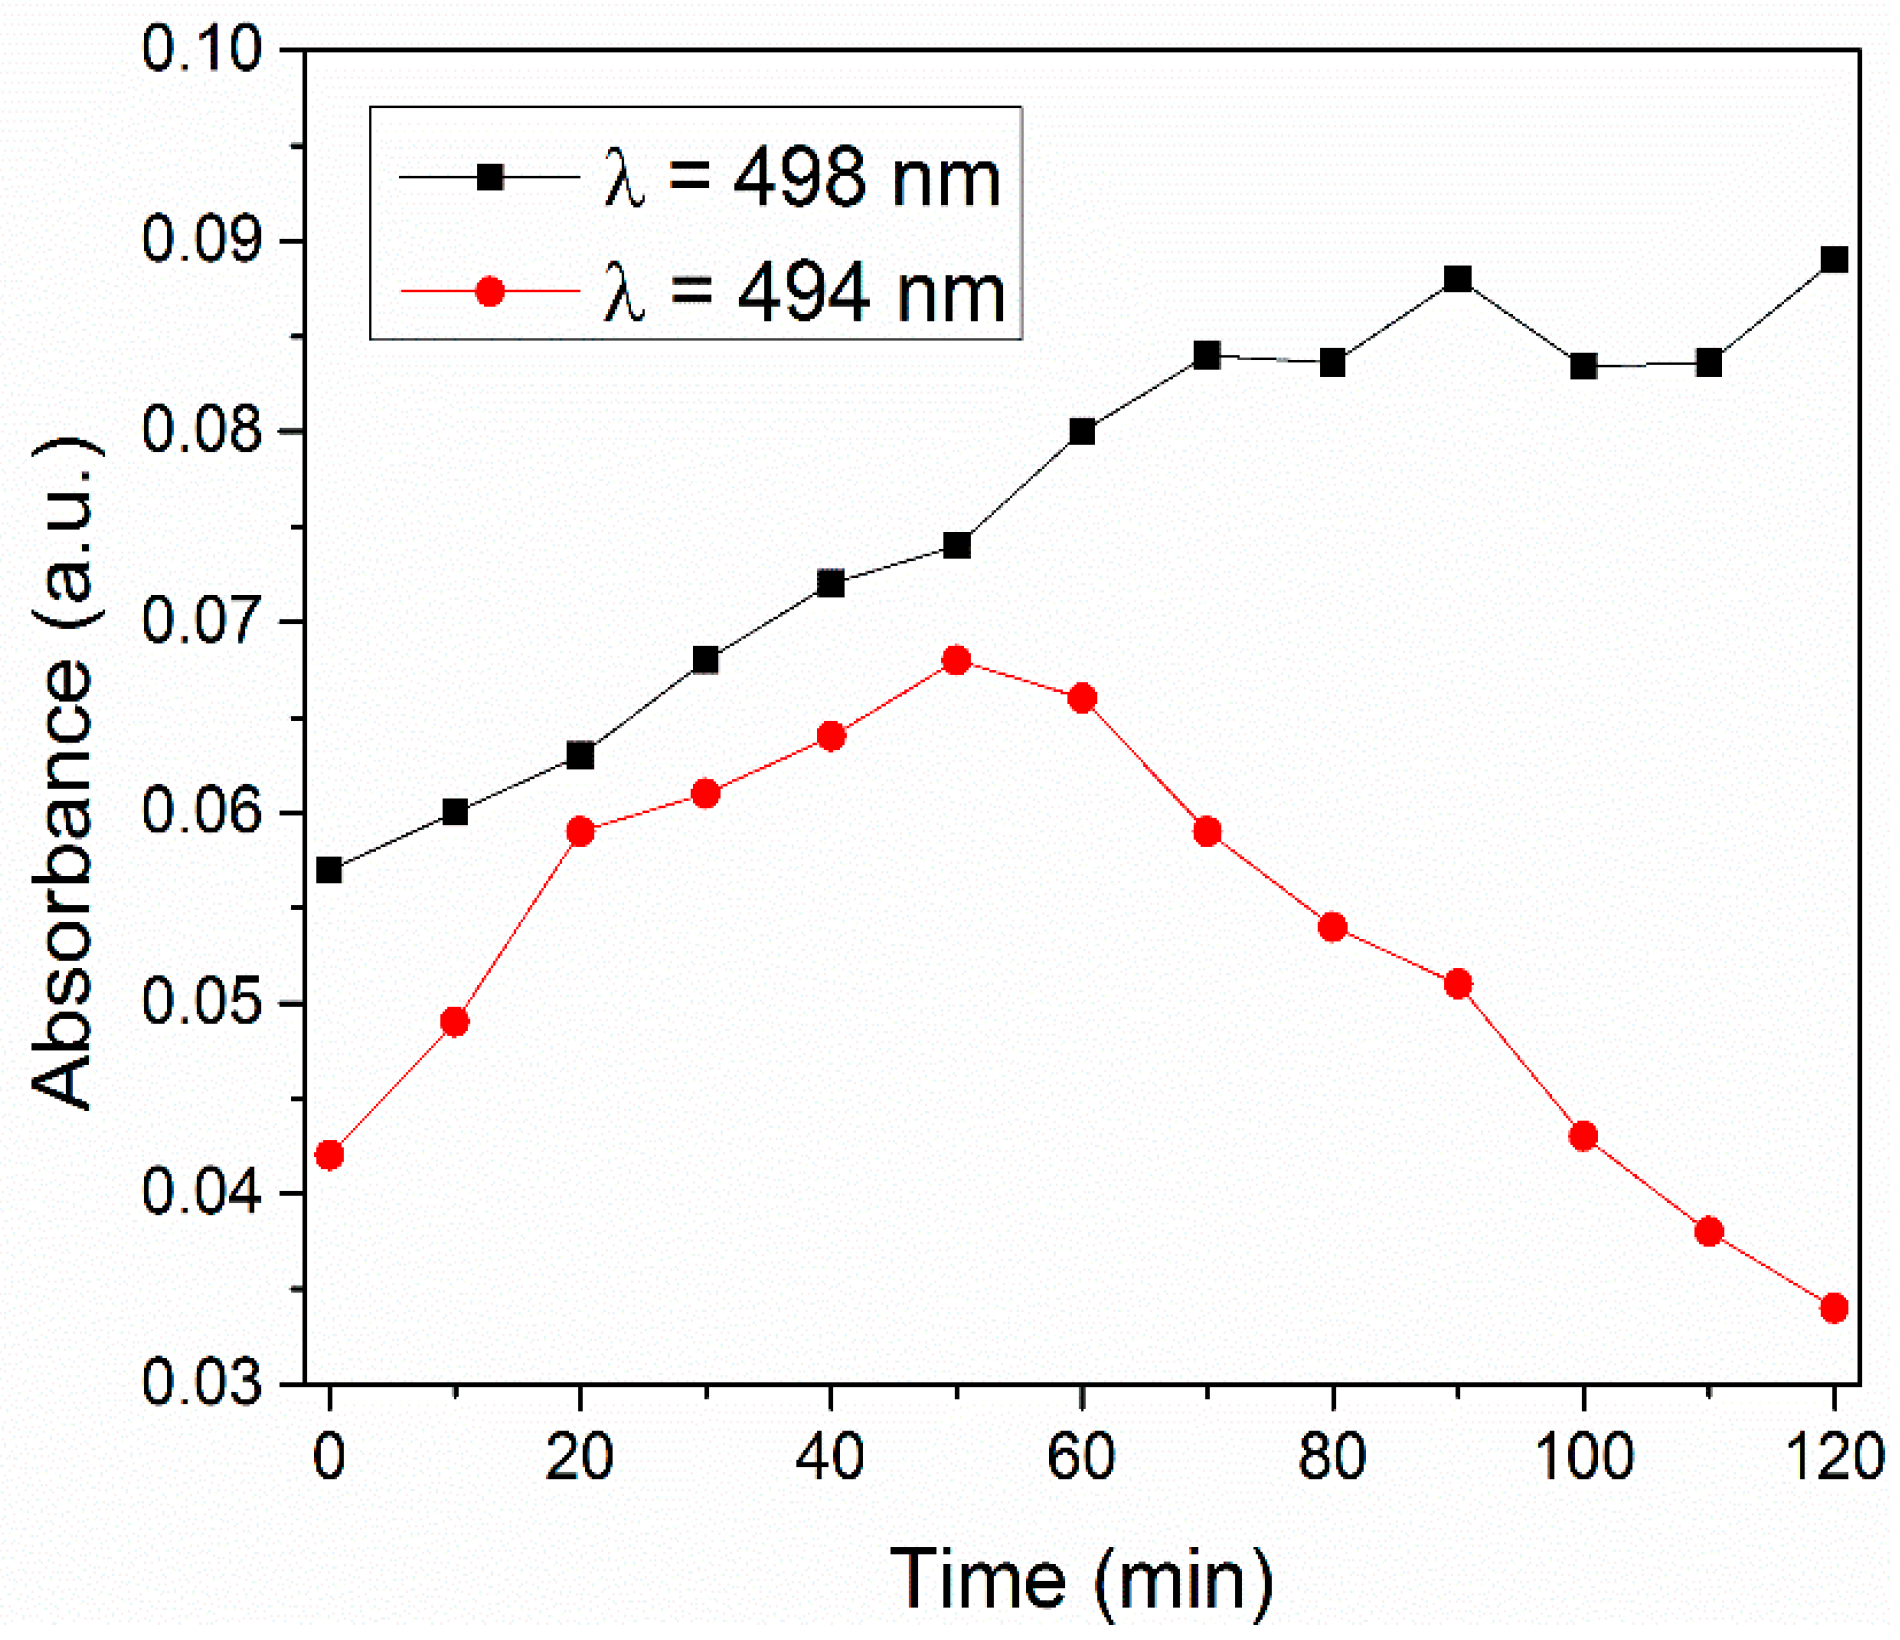
Moreover, the absorbance peak occurring at λmax= 494 nm increased in intensity in the first 50 min, followed by a decrease in the range of 50–120 min that attests to the conversion of RhB into Rh110 and the degradation of Rh110. These results, emphasized in Figure 14, indicate that the activity of α-MnO2 for the highly selective oxidative degradation of RhB is higher under solar irradiation than in dark conditions.
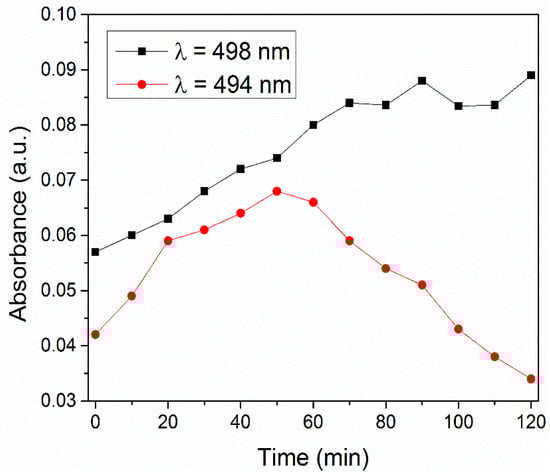
Figure 14.
Rh110 absorbance vs. time for catalytic (λ = 498 nm) and photocatalytic (λ = 494 nm) reactions over α-MnO2.
4. Conclusions
A simple hydrothermal method has been developed for the fast synthesis of well-defined crystalline α-MnO2 nanofibers. The results showed that the crystalline α-MnO2-type manganese oxide was formed and the autoclaving time and temperature had a great influence on the process of obtaining the desired structure. The as-obtained nanowires were several micrometers long and 20–30 nm in diameter, with narrow distributions in their dimensions.
The α-MnO2 material resulting from the synthesis displayed two colors: black and brown. However, X-ray powder diffraction analysis shows that in both cases the material is well-crystallized and can be indexed in the α-MnO2 structure. Still, the two types of α-MnO2 showed different degrees of crystallization and morphology, differences that may have been caused by the effect of heat transfer in the autoclave during the heat treatment applied in the MnO2 synthesis.
TG analysis indicates mass losses and phase transformations between 30 and 150 °C, 200–260 °C, and 340–500 °C.
SEM images of the distinctly colored materials showed particles with nanowire morphology.
The electrochemical study conducted on graphite supports modified with compositions containing α-MnO2 showed that the electrode with the highest double-layer capacitance was the one manufactured from a suspension in ethanol containing 3 mg α-MnO2 and 2 mg Vulcan carbon. The values of the double-layer capacitance, roughness factor, and electrochemically active surface area obtained for this electrode were 3.444 mF cm−2, 57.4, and 16.072 cm2, respectively.
The experiments carried out for investigating the catalytic and photocatalytic RhB degradation revealed that α-MnO2 showed improved results during photocatalysis considering that the RhB degradation reached 97.2%; whereas, in the case of the catalytic reaction, the RhB degradation reached 74%. Additionally, the identification of multiple bands overlapped in the visible spectra that simultaneously increased and decreased in intensity and the enhanced hypsochromic shift together with a higher absorbance decrease led to the conclusion that α-MnO2 is an efficient photocatalyst, for which RhB underwent a more highly selective deethylation degradation process.
Author Contributions
Conceptualization, F.S.R. and B.-O.T.; methodology, F.S.R.; software and visualization J.N.G.; validation, S.D.N., and F.S.R.; formal analysis, M.I.; writing—original draft preparation, review and editing, F.S.R.; supervision, S.D.N. All authors have read and agreed to the published version of the manuscript.
Funding
This work was supported by the Ministry of Research and Innovation from PN 19 22 01 01 projects, with contract number 40N/2019. The ab initio calculations were performed under the project HPC-EUROPA3 (INFRAIA-2016-1-730897), with the support of the EC Research Innovation Action under the H2020 Programme; in particular, the authors gratefully acknowledge the support of Alessandro Stroppa and the hospitality from CNR-SPIN c/o Department of Physical and Chemical Sciences, University of L’Aquila, Via Vetoio, I-67100, Coppito, L’Aquila, Italy. We are grateful for the computer resources and technical support provided by CINECA.
Institutional Review Board Statement
Not applicable.
Data Availability Statement
Not applicable.
Acknowledgments
We would like to thank Vlazan P. for the support in obtaining the XRD and TGA characterizations of the samples.
Conflicts of Interest
The authors declare no conflict of interest.
References
- Duffy, P.; Fitzpatrick, C.; Conway, T.; Lynch, R.P. Energy sources and supply grids—The growing need for storage. In Energy Storage Options and Their Environmental Impact; Royal Society of Chemistry: London, UK, 2019; pp. 1–41. [Google Scholar] [CrossRef]
- Xie, Y.; Yang, C.; Chen, P.; Yuan, D.; Guo, K. MnO2-decorated hierarchical porous carbon composites for high-performance asymmetric supercapacitors. J. Power Sources 2019, 425, 1–9. [Google Scholar] [CrossRef]
- Wang, G.; Zhang, L.; Zhang, J. A review of electrode materials for electrochemical supercapacitors. Chem. Soc. Rev. 2012, 41, 797–828. [Google Scholar] [CrossRef] [PubMed] [Green Version]
- Liu, J.; Wang, J.; Xu, C.; Jiang, H.; Li, C.; Zhang, L.; Lin, J.; Shen, Z.X. Advanced energy storage devices: Basic principles, analytical methods, and rational materials design. Adv. Sci. 2018, 5, 1700322. [Google Scholar] [CrossRef]
- Shao, H.; Wu, Y.C.; Lin, Z.; Taberna, P.L.; Simon, P. Nanoporous carbon for electrochemical capacitive energy storage. Chem. Soc. Rev. 2020, 49, 3005–3039. [Google Scholar] [CrossRef] [PubMed] [Green Version]
- Wu, D.; Xie, X.; Zhang, Y.; Zhang, D.; Du, W.; Zhang, X.; Wang, B. MnO2/carbon composites for supercapacitor: Synthesis and electrochemical performance. Front. Mater. 2020, 7, 1–16. [Google Scholar] [CrossRef] [Green Version]
- Zhu, M.; Wang, Z.; Li, H.; Xiong, Y.; Liu, Z.; Tang, Z.; Huang, Y.; Rogach, A.L.; Zhi, C. Light-permeable, photoluminescent microbatteries embedded in the color filter of a screen. Energy Environ. Sci. 2018, 11, 2414–2422. [Google Scholar] [CrossRef]
- Zeng, Y.; Yu, M.; Meng, Y.; Fang, P.; Lu, X.; Tong, Y. Iron-based supercapacitor electrodes: Advances and challenges. Adv. Energy Mater. 2016, 6, 1–17. [Google Scholar] [CrossRef]
- Augustyn, V.; Simon, P.; Dunn, B. Pseudocapacitive oxide materials for high-rate electrochemical energy storage. Energy Environ. Sci. 2014, 7, 1597–1614. [Google Scholar] [CrossRef] [Green Version]
- Yu, G.; Hu, L.; Vosgueritchian, M.; Wang, H.; Xie, X.; McDonough, J.R.; Cui, X.; Cui, Y.; Bao, Z. Solution-processed graphene/MnO2 nanostructured textiles for high-performance electrochemical capacitors. Nano Lett. 2011, 11, 2905–2911. [Google Scholar] [CrossRef]
- Julien, C.M.; Mauger, A. Nanostructured MnO2 as electrode materials for energy storage. Nanomaterials 2017, 7, 396. [Google Scholar] [CrossRef] [Green Version]
- Ghosh, S.K. Diversity in the family of manganese oxides at the nanoscale: From fundamentals to applications. ACS Omega 2020, 5, 25493–25504. [Google Scholar] [CrossRef] [PubMed]
- Hayashi, E.; Komanoya, T.; Kamata, K.; Hara, M. Heterogeneously-catalyzed aerobic oxidation of 5-hydroxymethylfurfural to 2,5-furandicarboxylic acid with MnO2. ChemSusChem 2017, 10, 654–658. [Google Scholar] [CrossRef] [PubMed]
- Fu, J.; Gao, P.; Wang, L.; Zhang, Y.; Deng, Y.; Huang, R.; Zhao, S.; Yu, Z.; Wei, Y.; Wang, G.; et al. Regulating crystal facets of MnO2 for enhancing peroxymonosulfate activation to degrade pollutants: Performance and mechanism. Catalysts 2022, 12, 342. [Google Scholar] [CrossRef]
- Song, H.; Xu, L.; Chen, M.; Cui, Y.; Wu, C.-E.; Qiu, J.; Xu, L.; Cheng, G.; Hu, X. Recent progresses in the synthesis of MnO2 nanowire and its application in environmental catalysis. RSC Adv. 2021, 11, 35494–35513. [Google Scholar] [CrossRef]
- Ferraz, C.P.; Da Silva, A.G.M.; Rodrigues, T.S.; Camargo, P.H.C.; Paul, S.; Wojcieszak, R. Furfural oxidation on gold supported on MnO2: Influence of the support structure on the catalytic performances. Appl. Sci. 2018, 8, 1246. [Google Scholar] [CrossRef] [Green Version]
- Kuźniarska-Biernacka, I.; Garbarz-Glos, B.; Skiba, E.; Maniukiewicz, W.; Bąk, W.; Antonova, M.; Rebelo, S.; Freire, C. Evaluation of Rhodamine B photocatalytic degradation over BaTiO3-MnO2 ceramic materials. Materials 2021, 14, 3152. [Google Scholar] [CrossRef]
- Ji, X.; Guo, Y.; Hua, S.; Li, H.; Zhang, S. Interaction-determined sensitization photodegradation of dye complexes by boron nitride under visible light irradiation: Experimental and theoretical studies. New J. Chem. 2020, 44, 9238–9247. [Google Scholar] [CrossRef]
- Chan, Y.-L.; Pung, S.-Y.; Sreekantan, S.; Yeoh, F.-Y. Photocatalytic activity of β-MnO2 nanotubes grown on PET fibre under visible light irradiation. J. Exp. Nanosci. 2016, 11, 603–618. [Google Scholar] [CrossRef] [Green Version]
- Cui, H.-J.; Huang, H.-Z.; Yuan, B.; Fu, M.-L. Decolorization of RhB dye by manganese oxides: Effect of crystal type and solution pH. Geochem. Trans. 2015, 16, 10. [Google Scholar] [CrossRef] [Green Version]
- Sabna, V.; Thampi, S.G.; Chandrakaran, S. Degradation of Rhodamine B with manganese dioxide nanorods. J. Water Health 2018, 16, 846–856. [Google Scholar] [CrossRef]
- Periyasamy, G.; Patil, I.M.; Kakade, B.; Veluswamy, P.; Archana, J.; Ikeda, H.; Annamalai, K. Reduced graphene oxide-wrapped α-Mn2O3/α-MnO2 nanowires for electrocatalytic oxygen reduction in alkaline medium. J. Mater. Sci. Mater. Electron. 2022, 33, 8644–8654. [Google Scholar] [CrossRef]
- Salleh, M.A.M.; Mahmoud, D.K.; Karim, W.A.W.A.; Idris, A. Cationic and anionic dye adsorption by agricultural solid wastes: A comprehensive review. Desalination 2011, 280, 1–13. [Google Scholar] [CrossRef]
- Revathi, B.; Balakrishnan, L.; Pichaimuthu, S.; Grace, A.N.; Chandar, N.K. Photocatalytic degradation of Rhodamine B using BiMnO3 nanoparticles under UV and visible light irradiation. J. Mater. Sci. Mater. Electron. 2020, 31, 22487–22497. [Google Scholar] [CrossRef]
- Sundararajan, M.; Sailaja, V.; Kennedy, L.J.; Vijaya, J.J. Photocatalytic degradation of Rhodamine B under visible light using nanostructured zinc doped cobalt ferrite: Kinetics and mechanism. Ceram. Int. 2017, 43, 540–548. [Google Scholar] [CrossRef]
- Liu, C.; Pan, D.; Tang, X.; Hou, M.; Zhou, Q.; Zhou, J. Degradation of Rhodamine B by the α-MnO2/peroxymonosulfate system. Water Air Soil Pollut. 2016, 227, 92. [Google Scholar] [CrossRef]
- Wang, S.; Guan, A.; Wang, J.; Fu, X.; Guo, X.; Tian, Y.; Wang, K.; Cao, W.; Zhao, C. Highly efficient degradation of Rhodamine B by α-MnO2 nanorods. Bull. Mater. Sci. 2022, 45, 35. [Google Scholar] [CrossRef]
- Wang, S.; Guan, A.; Wang, J.; Fu, X.; Guo, X.; Tian, Y.; Wang, K.; Cao, W. Facile Synthesis of a High Purity α-MnO2 Nanorod for Rapid Degradation of Rhodamine B. 2021. Available online: https://www.researchsquare.com/article/rs-679600/v1 (accessed on 16 June 2022).
- Sui, N.; Duan, Y.; Jiao, X.; Chen, D. Large-scale preparation and catalytic properties of one-dimensional α/β-MnO2 nanostructures. J. Phys. Chem. C 2009, 113, 8560–8565. [Google Scholar] [CrossRef]
- Chandiran, K.; Murugesan, R.A.; Balaji, R.; Andrews, N.G.; Pitchaimuthu, S.; Raja, K.C.N. Long single crystalline α-Mn2O3 nanorods: Facile synthesis and photocatalytic application. Mater. Res. Express 2020, 7, 074001. [Google Scholar] [CrossRef]
- Pokhrel, R.; Goetz, M.K.; Shaner, S.E.; Wu, X.; Stahl, S.S. The “best catalyst” for water oxidation depends on the oxidation method employed: A case study of manganese oxides. J. Am. Chem. Soc. 2015, 137, 8384–8387. [Google Scholar] [CrossRef]
- Cheng, J.-H.; Shao, G.; Yu, H.-J.; Xu, J.-J. Excellent catalytic and electrochemical properties of the mesoporous MnO2 nanospheres/nanosheets. J. Alloys Compd. 2010, 505, 163–167. [Google Scholar] [CrossRef]
- Bing, Y.; Zhang, L.; Mu, S.; Zhang, J. Facile synthesis of α-MnO2 with a 3D staghorn coral-like micro-structure assembled by nano-rods and its application in electrochemical supercapacitors. Appl. Sci. 2017, 7, 511. [Google Scholar] [CrossRef] [Green Version]
- Kanha, P.; Saengkwamsawang, P. Effect of stirring time on morphology and crystalline features of MnO2 nanoparticles synthesized by co-precipitation method. Inorg. Nano-Met. Chem. 2017, 47, 1129–1133. [Google Scholar] [CrossRef]
- Sanchez-Botero, L.; Herrera, A.P.; Hinestroza, J.P. Oriented growth of α-MnO2 nanorods using natural extracts from grape stems and apple peels. Nanomaterials 2017, 7, 117. [Google Scholar] [CrossRef] [PubMed]
- Li, Y.; Wang, J.; Zhang, Y.; Banis, M.N.; Liu, J.; Geng, D.; Li, R.; Sun, X. Facile controlled synthesis and growth mechanisms of flower-like and tubular MnO2 nanostructures by microwave-assisted hydrothermal method. J. Colloid Interface Sci. 2011, 369, 123–128. [Google Scholar] [CrossRef]
- Shah, S.I.; Zulfiqar; Khan, T.; Khan, R.; Khan, S.A.; Khattak, S.A.; Khan, G. Study of structural, optical and dielectric properties of α-MnO2 nanotubes (NTS). J. Mater. Sci. Mater. Electron. 2019, 30, 19199–19205. [Google Scholar] [CrossRef]
- Saratovsky, I.; Wightman, P.G.; Pastén, P.A.; Gaillard, J.-F.; Poeppelmeier, K.R. Manganese oxides: Parallels between abiotic and biotic structures. J. Am. Chem. Soc. 2006, 128, 11188–11198. [Google Scholar] [CrossRef]
- Gao, T.; Glerup, M.; Krumeich, F.; Nesper, R.; Fjellvåg, H.; Norby, P. Microstructures and spectroscopic properties of cryptomelane-type manganese dioxide nanofibers. J. Phys. Chem. C 2008, 112, 13134–13140. [Google Scholar] [CrossRef]
- Wu, T.-H.; Hesp, D.; Dhanak, V.; Collins, C.; Braga, F.; Hardwick, L.J.; Hu, C.-C. Charge storage mechanism of activated manganese oxide composites for pseudocapacitors. J. Mater. Chem. A 2015, 3, 12786–12795. [Google Scholar] [CrossRef]
- Polverejan, M.; Villegas, A.J.C.; Suib, S.L. Higher valency ion substitution into the manganese oxide framework. J. Am. Chem. Soc. 2004, 126, 7774–7775. [Google Scholar] [CrossRef]
- Gao, T.; Fjellvåg, H.; Norby, P. A comparison study on Raman scattering properties of α- and β-MnO2. Anal. Chim. Acta 2009, 648, 235–239. [Google Scholar] [CrossRef]
- Li, S.; Ma, Z.; Wang, L.; Liu, J. Influence of MnO2 on the photocatalytic activity of P-25 TiO2 in the degradation of methyl orange. Sci. China Ser. B Chem. 2008, 51, 179–185. [Google Scholar] [CrossRef]
- Xie, Y.; Yu, Y.; Gong, X.; Guo, Y.; Guo, Y.; Wang, Y.; Lu, G. Effect of the crystal plane figure on the catalytic performance of MnO2 for the total oxidation of propane. CrystEngComm 2015, 17, 3005–3014. [Google Scholar] [CrossRef]
- Hernández, W.; Centeno, M.A.; Sarria, F.R.; Ivanova, S.; Montes, M.; Odriozola, J.A. Modified cryptomelane-type manganese dioxide nanomaterials for preferential oxidation of CO in the presence of hydrogen. Catal. Today 2010, 157, 160–165. [Google Scholar] [CrossRef]
- Makuła, P.; Pacia, M.; Macyk, W. How to correctly determine the band gap energy of modified semiconductor photocatalysts based on UV–Vis spectra. J. Phys. Chem. Lett. 2018, 9, 6814–6817. [Google Scholar] [CrossRef] [Green Version]
- Li, W.; Cui, X.; Zeng, R.; Du, G.; Sun, Z.; Zheng, R.; Ringer, S.; Dou, S.X. Performance modulation of α-MnO2 nanowires by crystal facet engineering. Sci. Rep. 2015, 5, srep08987. [Google Scholar] [CrossRef] [PubMed]
- Toufiq, A.M.; Wang, F.; Javed, Q.-U. Synthesis, characterization and optical property of shrimps-like nanostructures of MnO2 by hydrothermal route. J. Nanosci. Nanotechnol. 2013, 13, 2948–2952. [Google Scholar] [CrossRef] [PubMed]
- Zahan, M.; Podder, J. Structural, optical and electrical properties of Cu:MnO2 nanostructured thin films for glucose sensitivity measurements. SN Appl. Sci. 2020, 2, 385. [Google Scholar] [CrossRef] [Green Version]
- Cockayne, E. Thermodynamics of the flexible metal–organic framework material MIL-53(Cr) from first-principles. J. Phys. Chem. C 2017, 121, 4312–4317. [Google Scholar] [CrossRef] [Green Version]
- Hamann, D.R. Optimized norm-conserving Vanderbilt pseudopotentials. Phys. Rev. B 2013, 88, 085117. [Google Scholar] [CrossRef] [Green Version]
- Krukau, A.V.; Vydrov, O.A.; Izmaylov, A.F.; Scuseria, G.E. Influence of the exchange screening parameter on the performance of screened hybrid functionals. J. Chem. Phys. 2006, 125, 224106. [Google Scholar] [CrossRef]
- Van Setten, M.; Giantomassi, M.; Bousquet, E.; Verstraete, M.; Hamann, D.; Gonze, X.; Rignanese, G.-M. The PseudoDojo: Training and grading a 85 element optimized norm-conserving pseudopotential table. Comput. Phys. Commun. 2018, 226, 39–54. [Google Scholar] [CrossRef] [Green Version]
- Giannozzi, P.; Baroni, S.; Bonini, N.; Calandra, M.; Car, R.; Cavazzoni, C.; Ceresoli, D.; Chiarotti, G.L.; Cococcioni, M.; Dabo, I.; et al. QUANTUM ESPRESSO: A modular and open-source software project for quantum simulations of materials. J. Phys. Condens. Matter 2009, 21, 395502. [Google Scholar] [CrossRef] [PubMed]
- Giannozzi, P.; Andreussi, O.; Brumme, T.; Bunau, O.; Nardelli, M.B.; Calandra, M.; Car, R.; Cavazzoni, C.; Ceresoli, D.; Cococcioni, M.; et al. Advanced capabilities for materials modelling with Quantum ESPRESSO. J. Phys. Condens. Matter 2017, 29, 465901. [Google Scholar] [CrossRef] [PubMed] [Green Version]
- Dudarev, S.L.; Botton, G.A.; Savrasov, S.Y.; Humphreys, C.J.; Sutton, A.P. Electron-energy-loss spectra and the structural stability of nickel oxide: An LSDA+U study. Phys. Rev. B 1998, 57, 1505–1509. [Google Scholar] [CrossRef]
- Perdew, J.P.; Burke, K.; Ernzerhof, M. Generalized gradient approximation made simple. Phys. Rev. Lett. 1996, 77, 3865–3868. [Google Scholar] [CrossRef] [Green Version]
- Bruno, M.; Palummo, M.; Marini, A.; Del Sole, R.; Ossicini, S. From Si nanowires to porous silicon: The role of excitonic effects. Phys. Rev. Lett. 2007, 98, 036807. [Google Scholar] [CrossRef] [Green Version]
- Corpuz, R.D.; De Juan-Corpuz, L.M.; Nguyen, M.T.; Yonezawa, T.; Wu, H.-L.; Somwangthanaroj, A.; Kheawhom, S. Binder-free α-MnO2 nanowires on carbon cloth as cathode material for Zinc-Ion batteries. Int. J. Mol. Sci. 2020, 21, 3113. [Google Scholar] [CrossRef]
- Song, J.-X.; Guo, T.; Ding, W.; Yao, M.; Yang, L.; Zhang, X.-N.; Yu, Z.-S.; Wu, J.-X.; Zhang, J.; Fang, X. The effect of al particles size on the thermal behavior and kinetics of Al-MnO2 thermite system. Adv. Mater. Sci. Eng. 2020, 2020, 3097404. [Google Scholar] [CrossRef]
- Ramli, N.I.; Ismail, N.A.B.; Abd-Wahab, F.; Salim, W.W.A.W. Cyclic voltammetry and electrical impedance spectroscopy of electrodes modified with PEDOT:PSS-reduced graphene oxide composite. In Transparent Conducting Films; IntechOpen: London, UK, 2019. [Google Scholar] [CrossRef] [Green Version]
- Zhou, Z.; Zaman, W.Q.; Sun, W.; Cao, L.-M.; Tariq, M.; Yang, J. Cultivating crystal lattice distortion in IrO2 via coupling with MnO2 to boost the oxygen evolution reaction with high intrinsic activity. Chem. Commun. 2018, 54, 4959–4962. [Google Scholar] [CrossRef]
- Taranu, B.O.; Fagadar-Cosma, E.; Popa, I.; Plesu, N.; Taranu, I. Adsorbed functionalized porphyrins on polyaniline modified platinum electrodes. Comparative electrochemical properties. Dig. J. Nanomat. Biostruct. 2014, 9, 667–679. [Google Scholar]
- Kellenberger, A.; Ambros, D.; Plesu, N. Scan rate dependent morphology of polyaniline films electrochemically deposited on nickel. Int. J. Electrochem. Sci. 2014, 9, 6821–6833. [Google Scholar]
- Gira, M.J.; Tkacz, K.P.; Hampton, J.R. Physical and electrochemical area determination of electrodeposited Ni, Co, and NiCo thin films. Nano Converg. 2016, 3, 6. [Google Scholar] [CrossRef] [PubMed] [Green Version]
- Sebarchievici, I.; Taranu, B.; Rus, S.F.; Vlazan, P.; Poienar, M.; Sfirloaga, P. Electro-oxidation of ascorbic acid on perovskite-modified electrodes. In Proceedings of the 25th International Symposium on Analytical and Environmental Problems, Szeged, Hungary, 7–8 October 2019; pp. 273–275. [Google Scholar]
- Kölbach, M.; Fiechter, S.; van de Krol, R.; Bogdanoff, P. Evaluation of electrodeposited α-Mn2O3 as a catalyst for the oxygen evolution reaction. Catal. Today 2017, 290, 2–9. [Google Scholar] [CrossRef] [Green Version]
- Sebarchievici, I.; Taranu, B.; Rus, S.F.; Fagadar-Cosma, E. Electrochemical behaviour and analytical applications of a manganese porphyrin-silica hybrid film prepared by pulsed laser deposition. J. Electroanal. Chem. 2020, 865, 114127. [Google Scholar] [CrossRef]
- Ciríaco, M.L.F.; Silva-Pereira, M.I.; Nunes, M.R.; Costa, F.M. Electrochemical behaviour of BaSn0.9Sb0.1O3 coated titanium electrodes. Port. Electrochim. Acta 1999, 17, 149–156. [Google Scholar] [CrossRef]
- Yao, B.; Chandrasekaran, S.; Zhang, J.; Xiao, W.; Qian, F.; Zhu, C.; Duoss, E.B.; Spadaccini, C.M.; Worsley, M.A.; Li, Y. Efficient 3D printed pseudocapacitive electrodes with ultrahigh MnO2 loading. Joule 2019, 3, 459–470. [Google Scholar] [CrossRef] [Green Version]
- Raza, S.A.; Naqvi, S.Q.; Usman, A.; Jennings, J.R.; Soon, Y.W. Spectroscopic study of the interaction between rhodamine B and graphene. J. Photochem. Photobiol. A Chem. 2021, 418, 113417. [Google Scholar] [CrossRef]
- Ahmed, R.M.; Saif, M. Optical properties of Rhodamine B dye doped in transparent polymers for sensor application. Chin. J. Phys. 2013, 51, 511–521. [Google Scholar] [CrossRef]
- Mchedlov-Petrosyan, N.O.; Kholin, Y.V. Aggregation of Rhodamine B in water. Russ. J. Appl. Chem. 2004, 77, 414–422. [Google Scholar] [CrossRef]
- Chandra, S.; Das, P.; Bag, S.; Laha, D.; Pramanik, P. Synthesis, functionalization and bioimaging applications of highly fluorescent carbon nanoparticles. Nanoscale 2011, 3, 1533–1540. [Google Scholar] [CrossRef]
- Chen, F.; Zhao, J.; Hidaka, H. Highly selective deethylation of rhodamine B: Adsorption and photooxidation pathways of the dye on the TiO2TiO2/SiO2SiO composite photocatalyst. Int. J. Photoenergy 2003, 5, 209–217. [Google Scholar] [CrossRef] [Green Version]
- Liang, L.; Cheng, L.; Zhang, Y.; Wang, Q.; Wu, Q.; Xue, Y.; Meng, X. Efficiency and mechanisms of Rhodamine B degradation in Fenton-like systems based on zero-valent iron. RSC Adv. 2020, 10, 28509–28515. [Google Scholar] [CrossRef] [PubMed]
- Liang, H.; Liu, S.; Zhang, H.; Wang, X.; Wang, J. New insight into the selective photocatalytic oxidation of RhB through a strategy of modulating radical generation. RSC Adv. 2018, 8, 13625–13634. [Google Scholar] [CrossRef] [PubMed] [Green Version]
- Yu, K.; Yang, S.; He, H.; Sun, C.; Gu, C.; Ju, Y. Visible light-driven photocatalytic degradation of Rhodamine B over NaBiO3: Pathways and mechanism. J. Phys. Chem. A 2009, 113, 10024–10032. [Google Scholar] [CrossRef] [PubMed]


Publisher’s Note: MDPI stays neutral with regard to jurisdictional claims in published maps and institutional affiliations. |
© 2022 by the authors. Licensee MDPI, Basel, Switzerland. This article is an open access article distributed under the terms and conditions of the Creative Commons Attribution (CC BY) license (https://creativecommons.org/licenses/by/4.0/).