1. Introduction
Advanced technologies enable the interconnection of people, organisations and infrastructure as one system. In this way, they affect the development of social, economic and political life. For this reason, ensuring cybersecurity in network systems represents a critical challenge to ensure the functionality of existing infrastructure. In such complex environments, cyberattacks are becoming more sophisticated as well. Advanced attacks include, for example, evolving malware, and represent a major security challenge due to the emergence of new variants of attacks. Eventually, each variant encompasses new signatures and functionality that is not detected by existing tools or techniques. This is especially the case with attacks that are active over longer periods of time. Usually, such attacks are carried out by different actors, ranging from individuals to state-sponsored groups. Such attacks can lead to unpredictable consequences and are usually very hard to detect in real-time. Due to the above reasons, existing detection techniques are rendered obsolete when dealing with APT attacks. APT attacks often come in the form of multi-stage attacks, which means that they are executed in multiple steps. For example, in the initial step, access is gained to a target system. Subsequently, an open channel is established that can be used for further actions in the aftermath. For this reason, the identification of the initial step remains the most important challenge in intrusion detection [
1].
Inspired by existing ML and deep-learning (DL) methods, neural networks—for example, autoencoders—are applied to anomaly detection. Autoencoders are a special type of unsupervised learning technique that can be used to derive and learn features and packet classification [
2]. They are a special type of multi-layer neural network performing non-linear dimensionality reduction in the data. Given a large amount of benign data, they can be trained to reconstruct input data as closely as possible by minimizing the reconstruction error on the network’s output. In turn, the reduced representation in the so-called bottleneck layer make the autoencoders useful for outlier or anomaly detection [
3]. Anomaly detection is also utilized in application areas such as video-processing [
4], network monitoring and intrusion detection [
5,
6,
7], cyber-physical systems [
2] or monitoring industrial control systems [
8]. In recent years, however, the scientific community has increasingly focused on anomaly detection methods in cybersecurity [
9,
10,
11,
12]. This is especially the case for intrusion detection for APT attacks [
1,
13].
This paper builds upon previous works from [
14,
15], where a novel two-stage approach for anomaly detection, relying on autoencoders, was introduced. In this work, we additionally investigated several anomaly-detection methods with an emphasis on filtering methods and performance evaluation on two datasets. We analyse neural networks, including standard and variational autoencoders, as well as their combinations and a support vector machine. Each autoencoder is trained with benign or malicious data during an unsupervised learning process. The corresponding algorithms are used to investigate several known malware attacks against networks. Eventually, their authentic imprints in the datasets are identified according to distinctive evaluation metrics.
The reminder of the paper is structured as follows.
Section 2 discusses related work on ML-based anomaly detection in multiple domains.
Section 3 provides an overview of the applied methodology, including datasets, APT attacks of interest and evaluation metrics. Subsequently,
Section 4 discusses the proposed anomaly-detection framework, i.e., the main contribution of this paper, in detail. Finally,
Section 7 elaborates on the experimental results and provides final remarks for future research.
2. Related Work
The application of ML-based anomaly-detection methods represents an important research challenge. Thus far, common algorithms are used to detect suspicious deviations from common behavioural patterns. One popular domain of interest for anomaly detection represents traffic data from network systems. In this case, a network is monitored and the extracted data is used in the posterior detection process [
5,
6,
7]. Other application domains for anomaly-detection algorithms include, for example, cyber-physical systems (CPS) [
2] or smart energy environments [
16].
In recent times, however, ML has increasingly found its way into the realm of cyber-security applications [
9,
10,
11,
12] and, subsequently, the detection of APT attacks [
1,
13]. Common ML methods in the latter domain include signature-based detection, behaviour-based detection, monitoring [
17] and data mining [
18]. Regarding APT attacks, however, not many works deal with this aspect of cybersecurity. The existing literature usually focuses on common cyberattacks, such as DDoS, zero-day and web attacks [
19]. A general problem for the detection of APT attacks consists of the lack of adequate datasets. The existing datasets usually capture traffic at external endpoints. However, APT attacks occur in internal networks as well. In addition, due to their artificial nature, the generic datasets do not exactly reflect a real-world environment [
20]. In general, it is very difficult to distinguish between the behaviour of a benign user and an attacker. As a result, this leads to the generation of a large number of false positives and false negatives. This is especially the case for semi-supervised and unsupervised learning methods [
1]. The reason for this difficulty, therefore, lies in the fact that APT attacks try to disguise themselves as common network behaviour. In such way, these attacks are unpredictable and exhibit non-repetitive behaviour. In addition, the massive amount of sheer data traffic that is generated by many hosts makes the filtration of low and slow activities even more difficult [
21]. Due to such reasons, implementing a general defence approach or application for APT attacks proves to be very difficult, even unlikely. Therefore, this work contributes to this challenge by evaluating the multi-stage approach from [
14] for anomaly detection. In this way, our proposed approach contributes to the above-mentioned challenges with the goal to make anomaly-detection findings more understandable.
In [
19], a survey is provided on DL methods for the detection of APT attacks. The applied algorithms are discussed with regard to their performance, advantages and existing limitations. In addition, proposed improvements for individual methods are addressed for the mentioned datasets. The same authors propose another DL-based approach for APT-attack detection in [
22]. Here, a DL stack is presented that relies on a model where attacks are observed in the form of a multi-vector multi-stage attack.
A survey on multi-step attack detection is given in [
23], which provides an analysis of multi-step attacks and mechanisms to predict them. The work states that the identification of multi-step attacks is difficult to achieve due to several reasons. One of the problems represents the complexity of available network data. Filtering relevant information, which usually constitutes a small fraction in a vast amount of data, constitutes a challenging task. In addition, with an increasing number of attack steps, detecting similarities and links between attacks becomes increasingly difficult. Since attackers behave in an unpredictable manner, their strategy cannot be determined intuitively. The latter facts represent an issue for the modelling of attack scenarios or defining them in a standard language. In addition, problems may occur in the case of technical limitations of network hardware.
In [
24], the authors discuss APT-attack detection techniques and provide a theoretical (holistic) approach to recognize unique APT features in network attacks. For this purpose, existing APTs from multiple case studies are modelled in three distinctive representations, thereby identifying common features between them. The resulting models for each case study include a high-level kill-chain model, a labelled transition-systems (LTS) diagram and a message-sequence (MSQ) diagram. The main objective of the approach is to differentiate complex APTs from more common attacks such as ransomwares or botnets. After validating the models and the identified features, another case study was defined in order to confirm the authors’ claim. They conclude that the produced models sufficiently recognize the identified features in the final case study.
The authors of [
1] address open challenges for systems to fend off APT attacks. They discuss their claim that defence against such actions must be tackled at different stages of an occurring attack. However, this implies that proper mechanisms must be implemented across multiple points and levels of a system. Thus, they recommend the implementation of an unsupervised clustering approach to identify general information on anomalies. The authors also provide an APT-attack tree and taxonomy and mitigation methods known so far. Subsequently, the existing APT-attack defence methods are classified into three categories, namely, monitoring, detection and mitigation methods.
Another APT-attack detection approach, called HOLMES, is proposed in [
25]. The system produces graphs that summarise attacks and assist real-time response operations. The system was evaluated on data from DARPA that contains simulations of attacks in a network system. The authors conclude that HOLMES detects APT activity with a high precision and a low rate of false alarms. On the other hand, the authors of [
26] explore a DL-based proactive APT detection approach in the context of Industrial Internet of Things (IIoT). For this purpose, they present a scheme that focuses on long attack sequences. The solution relies on bidirectional encoder representations from transformers (BERT) for detection purposes with lower false-alarm rates. In addition to that, the paper in [
27] addresses the shortcomings of existing APT detection methods. For this reason, the paper provides a state-based framework that reconstructs attack scenarios. This framework relies on a three-phase detection model that summarises the critical phases in APT attacks. From the obtained results, potential attacks can be predicted with greater accuracy, which is demonstrated in an evaluation.
The work in [
28] proposes an APT-attack-stage identification method, called APTSID. This method represents a multi-stage approach that relies on the observed network traffic. In addition, the authors of [
20] propose a new dataset and benchmark existing anomaly-detection models on that dataset. According to the performance, they claim that the reliable detection of APT attacks proved to be very difficult. Thus, better learning models need to be created to achieve improved detection results.
A general overview of emerging APT attacks and detection techniques can be found in [
1,
29]. In addition, an APT-attack classification and respective countermeasures for individual attacks can be found in [
30]. Furthermore, defence against such attacks in the context of their life cycle is described in [
31].
3. Datasets
This section provides information on the datasets that were used for evaluation and performance determination. In general, data that reflects a correct system functionality are considered “benign”. On the other hand, data that contains indicators of a cyberattack are referred as “malicious” or “anomalous”. One significant research drawback in the domain of anomaly detection consists in the permanent lack of available datasets. This is due to the fact that datasets contain private user data which is restricted for public access. On the other hand, artificial datasets with anonymized data exist but they lack some critical features [
32]. In the latter case, datasets must be periodically adapted to evolving attack strategies. These include, among others, the following datasets: DARPA [
33], KDD’99 [
34], DEFCON [
35] and CAIDA [
36].
Similar to a previous paper, [
15], this work relies on two different datasets, namely, Contagio [
37] and CICIDS2017 [
38]. Whereas the former contains data on APT, the latter encompasses benign and attack data that resemble real-world data. However, these attacks are not considered part of APT; hence, this work labels them as background data. Both datasets include the results of a network -traffic analysis and contain features that are based on multiple variables. Contagio represents a malware database that encompasses a collection of raw network data in the form of PCAP files. The dataset is made up of a total of 36 files, where each file contains network-traffic data that was subject to a different type of ATP attack. These include the latest malware samples, threats, observation analyses and data that was subjected to attacks from several APTs. On the other hand, CICIDS2017 is a publicly available dataset that was developed by the Canadian Institute for Cybersecurity. In general, this dataset can be considered as a benchmark dataset in the domain of intrusion detection [
32]. As such, it is widely used in the research community since its results can be reproduced, and thus, verified and compared. This dataset consists of five files, representing five working days in an enterprise network, namely, Monday to Friday, 09:00–17:00 h. These files are available in two formats. The first format represents CSV files that contain labelled bi-directional network flows including 78 time-based features, i.e., features that occur during daily time intervals, and additional metadata about IP addresses, ports, protocols and attacks. In addition to CSV files, all subsets are available in a raw network format (PCAP files). The authors of the dataset also provided a tool that can be used for features extraction from raw network data files—CICFlowMeter [
39]. In this way, this tool is compatible with the Contagio dataset format, which makes it beneficial to work with.
For the purpose of this paper, both datasets are combined so APT attacks from the Contagio dataset are added to the CICIDS2017 network environment. First, in order to ensure compatibility, features were extracted from six preselected Contagio files and CICIDS2017 PCAP files with the help of CICFlowMeter.
The CICIDS2017 dataset itself is captured on a testbed that comprises two separated networks, i.e., a victim network with 13 machines and an attacker network. In this case, Monday represents the only subset that is free of any attacks. Therefore, the network data for that day is used as a training subset for the conducted experiments. On the other hand, Contagio files contain only filtered communication between attacker(s) and victim computers, identifiable via IP addresses. In order to merge the corresponding data, IP addresses of victim computers from the Contagio dataset were changed to corresponding IP addresses from the CICIDS2017 victim network pool. APT attacks (Contagio files) preselected for merging with the CICIDS2017 dataset include BIN_9002, BIN_Nettravler, TrojanPage, TrojanCookies, Enfal_Lurid and BIN_LURK. All inspected APT attacks were taken from Contagio and encompass several types of malware, including Trojans, spyware and spear phishing attacks. The corresponding IP address mappings used for merging, as well as the attack durations, are shown in
Table 1.
The resulting merged dataset includes three instances: (i) training dataset, (ii) independent test dataset and (iii) zero-day-attack test dataset (see
Table 2). It should be noted that the training data set is used for training purposes only and does not contain any attacks. On the other hand, the test dataset (independent) files encompass benign, i.e., harmless data, background attacks, and APT-attack traces. This dataset is divided into two distinct parts during the training/testing of the system, namely, a validation and a test set. The zero-day-attack records are used for additional testing to demonstrate the performance of the trained system in detecting previously unknown attack types. These types include attacks that were unknown during the training process.
4. Proposed Methodology
In general, the proposed two-stage detection of APT attacks belongs to the category of anomaly detection. The stages of this approach encompass (1) data pre-processing, and (2) anomaly detection. The former stage deals with the processing of raw data for further feature selection. This is realised by conducting statistical analysis on individual data records. On the other hand, the latter stage encompasses testing and validation with several autoencoders. In addition to that, both datasets were evaluated according to pre-specified metrics.
4.1. Data Pre-Processing—Statistical Analysis
In ML, large amounts of data are analysed to identify common patterns between data records. For this purpose, statistical analysis is conducted to derive valuable insights from the raw data records. In this case, the analysis is applied to check the plausibility of features and to assess their suitability for anomaly detection. Subsequently, suitable features are selected and used in conjunction with individual detection methods. The statistical analysis includes the following steps:
Descriptive analysis: Determination of statistical metrics for the plausibility check of feature values.
Histograms and boxplots: Visualisation and comparison of statistical distributions of normal flows and attacks in datasets.
Correlation analysis: The examination of features to identify groups of highly correlated or identical features.
Principal component analysis (PCA): Estimation of the extent of possible dimensionality reduction for individual features.
In this paper, a statistical analysis was conducted on the combined—i.e., the merged Contagio and CICIDS2017—datasets. This analysis resulted both in the reduction in feature vectors and the reduction in the number of features. In particular, 620 of the feature vectors containing negative values were removed. Furthermore, the feature pool was reduced from 78 to a subset of 54 numerical features as a result of the analysis.
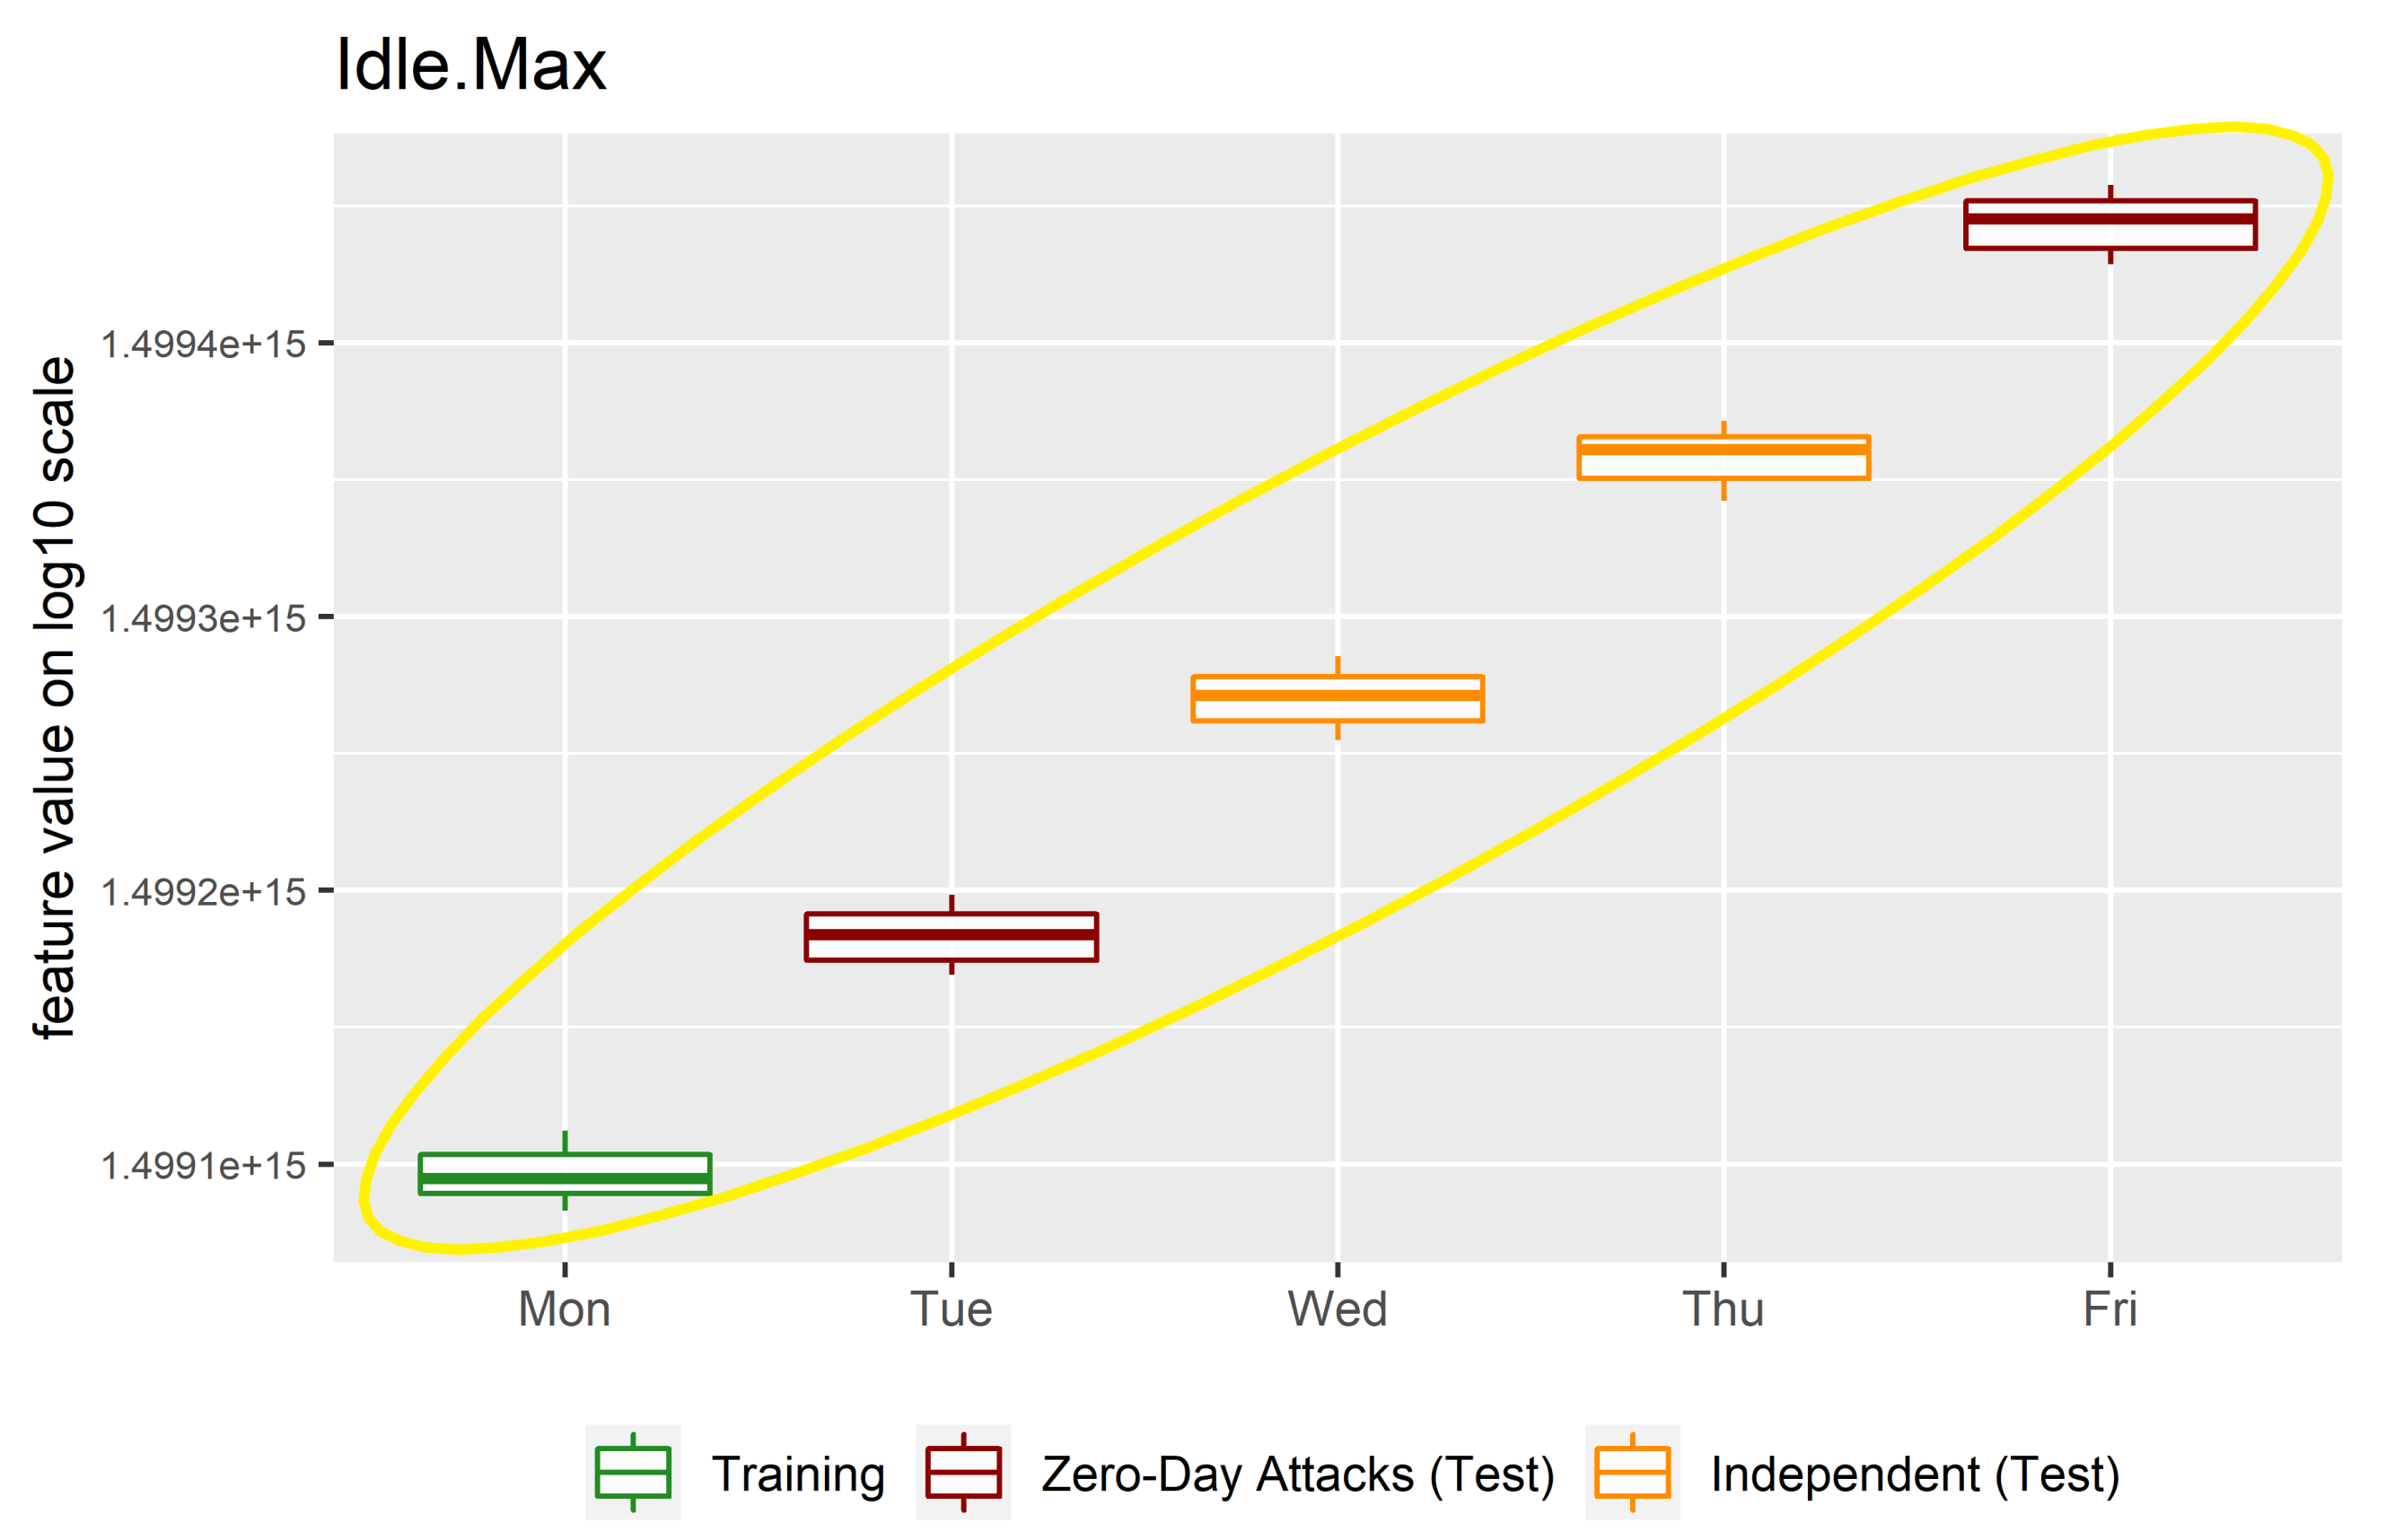
As a matter of fact, the initial analysis of 78 original features revealed 8 features containing only zero values, 3 features containing higher amounts of implausible negative data, and 2 features containing infinity values. Next, a correlation analysis revealed 7 redundant features. Thus, 20 features were excluded from further evaluation, leaving 58 features for further analysis. Subsequently, including boxplots identified suspicious data in 4 features, which were then excluded from further anomaly detection. In concrete terms, the affected features exhibit a connection between the feature values and the day of the week on which the data was recorded. However, this observation stands in strong contrast to the network behaviour described by the remaining features. This inexplicable relationship is most apparent in a boxplot for the “Idle Max” feature, which depicts a linear increase in values from Monday to Friday, as shown in
Figure 1.
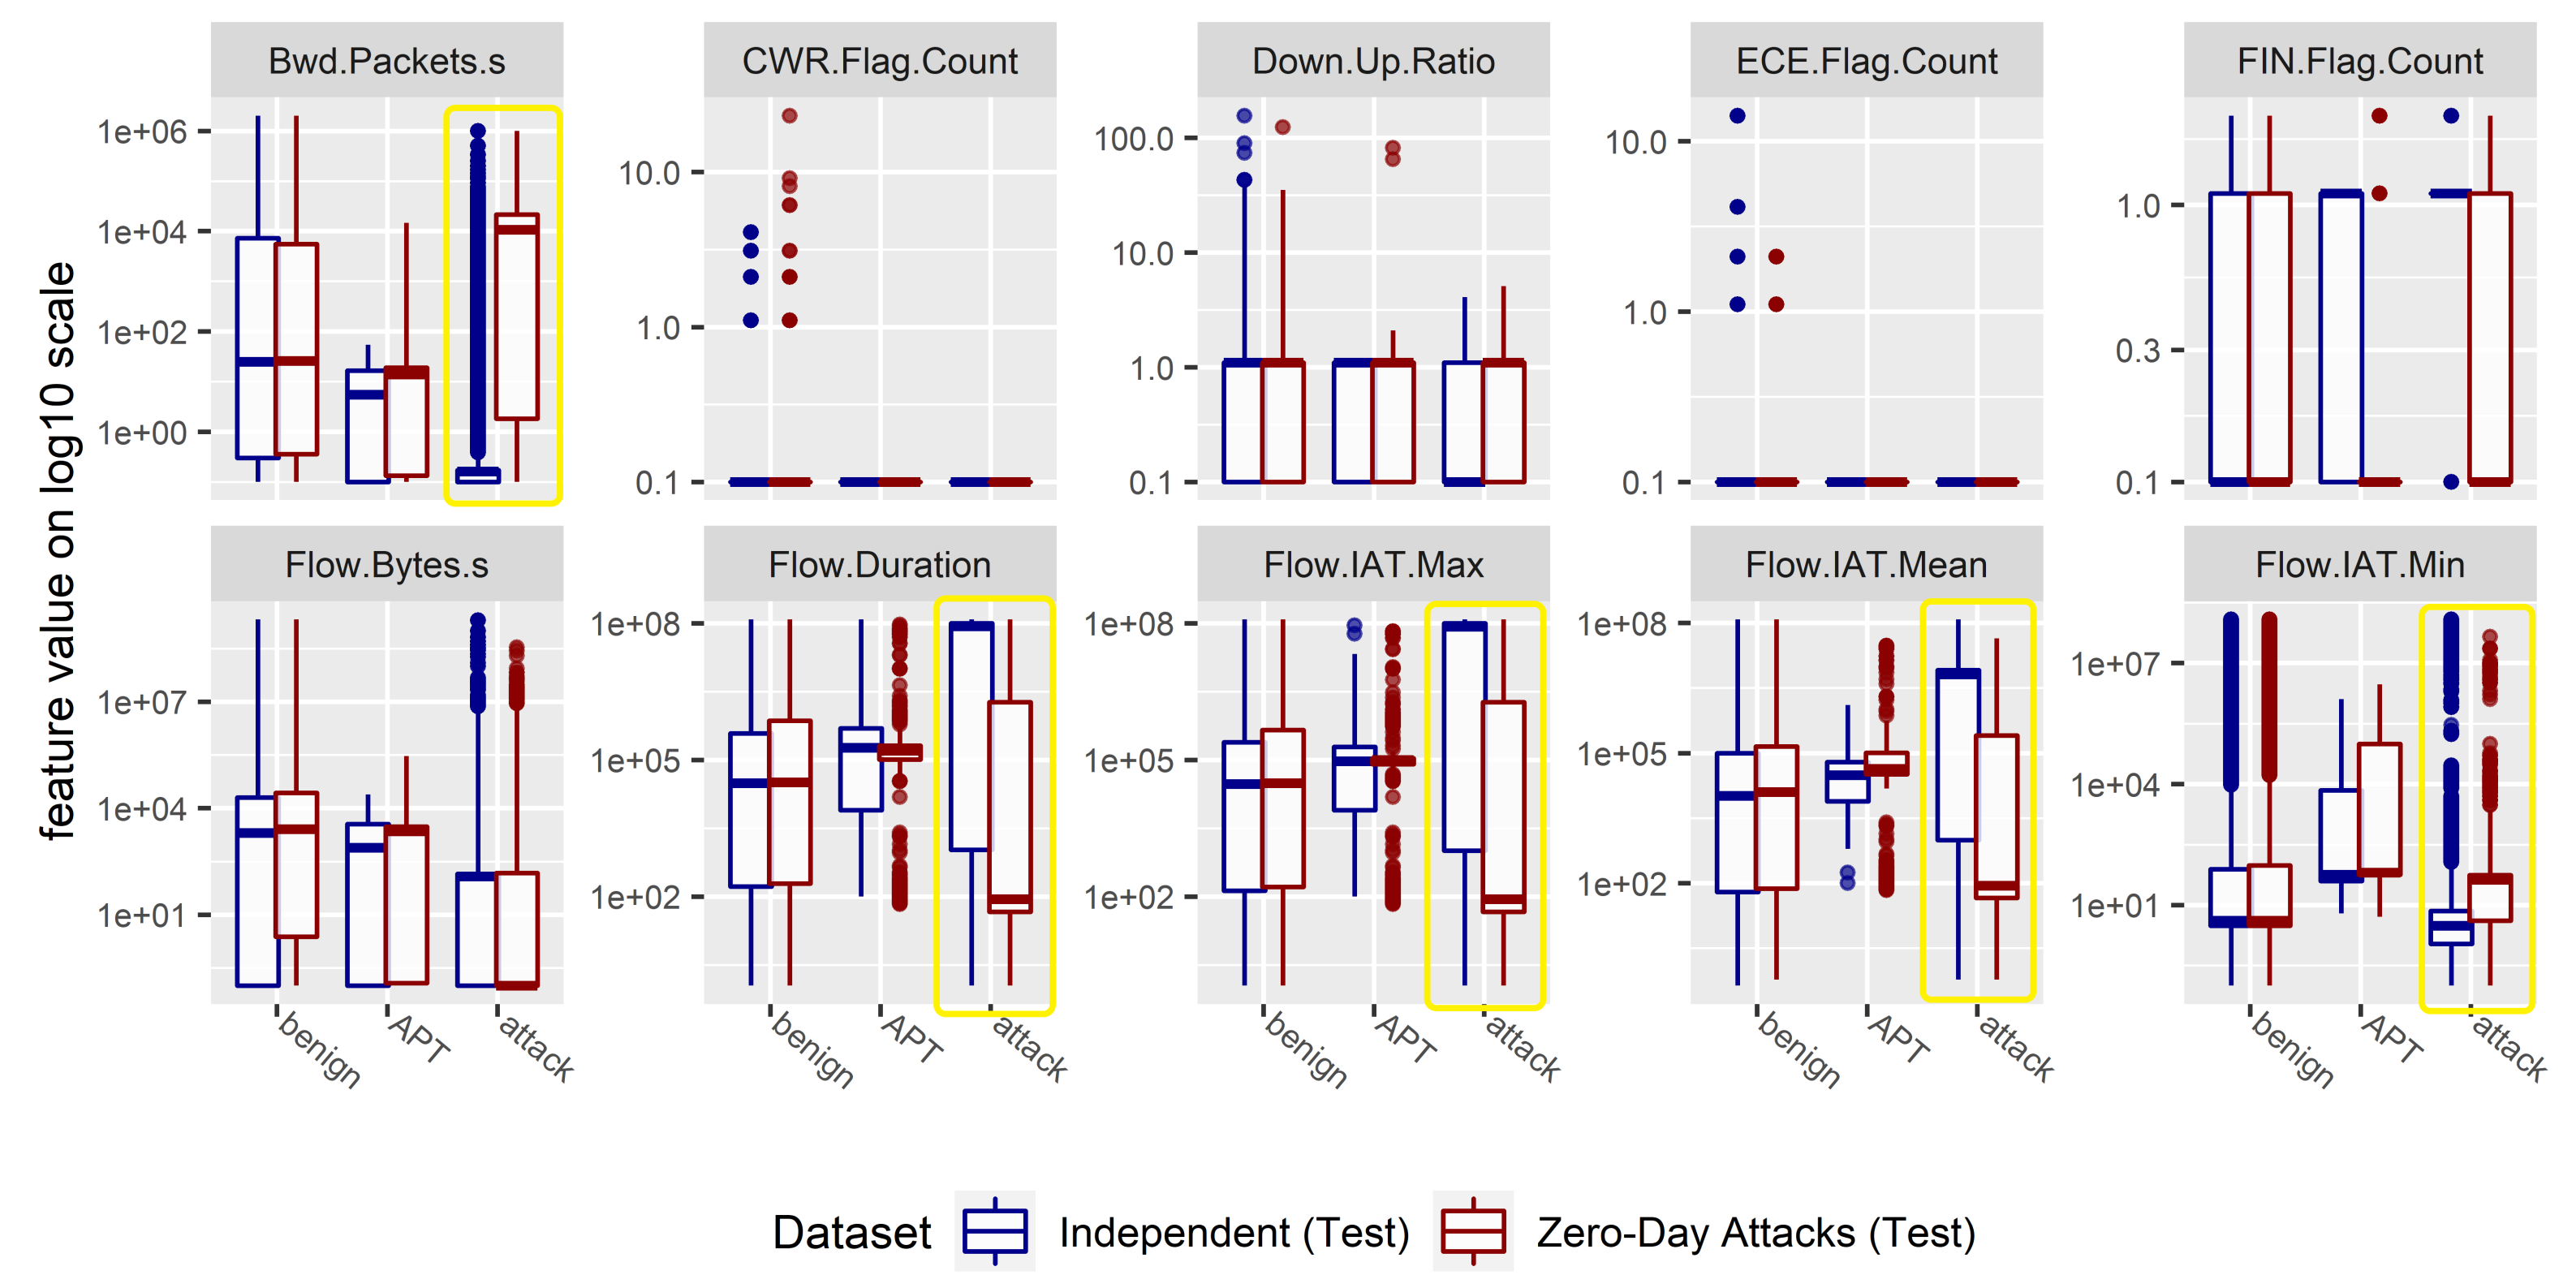
Furthermore, the feature distributions of both test data sets—independent (“independent”) and completely unknown (“zero-day attack”)—were compared with one another. In this case, a distinction was made between benign data (“benign”), background attacks from CICIDS2017 (“attack”) and the inserted APT attacks (“APT”). For some features, especially for the data of the background attacks, clear differences in statistical distributions can be recognized (for example, the boxplots framed in yellow in
Figure 2). In fact, the results illustrate the difficulty of operating reliable anomaly detection for completely unknown data or application scenarios: changed feature distributions, as they exist for the “zero-day attack” test data set, pose a great challenge for detection algorithms, which usually results in a weaker detection performance for such data.
4.2. Anomaly Detection with Autoencoders
As described in previous sections, the conducted experiments were tested on a combination of the two datasets. The combined result represents a more complex test dataset, which is used for validation and testing. In addition, the test dataset is further used for the additional testing of algorithms on previously unknown attack types. For the conducted tests, the following algorithms were applied:
Standard autoencoder (AE): This neural network comes with multiple, dense layers that are trained with benign data. It does not consider attack data during this process.
Autoencoder based on convolutional networks (AE-CNN): This comes in a combination of one-dimensional convolutional and dense connected layers. In addition, this system is trained with only benign data.
Variational autoencoder (VAE): This sampling-based autoencoder proposed by An and Cho [
40] consists of dense connected layers that are trained with only benign data.
Variational autoencoder using reconstruction probability (VAE-Prob): This probability-based autoencoder consists of dense connected layers. In addition, it is trained with only benign data.
One-class support vector machine (OCSVM): This ML model represents the “gold standard” in classic ML. Similar to the networks above, it is trained only with benign data.
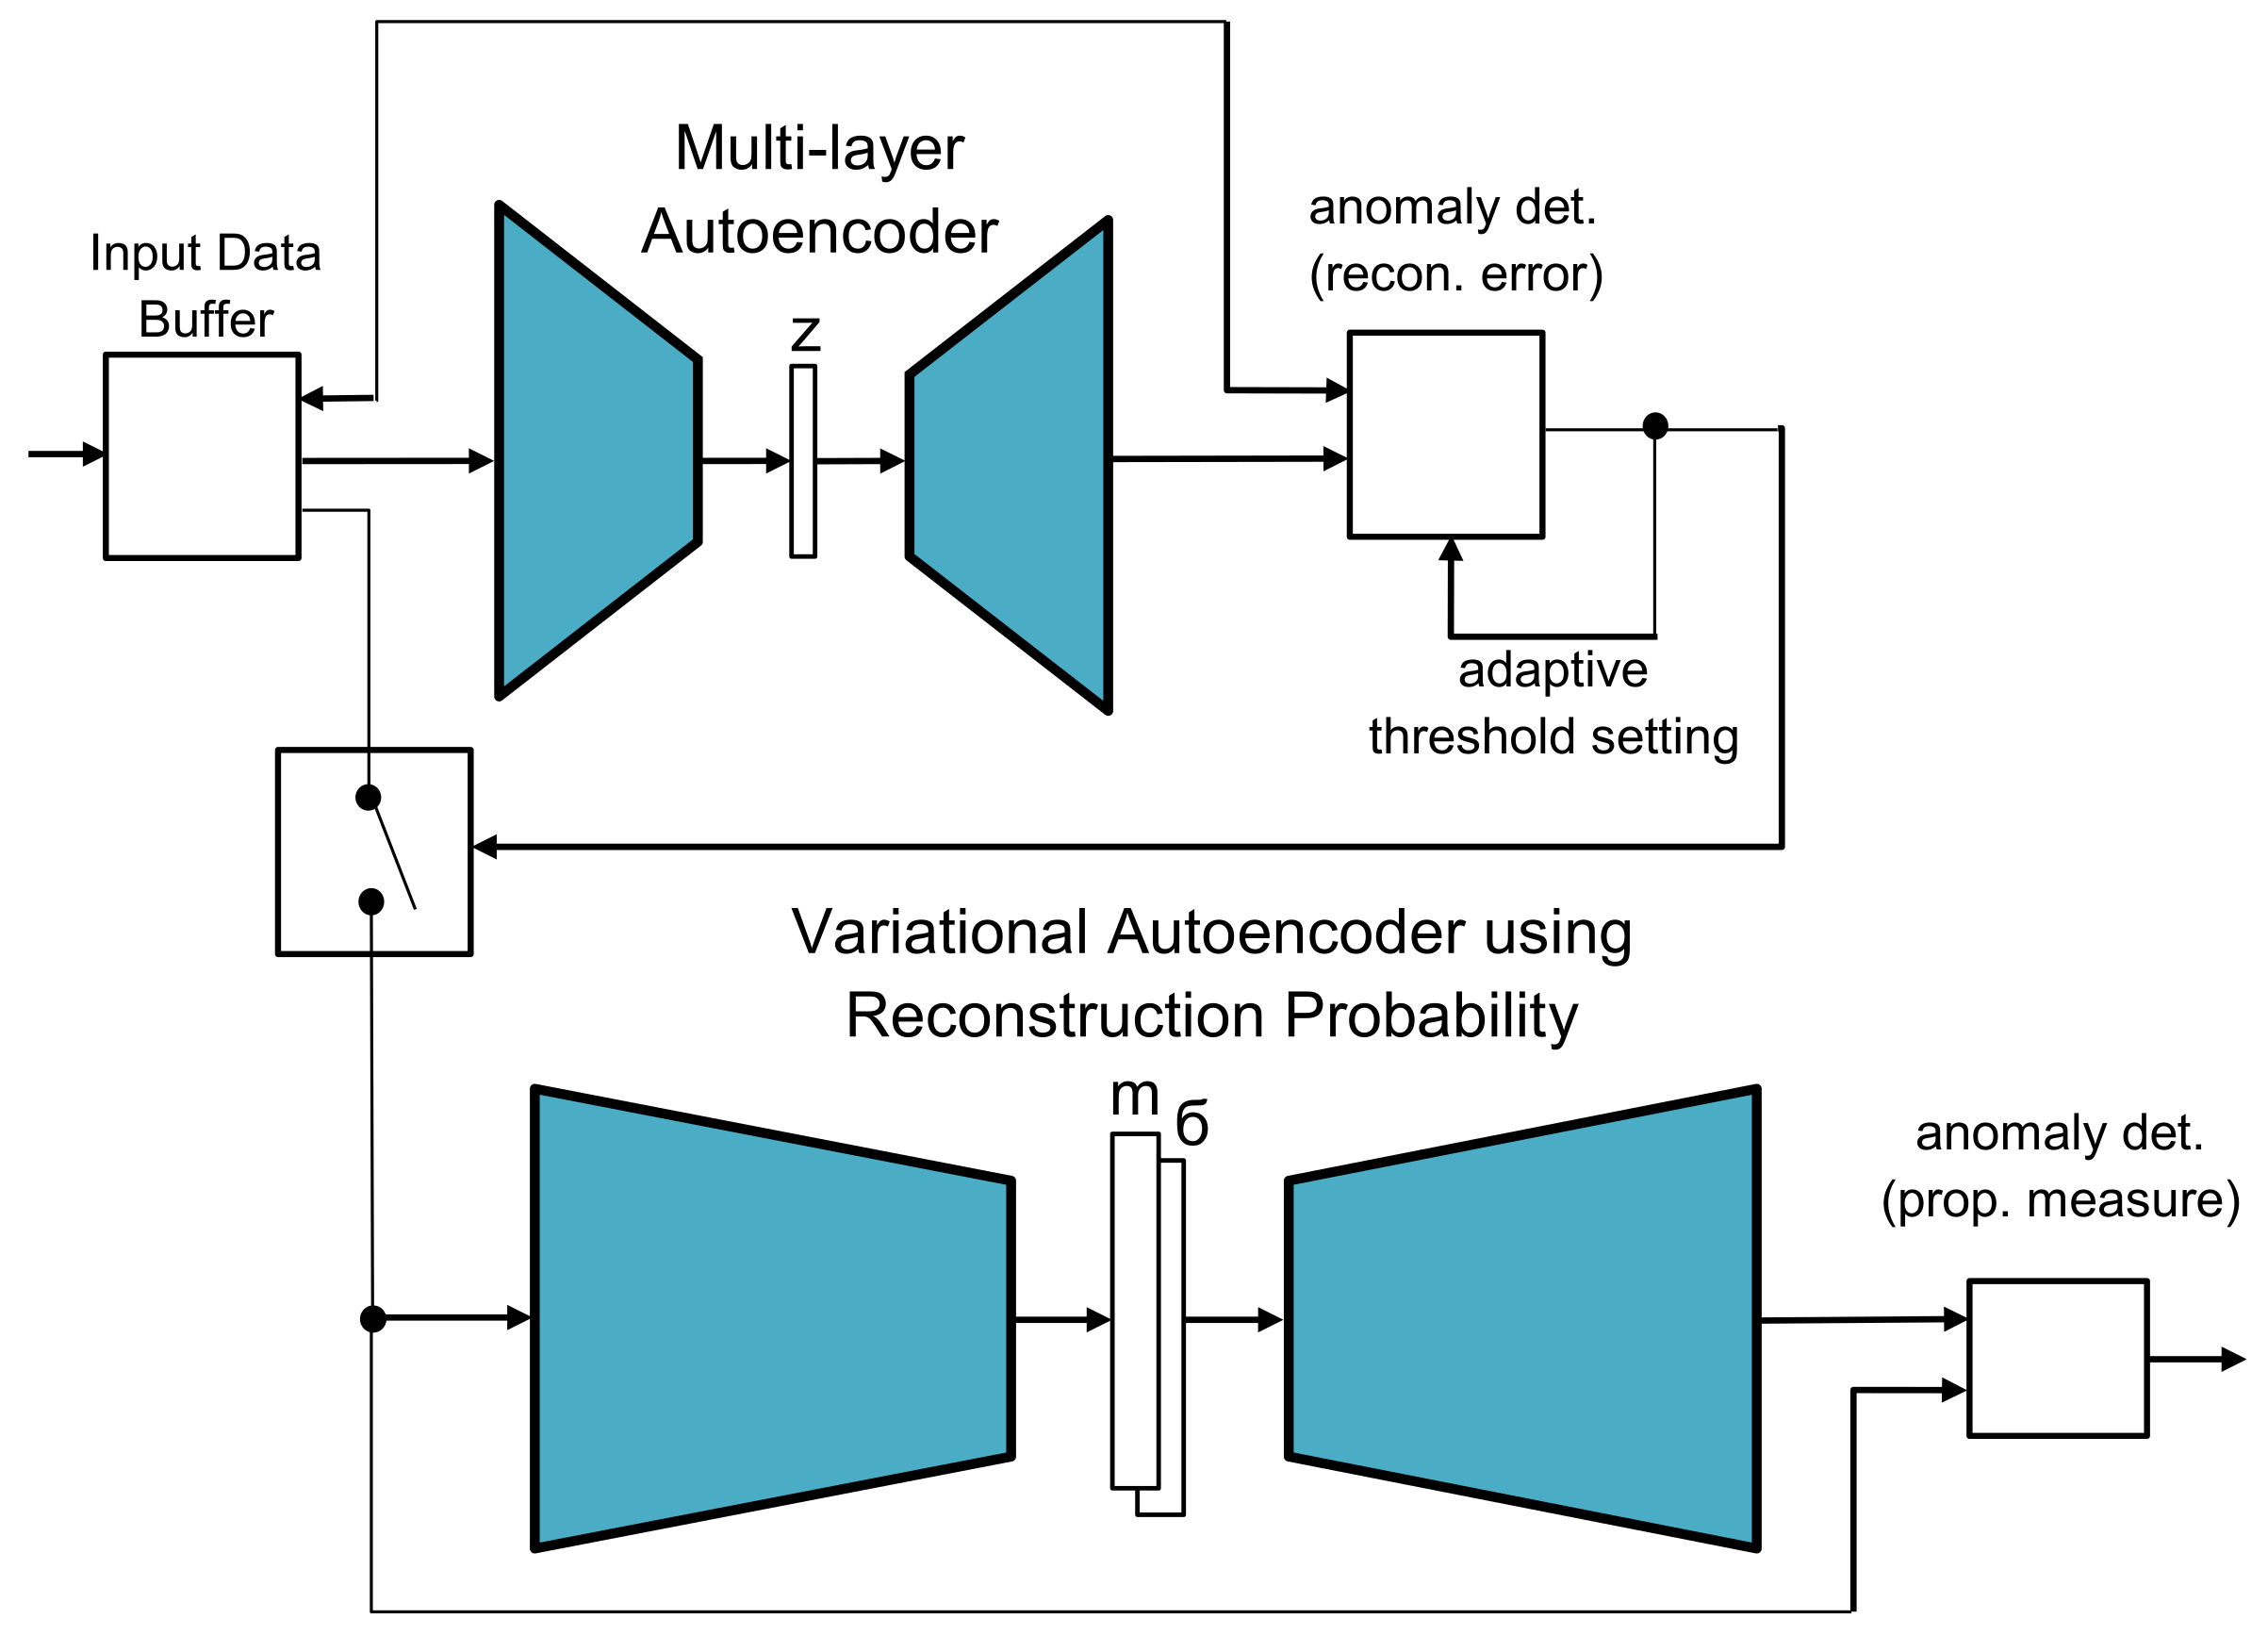
Combination of the standard autoencoder and the variational autoencoder (AE+VAE): This two-stage approach, as presented in the previous work in [
14], combines both models, which underlying idea is depicted in
Figure 3. In a first step—referred to as the pre-processing or filtering step—a fast anomaly detector filters out data which, with a very high probability, does not belong to any anomaly. The remaining data is then evaluated by a second, more specific, anomaly detector that provides a more accurate decision.
Autoencoder with labelled data (AEC): this autoencoder is used together with the custom loss function to achieve the best DL-based results. The “custom” loss function (used by AE-Custom) takes into account the anomaly data for the calculation of the reconstruction error
as follows:
where:
= reconstruction error;
n = number feature vectors;
= number of benign vectors;
= number of anomaly vectors;
= benign feature vectors;
= anomaly feature vectors;
= predicted feature vectors;
mse = mean square error function.
However, it should be mentioned that this autoencoder serves only for comparison purposes, since it represents a supervised method. In this way, it provides insights regarding the complexity of datasets.
Hyper-Parameter Optimisation
The implementation of neural-network models for different autoencoders is realised with Talos [
41]. This framework is used for the optimisation of hyperparameters. This means that Talos enables a random parameter search by applying a correlation method. The corresponding performance metric for model optimisation represents the area under the ROC curve (AUC). The parameter set that was selected for optimisation can be observed in
Table 3, as shown in the previous work in [
14].
In this work, most of the parameters of interest are defined with the Keras framework [
42]. In this DL framework, the “layer reduction” parameter defines how the number of neurons changes after each layer. This means that the number of encoder neurons is reduced or decoder neurons is increased (value: True ). In addition, the number of neurons can remain unchanged (value: False). Some of the parameters are applied only for some autoencoder variants. For example, the “number of convolutional layers” is only used in AE-CNN. Other parameters were predefined to meet specific performance conditions. Thus, they are obtained from personal experience after conducting some initial tests during the so-called exploration phase. For example, for one-dimensional convolution layers, the filter size is set to 16. However, if “layer reduction” is set to False, then the neuron number equals the input feature size
s. Otherwise, the number of neurons for the
i layer equals the following equation:
where:
= number of neurons at the layer i;
s = input feature vector size;
= latent (bottleneck) vector size;
= number of layers.
The resulting optimised parameters for each autoencoder algorithm are shown in
Table 4.
5. Evaluation
5.1. Evaluation Metrics
In order to evaluate the applied ML methods in our experiments, we rely on existing performance metrics from this domain. Therefore, we rely on the ROC (receiver operating characteristic) curve for the subsequent analysis. This graphical plot depicts the performance of anomaly detection based on multiple threshold values. However, the respective overall performance measurement across all of ROC’s threshold settings represents AUC-ROC (area under the ROC) curve. This metric is applied in ML for checking the performance of the classification model, as required in this paper. In general, the ROC curve depicts probabilities, whereas AUC measures how the ML model distinguishes between different classes. The higher the AUC, the better the model performs this task.
In addition to ROC and AUC, the following metrics derived from the individual threshold values and based on the confusion matrix are commonly considered for evaluation: balanced accuracy, precision, recall and
f score [
43,
44].
In practice, the basic evaluation measures (confusion matrix) represent the absolute number of correctly recognized anomalies (TP—true positives), the number of correctly recognized benign data (TN—true negatives), benign data wrongly recognized by the algorithm as anomalies (FP—false positives) and the wrongly overlooked by the algorithm anomalies (FN—false negatives). In order to compare data sets of different sizes, they are normalized according to the dataset size, i.e., the amount of benign data or anomalies (TP rate or TPR, TN rate or TNR). Subsequently, derived parameter values in the evaluation are accuracy (acc), balanced accuracy (balAcc), precision (prec or PPV), recall (rec, equal to TPR) and f score, as common in the literature.
The
f score, the most commonly used evaluation metric in similar applications, represents an evaluation measure between “recall” and “precision” in the form of a single number. The respective value can be further used depending on the area of application and desired statement. This equation is defined in the following manner:
Balanced accuracy (balAcc), in contrast to “accuracy”, is particularly suitable for the evaluation of unbalanced datasets—datasets that exhibit large differences in the amount of positive and negative data, i.e., anomalies and benign data. It is defined as the average value of TPR and TNR. The equation for “balanced accuracy” is given as follows:
5.2. Evaluation–Independent Test Dataset
This section discusses the obtained evaluation results for the detection of anomalies in the independent test dataset, as shown in
Table 5 and
Table 6. In total, this dataset contains 1,637,230 entries, out of which 1,334,003 entries represent benign data and 303,227 are attack traces. The corresponding contamination rate equals 18.52%.
With respect to the TP and TN rates, all algorithms exhibit good and practically useful results. However, AEC stands out as the theoretically best possible result. Unfortunately, this is only the case for unrealistic and practically irrelevant scenarios. In addition, AE-CNN and VAE achieve a slight improvement compared to the implemented standard ML method (OCSVM). As expected, the results of the purely autoencoder-based methods are below those of the variation autoencoder in terms of runtime. In any case, the OCSVM can be attested to have a “negative” runtime performance.
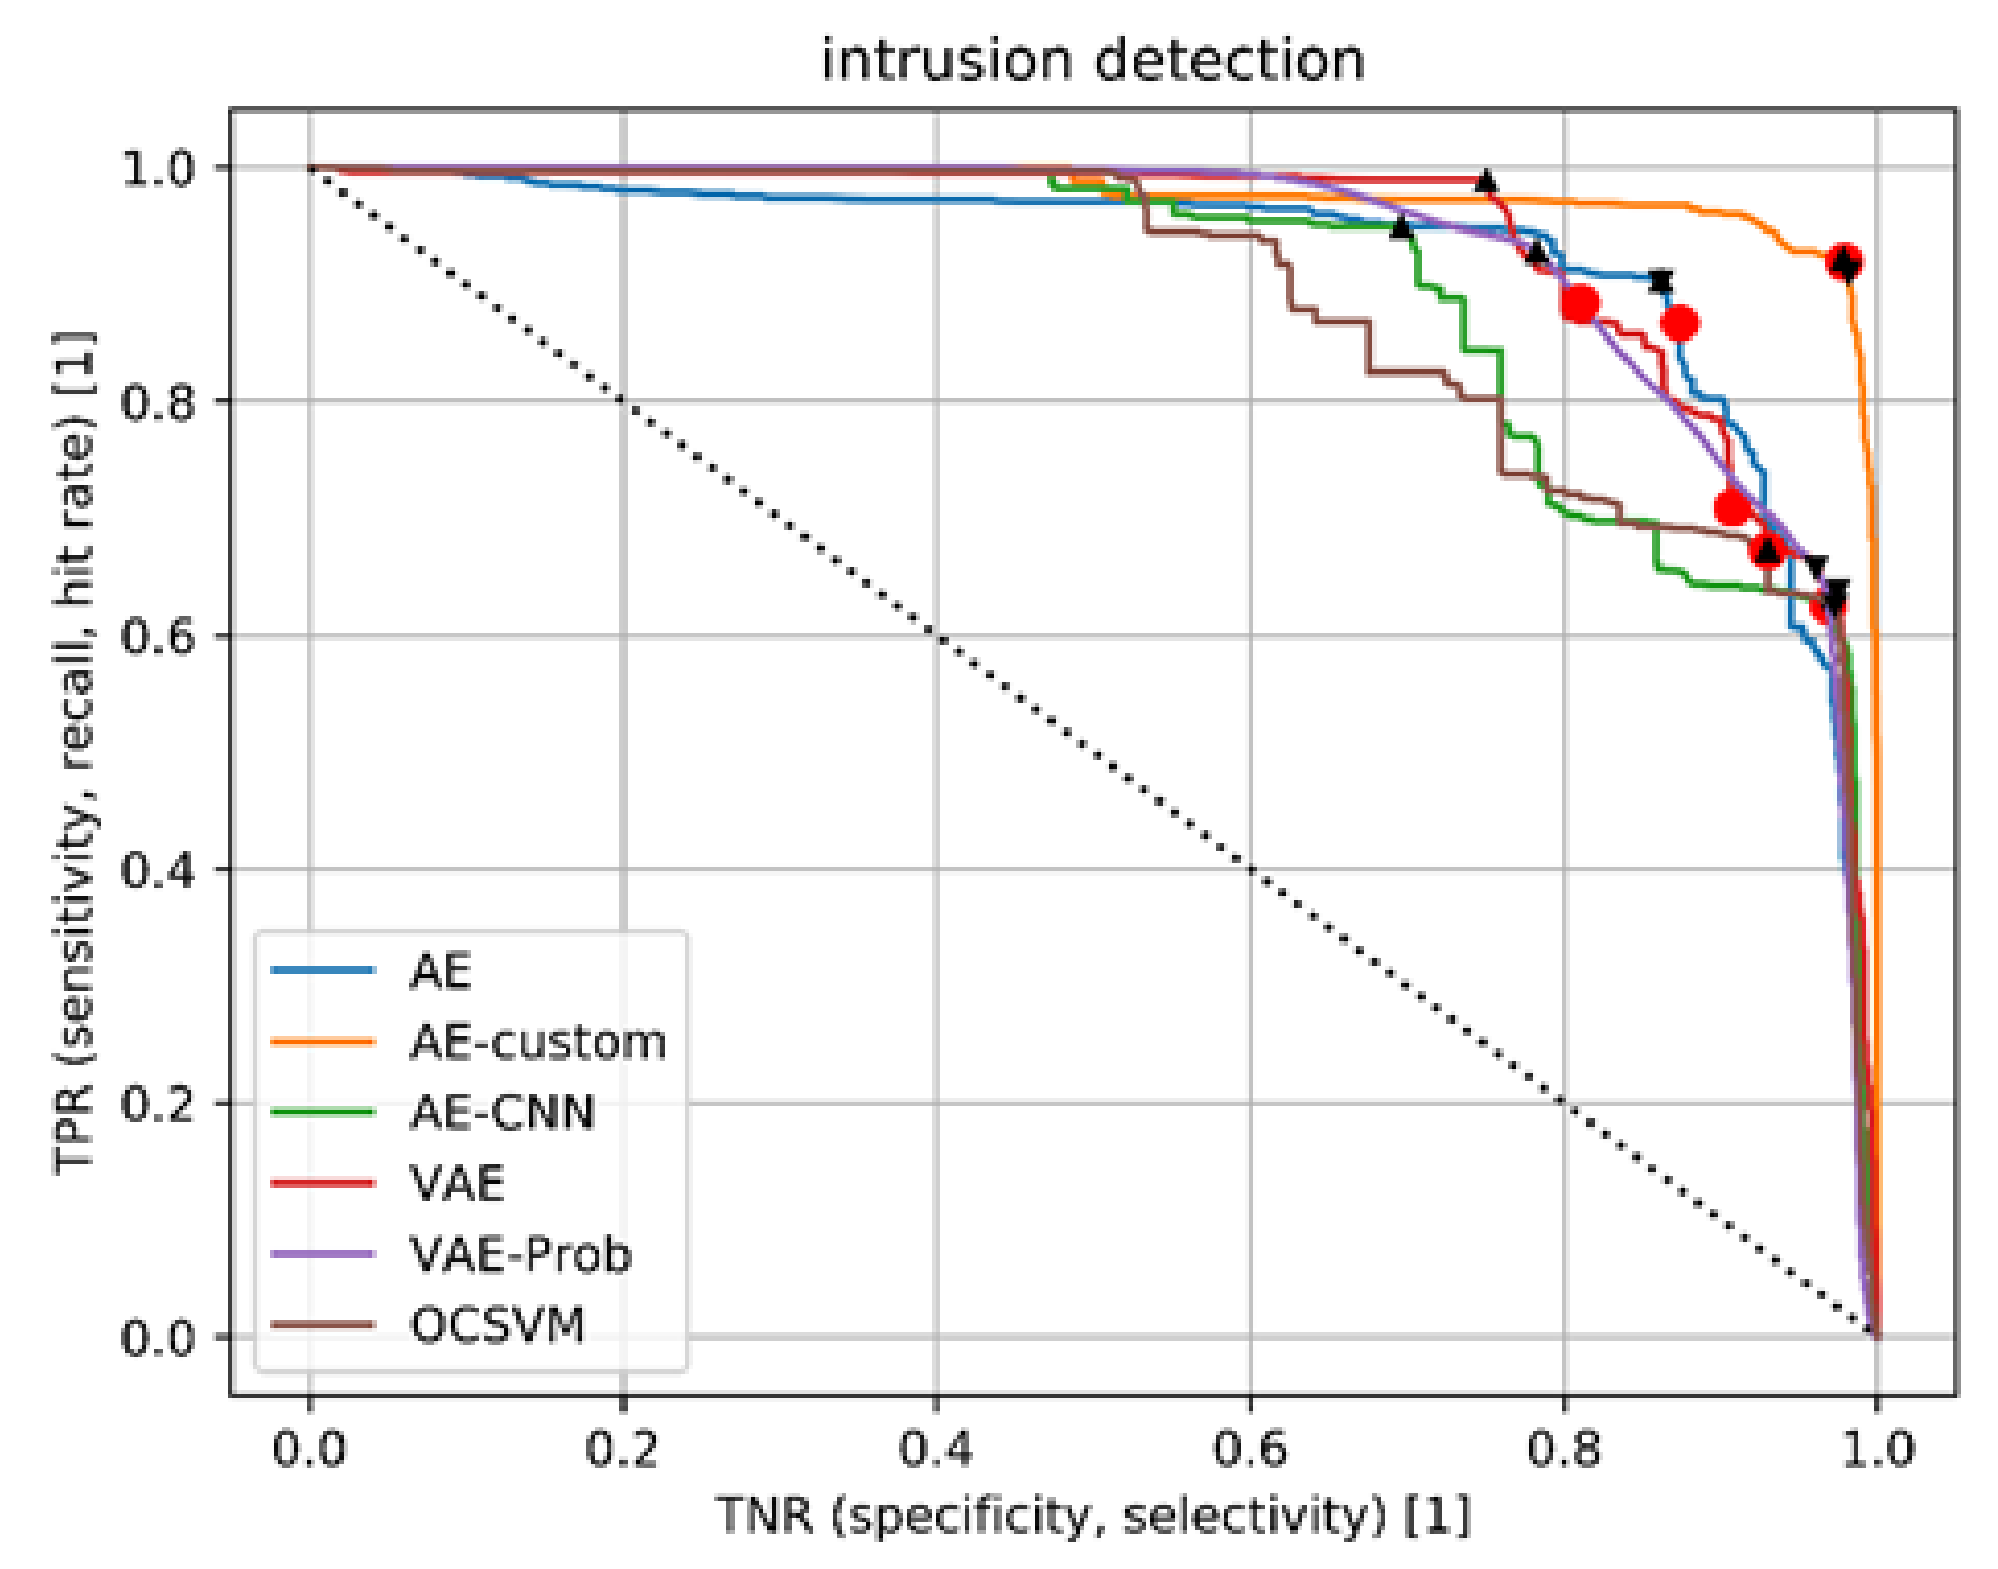
It is important to mention that all values relate to a very special, selected working point during the process. All such points were determined during training in the course of the validation. A better assessment of the performance behaviour can be obtained from ROC curves, which are shown in
Figure 4. All relevant TN and TP rates are plotted on the x and y axis, respectively. They include associated rates for different algorithms, shown in color. The red dots mark the optimal threshold values determined in the course of the training, whereas the black triangles show the position of the optimal threshold values with regard to the independent test data. The dotted line represents the performance of a “random” anomaly detector. The depiction demonstrates the superb efficiency of the normal autoencoder AE (blue), sampling-based autoencoder—VAE (red)—and the probabilistic autoencoder variant VAE-Prob (violet), compared to the standard OCSVM (brown). The same behaviour, however, is not pronounced for the convolution-based autoencoder AE-CNN (green) and the clearly superior, practically unusable—but theoretically best possible—autoencoder with custom loss-AEC (orange).
Curiously, another interesting assumption can also be derived from the representation. The combined, two-stage approach—although very attractive in terms of the runtime performance (see
Table 6)—cannot fully exploit the qualitative performance advantages in comparison to the normal autoencoder in the scenario examined. The reason, therefore, lies in the (coincidentally) very good agreement between the threshold value, as determined during training (red dot), and the “optimal” threshold value (triangle pointing upwards) for the AE (blue line), as shown in
Figure 4. However, this behaviour cannot be observed for most other algorithms. Thus, it can be assumed that, in practice—especially under changing boundary conditions in the observed network—an adaptation of the threshold values at runtime is necessary and extremely useful. This should be performed from time to time, e.g., by experts, and based on actually observed anomalies.
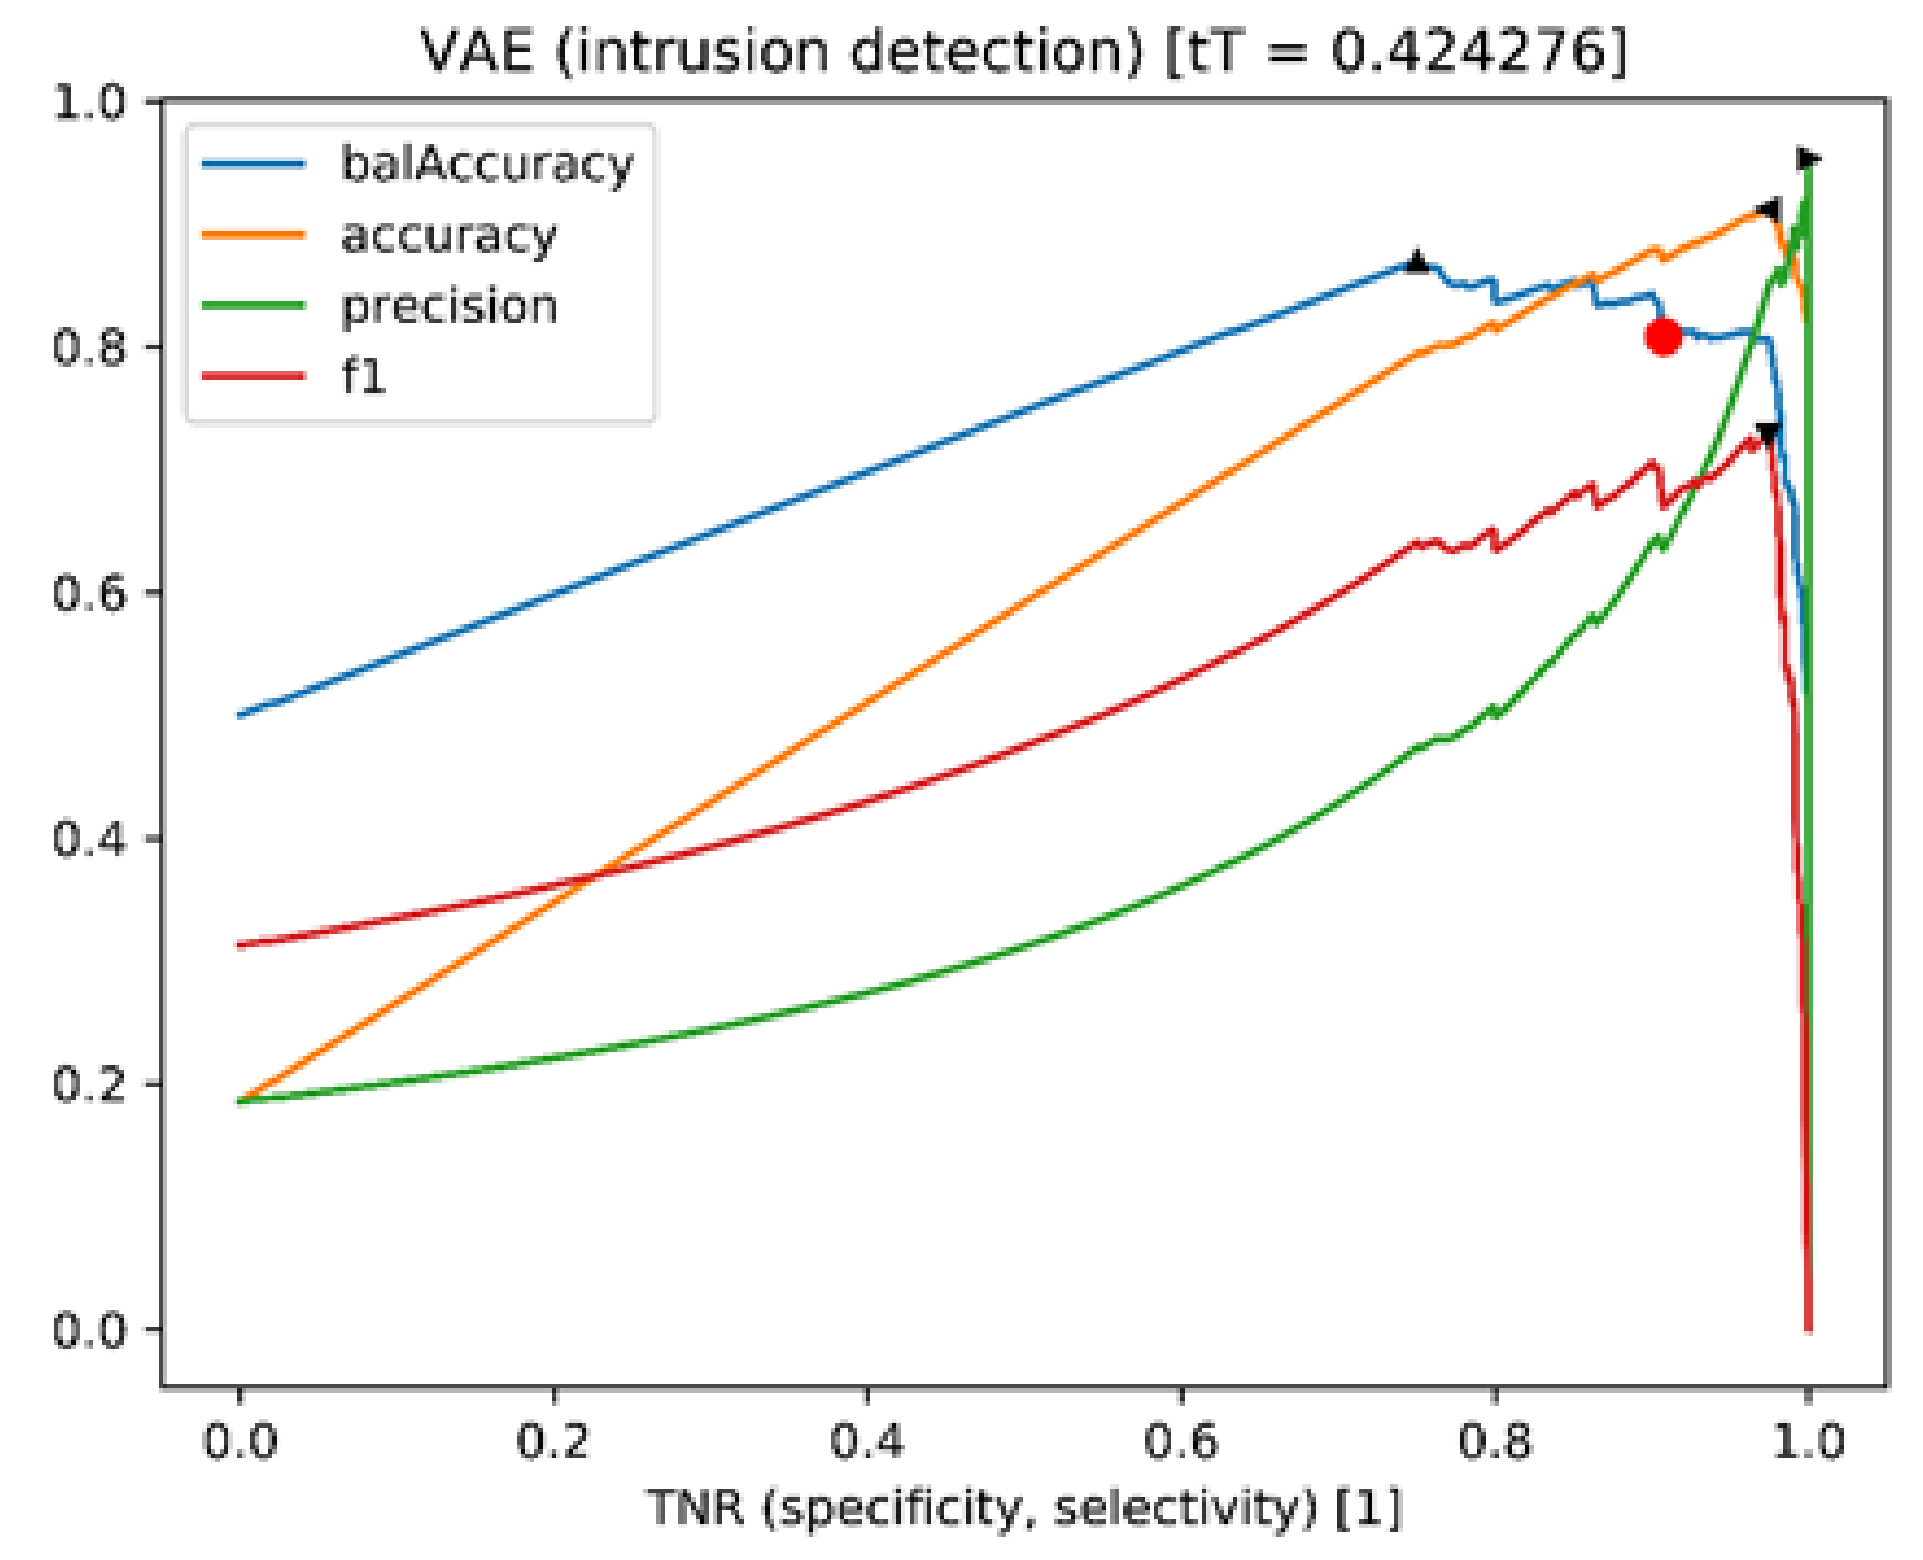
In any case, the latter is also evident from the analyses of the determination of threshold values. These values are optimised for certain quality measures in relation to the threshold values (red dots), which are optimised during the course of the training. An exemplary analysis for the sampling-based variation autoencoder (VAE) is shown in
Figure 5. As can be seen, an adjustment of the threshold value (determined during training) with regard to a slightly lower TNR can lead to significantly better performance (balanced accuracy). This means that the TNR implies only a slight increase in incorrectly reported anomalies.
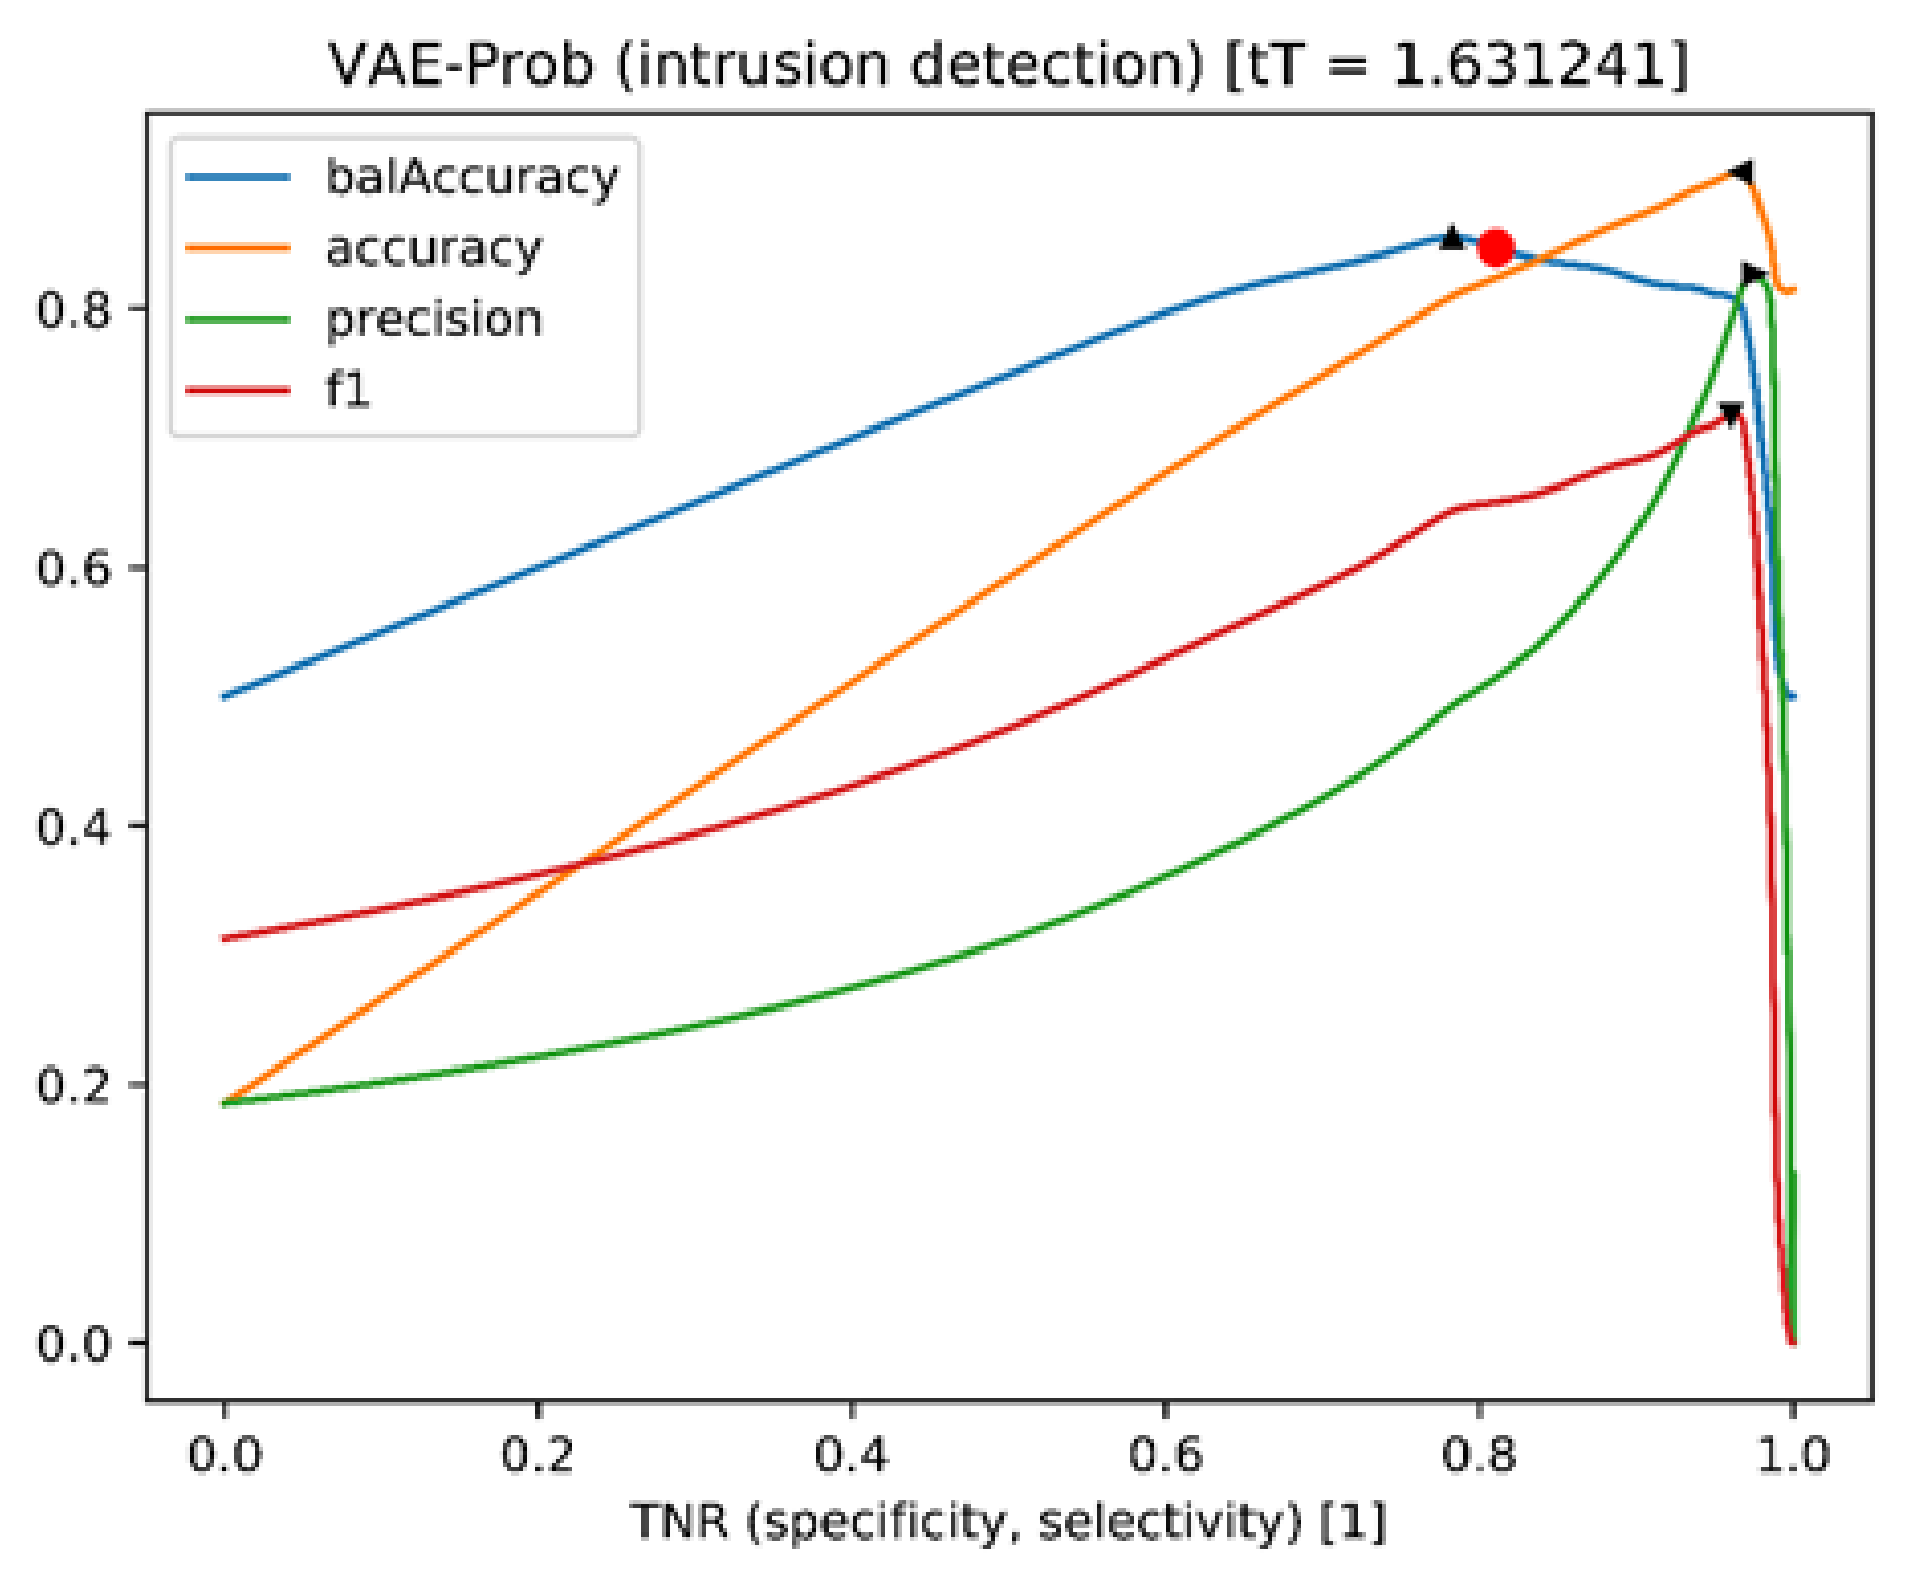
It should be noted that the above observation should not apply to the probabilistic autoencoder variant (VAE-Prob). In fact, it is shown that the threshold value (red dot) optimised during the course of the training is close to the actual optimum for the balanced accuracy (black, upward-pointing triangle), as shown in
Figure 6. The user also benefits from the behaviour of the two-stage approach (AE+VAE-Prob) (
Table 5 and
Table 6). In fact, the precise analysis of “suspicious” data filtered out during the first stage remains independent of the choice of the threshold value for different scenarios.
5.3. Evaluation—Zero-Day-Attacks Test Dataset
An important challenge for ML algorithms constitutes the evaluation of methods for scenarios with unknown attacks. These “zero-day attacks” do not correspond to trained application scenarios in boundary conditions. Analogous to the evaluations for the independent test dataset,
Table 7 and
Table 8 show numerical results analogous to the measures and metrics, as defined above. It should be noted that this dataset contains 1,593,831 entries, out of which 1,276,109 entries constitute benign data with 317,722 attack traces. In addition, the contamination rate equals 19.93% in this case.
In the case of the confusion matrix, it is noticeable that, with threshold values determined in the training, consistently similar TNRs are achieved as in the evaluation of the independent test data set. However, the TPRs are significantly lower, in some cases in the range of 20–30%. This can also be observed in the reference approach of classic ML. The same conclusion applies for the best possible autoencoder in unrealistic scenarios (AEC). Thus, it can be claimed that this dataset is characterized by significantly increased complexity and difficulty. The most remarkable result is the excellent performance of the probabilistic variation autoencoder (VAE-Prob) with a TPR of over 40%. The two-stage approach (AE+VAE) exhibits a comparable performance as well. Both observations can be regarded as remarkable results, especially when considering the significantly reduced runtimes (see final column in
Table 8). Similar outcomes are also achieved for
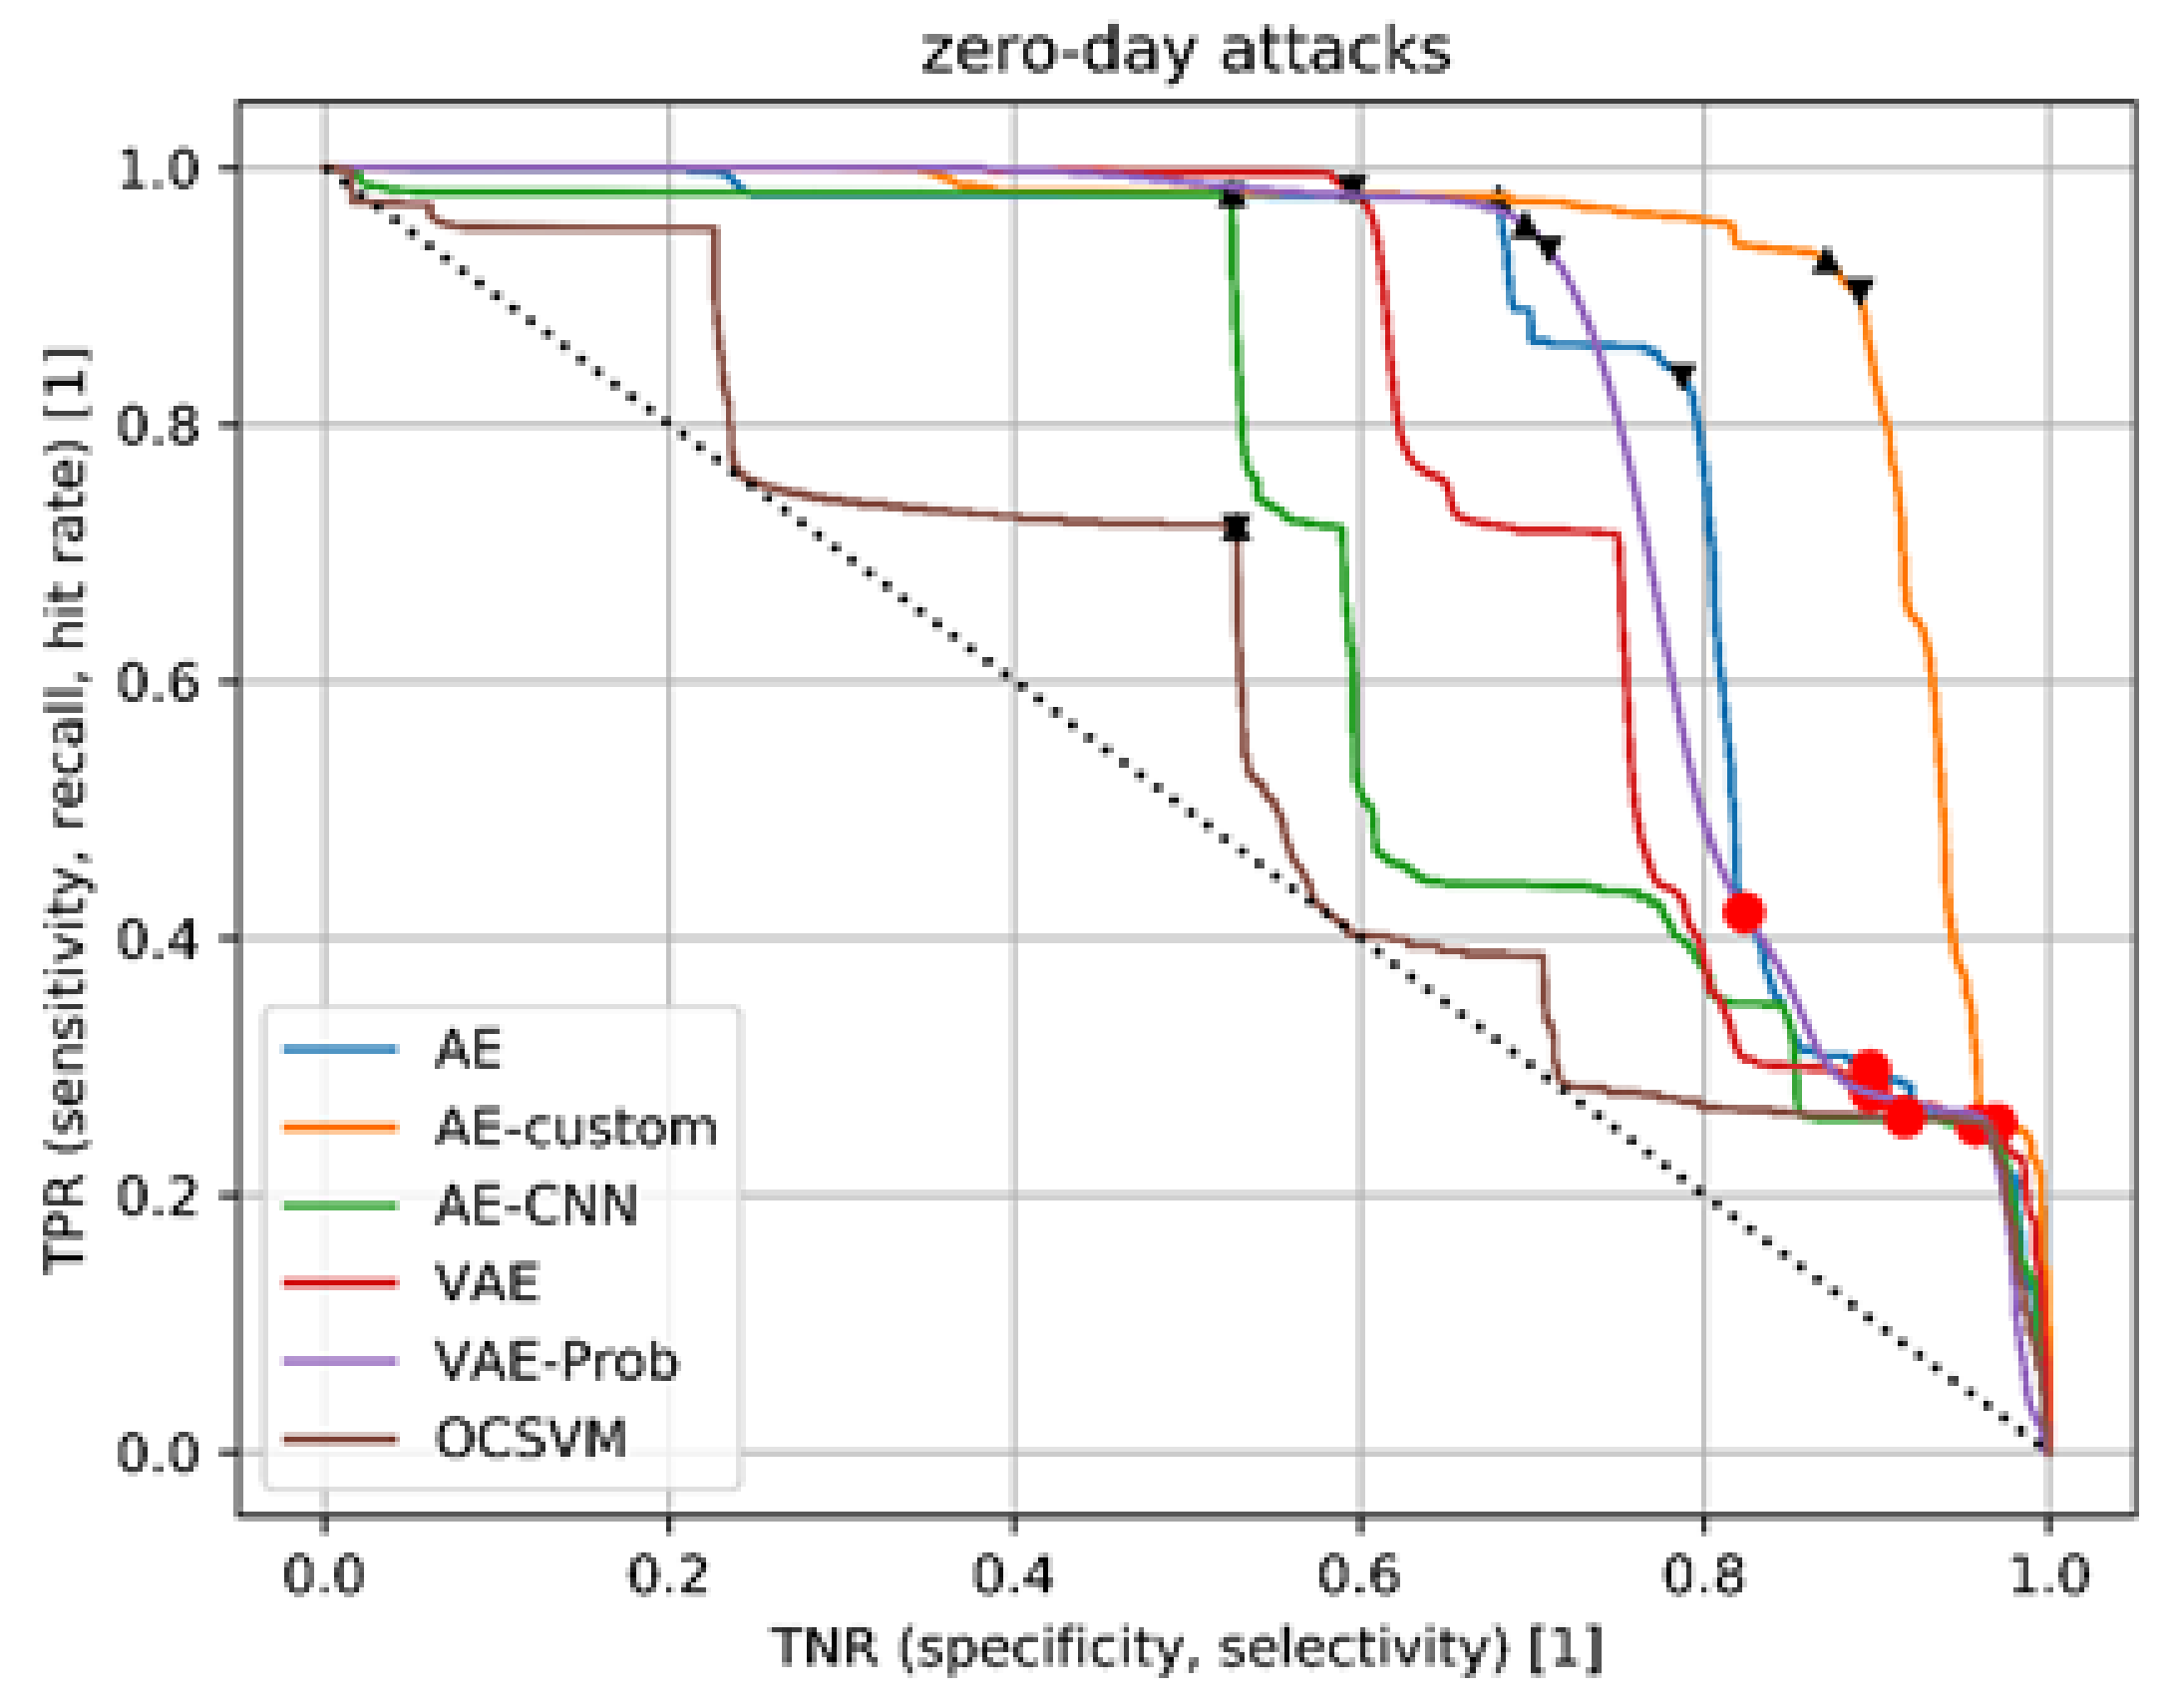
f values in the context of AE-VAE. In addition, the runtime of OCSVM is extremely high in this case. This means that it is analogous to the results for the independent test data sets. Another overview of the results provides the receiver operating curve (ROC) in
Figure 7. This representation depicts the obtained threshold values for each algorithm. The red dots mark the optimal threshold values that are determined during the training. On the other hand, the black triangles indicate the position of optimal threshold values with regard to zero-day attacks.
It should be noted that OCSVM does not achieve any meaningful results in this case. In addition, the results are even totally random with some threshold settings (brown curve). The autoencoder with custom loss AEC (orange), which cannot be used in practical operation despite its theoretical efficiency, also performs significantly worse than in the previous evaluation for the independent test data set.
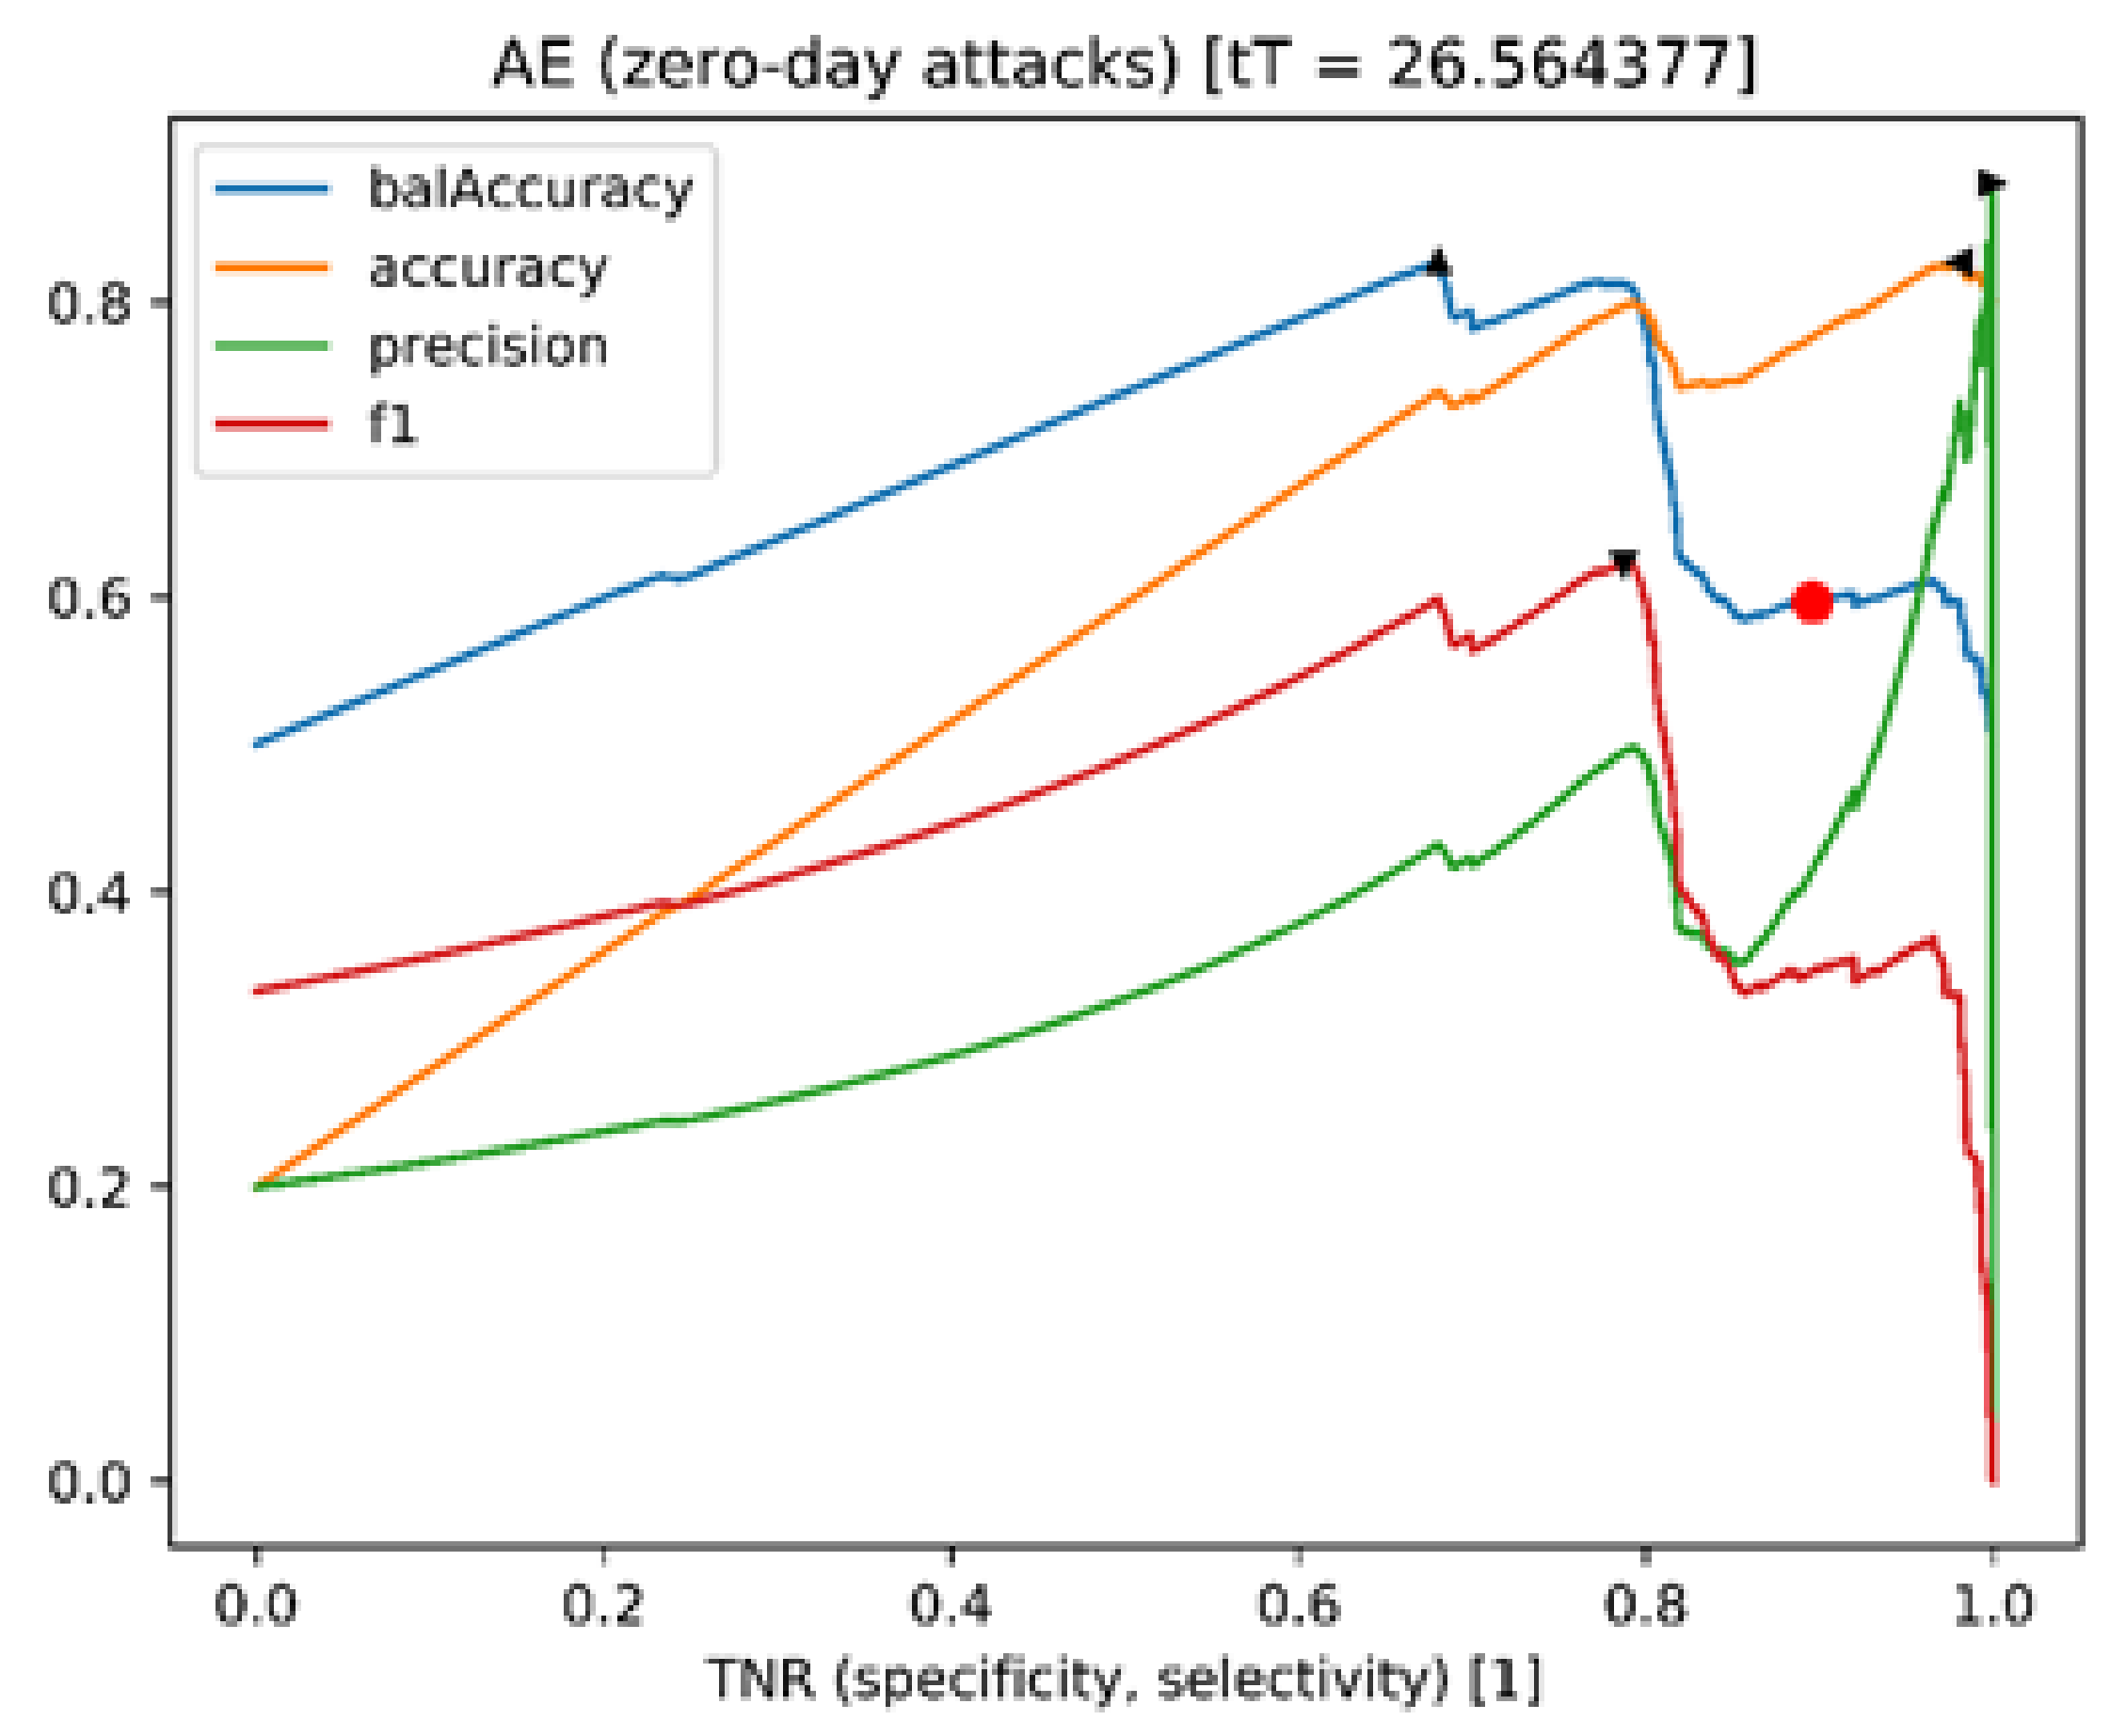
A qualitatively similar conclusion emerges for the other algorithms as well. Whereas AE-CNN performs in the weakest manner, AE and VAE achieve better results. However, it is noticeable that all optimised threshold values from training (red dots) can be found in a rather low TPR range. Here, too, corresponding adaptations and adjustments to threshold values can lead to significantly better detection rates in this scenario. This includes operators based on previous knowledge that are limited by the number of possible false detections—FPs. This claim is also strengthened by the analysis of the values (red dots) that are optimised in the course of the training. This is achieved with regard to the theoretically “optimal” threshold values for zero-day attacks (black triangles), which applies different metrics from the “normal autoencoder”, as shown in
Figure 8. A significantly higher balanced accuracy is also be possible, but the operating point must be shifted towards a slightly lower TNR.
6. Discussion
The majority of existing research works on anomaly detection in networks focus on the application of intrusion detection. However, this represents only the initial step in the bigger picture of attack detection. Thus, the multi-stage process of detecting APT attacks has been mostly ignored so far. In general, the latter represents a critical matter for further practical applications of anomaly detection. As already mentioned in this paper, one technical obstacle represents the absence of benchmark data sets. For this reason, project-specific training and test data are proposed in this work. Basically, both test datasets (independent and zero-day-attacks datasets) are derived with the help of available statistical and feature extraction methods from two existing cybersecurity datasets—CICIDS2017 and Contagio. Whereas CICIDS2017 encompasses benchmark data for a general (one-stage) detection of cyberattacks, Contagio considers APT attacks as well. In addition, the latter includes a set of concrete attack examples that are obtained through so-called honey pots. Both test datasets were subjected to a descriptive and explorative statistical analysis prior to the actual anomaly detection. The subsequent investigation provided information on the plausibility of features, including the ones that contain deliberate data errors and constant values. In addition to that, histograms and boxplots were used to visualise the statistical distribution of features. In addition, these representations reveal an explorative comparison of benign data and data that contains APT attacks. In such way, an initial impression is given of the relevance of features for anomaly detection.
Additionally, within the framework of correlation analysis and visualisation, groups of correlated and identical features were identified. In this way, entire feature groups in datasets can be partially ignored without the expected loss of information. Thus, feature complexity was reduced and the training speed was increased. In fact, the latter observation denotes a faster convergence of the corresponding ML model. Finally, a principal component analysis (PCA) made it possible to estimate the extent of possible dimensional reductions in the features in question.
As already mentioned, the implementation of the two-stage anomaly detector for intrusion detection is presented in our previous work in [
14]. The proposed approach combines the benefits of fast methods and their moderate detection quality with slow methods, i.e., fast detection quality, respectively. In this way, large amounts of data were analysed and dynamically adapted to practical challenges. In particular, the AE-CNN method is well-suited to the initial filtering phase. For example, it allows for a reduction by 82% of analysed network data in cases where more undetected cyberattacks (up to 10%) are accepted. The combination with VAE or VAE-Prob during the next phase can reduce the calculation time, when compared to the one-stage approach. Another effect of the two-stage approach is an increase in precision value. This is due to the additional processing by using two methods.
7. Conclusions and Future Work
In this paper, the analysed datasets relate to multiple independent application scenarios, and also include APT-attack traces (derived from Contagio and merged with CICIDS2017). For example, the evaluation of the combined CICIDS2017/Contagio dataset shows that variational autoencoder approaches (VAE, VAE-Prob) achieve better results than normal autoencoders. However, all the inspected algorithms exhibit satisfying results, especially with regard to the practically relevant TP and TN rates. On the other hand, new methods in the scenario with “completely unknown”, i.e., zero-day, attacks exhibit similar TN rates, but with lower TP rates. Similar results are also observed when applying the reference approach of unrealistic scenarios from classical ML. The reason for this, therefore, is the increased dataset complexity, which does not represent a problem of the procedure itself. For both datasets, it can be concluded that the running time of the pure autoencoder methods is slower than that of the variational counterpart. The best performance is achieved with VAE-Prob, which is independent of the selected threshold value. In addition, the two-stage approach exploits these advantages without losses in the runtime. Nevertheless, it can be assumed that a further adaptation of threshold values at runtime would improve the results. This is especially the case with changing boundary conditions, which should be checked on a regular basis.
A major conclusion of the work proposed in this paper is that unsupervised machine-learning methods can be successfully used to detect advanced cyberattacks targeting network infrastructures. Even in a case of a new attack type with a pattern unknown during the training and validation phases, trained models could be used successfully without a need for re-training. Beneficial improvements in this case would include developing methods for a threshold adaptation.
Given all the results and observations, our future work will include the automation of threshold selection and consider practical applications. It will also include the testing of simulation environments and deriving new and comprehensive datasets for APT-attack detection evaluation.


 ,
, 


