Article

Link Pruning for Community Detection in Social Networks

Department of Computer Science and Engineering, Chungnam National University, Daejeon 34134, Korea
*
Author to whom correspondence should be addressed.
Appl. Sci. 2022, 12(13), 6811; https://doi.org/10.3390/app12136811
Submission received: 29 May 2022 / Revised: 28 June 2022 / Accepted: 4 July 2022 / Published: 5 July 2022
(This article belongs to the Special Issue Social Network Analysis and Mining)

Abstract

:
Attempts to discover knowledge through data are gradually becoming diversified to understand complex aspects of social phenomena. Graph data analysis, which models and analyzes complex data as graphs, draws much attention as it combines the latest machine learning techniques. In this paper, we propose a new framework called link pruning for detecting clusters in complex networks, which leverages the cohesiveness of local structures by removing unimportant connections. Link pruning is a flexible framework that reduces the clustering problem in a highly mixed community structure to a simpler problem with a lowly mixed community structure. We analyze which similarities and curvatures defined on the pairs of nodes, which we call the link attributes, allow links inside and outside the community to have a different range of values. Using the link attributes, we design and analyze an algorithm that eliminates links with low attribute values to find a better community structure on the transformed graph with low mixing. Through extensive experiments, we have shown that clustering algorithms with link pruning achieve higher quality than existing algorithms in both synthetic and real-world social networks.

1. Introduction

The importance of data has increased steadily in modern society. The rapid changes and advancements in big data analysis over the past decade have received considerable attention from researchers. Accordingly, more benefits in artificial intelligence and deep learning technology, which contribute to developing industries, cannot be obtained without data management and processing technologies. The shape and information of data have become more diverse and complex, and the demand for data applications has increased simultaneously. This demand has increased the interest of researchers in graph mining technology, which can help analyze relationships and interactions of data. Graph mining is one of the fundamental problems in social network analysis, which has numerous applications [1]. Furthermore, the development of deep learning technology for graph data analysis has recently garnered the attention of researchers and industries [2].
Graph modeling provides a useful way to represent and analyze unstructured and complex data. Practical graph mining requires the understanding of data characteristics and appropriate application problems. The first step for successful graph mining is to model a given dataset of interest as a graph or convert a given graph dataset to a transformed graph that can be easily utilized. That is, each data element can be represented as a node, and the interactions or relationships between nodes are represented as links. The characteristics of nodes or links can be modeled as attributes. After that, graph representations can be used to solve machine learning problems through supervised learning or unsupervised learning. In particular, community detection (or graph clustering) is a technique for finding the community structure, with dense links joining nodes of the same community and comparatively sparse links joining nodes of different communities [3]. Thus, communities are regarded as groups of nodes that likely share common properties or play similar roles within the graph.
In this paper, we propose a new community detection algorithm for undirected graphs by removing unimportant connections with low values of some link attributes. We present three link attributes for the link removal process, which are appropriate for measuring the strength of local connections in social networks: (i) Jaccard’s index (which we call Jaccard), (ii) the number of common triangles (which we call CommonTriangles), and (iii) the Forman–Ricci curvature (which we call Forman–Ricci). These three link attributes consider substructures surrounding two adjacent nodes, and a denser substructure implies a higher link attribute. Using the link attributes, we propose a new framework called link pruning that eliminates links with low values of attributes to identify an enhanced community structure on the resulting pruned graph with low mixing. After link pruning, the transformed graph could be sparse, but the local communities are easier to detect. We call them enhanced communities. We theoretically prove that link pruning effectively detects enhanced communities using the stochastic block models. In addition, we empirically show that clustering with link pruning achieves better performance than clustering with a traditional graph sparsification.
Extensive experiments were conducted using both synthetic and real-world networks. Before identifying the community structure, we confirmed that link attributes differ depending on whether the links in the graph are connected between nodes within the same community or different communities. Finally, we verified that a sparse graph with an enhanced community structure was obtained when the link pruning rate was increased based on attribute values through experiments. To evaluate the clustering accuracy, we used the Normalized Mutual Information (NMI) [4,5] for synthetic networks with the ground-truth community structure and the modularity [6,7] for real-world networks.
Overall, the contributions of this paper are summarized as follows.
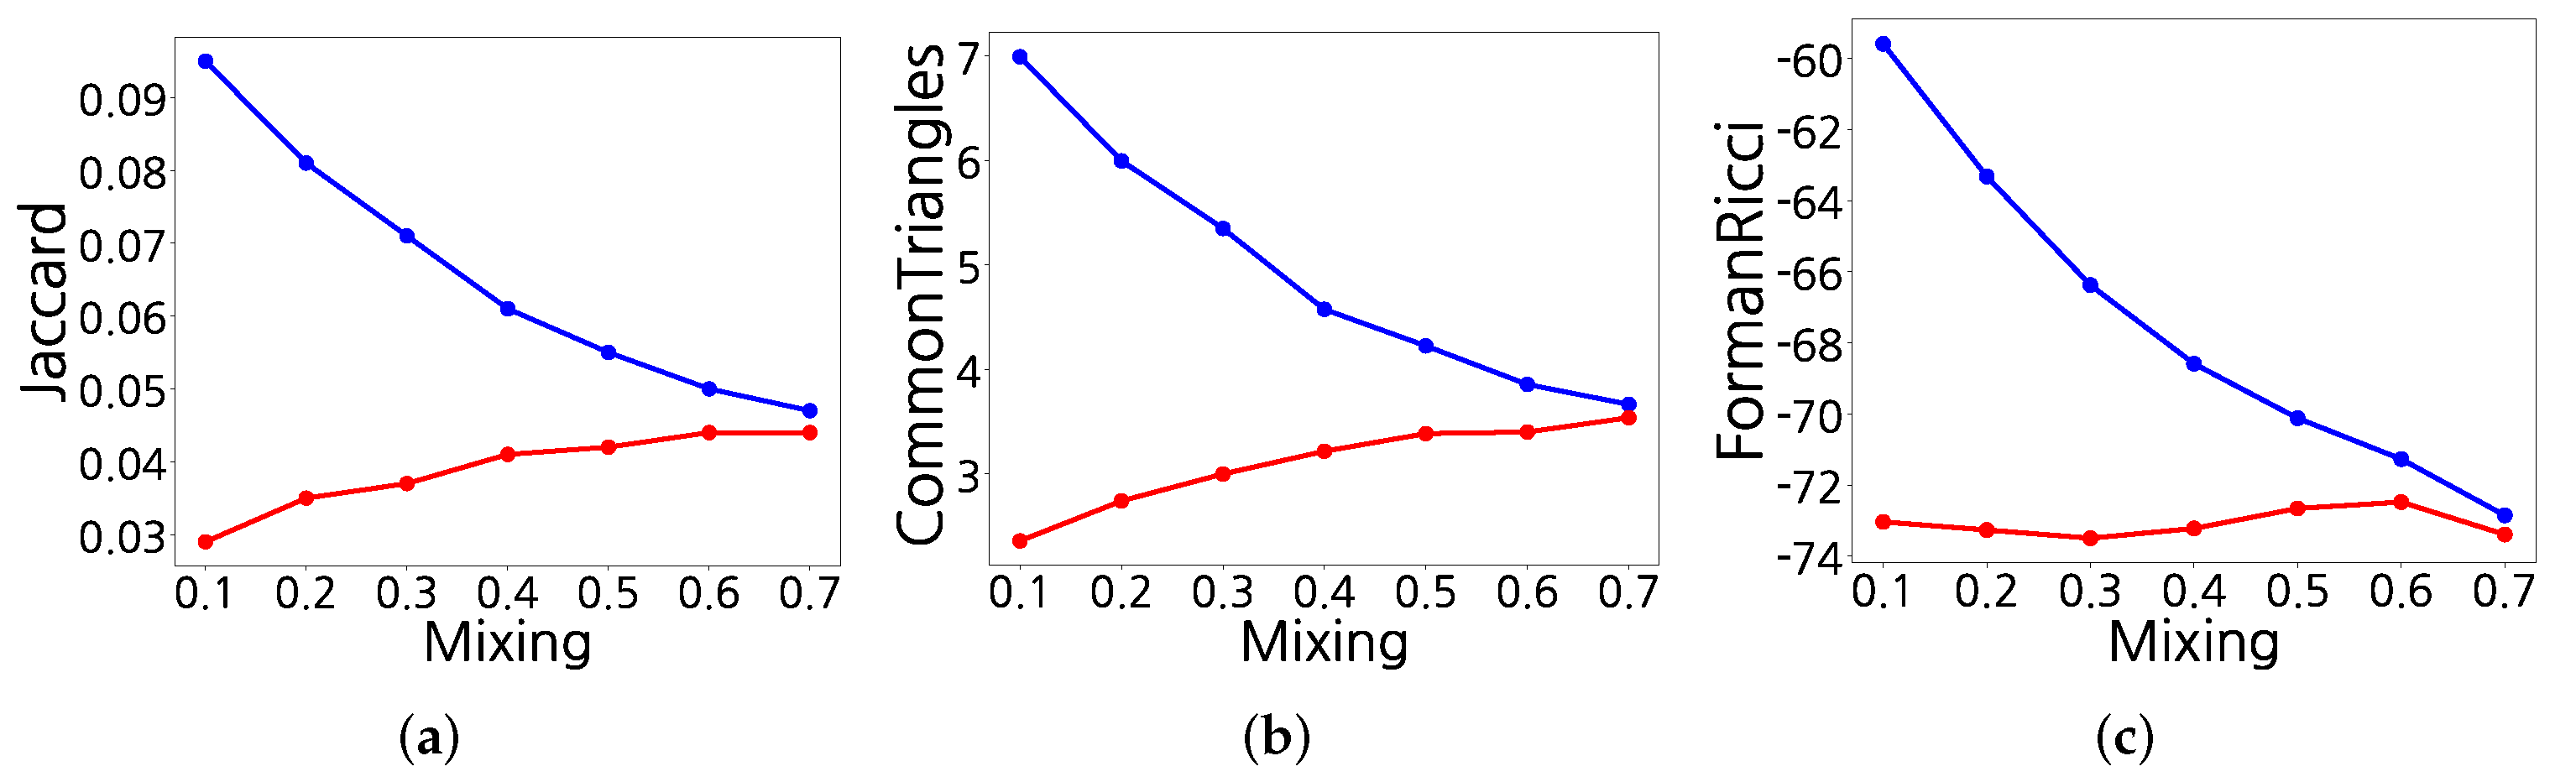
  • We notice a different pattern between the attributes of links within a cluster (i.e., internal links) and those of links belonging to different clusters (i.e., external links).
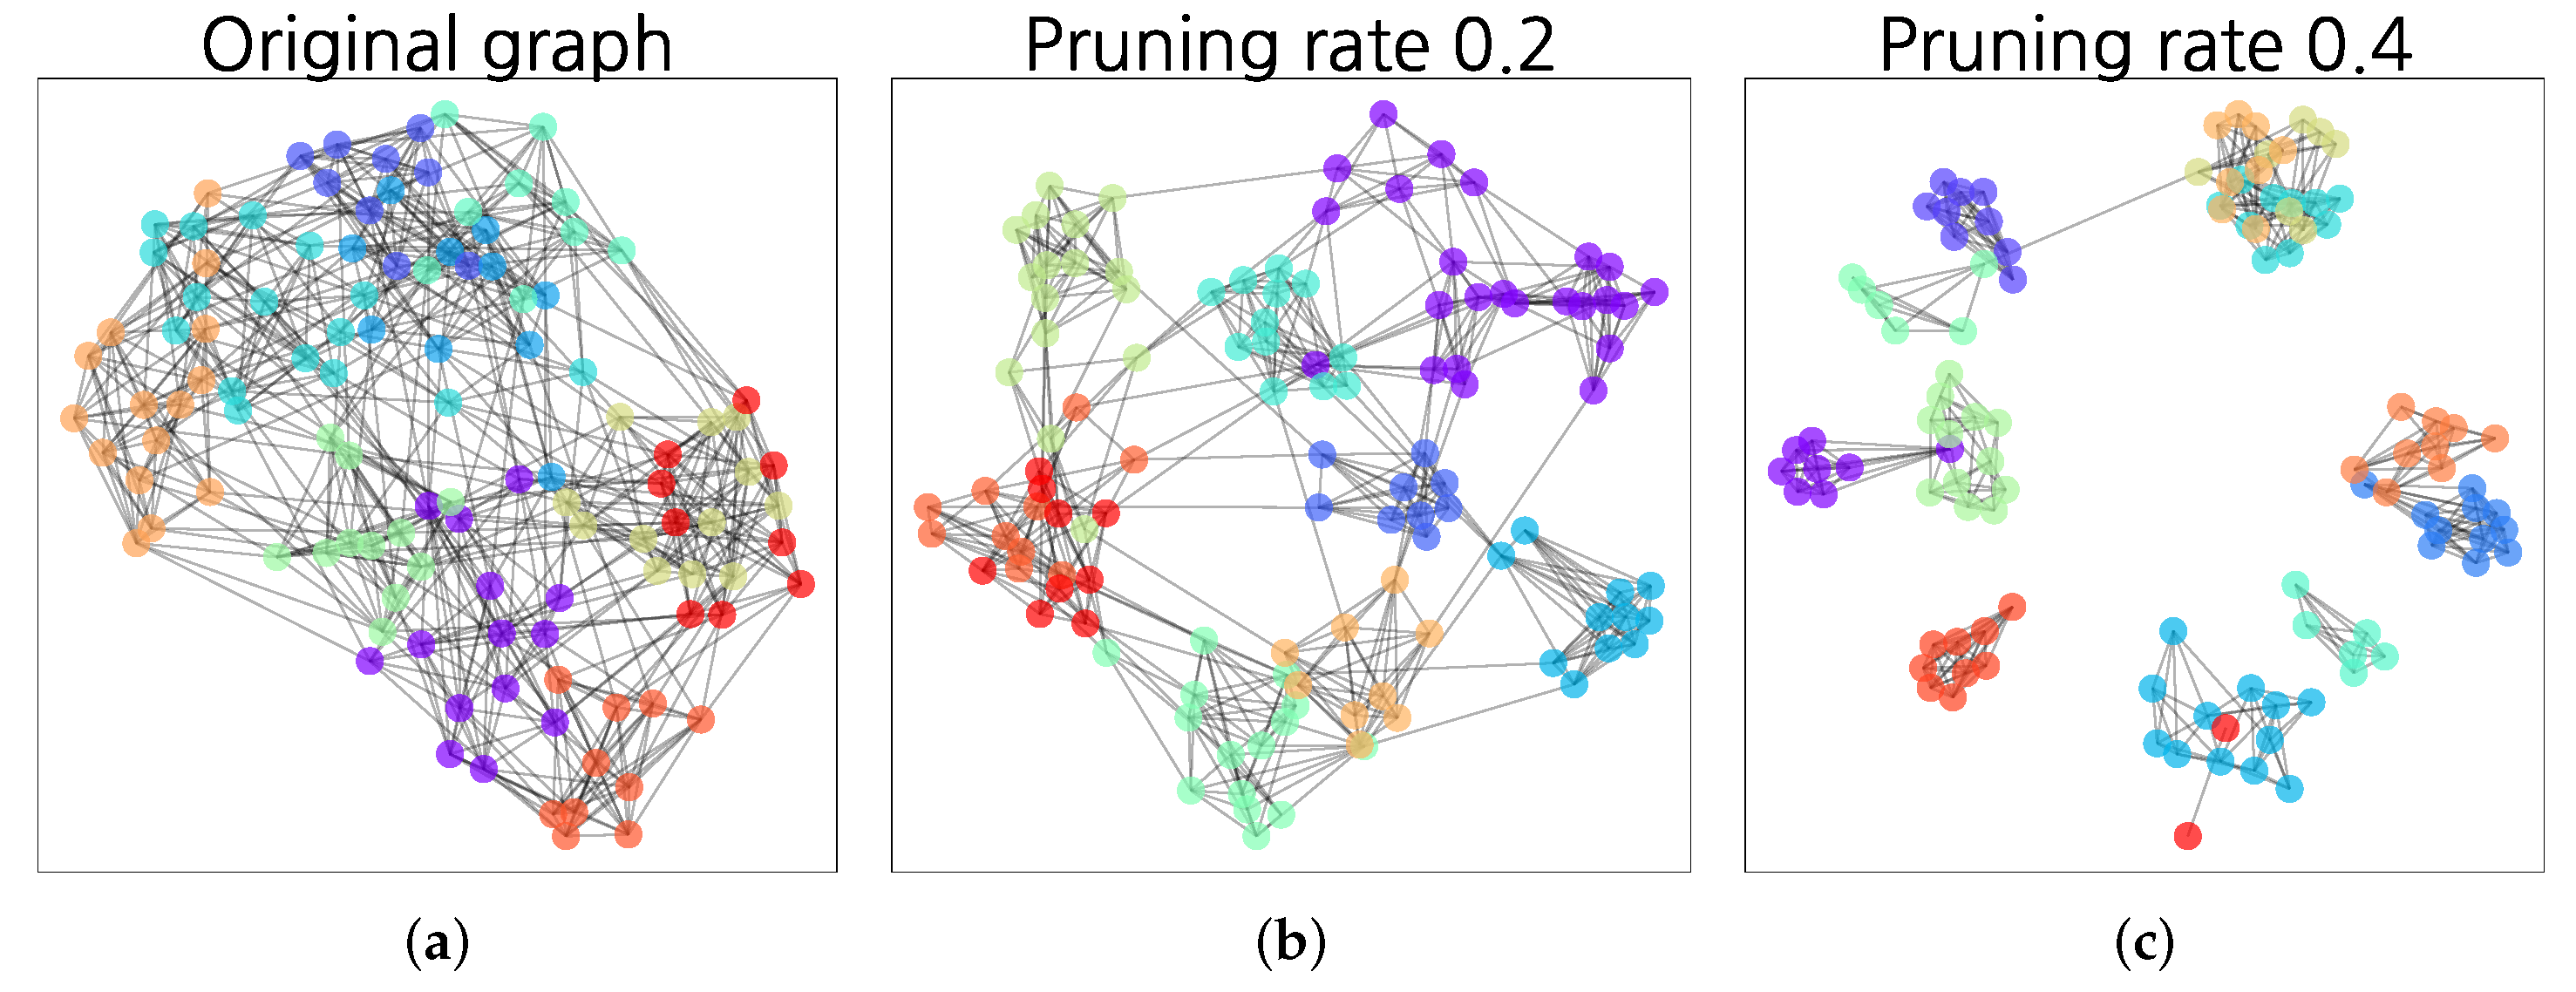
  • We develop a new community detection algorithm that removes less important links according to the different patterns of link attributes.
  • We theoretically prove that link pruning effectively detects enhanced communities using a random graph model with planted clusters.
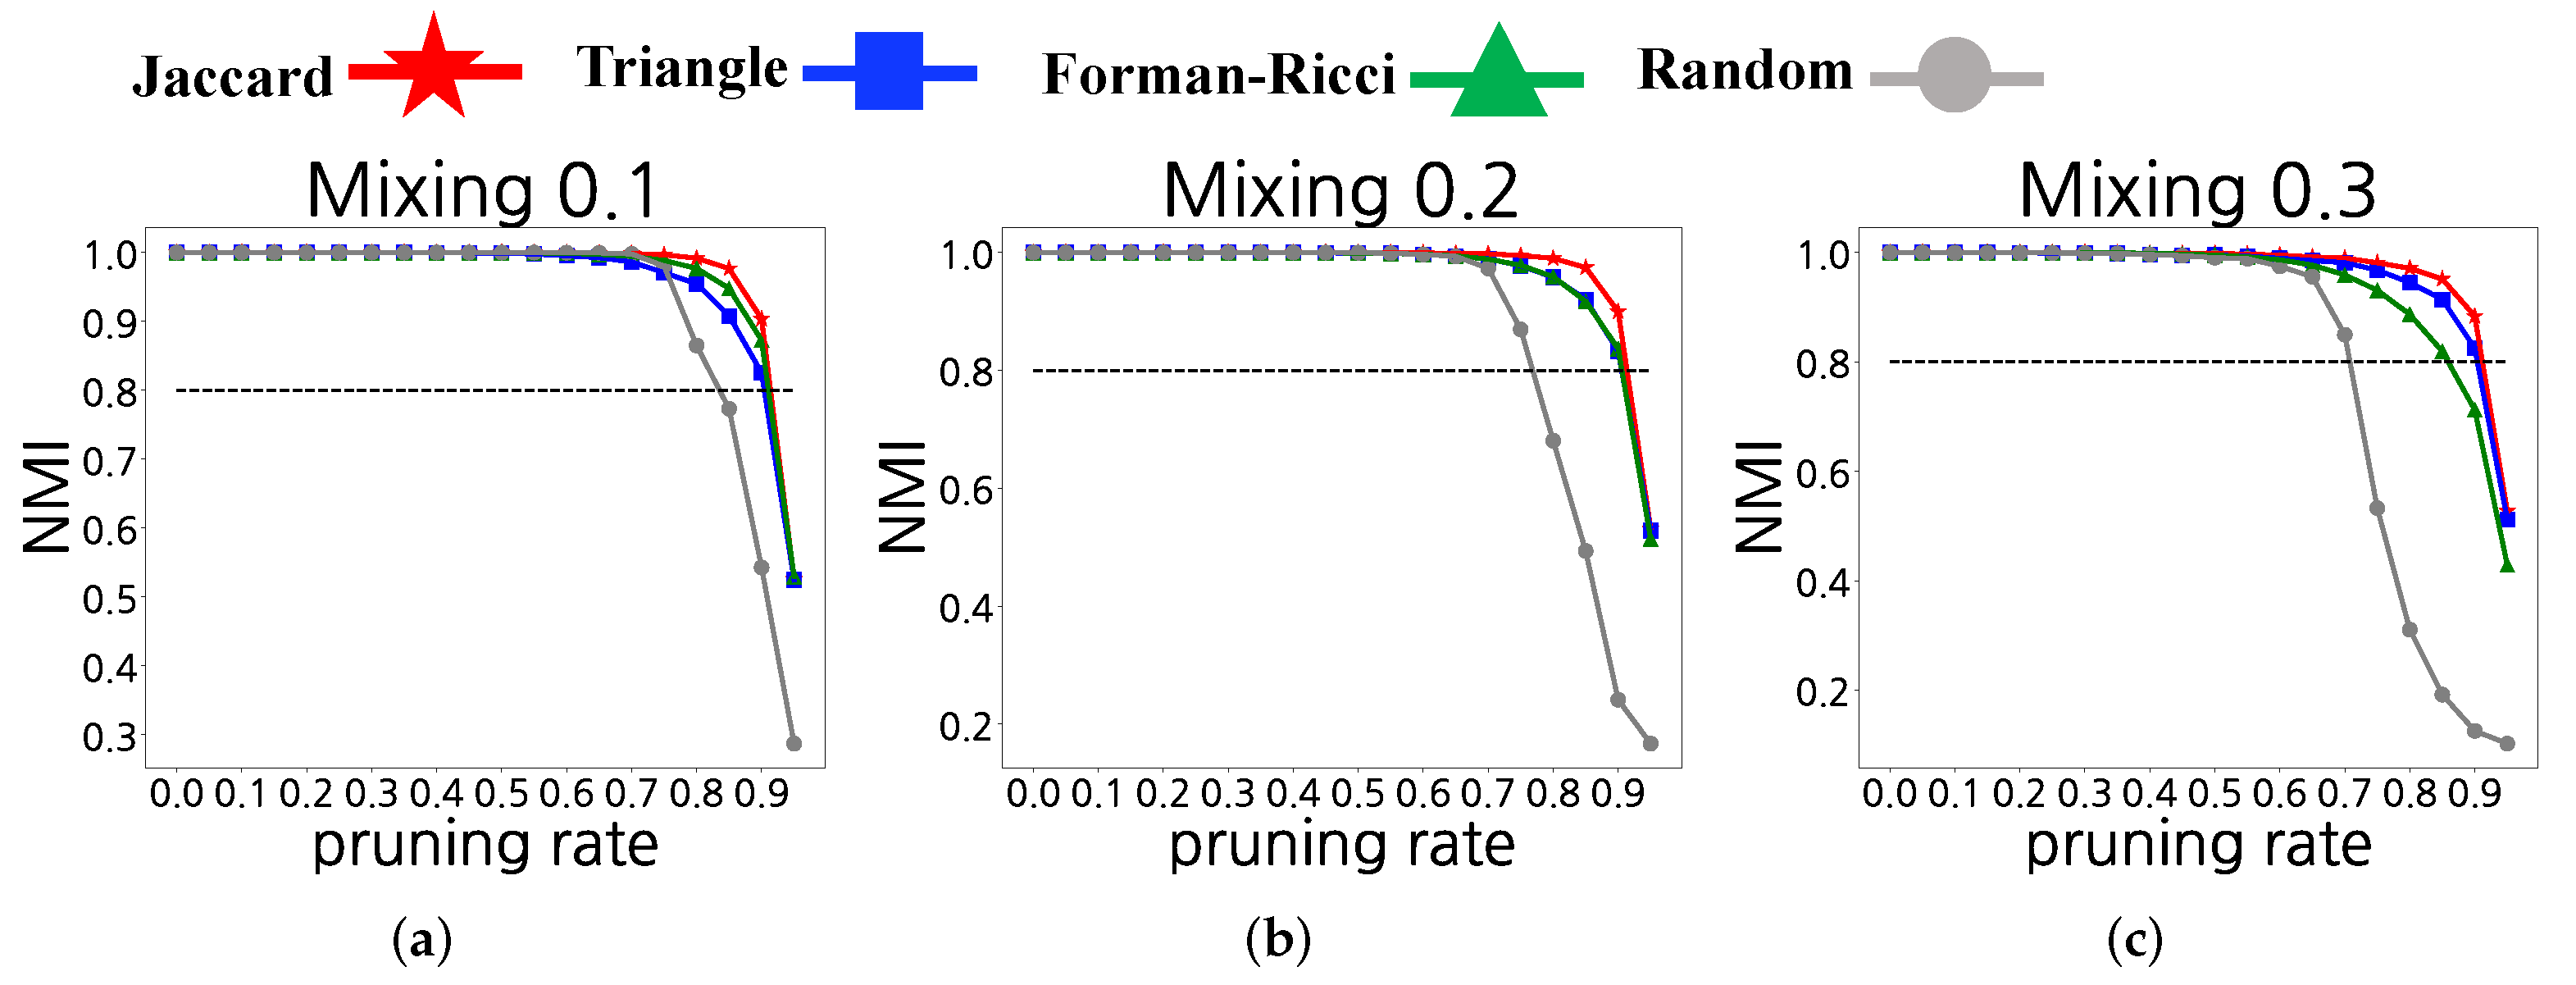
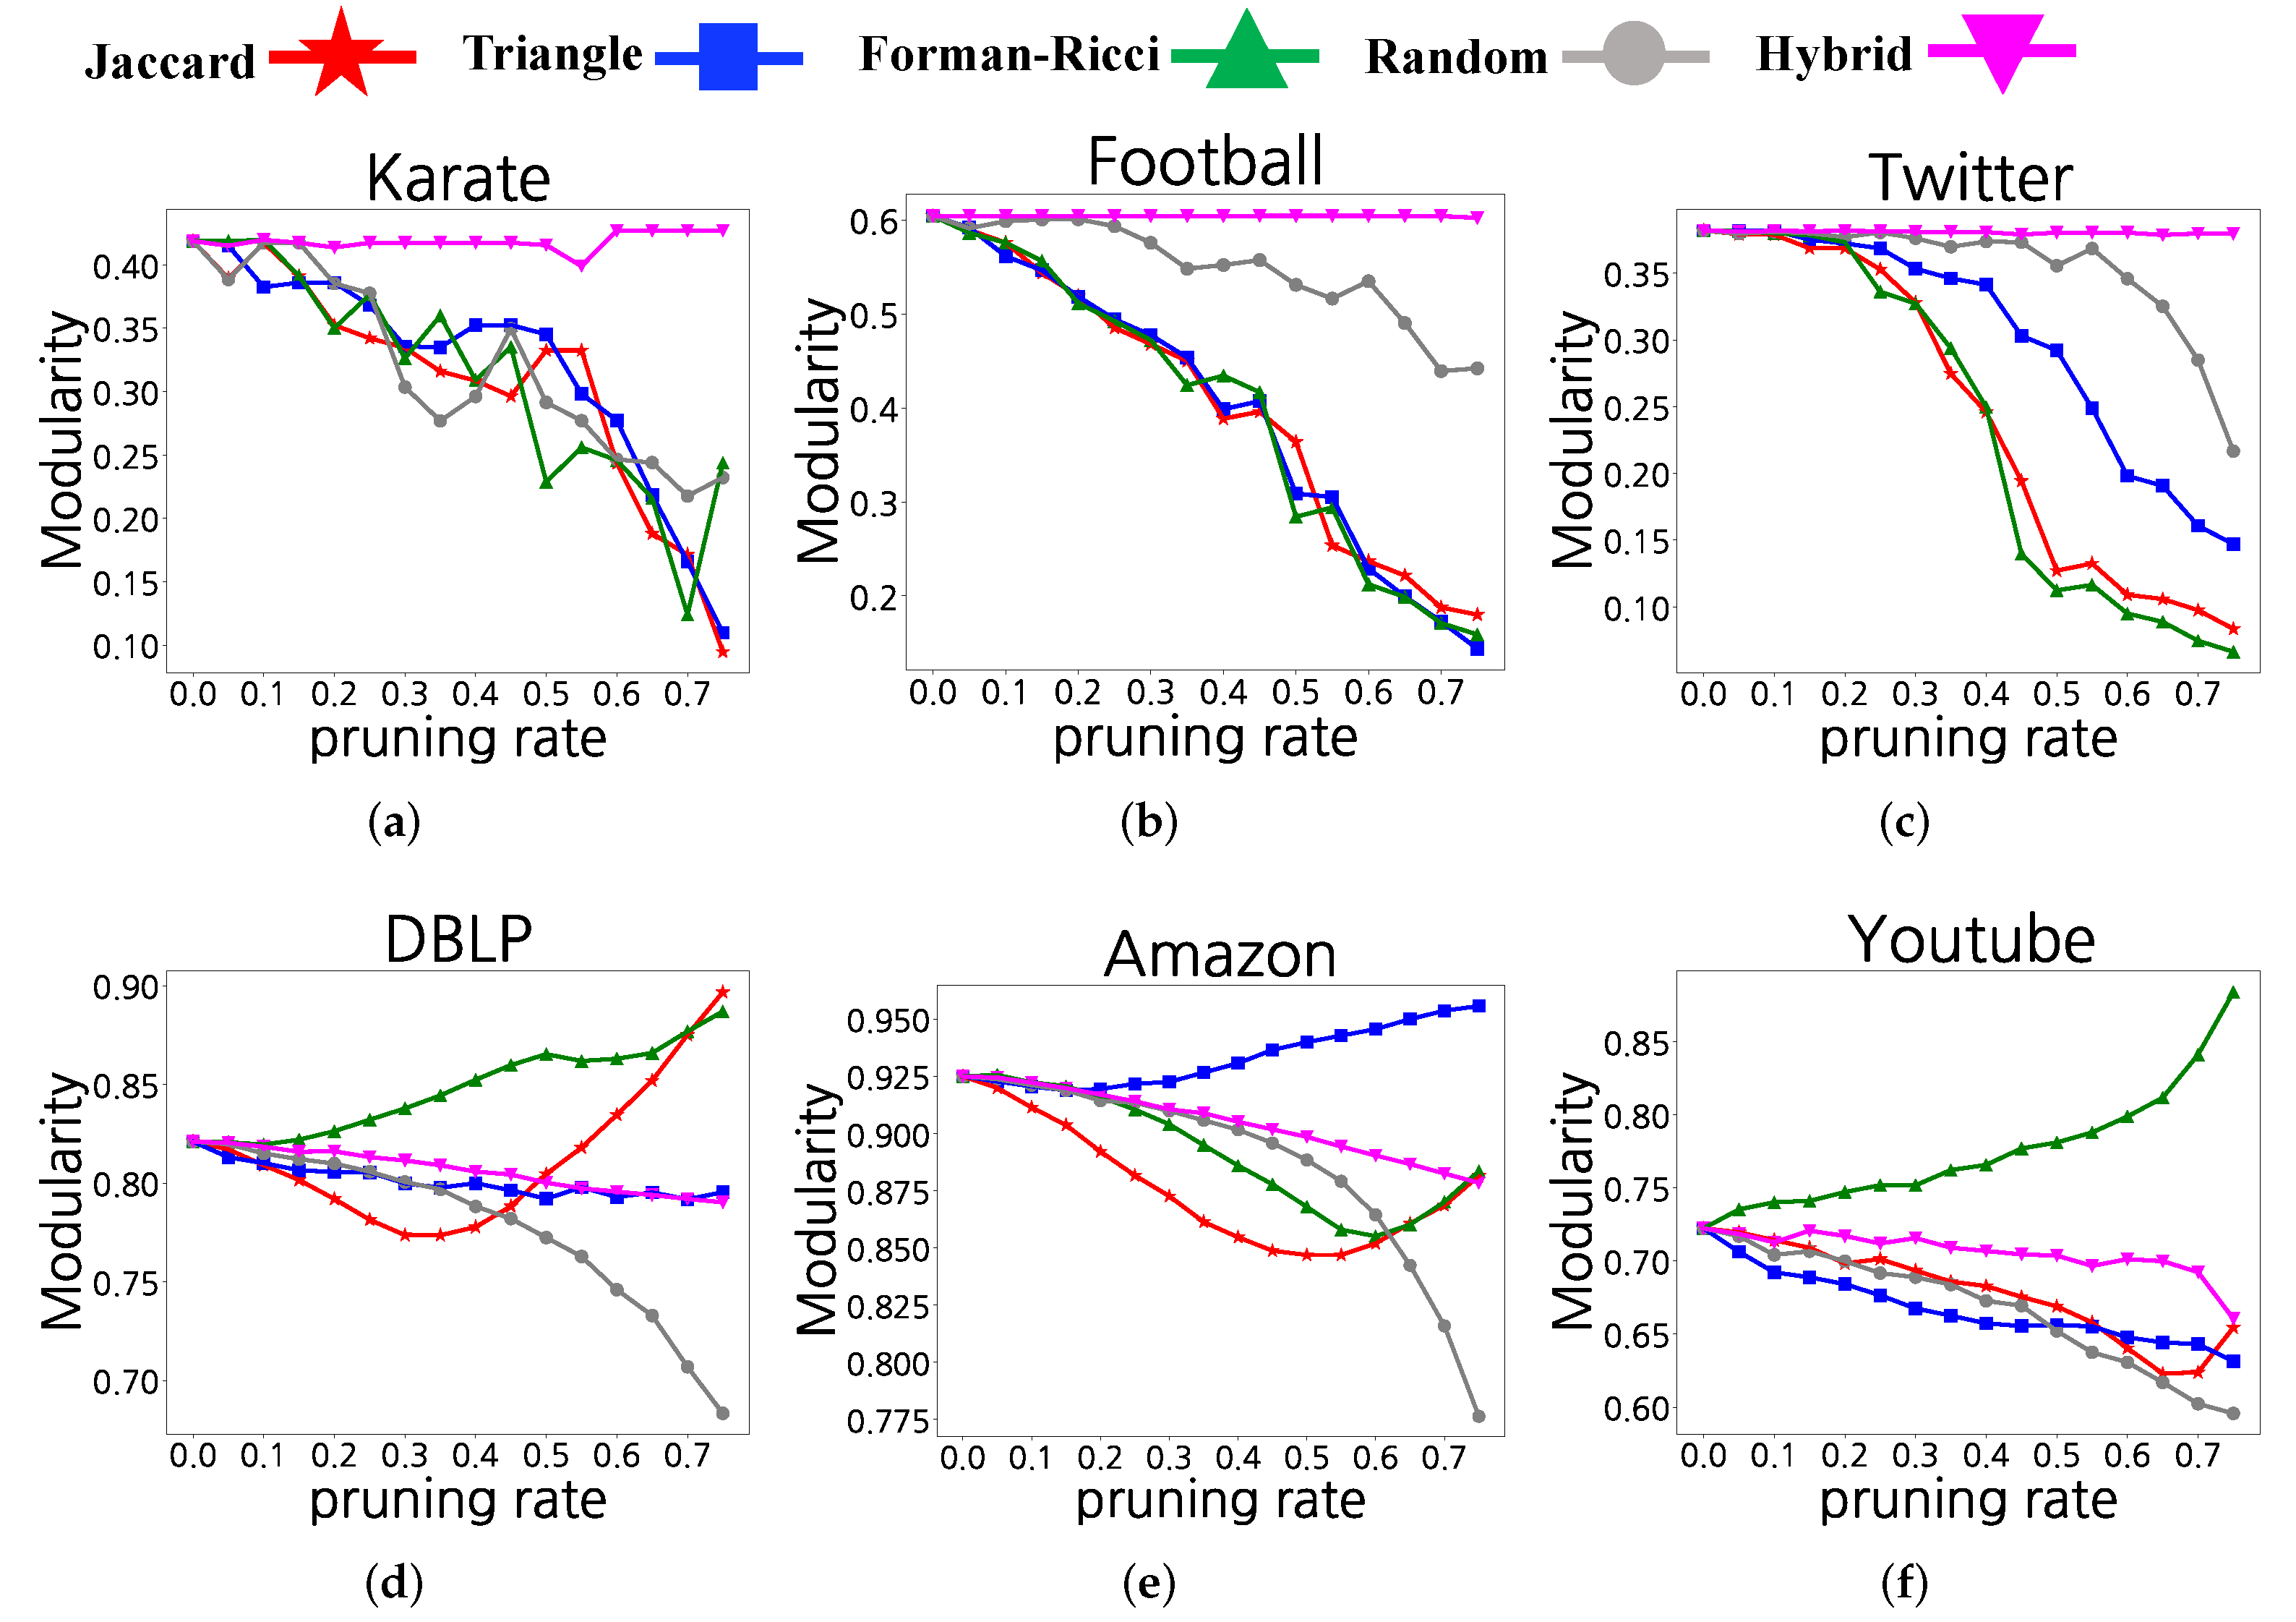
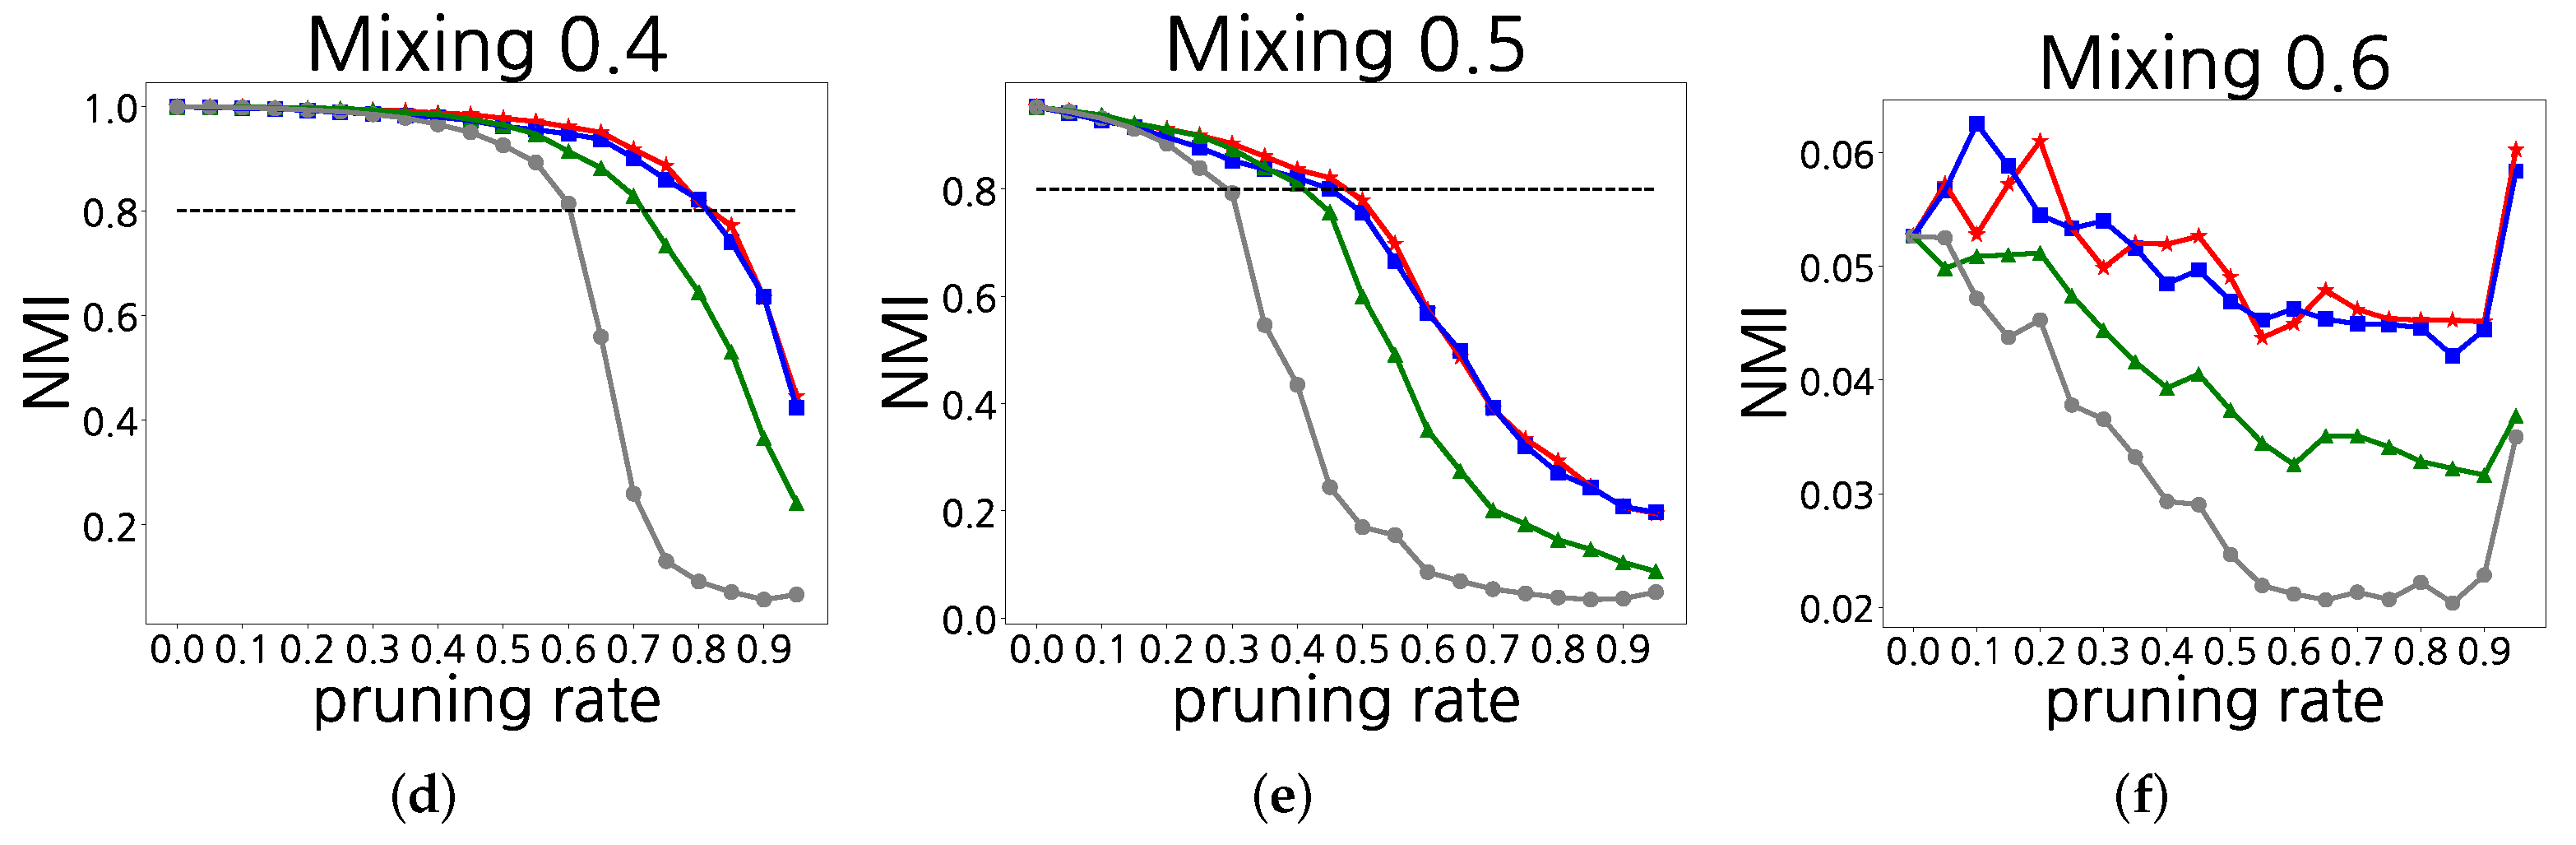
  • We empirically show that the proposed algorithm achieves higher accuracy than the existing algorithms, especially when the pruning rate increases.

2. Related Work

2.1. Link Attributes

Graph representation learning is a state-of-the-art technique that successfully adopts representation learning to graphs [8]. Among related techniques, graph neural networks, which train both the graph structure and node attributes, have been recently developed as the most effective technique for graph data analysis [9]. Because the nodes in a graph refer to elements of a network system, the attributes of each node can be defined easily. However, the link attributes are relatively difficult to define because they might include various meanings representing node relationships. The link attributes are defined based on the purpose of a target problem to be solved as an initial stage for constructing a graph, and the performance of the method can be increased via this process [10]. A representative method for calculating link attributes is to measure the similarity or distance between nodes belonging to a link [11]. This method evaluates the neighborhood level between nodes by calculating the similarity between a node and its neighbor node or utilizing a path in a graph or substructure. A recent study [12,13] reported that the curvature which is defined in a graph can be effectively used to analyze internal graph structures and detect communities. The proposed algorithm in this paper calculates the link attributes based on the similarity between nodes and the curvature of a graph to train and apply the relationship between the link attributes and community structure.

2.2. Community Detection

Community detection is to find subgraphs inside a graph, and in many cases, it aims to find a set of nodes or links inducing a subgraph with high density [3,14,15]. It is one of the most fundamental problems in graph data analysis, and various techniques have been developed to solve this problem [3]. We evaluated the strength of the community structure by evaluating modularity and NMI. Modularity and NMI are widely used to measure the quality of community detection. Modularity is a measure of the community structure of a graph, measuring the density of connections within a community. NMI provides an information–theoretic measure for comparing the predicted community structure and the ground-truth structure. It compares the different partitioning results and produces a value between zero (disagreement) and one (agreement). Therefore, high modularity values (when the ground truth is unknown) and high NMI values (when the ground truth is known) indicate high quality communities.

2.3. Graph Sparsification

Graph sparsification is a technique that reduces the size of a graph by maintaining the structural information of the graph primarily based on link pruning [16]. This technique can reduce the size of network data represented as a graph and increase the efficiency related to the use of computer resources and operation time. A recent python library for graph sampling called ‘Little Ball of Fur’ [17] provides representative link sampling methods, such as [18,19]. The two usual link sampling methods introduced in [18] are the Random Edge (RE) sampling method and the Random Node-Edge (RNE) sampling methods. The RE sampling method samples links independently and uniformly at random, and the RNE sampling method selects nodes and a link that belongs to the chosen node. The link sampling methods introduced in [19] select nodes and a link using an additional induction step. The induction step adds all links that exist between the sampled nodes, and this step is adequate to preserve the original graph structure. For graph clustering with link pruning, there have been several attempts to sparsify graphs [20,21,22]. Graph sparsification methods are used for designing a scalable clustering algorithm [20] and a distributed clustering algorithm [21]. In [22], LinkBlackHole* adopted a link sampling method for graph sparsification, where each node samples links with probability that is linear to the log of the degree. This method guarantees that the difference between a sampled graph and an original graph is bounded based on Chernoff bound [23]. Recent studies have developed methods that perform sparsification by maintaining the attributes of a graph, such as a clustering coefficient, connectivity, and the shortest path [16,24]. We conducted a process of link attribute calculation to remove less significant links. Through this process, rather than maintaining the structural information of the graph, we achieve the goal of performing graph sparsity to efficiently and accurately identify communities.

3. Our Proposed Framework

3.1. Calculation of Link Attributes

Given a graph G = ( V , E ) , a set of neighbors for a node u is N ( u ) = { v V | { u , v } E } . This section describes (i) Jaccard’s index, (ii) the number of common triangles, and (iii) the Forman–Ricci curvature, which are usual methods for calculating link attributes successively. Because these methods define attributes based on a neighboring relationship between two nodes forming a link, they can calculate link attributes when a neighboring relationship between each node is solely identified.

3.1.1. Jaccard’s Index

Jaccard’s index or the Jaccard similarity coefficient is used to calculate the similarity between two different sets [25]. This can be applied to a graph to calculate the similarity between two nodes in the graph. It ranges from zero to one, and a higher value represents a higher ratio of common neighbors. When a set of extended neighbors for node u is defined as Γ ( u ) = { u } N ( u ) , the Jaccard’s index is calculated as follows.   
Jaccard ( u , v ) = | Γ ( u ) Γ ( v ) | | Γ ( u ) Γ ( v ) |

3.1.2. Number of Common Triangles

The Common Neighbor (CN) index or the number of common neighbors between two nodes is a popular metric for link prediction in graphs [26]. The number of common triangles including two nodes is equivalent to the CN index when the two nodes are adjacent. To calculate the number of common triangles, the number of triangles to which both nodes u and v belong is counted for an attribute of { u , v } E . A triangle is a structure in which three nodes are interconnected in a graph, which is regarded as the basic structure for a community. It has an integer value of zero or higher, and its value increases as the number of common neighbors increases. The number of common triangles for two interconnected nodes u and v is calculated as follows.
CommonTriangles ( u , v ) = | N ( u ) N ( v ) | 2

3.1.3. Forman–Ricci Curvature

The Forman–Ricci curvature is a numerical degree of curvature based on a local connection condition that reflects geometric features [12], which is recently being performed as a complex system network analysis methodology. This value increases because the local connection density is high. When the local connection density is low, the value decreases to a negative value. In other words, this value increases for a link in a densely connected area. When N v ( u ) = N ( u ) { v } , the first Forman–Ricci curvature is calculated as follows.
Forman Ricci ( u , v ) = | N v ( u ) N u ( v ) | | N v ( u ) N u ( v ) | + 2

3.2. Algorithm for Clustering Using Link Pruning

3.2.1. Proposed Algorithm

Regarding the three types of link attributes introduced in Section 3.1, it is expected that attributes of links connected in a community will be higher than those connected between different communities. A similarity between nodes or curvature-based links defines these link attributes, and their values increase when the neighborhood substructures of the two nodes are similar. We design and analyze an efficient algorithm for community detection using the characteristic of link attributes.
Algorithm 1 shows the procedure of the proposed community detection algorithm based on link pruning. In Step 1, the proposed algorithm calculates the link attributes in a given graph G = ( V , E ) . In Step 2, it sorts link attributes according to their values. In Step 3, it prunes links with low link attributes values. The pruning rate is the fraction of connections in the graph that are pruned. The degree of sparsification of the resulting graph is determined by the pruning rate α . The pruning rate makes a trade-off between the memory efficiency and the accuracy throughout the algorithm. In Section 4, we verify the performance of the proposed algorithm in a wide range of pruning rates. This process is performed to successfully remove links, which are likely to have less importance to detect community. In Step 4, the community detection algorithm A is applied to the converted sparsified graph G * . The proposed algorithm exhibits better performance for identifying a community C when applied to the converted sparsified graph than applied to the origin graph G. Because the origin G and converted graph G * have the same set of nodes, the proposed algorithm is not required to convert a community for the set of nodes in G * to identify a community for the set of nodes in G.
Algorithm 1: Clustering with Link Pruning.
     input: (i) a graph G = ( V , E ) ;
                 (ii) a link attribute a t t r i b u t e ;
                 (iii) a pruning rate α ;
                 (iv) a clustering algorithm A;
     output: a set of clusters C of V;
1   /* Step 1: Calculate the link attributes */
2    for { u , v } E do
3   | Calculate a t t r i b u t e ( u , v )
4    /* Step 2: Sort the link attributes */
5    Sort ( a t t r i b u t e ( u , v ) ) { u , v } E
6    /* Step 3: Prune low-value links */
7    G * remove the smallest 100 α % links from G
8    /* Step 4: Detect communities in the transformed graph */
9    C apply A to G *
10    return C;

3.2.2. Theoretical Analysis

The stochastic block models (SBMs) are graph generation models that reflect community structure [27,28]. This model creates a block that comprises N nodes based on the numbers of N / K nodes and K blocks (communities). Subsequently, it generates a link of nodes in the same block based on the probability of p i n and that of nodes in different blocks based on the probability of p o u t . Mixing is utilized to evaluate the degree of strength of the community structure. The mixing process is defined by a rate of nodes connected in the same community among the entire links. A simple linear system can adjust the values of p i n and p o u t to enable the generated graph to contain the average number k of connections and mixing μ . The result of the theoretical analysis is presented as follows. When p i n = M P o u t , the average value of | N ( u ) N ( v ) | is K N p o u t 2 ( M 2 + K 1 ) for links connected in the same community and K N p o u t 2 ( 2 M + K 2 ) for links connecting different communities. Therefore, the former value is higher by approximately M 2 times the latter value. Because mixing is low, M increases. Basically, a difference in the number of common triangles will increase as the strength of the community structure increases. The same conclusion can be deduced for other link attributes in the same way.

4. Experiments

In this section, we examine the performance of our proposed link pruning method. We extensively tested our algorithm on both synthetic and real-world networks. We evaluated the performance of the proposed algorithm for efficient community detection algorithm with link pruning. Specifically, we compared the result of performing community detection via link pruning based on the application of the proposed algorithm with that of performing community detection based on random link sampling. In addition, we evaluated the hybrid method using the three link attributes simultaneously. We performed our experiments using python 3.7, networkx and igraph on Intel(R) Core(TM) i9-10900 CPU @ 2.80 GHz and RAM of 128 G.

4.1. Datasets

4.1.1. Synthetic Networks

To demonstrate the effect of our proposed algorithm, we investigated the results on synthetic networks generated by the stochastic block models. We analyzed the networks that have 1000 nodes with the average degree fixed to 20, the number of communities are 4, and varying mixing parameters from 0.1 to 0.7 .

4.1.2. Real-World Networks

We conducted extensive experiments on real-world networks. Table 1 lists the real-world networks used in our experiments. These network datasets include (a) Karate: club network, (b) Football: football league network at universities in the United States, (c) Twitter: social network of politicians from Ireland, (d) DBLP: co-authorship network, (e) Amazon: product purchase network, and (f) YouTube: online platform network. Since the clustering coefficients of the graphs are 0.571, 0.403, 0.475, 0.632, 0.397 and 0.081, respectively, we consider that their community structures are significant. We downloaded these networks from the KONECT [29] project (KONECT: The Koblenz Network Collection. http://konect.cc/networks/, accessed on 1 May 2022).

4.2. Link Attribute Distribution

4.2.1. Synthetic Networks

In Figure 1, the graph generated by the stochastic block models presents a change in the link attributes according to mixing. We calculated the link attributes of each network and analyzed the distribution of these attributes. The average intra-community (i.e., inward-going) link attributes and the average inter-community (i.e., outward-going) link attributes are present as blue and red lines, respectively. The experimental results were consistent with the results of theoretical analysis, such that low mixing increases the difference in link attributes. The results were also consistent with the results [30] that both values were similar to each other under the high mixing condition and that the form of generated graphs followed that of random graphs without a structure when mixing was generated as 1 1 K = 0.75 in the stochastic block model.

4.2.2. Real-World Networks

As in Section 4.2.1, we calculated the link attributes of each network and analyzed the distribution of these attributes in real-world networks. In Table 2, links connecting nodes in the same community are classified as intra-community, while the links connecting nodes in different communities are classified as inter-community. Intra-community and inter-community are marked in blue and red, respectively, in a histogram. Accordingly, the values of the mean and standard deviation are indicated in Table 2. As shown in Table 2, the mean value of the intra-community was higher than that of the inter-community in 14 out of the entire 18 cases. Regarding the Football and Twitter networks, the values of intra-community were higher than those of inter-community in the entire case. For the Amazon network, the mean number of nodes that belonged to the corresponding community was only 4.46 , despite low mixing. Consequently, the values of the intra-community were unlikely to be distinguished from those of the inter-community.
We conducted case studies on the Football network with three link attributes. We compared the patterns of intra-community links with inter-community links. Figure 2 presents the distribution of link attributes in the Football network. As shown in the histograms of the three link attributes, the distribution of intra-community links was separated from that of inter-community links. Figure 3 presents the results of graph sparsification of the Football network according to the pruning rate from 0 to 0.4 using Jaccard’s index. Here, the graph with pruning rate 0 represents the original graph. As shown in Figure 3, we confirm enhanced community structure with link pruning.

4.3. Community Detection

We evaluated the enhancement of community detection performance by adjusting the link pruning rate α of Algorithm 1 in each network. In our experiments, the Louvain method [31] was chosen as Algorithm A, and any other clustering algorithm can be used. Then, we discuss efficiency according to community detection algorithms. Based on the experimental results, we analyzed change modularity and according to the pruning of links with low values of link attribute.

4.4. Synthetic Networks

To evaluate the quality of graph clustering of synthetic networks, we used the Normalized Mutual Information (NMI) [4,5]. The NMI has been most widely used to measure the quality of clusters when the ground truth is known. We calculated the NMI by adjusting α of Algorithm 1 based on the three-link attribute calculation methods introduced in Section 3.1, in the link pruning process. It also calculated the NMI by randomly adjusting α in the link pruning process. Figure 4 presents the results of NMI, which compare the clusters obtained by the proposed algorithm with the ground-truth clusters. The experimental results indicated that the NMI values were higher when link pruning was performed based on the link attribute calculation methods indicated above than when link pruning was randomly performed. The NMI values tended to decrease as α increased in most cases. As shown in Figure 4, we confirm that the NMI values with random removing drop rapidly under 0.8 of NMI in mixing 0.1 to 0.5 . Stochastic block models with mixing 0.6 induce a weak community structure, and the NMI values are small. However, as shown in Figure 4, our proposed algorithm performs well for a wide range of mixing.

4.5. Real-World Networks

To evaluate the performance of graph clustering of real-world networks, we used the modularity [6,7]. The modularity calculates the normalized quantity of the difference between the intra-community links and the inter-community links. We measured the modularity values by adjusting the value of α of Algorithm 1 based on Jaccard’s index (denoted by ), the number of common triangles (denoted by ) and the Forman–Ricci curvature (denoted by ), which are the three link attribute calculation methods introduced in Section 3.1, in the link pruning process. It also calculated the modularity by randomly adjusting α (denoted by ) in the link pruning process. Figure 5 presents the results obtained from comparing the modularity values obtained by the methods discussed earlier. The experimental results indicated that the modularity values were higher when link pruning was performed based on the link attribute calculation methods indicated above than when link pruning was randomly performed. Regarding the Karate network that exhibited sparse internal connections than other network datasets, an increase in α led to a decrease in the modularity values in some cases.

4.6. Hybrid Method

We present a hybrid approach of the proposed algorithm that utilizes the three link attributes for link pruning. The detailed steps for the hybrid method are as follows. In Step 1, we calculate the three link attributes for every link. In Step 2, we calculate the Z-score of each link attribute for normalizing the values for fair comparisons. In Step 3, we sum the Z-scores of the link three attributes for each link. In Step 4, we sort the sum of the Z-scores. In Step 5, we prune links with the smallest 100 α % link attributes. Figure 5 presents the results of modularity values of communities obtained by removing links randomly (denoted by ) with removing links by the hybrid method (denoted by ). The figure shows that clustering with random link pruning is sometimes better than that with link pruning using a single link attribute. The hybrid method is not the best sometimes, but it is consistently better than random link pruning. In this context, the hybrid method is useful in some applications.

4.7. Verification of Efficiency

We applied various algorithms to the community detection algorithm A to verify the efficiency of the proposed algorithm. The computational complexity of the proposed algorithm depends on the numbers of nodes V and the number of links | E | in a given graph G = ( V , E ) . An approximation algorithm can be performed to reduce the computational complexity in calculating link attributes in a large-scale graph. For example, it is known that locality sensitive hashing (LSH) can be applied to Jaccard’s index to approximately calculate link attributes or link weights in a graph [32]. The computational complexity is linear to the number of hash functions under this condition, and approximate calculations can be performed to reduce the calculation time.
The results obtained from analyzing the efficiency of the proposed algorithm according to the five popular community detection algorithms are presented as follows. Community detection algorithms used for the comparison include the Louvain method, the label propagation algorithm (LPA) [33], Infomap [34], Fastgreedy [6] and Walktrap [35]. We note that the computational complexities are O ( | V | log | V | ) , O ( | E | ) , O ( | E | ) , O ( | V | log 2 | V | ) and O ( | V | 2 log | V | ) based on the Louvain method, LPA. Infomap, Fastgreedy and Walktrap, respectively [36].
In addition, we measured the amount of time required for the operation of Algorithm 1 by increasing α from 0 to 0.3 , and pruning links when the Amazon network was used and Jaccard’s index was performed as link attributes. Table 3 presents the results obtained from measuring the total operation time of Algorithm 1. Table 4 illustrates the modularity values in the same set of experiments. The LPA frequently combined the entire graphs as a single community due to its unstable performance in identifying communities based on randomness when label information was not provided prior to the algorithm. Infomap and Walktrap required a longer operation time than other algorithms and showed low modularity values. Regarding the Louvain method and Fastgreedy, the Louvain method required a shorter operation time and performed high modularity. As a result, in our algorithm, it was verified that the Louvain method showed the best performance with the highest efficiency.
The experimental results based on a change in the link pruning rate are presented as follows. As presented in Table 3, Infomap and Fastgreedy implied a rapidly increasing operation time where the link pruning rate changed from 0.2 to 0.3 . Except for these cases, community detection algorithms tended to require a shorter operation time as the pruning rate increased. In addition, as shown in Table 4, the entire community detection algorithms show low modularity values as the pruning rate increases. We use another community detection evaluation which is conductance. Well-separated communities lower the conductance. As shown in Table 5, the entire community detection algorithms always show low conductance values regardless of the pruning rate. Based on this result, it was verified that our proposed algorithm performed excellent performance, regardless of the choice of the community detection algorithm A.

5. Conclusions

In this paper, we have proposed an efficient community detection algorithm based on link pruning. We also analyzed the three types of link attributes, which varied depending on internal or external links, and theoretically proved that the proposed algorithm is effective using the stochastic block models. We have conducted extensive experiments using various synthetic and real-world social networks. Our proposed algorithm shows that the pruning of more links with low values of link attributes increased graph sparsification and the strength of the community structure. Overall, we believe that our work is a step toward developing an efficient community detection algorithm for social network analysis.

Author Contributions

Conceptualization, J.K., S.J. and S.L.; methodology, J.K., S.J. and S.L.; software, J.K. and S.J.; validation, J.K., S.J. and S.L.; formal analysis, J.K., S.J. and S.L.; investigation, J.K., S.J. and S.L.; resources, J.K. and S.J.; data curation, J.K. and S.J.; writing—original draft preparation, J.K., S.J. and S.L.; writing—review and editing, S.L.; visualization, J.K., S.J. and S.L.; supervision, S.L.; project administration, S.L.; funding acquisition, S.L. All authors have read and agreed to the published version of the manuscript.

Funding

This work was supported by the National Research Foundation of Korea Grant funded by the Korean Government(MOE).

Institutional Review Board Statement

Not applicable.

Informed Consent Statement

Not applicable.

Data Availability Statement

No datasets were generated during the current study.

Conflicts of Interest

The authors declare no conflict of interest.

References

  1. Kazienko, P.; Chawla, N. Applications of Social Media and Social Network Analysis; Springer: Berlin/Heidelberg, Germany, 2015. [Google Scholar]
  2. Zhang, Z.; Cui, P.; Zhu, W. Deep Learning on Graphs: A Survey. IEEE Trans. Knowl. Data Eng. 2022, 34, 249–270. [Google Scholar] [CrossRef] [Green Version]
  3. Fortunato, S. Community Detection in Graphs. Phys. Rep. 2010, 486, 75–174. [Google Scholar] [CrossRef] [Green Version]
  4. Strehl, A.; Ghosh, J. Cluster Ensembles—A Knowledge Reuse Framework for Combining Multiple Partitions. J. Mach. Learn. Res. 2002, 3, 583–617. [Google Scholar]
  5. Danon, L.; Diaz-Guilera, A.; Duch, J.; Arenas, A. Comparing Community Structure Identification. J. Stat. Mech. Theory Exp. 2005, 2005, P09008. [Google Scholar] [CrossRef]
  6. Newman, M.E.J. Fast Algorithm for Detecting Community Structure in Networks. Phys. Rev. E 2004, 69, 066133. [Google Scholar] [CrossRef] [PubMed] [Green Version]
  7. Newman, M.E.J. Modularity and Community Structure in Networks. Proc. Natl. Acad. Sci. USA 2006, 103, 8577–8582. [Google Scholar] [CrossRef] [Green Version]
  8. Cai, H.; Zheng, V.W.; Chang, K.C.C. A Comprehensive Survey of Graph Embedding: Problems, Techniques, and Applications. IEEE Trans. Knowl. Data Eng. 2018, 30, 1616–1637. [Google Scholar] [CrossRef] [Green Version]
  9. Kipf, T.N.; Welling, M. Semi-Supervised Classification with Graph Convolutional Networks. In Proceedings of the International Conference on Learning Representations (ICLR), Toulon, France, 24–26 April 2017. [Google Scholar]
  10. Lim, S.; Lee, J.G. Motif-based Embedding for Graph Clustering. J. Stat. Mech. Theory Exp. 2016, 2016, P123401. [Google Scholar] [CrossRef]
  11. Liben-Nowell, D.; Kleinberg, J. The Link-Prediction Problem for Social Networks. J. Am. Soc. Inf. Sci. Technol. 2007, 58, 1019–1031. [Google Scholar] [CrossRef] [Green Version]
  12. Sreejith, R.P.; Mohanraj, K.; Jost, J.; Saucan, E.; Samal, A. Forman Curvature for Complex Networks. J. Stat. Mech. Theory Exp. 2016, 2016, P063206. [Google Scholar] [CrossRef] [Green Version]
  13. Sia, J.; Jonckheere, E.; Bogdan, P. Ollivier-Ricci Curvature-Based Method to Community Detection in Complex Networks. Sci. Rep. 2019, 9, 9800. [Google Scholar] [CrossRef] [PubMed]
  14. Lancichinetti, A.; Fortunato, S. Community Detection Algorithms: A Comparative Analysis. Phys. Rev. E 2009, 80, 056117. [Google Scholar] [CrossRef] [PubMed] [Green Version]
  15. Fortunato, S.; Hric, D. Community Detection in Networks: A User Guide. Phys. Rep. 2016, 659, 1–44. [Google Scholar] [CrossRef] [Green Version]
  16. Yousuf, M.I.; Kim, S. Guided Sampling for Large Graphs. Data Min. Knowl. Discov. 2020, 34, 905–948. [Google Scholar] [CrossRef]
  17. Rozemberczki, B.; Kiss, O.; Sarkar, R. Little Ball of Fur: A Python Library for Graph Sampling. In Proceedings of the ACM International Conference on Information and Knowledge Management (CIKM), Virtual Event, 19–23 October 2020. [Google Scholar]
  18. Krishnamurthy, V.; Faloutsos, M.; Chrobak, M.; Lao, L.; Cui, J.H.; Percus, A.G. Reducing Large Internet Topologies for Faster Simulations. In Proceedings of the International IFIP-TC6 Networking Conference (Networking), Waterloo, ON, Canada, 2–6 May 2005. [Google Scholar]
  19. Ahmed, N.K.; Neville, J.; Kompella, R. Network Sampling: From Static to Streaming Graphs. ACM Trans. Knowl. Discov. Data 2014, 8, 7. [Google Scholar] [CrossRef]
  20. Satuluri, V.; Parthasarathy, S.; Ruan, Y. Local Graph Sparsification for Scalable Clustering. In Proceedings of the ACM International Conference on Management of Data (SIGMOD), Athens, Greece, 12–16 June 2011. [Google Scholar]
  21. Sun, H.; Zanetti, L. Distributed Graph Clustering and Sparsification. ACM Trans. Parallel Comput. 2019, 6, 17. [Google Scholar] [CrossRef] [Green Version]
  22. Kim, J.; Lim, S.; Lee, J.G.; Lee, B.S. LinkBlackHole*: Robust Overlapping Community Detection Using Link Embedding. IEEE Trans. Knowl. Data Eng. 2019, 31, 2138–2150. [Google Scholar] [CrossRef]
  23. Lim, S.; Ryu, S.; Kwon, S.; Jung, K.; Lee, J.G. LinkSCAN*: Overlapping Community Detection Using the Link-Space Transformation. In Proceedings of the IEEE International Conference on Data Engineering (ICDE), Chicago, IL, USA, 31 March–4 April 2014. [Google Scholar]
  24. Zhou, F.; Mahler, S.; Toivonen, H. Network Simplification with Minimal Loss of Connectivity. In Proceedings of the IEEE International Conference on Data Mining (ICDM), Sydney, Australia, 13–17 December 2010; pp. 659–668. [Google Scholar]
  25. Salton, G.; McGill, M.J. Introduction to Modern Information Retrieval; McGrawHill: New York, NY, USA, 1983. [Google Scholar]
  26. Newman, M.E.J. Clustering and Preferential Attachment in Growing Networks. Phys. Rev. E 2001, 64, 025102(R). [Google Scholar] [CrossRef] [Green Version]
  27. Abbe, E. Community Detection and Stochastic Block Models: Recent Developments. J. Mach. Learn. Res. 2018, 18, 1–86. [Google Scholar]
  28. Karrer, B.; Newman, M.E. Stochastic Blockmodels and Community Structure in Networks. Phys. Rev. E 2011, 83, 016107. [Google Scholar] [CrossRef] [Green Version]
  29. Kunegis, J. KONECT: The Koblenz Network Collection. In Proceedings of the International World Wide Web Conference (WWW), Rio de Janeiro, Brazil, 13–17 May 2013; pp. 1343–1350. [Google Scholar]
  30. Spielman, D.A.; Teng, S.H. Nearly-Linear Time Algorithms for Graph Partitioning. In Proceedings of the Annual ACM Symposium on Theory of Computing (STOC), Chicago, IL, USA, 13–15 June 2004; pp. 81–90. [Google Scholar]
  31. Blondel, V.D.; Guillaume, J.L.; Lambiotte, R.; Lefebvre, E. Fast Unfolding of Communities in Large Networks. J. Stat. Mech. Theory Exp. 2008, 2008, P10008. [Google Scholar] [CrossRef] [Green Version]
  32. Chamberlain, B.P.; Levy-Kramerand, J.; Humby, C.; Deisenrothe, M.P. Real-Time Community Detection in Full Social Networks on a Laptop. PLoS ONE 2018, 13, e0188702. [Google Scholar] [CrossRef] [Green Version]
  33. Raghavan, U.N.; Albert, R.; Kumara, S. Near Linear Time Algorithm to Detect Community Structures in Large-Scale Networks. Phys. Rev. E 2007, 76, 036106. [Google Scholar] [CrossRef] [Green Version]
  34. Rosvall, M.; Bergstrom, C.T. Maps of Random Walks on Complex Networks Reveal Community Structure. Proc. Natl. Acad. Sci. USA 2008, 105, 1118–1123. [Google Scholar] [CrossRef] [Green Version]
  35. Pons, P.; Latapy, M. Computing Communities in Large Networks Using Random Walks. J. Graph Algorithms Appl. 2006, 10, 191–218. [Google Scholar] [CrossRef] [Green Version]
  36. Yang, Z.; Algesheimer, R.; Tessone, C.J. A Comparative Analysis of Community Detection Algorithms on Artificial Networks. Sci. Rep. 2016, 6, 30750. [Google Scholar] [CrossRef] [Green Version]
Figure 1. Distribution of link attributes in synthetic networks: (a) Jaccard; (b) CommonTriangles; and (c) Forman−−Ricci.
Applsci 12 06811 g001
Figure 2. Distribution of link attributes in Football: (a) Jaccard; (b) CommonTriangles; and (c) Forman−−Ricci.
Applsci 12 06811 g002
Figure 3. Graph sparsification after link pruning with Jaccard’s index: (a) pruning rate 0 (original graph); (b) pruning rate 0.2 ; and (c) pruning rate 0.4 .
Applsci 12 06811 g003
Figure 4. NMI values when varying α : (a) mixing 0.1; (b) mixing 0.2; (c) mixing 0.3; (d) mixing 0.4; (e) mixing 0.5; and (f) mixing 0.6.
Applsci 12 06811 g004aApplsci 12 06811 g004b
Figure 5. Modularity values when varying α : (a) karate; (b) football; (c) twitter; (d) DBLP; (e) Amazon; and (f) YouTube.
Applsci 12 06811 g005
Table 1. Real-world network datasets.
Dataset# of Nodes# of LinksClustering Coefficient
Karate34780.571
Football1156130.403
Twitter34848310.475
DBLP317,0801,049,8660.632
Amazon334,863925,8720.397
YouTube1,134,8902,987,6240.081
Table 2. Distribution of link attributes in real-world networks.
DatasetLink Type Jaccard CommonTriangles Forman Ricci
Karateintra 0.34 ± 0.13 3.90 ± 1.63 5.63 ± 5.25
inter 0.46 ± 0.15 2.73 ± 1.05 10.7 ± 5.64
Footballintra 0.47 ± 0.11 7.52 ± 1.28 1.06 ± 3.56
inter 0.17 ± 0.11 3.16 ± 1.60 13.7 ± 5.11
Twitterintra 0.26 ± 0.11 21.1 ± 13.0 39.4 ± 28.8
inter 0.16 ± 0.07 16.5 ± 10.3 67.3 ± 25.2
DBLPintra 0.36 ± 0.31 6.95 ± 13.53 21.96 ± 40.0
inter 0.43 ± 0.30 0.36 ± 0.31 0.36 ± 0.31
Amazonintra 0.31 ± 0.20 2.22 ± 2.30 12.49 ± 25.70
inter 0.29 ± 0.20 1.66 ± 1.81 12.32 ± 25.22
YouTubeintra 0.06 ± 0.09 9.49 ± 21.07 472.96 ± 691.84
inter 0.09 ± 0.15 2.78 ± 12.14 998.67 ± 3324.71
Table 3. Running times of clustering algorithms with various link pruning rates.
Pruning Rate ( α )LouvainLPAInfomapFastgreedyWalktrap
04.9428.311681.35308.871495.25
0.14.5922.491332.08137.121398.27
0.24.4214.81903.4732.161392.60
0.34.32 12.1910504.0263.471199.82
Table 4. Modularity values of clustering algorithms with various link pruning rates.
Pruning Rate ( α )LouvainLPAInfomapFastgreedyWalktrap
00.9260.7860.8250.8670.849
0.10.9110.7600.8030.8890.811
0.20.8920.7410.7820.8860.793
0.30.8730.7250.7670.8680.783
Table 5. Conductance values of clustering algorithms with various link pruning rates.
Pruning Rate ( α )LouvainLPAInfomapFastgreedyWalktrap
00.00120.00330.00290.00150.0028
0.10.00110.00330.00290.00110.0029
0.20.00120.00330.00310.00120.0031
0.30.00280.00330.00310.00280.0028
Publisher’s Note: MDPI stays neutral with regard to jurisdictional claims in published maps and institutional affiliations.

