Article

Image Human Thorax Using Ultrasound Traveltime Tomography with Supervised Descent Method

Beijing National Research Center for Information Science and Technology (BNRist), Institute for Precision Medicine, Department of Electronic Engineering, Tsinghua University, Beijing 100084, China
*
Author to whom correspondence should be addressed.
Appl. Sci. 2022, 12(13), 6763; https://doi.org/10.3390/app12136763
Submission received: 30 April 2022 / Revised: 24 June 2022 / Accepted: 29 June 2022 / Published: 4 July 2022
(This article belongs to the Special Issue Ultrasonic Modelling for Non-destructive Testing)

Abstract

:
The change of acoustic velocity in the human thorax reflects the functional status of the respiratory system. Imaging the thorax’s acoustic velocity distribution can be used to monitor the respiratory system. In this paper, the feasibility of imaging the human thorax using ultrasound traveltime tomography with a supervised descent method (SDM) is studied. The forward modeling is computed using the shortest path ray tracing (SPR) method. The training model is composed of homogeneous acoustic velocity background and a high-velocity rectangular block moving in the domain of interest (DoI). The average descent direction is learned from the training set. Numerical experiments are conducted to verify the method’s feasibility. Normal thorax model experiment proves that SDM traveltime tomography can efficiently reconstruct thorax acoustic velocity distribution. Numerical experiments based on synthetic thorax model of pleural effusion and pneumothorax show that SDM traveltime tomography has good generalization ability and can detect the change of acoustic velocity in human thorax. This method might be helpful for the diagnosis and evaluation of respiratory diseases.

1. Introduction

Ultrasound imaging is widely used in industrial and biomedical imaging. Industrial imaging is important in nondestructive evaluation (NDE) [1]. It can be used to evaluate the health of material [2,3,4,5]. The information of liquid flow can also be obtained by ultrasound imaging [6,7,8]. In the medical field, ultrasound imaging is widely used for its low-cost, portability, radiationless, and real-time compared with other imaging methods, such as computed tomography (CT) and magnetic resonance imaging (MRI). Ultrasound is applied to imaging heart [9,10,11], liver [12,13], brain [14,15,16] and many other human parts [17]. In most cases, ultrasound imaging is realized by transmitting ultrasound at megahertz into the human body and analyzing the reflected signal. However, this workflow is hard to implement in thorax imaging, because complex reflection and refraction occur at the lung-pleura interface and among the millions of alveoli inside the lungs, resulting in both chaotic and low-energy reflected signal [18]. In addition, the high frequency will cause severe attenuation, resulting in the reflected signal’s low signal-to-noise ratio (SNR). Current thorax imaging methods include X-ray [19], CT [20], MRI [21], and electrical impedance tomography (EIT) [22]. Microwave thorax imaging is still in the research stage [23]. These methods all have limitations. The radiation from CT and X-rays is harmful to human health. The equipment of MRI is not portable and its imaging quality is not that good because of the air in the lung. The resolution of EIT and microwave imaging is relatively low.
Though the reflected signal can hardly be used for thorax imaging, it contains information about the thorax state. B-lines are suggested to originate as ring-down artifacts from irregularities at the lung–pleura interface, which contains information inside the thorax and correlates with a variety of respiratory diseases [24]. However, the results obtained from B-lines remain qualitative, subjective, and suboptimal [25]. In addition, information in the frequency domain can be used to diagnose pulmonary fibrosis quantitatively [25]. Ultrasound can also be used to monitor the states of the respiratory system, see [26,27,28]. In addition to reflected signal, transmission signal can be applied to thorax examination. Transmission signal is the signal that propagates through the human thorax. Acoustic wave can permeate human thorax as long as the frequency is low enough. According to Rueter et al. [29], the propagation of acoustic wave in human thorax shows three distinct bands according to frequency. Sound of frequency around 1 kHz can propagate in human thorax at velocity of 30–50 m/s. At this band, the thorax model is established and verified by simulations and experiments, see [30,31]. The feasibility of diagnosing pulmonary diseases using sound at this band is also researched, see [32,33]. Sound of frequency between 1 and 10 kHz is hard to permeate thorax. Ultrasound with frequency between 10 kHz and 750 kHz can permeate human thorax at velocity of about 1500 m/s. An ultrasound at this band permits monitoring of the human respiratory system. The transmission ultrasound signal can be analyzed directly for diagnosing lung diseases, see [34,35]. In addition, the transmission ultrasound signal can be used to conduct traveltime tomography. This method is successfully implemented on breast imaging, see [36,37]. So far, to the best knowledge of the authors, traveltime tomography for thorax has not been well studied.
Ultrasound traveltime tomography reconstructs the acoustic velocity distribution from the measured time of the signal traveling from transmitter to receiver. This method is widely used in geophysics. It is robust at low SNR situations [38,39] and can mitigate the challenge aroused by the complexity of ultrasound propagation in complicated media [40,41]. The acoustic velocity is sensitive to the contents of gas, liquid, and their distribution, because their acoustic velocity differs a lot. Thus, it is possible to measure the amount of gas and fluid in the thorax by reconstructing the acoustic velocity distribution, which is crucial in the diagnosis of many diseases [42,43].
Machine learning techniques develop quickly in recent years and it has been widely used in inverse problems. One of the reasons for its popularity is that, through the training process, lots of work can be completed offline, which makes the online predicting process simple and efficient. Supervised descent method is one of these techniques, which is firstly used in face alignment [44]. The average descent direction of the cost function is learned from the training process and used to update the model in the online predicting process. The time-consuming matrix inversion in traditional gradient-based method is no longer needed. Previous studies show that SDM performs well in imaging, such as 2D magnetotelluric imaging [45], microwave thorax imaging [46], EIT thorax imaging [47], and corrosion imaging [48].
In this paper, we study the feasibility of imaging human thorax using ultrasound traveltime tomography with SDM. Numerical experiments based on normal thorax model and synthetic patient thorax model are conducted. The remaining of the paper is organized as follows. In Section 2, the overview of the forward modeling is described. In Section 3, details of traveltime tomography with SDM are discussed. In Section 4, our method is compared with the traditional gradient-based inversion method and its ability to detect the change of acoustic velocity distribution is tested.

2. Forward Modeling for Computing Traveltime

Forward modeling computes traveltime between the transducer T and the receiver R with the given acoustic velocity distribution. The traveltime can be computed as
t = T R 1 v ( x ) d l
where v is the velocity, x is the position, and d l is the differential length [49]. This non-linear function can be solved by the shortest path ray tracing (SPR) method based on Fermat’s principle. Fermat’s principle says that the ultrasonic wave travels along the path that takes the shortest time. SPR converts computing traveltime into finding single-source shortest path in a graph, which can be solved by the Dijkstra algorithm. According to [50], SPR divides the DoI into rectangular elements. Acoustic velocity is defined on the element, which means the velocity in an element is a constant. Nodes are defined on the boundary of elements. Two nodes are connected only when they belong to the same element and are not located on the same element boundary. Figure 1 is an example. The area is divided into 2 × 2 = 4 elements, see the dashed squares. Three nodes lie on one edge of the elements. The solid lines are the connections between nodes.
The weight of the connection between two nodes is defined as the quotient of their distance and the velocity of the element they belong to. With nodes, connections and weight of connections, an undirected graph is established. Assume t and r is the closest nodes to T and R. Naturally, the shortest path between T and R is the path with the lowest weight between t and r, and the traveltime is the path’s weight. The forward modeling can be formulated as:
d = F m
where d is the traveltime data, m is the model including distributions of acoustic velocity and positions of the transducers. With the acoustic velocity distribution, the graph can be constructed. Then, the transducers are assigned to the nodes that are closest to them and the traveltime between them can be calculated by F · , which is the operator of forward modeling. F · calculates traveltime for each transmitter–receiver pair using Dijkstra algorithm.

3. Traveltime Tomography with SDM

3.1. Formulations of Inverse Problem with SDM

Solving the inverse problem is an optimization process to find the best m that minimizes the loss function. The loss function of this problem is defined as
L m = d obs F m 2
where d obs is the real traveltime data. The Gauss–Newton method can be used to solve this optimization problem [51]. The update of the model can be calculated as
Δ m = J T J 1 J T ( d obs F m ) = K d obs F m = K Δ d
where J is the Jacobian matrix of F m and K = J T J 1 J T is a mapping from Δ d to Δ m . The element of Jacobian matrix J i k tells us the change in the ith data point (traveltime) due to a unit change in the kth model parameter (acoustic velocity). In this problem, J i k is non-zero only when the ith path goes through the kth element, and it has an analytical form as
J i k = s i k v k 2
where s i k is the length of the ith path within the kth element. v k 2 is the acoustic velocity of the kth element. The update direction K contains the local information of F near m . The calculation of K is the key step in Gauss–Newton method, which is also the most time-consuming step, because the calculation of J and matrix inversion take a lot of time. SDM introduces an alternative approach to compute K in a shorter time.
In SDM, K is calculated offline in advance. From Equation (4), the optimization of Equation (3) can be converted to minimize the following function:
S = Δ m K Δ d obs 2
The size of Δ m and m is n e l e × 1 , where n e l e is the number of elements in the grid, which is also the number of unknowns to be solved. The size of d obs is n d × 1 , where n d is the number of traveltime data we use. The size of K is n e l e × n d .
We assume that the real model m is in the space expanded by N reference models m prior i i = 1 , 2 , , N . The corresponding traveltime is d prior i . Then, an average update direction K ˜ is calculated by minimizing
S T r K ˜ = i = 1 N Δ m prior i K ˜ Δ d prior i 2
where
Δ m prior i = m prior i m 0
Δ d prior i = d prior i d 0
and m 0 is an initial guess of the real model m and d 0 = F m 0 . The process of computing K ˜ offline is called training.

3.2. Offline Training Process

In the training process, the initial model m 0 is chosen as homogeneous background. The training set M prior contains N training models. Equation (7) can be written in matrix form as
S T r K ˜ = Δ M Δ D K ˜ T 2
where
M prior = m prior 1 T m prior 2 T m prior N T , M 0 = m 0 T m 0 T m 0 T , Δ M = M prior M 0
and
D prior = d prior 1 T d prior 2 T d prior N T , D 0 = d 0 T d 0 T d 0 T , Δ D = D prior D 0
Here, the size of Δ M is N × n e l e and the size of Δ D is N × n d . K ˜ is a n e l e × n d matrix.
Because forward modeling of traveltime tomography is non-linear, it takes several iterations to minimize S T r and learn K ˜ . The prediction also computes in a iterative way [52]. Thus, in the kth training iteration we have
S k T r K ˜ = Δ M k Δ D k K ˜ k T 2
where
Δ M k = M prior M k
Δ D k = D prior D k = D prior F ( M k )
To minimize Equation (13), pseudo-inverse can be applied as
K ˜ k T = Δ D k T Δ D k 1 ( Δ D k T Δ M k )
With the update direction K ˜ , the model in the k + 1 th iteration is
M k + 1 = M k + Δ D k K ˜ k T
In practice, the difference between D and D prior decreases rapidly. To stablize the training process, a regularization procedure is introduced [46]. Equation (16) becomes
K ˜ k T = Δ D k T Δ D k + α I 1 ( Δ D k T Δ M k )
where α is proportional to the largest singular value of Δ D k and I is the identity matrix.
Normalized model misfit is checked every iteration for validating training, which defined as
R m s M M k = Δ M k M prior

3.3. Online Predicting Process

The online predicting process is to minimize the following function after offline training:
S P r Δ m = Δ m K ˜ Δ d obs 2
With the model update direction K ˜ obtained from offline training process, we can directly minimize Equation (20) as follows:
m k + 1 = m k + K ˜ d obs F m k
However, traveltime tomography is a ill-posed problem. The result obtained from Equation (21) might have artifacts. Here, Tikhonov regularization is applied to mitigate the ill-posedness [53]. New objective function can be written as
S R P r ( m k + 1 ) = P m k + 1 + α v R v m k + 1 + α h R h m k + 1
where
P m k + 1 = m k + 1 m k K ˜ k d obs F m k 2
R v m k + 1 = d obs F m k d obs Ω v m k + 1 2 + δ k 2 d r
R h m k + 1 = d obs F m k d obs Ω h m k + 1 2 + δ k 2 d r
δ k 2 = d obs F m k 2 d obs 2 Δ ^
R v and R h are regularization terms along vertical and horizontal direction and they are proportional to the data misfit. Δ ^ is a positive real parameter related to the mesh size [54]. At the begining of the inversion, the data misfit is large and the regularization terms are strong, which prevents the appearing of extreme values and helps to converge to a better model. As the iteration goes on, the data misfit decreases and the model is closed to the local optimal model, regularization terms becomes weak and the model converges faster.
Equation (22) can be minimized directly as follow:
S R P r ( m k + 1 ) m k + 1 = 0
We have
m k + 1 = A k + 1 1 b k + 1
where
A k + 1 = I + d obs F m k d obs α v v T v + α h h T h
b k + 1 = m k + K ˜ k d obs F m k
Equation (28) is used to update the model every iteration during the inversion.

4. Numerical Experiments

In this section, details of the test domain and thorax model, settings of the training set and various numerical experiments will be discussed. In numerical experiments, our method is tested on a normal thorax model and synthetic thorax model of patients with respiratory diseases. It is also compared with the traditional gradient-based method on normal thorax model. All the numerical experiments are carried out with MATLAB R2020a on the same computer with Intel i5-6500 CPU, 32GB RAM.

4.1. Description of the Test Domain and Forward Modeling

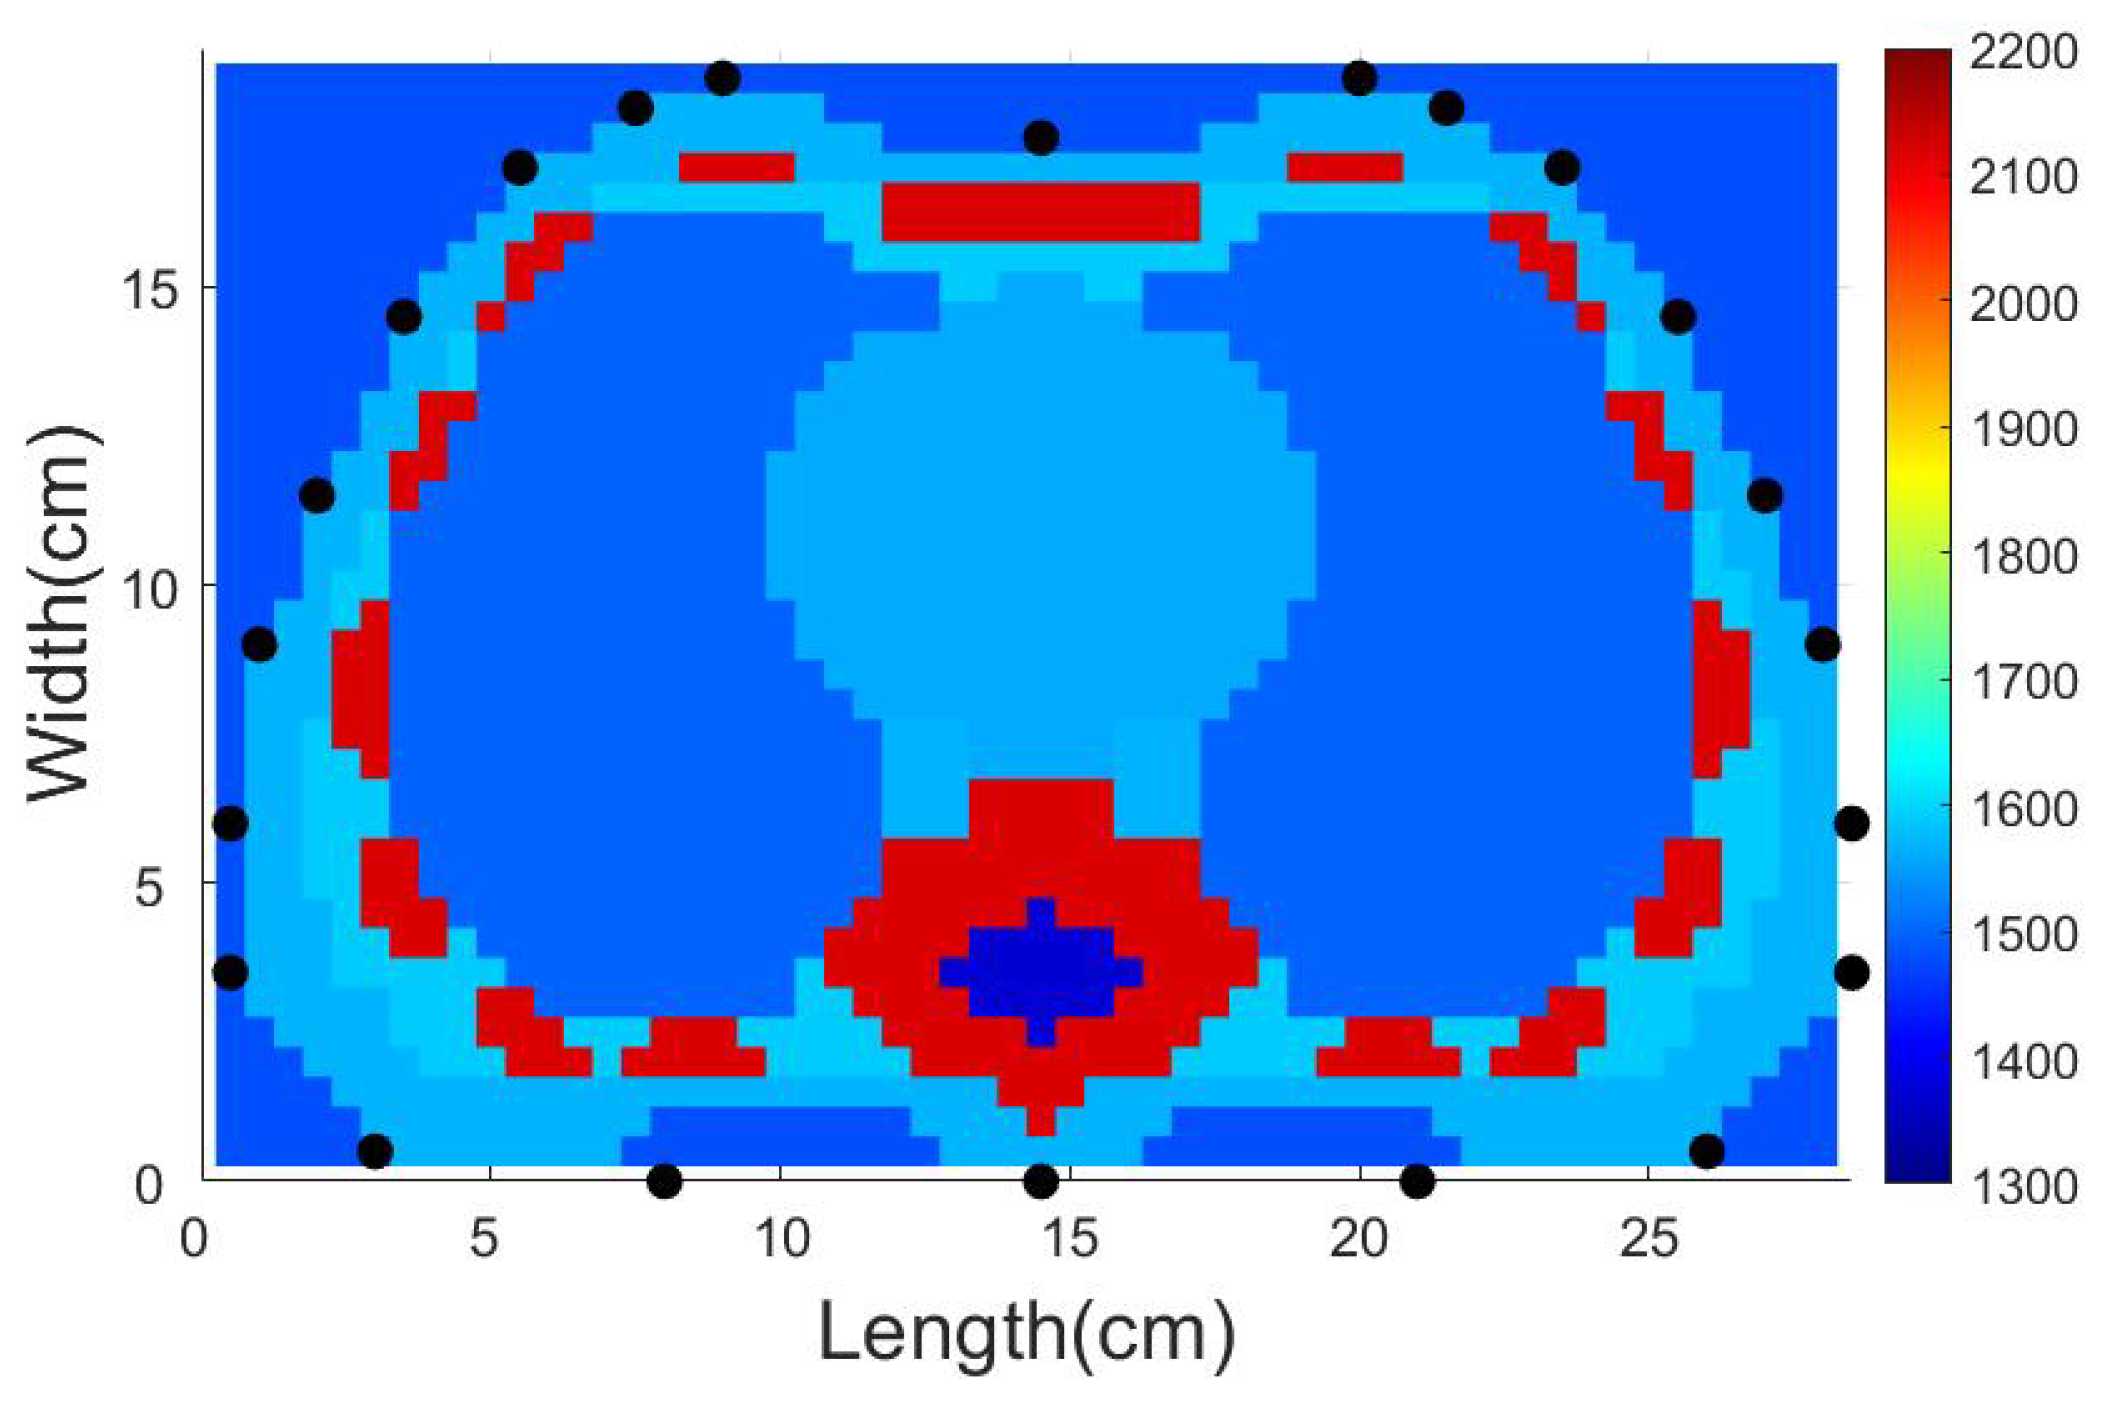
The size of the test domain is 28.5 cm in length and 19 cm in width, and we divide it into 57 × 38 elements with length of 5 mm. The thorax model is shown in Figure 2, containing lung, heart, rib, spine, etc. [55]. The acoustic velocity of each tissue can be checked in [56]. The velocity of primary tissues in the thorax model is shown in Table 1. The blue background area is set to be water. The 22 black points mark the positions of the transducer. The transducer is labeled counterclockwise and the top-middle transducer in Figure 2 is the first one. Each transducer serves as the transmitter in turn and others serve as receivers. Totally 22 × 21 = 462 sets of traveltime data are obtained.
The number of nodes n n o d e s on each edge of the element during the offline training process and online predicting process is chosen to be 3. n n o d e s will influence the accuracy of the forward modeling and the time it takes. Increasing the number of nodes will improve the accuracy but at the same time increase the computation time. We calculate the traveltime data with n n o d e s = 1 , 2 , , 7 . The computation time for the forward modeling is shown in Figure 3a. We choose the traveltime obtained with n n o d e s = 7 as the standard and calculate the relative error. Here, we plot the relative error of the traveltime data obtained from transmitter No. 6 in Figure 3b.
When n n o d e s = 3 , the relative error of each data point is almost smaller than 0.01, which is small enough. If we keep increasing n n o d e s , the decrease in the relative error is small, while the increase in the computation time is large. The computation time of n n o d e s = 4 is almost twice as long as n n o d e s = 3 . In consideration of both efficiency and accuracy, we choose n n o d e s = 3 . In addition, in order to avoid inverse crime, the traveltime data used for inversion in the following numerical experiments computed by SPR method is obtained from the grid with n n o d e s = 5 , because increasing n n o d e s is equivalent to using a higher-resolution grid for forward modeling.
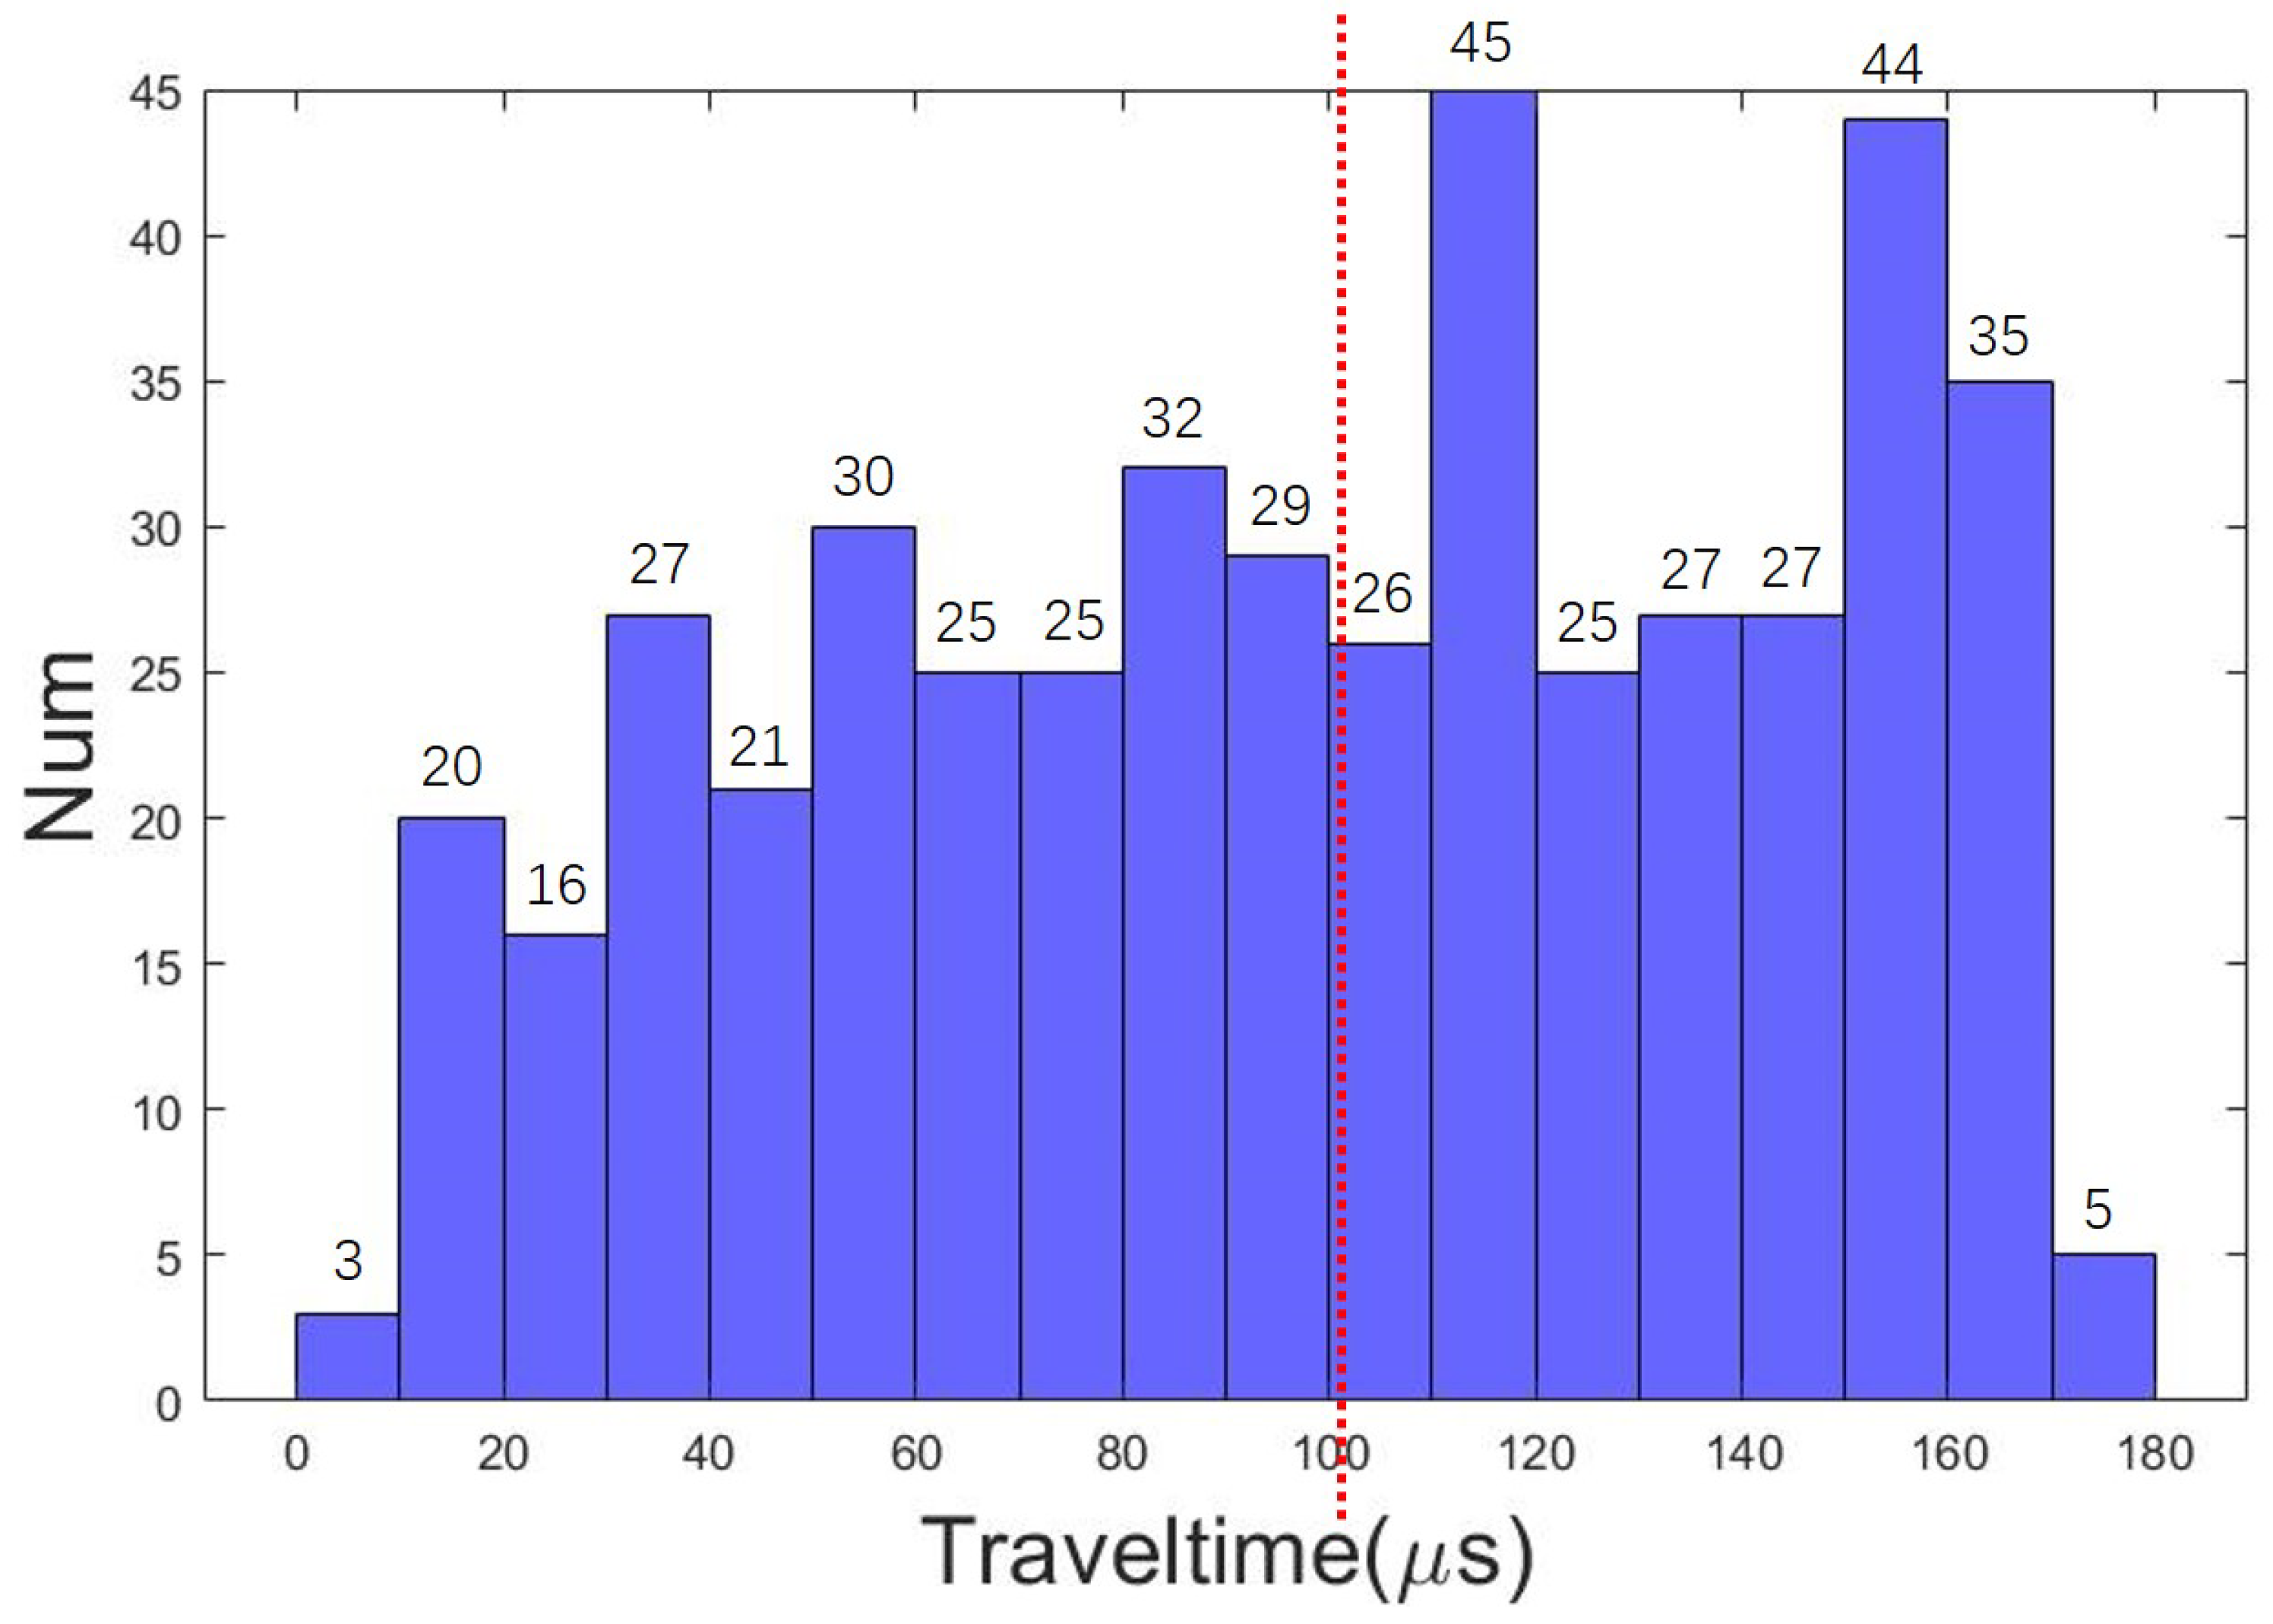
The distribution of the traveltime data obtained from normal thorax is shown in Figure 4. Maximum traveltime data are less than 180 μ s. The median is 101.58 μ s and its position is marked by the red line. To further avoid inverse crime, zero-mean white Gaussian noise with σ = 2 μ s is added to the data.
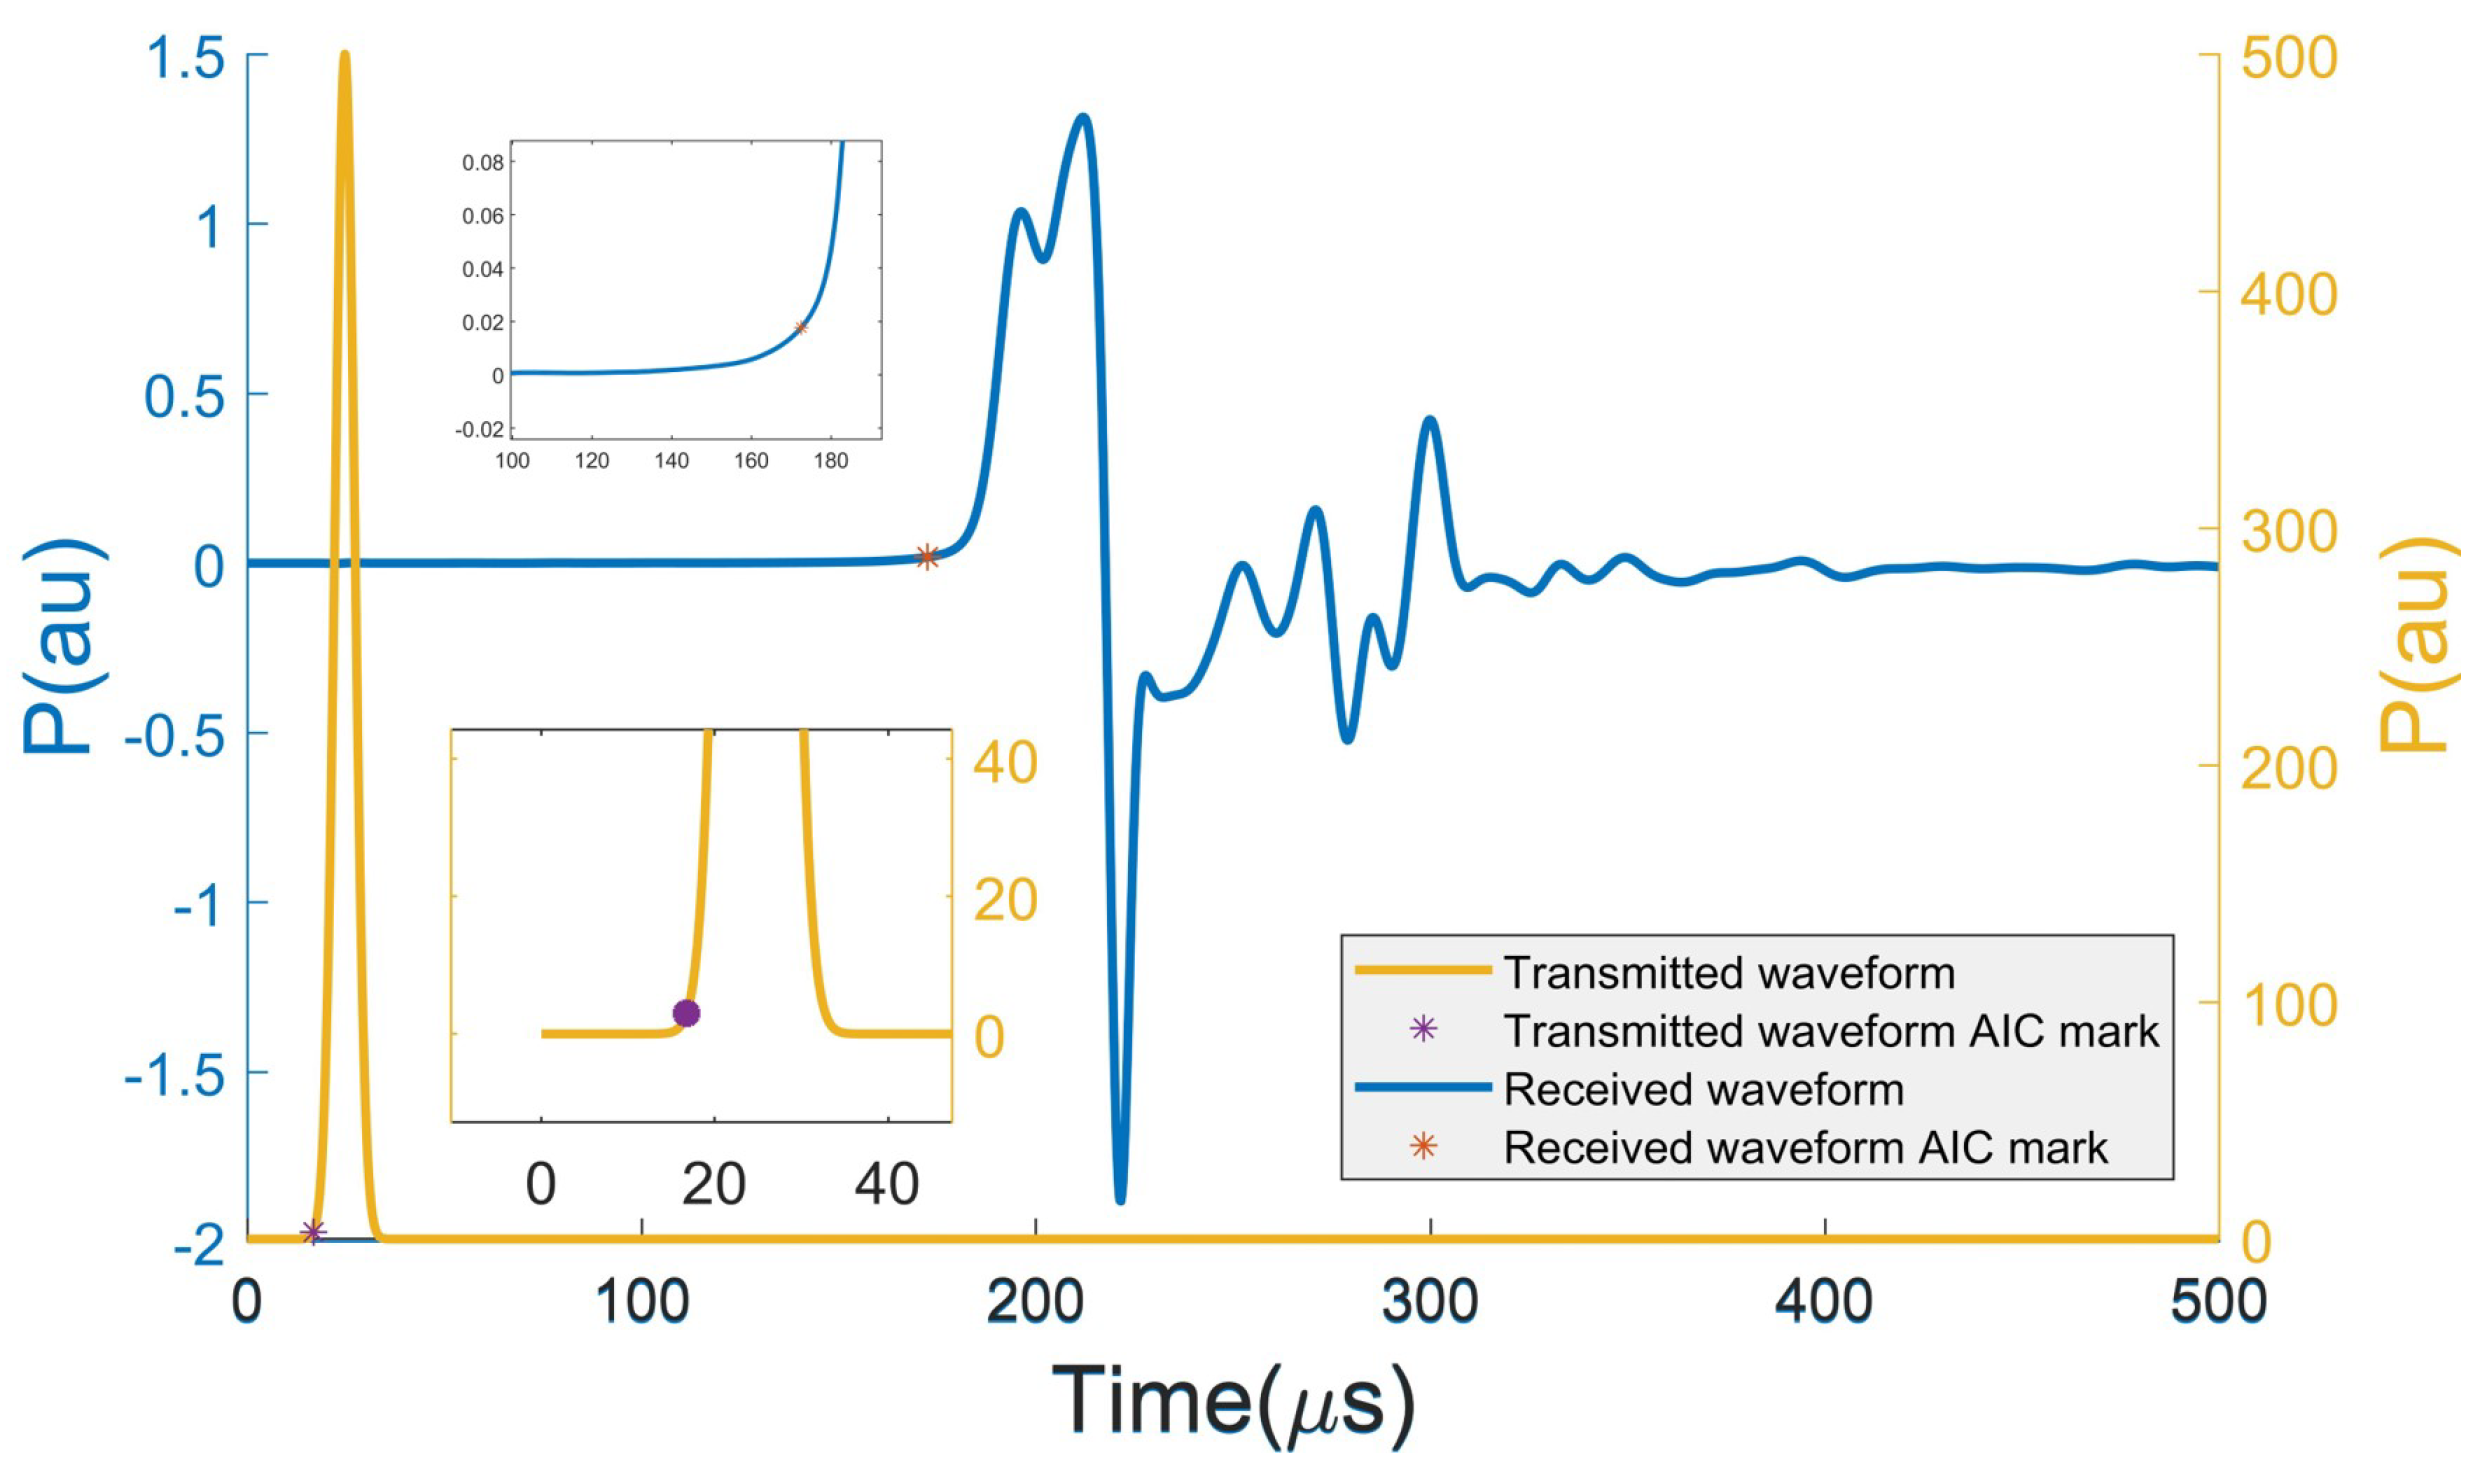
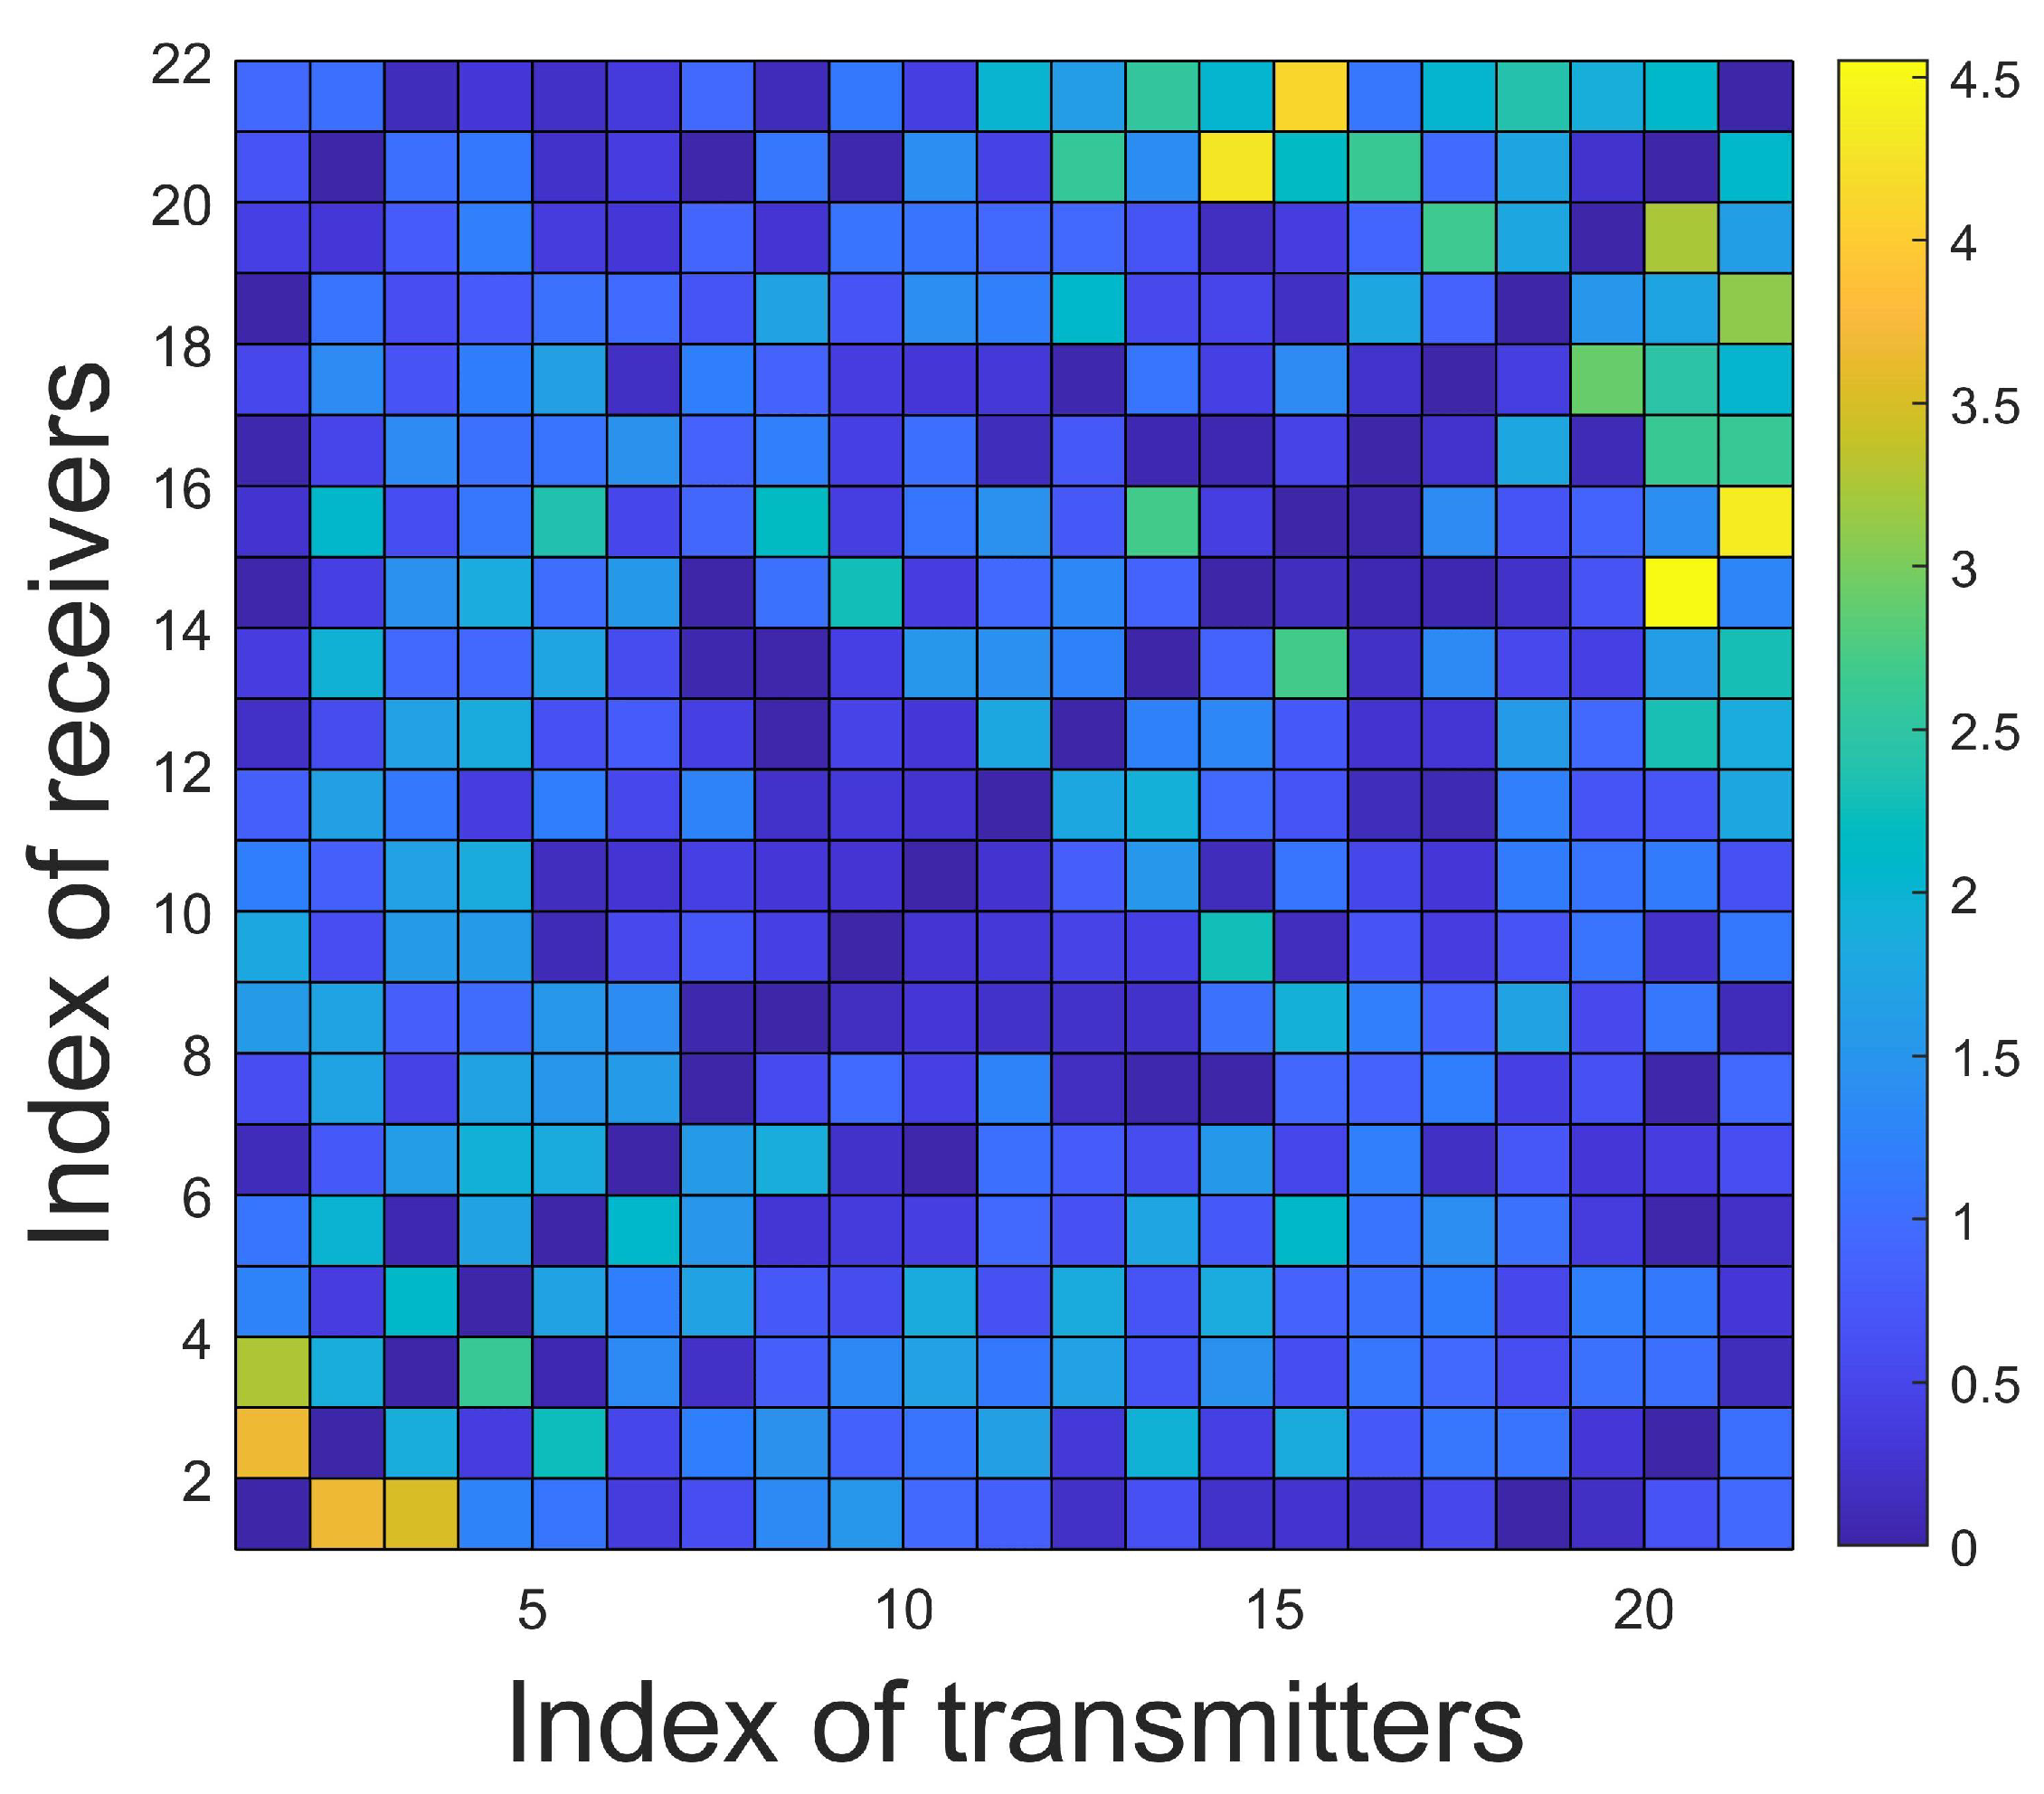
Then, we compare the traveltime data obtained from SPR method with the data obtained from k-Wave simulation [57]. We check tissues’ density and attenuation coefficient in [56]. The thorax model is upsampled to 114 × 76 and put into a 128 × 128 domain with grid size of 2.5 mm. The timestep is set to be 0.25 μ s and the simulation lasts for 500 μ s. Gaussian waveform input signal is assigned to the transmitter and the rest transducers serve as receivers. We apply the Akaike information criteria (AIC) method to extract traveltime from the received waveform [58]. The transmitted waveform from transmitter No. 9 and the received waveform from receiver No.15 are shown in Figure 5. The position of the marker is calculated using AIC method. The distance between the two positions indicates the traveltime of the signal, which is 155.75 μ s. The computed traveltime using the SPR method with n n o d e s = 3 is 155.99 μ s, which agrees well with the k-Wave simulation. The absolute value of the difference between the traveltime data computed by the SPR method and the k-Wave simulation is shown in Figure 6. Most are smaller than 2.5 μ s, which verifies that the SPR method is accurate and can be used to compute traveltime in thorax imaging.

4.2. Details of the Training Set and the Training Process

When using the traditional gradient-based method to solve the traveltime tomography problem, the key step is computing the Jacobian matrix and the inverse of the Hessian matrix. However, only elements traversed by paths can be sensed in the traditional method. Usually, only few elements are traversed, which means the Hessian is generally sparse and hard to invert. In a traditional method, computing the inverse of Hessian needs the help of regularization and is time-consuming. To solve these problems, information of all the elements is added to the training set and the average descent direction is learned offline, which makes the online predicting fast and stable.
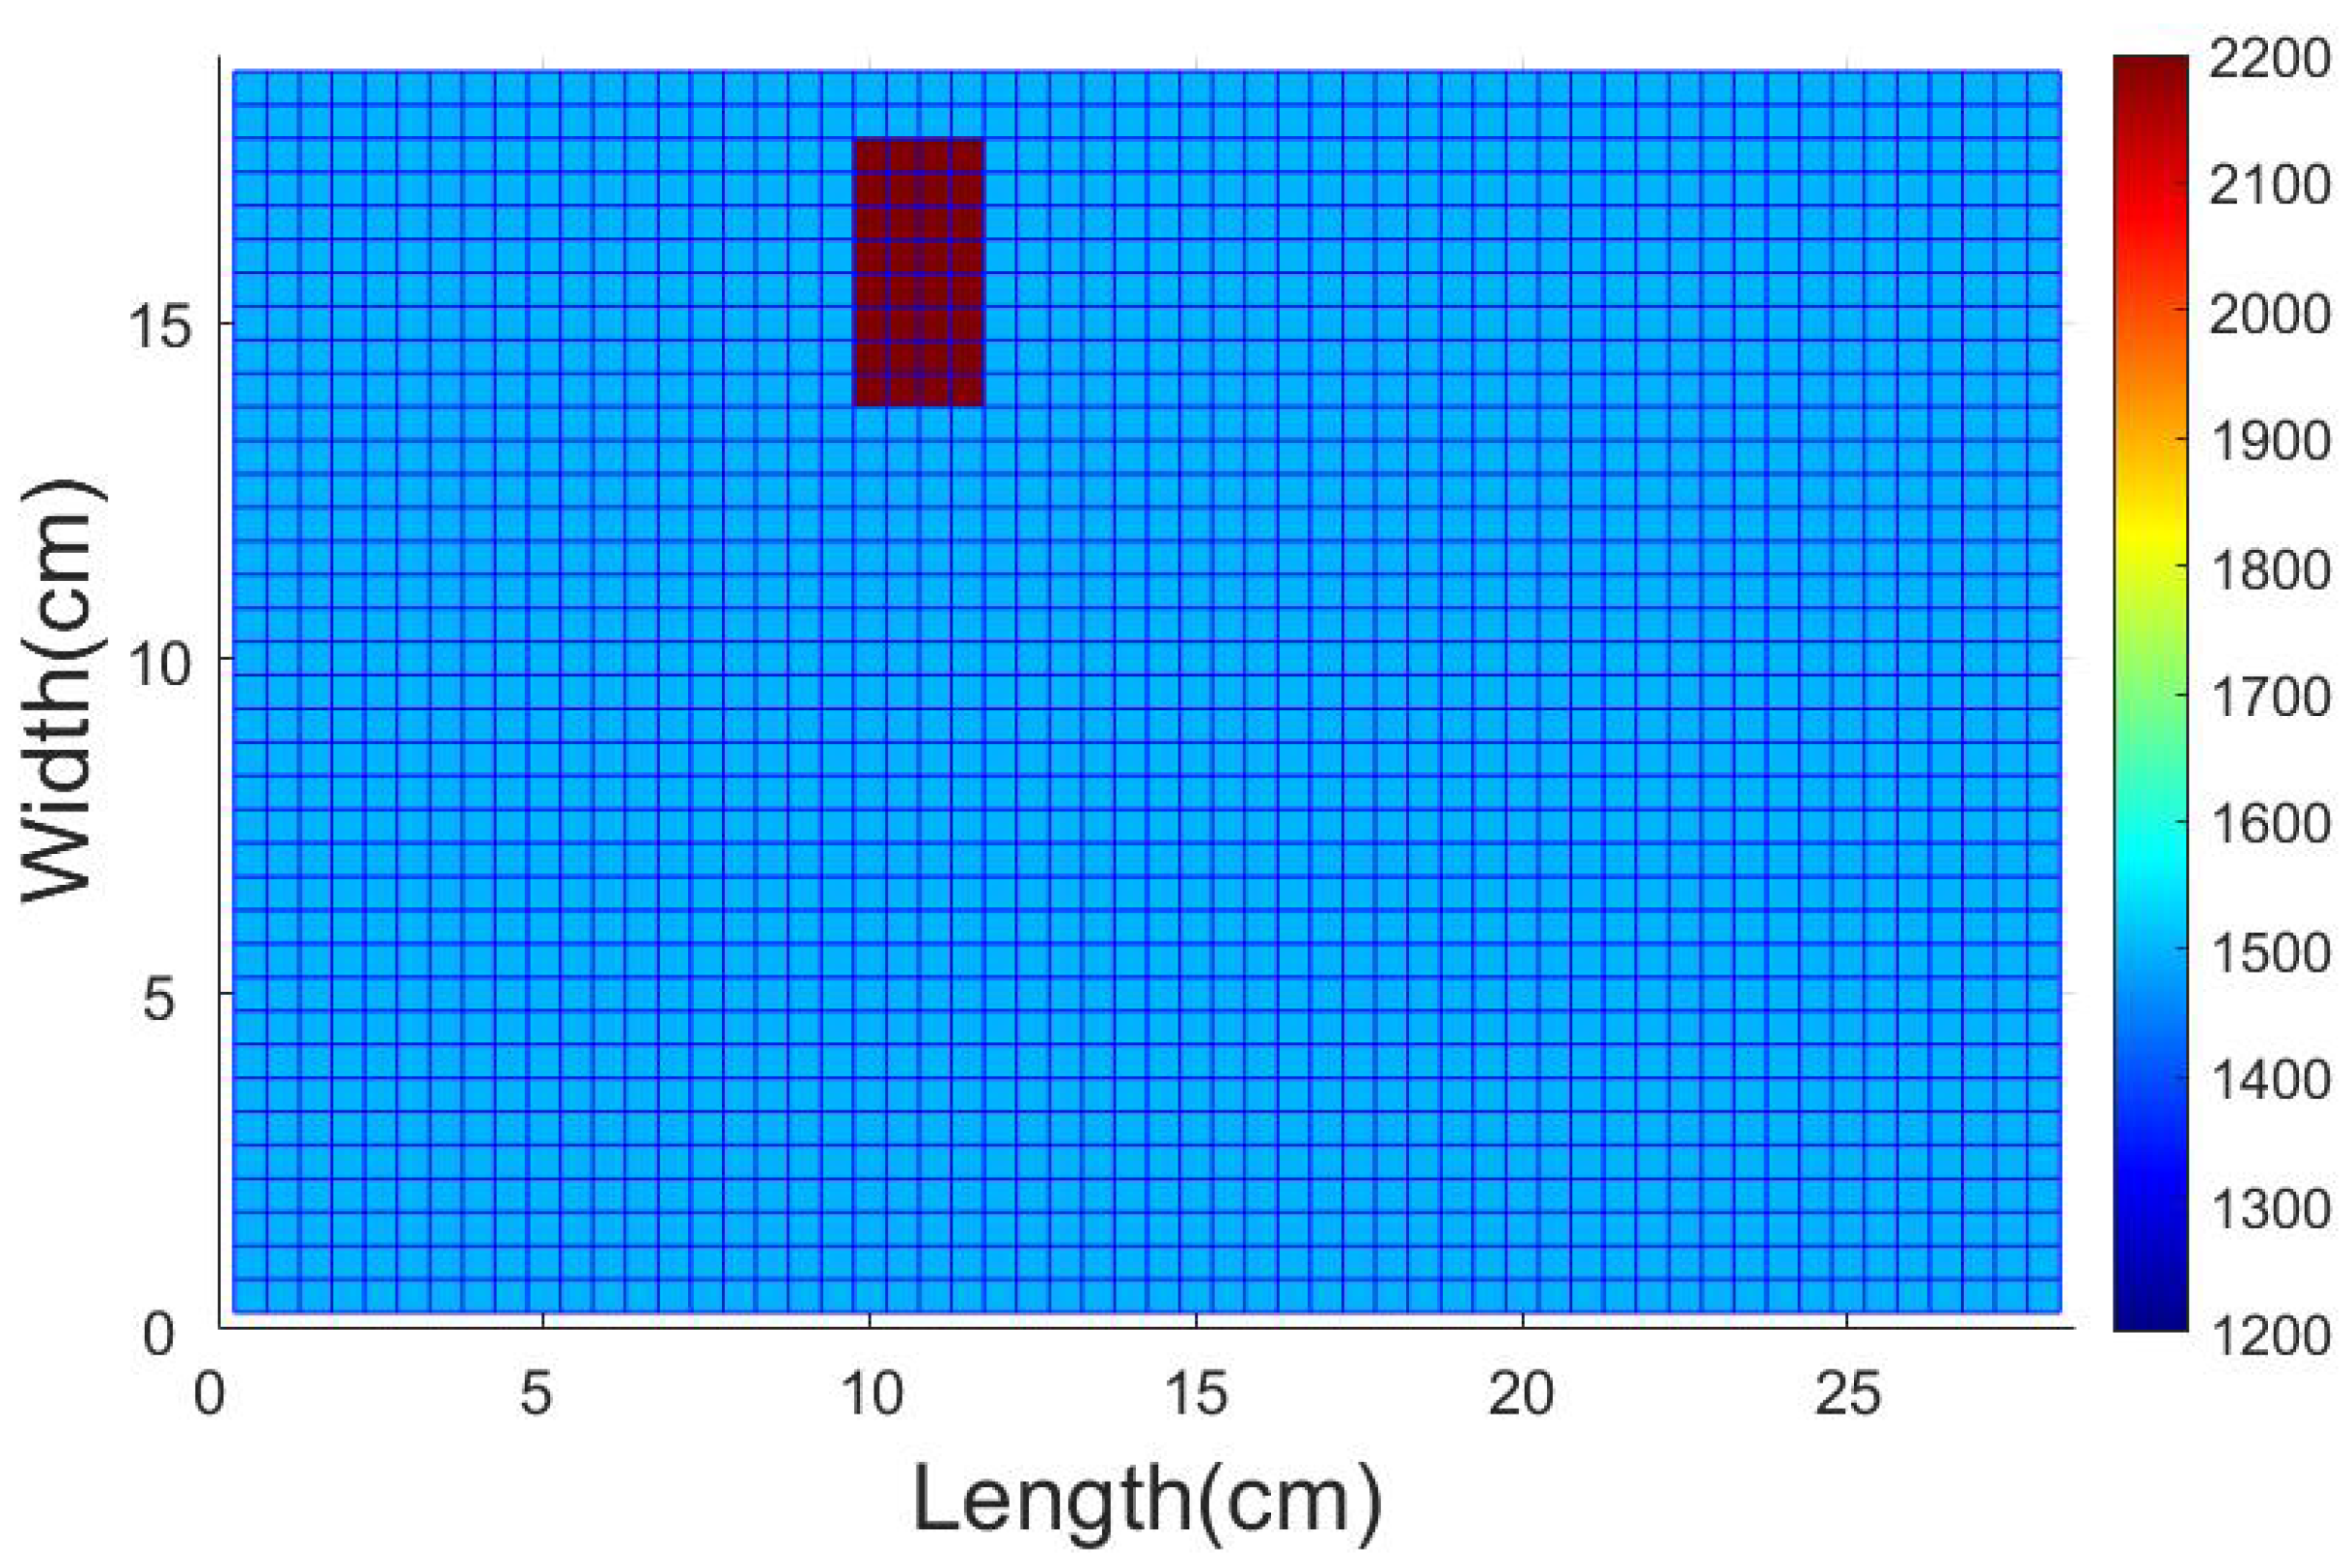
The training set is composed of a homogeneous low-velocity background (1500 m/s) and a high-velocity rectangular block (2200 m/s). The block has two sizes ( 4 × 8 and 8 × 4 ). The block moves one element at a time and covers the whole DoI ( 38 × 57 ) to make sure that all the elements in the DoI are sensed. When moving to the edge of the DoI, the part of the block out of the region is cut. Totally 38 + 7 × 57 + 3 + 38 + 3 × 57 + 7 = 5324 training models are generated. One of the training models is shown in Figure 7. Thus, the training process learns the sensitivity of traveltime with respect to velocity, which is inherently embedded with the prior knowledge on spatial correlations of velocity.
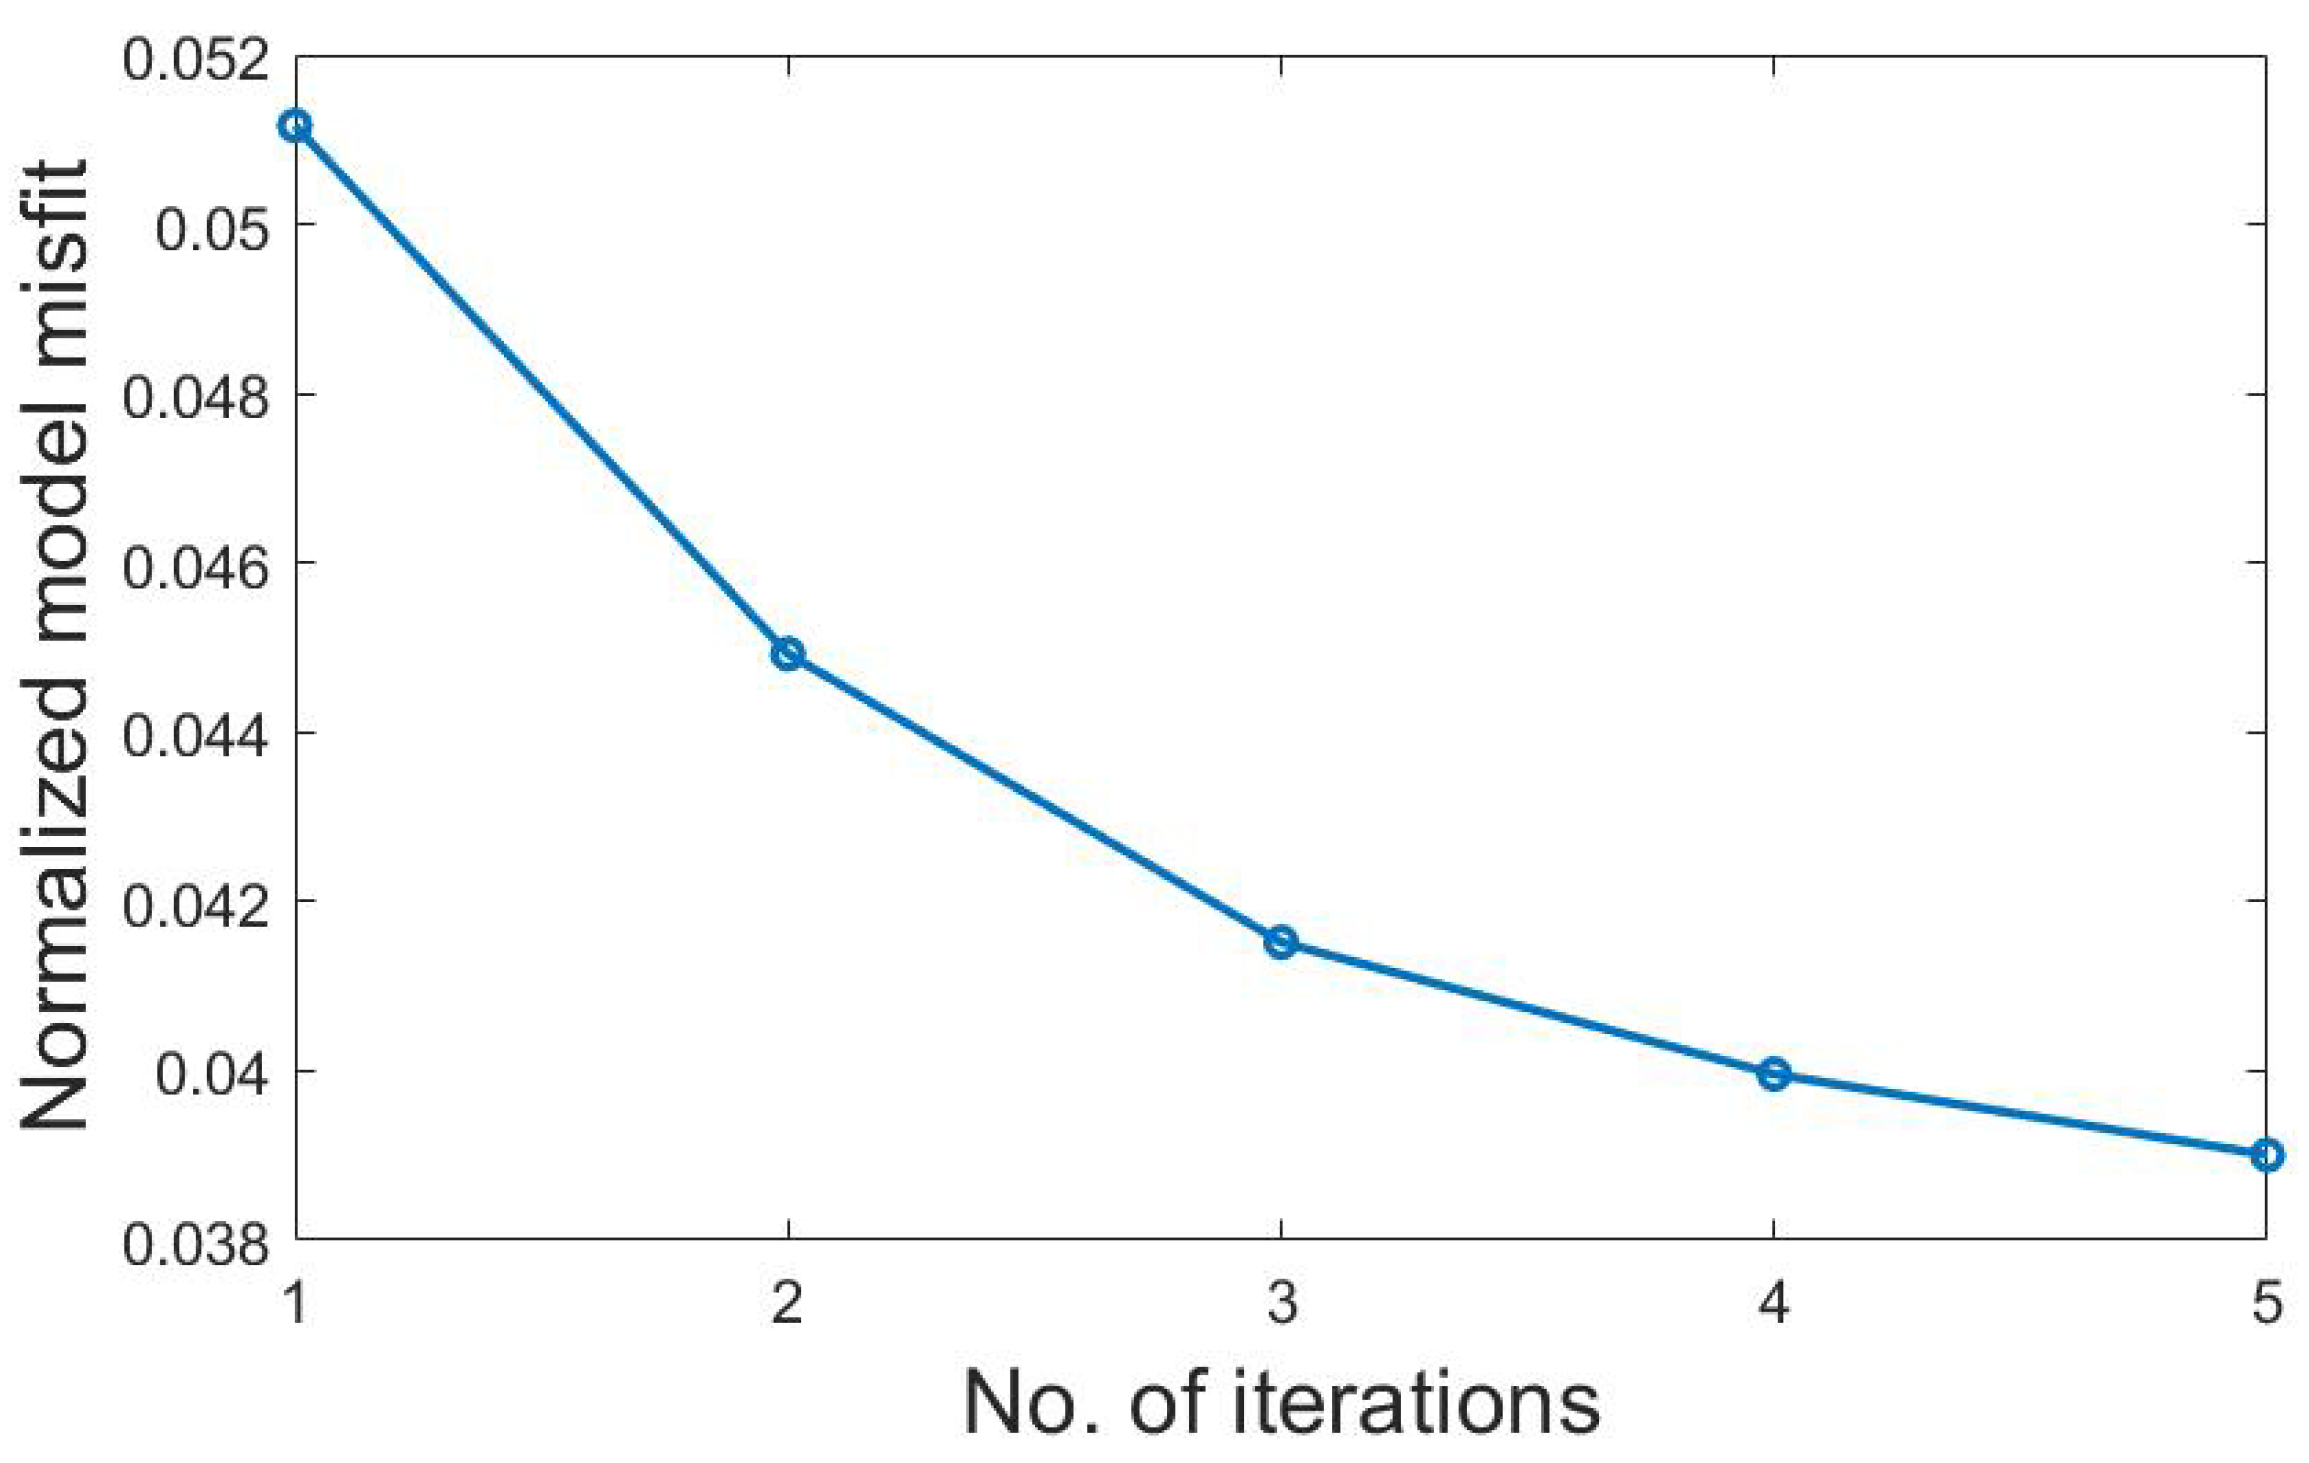
During the training process, the initial model is set to be a homogeneous background with velocity of 1500 m/s. The maximum training step is set to be 5 for convenience. The predicting process will also last for 5 iterations and use the same initial value. The normalized model misfit is shown in Figure 8.

4.3. Numerical Experiments

In this section, all the simulated traveltime data are added with zero-mean white Gaussian noise with σ = 2 μ s. The initial value of the inversion is a homogeneous background with acoustic velocity of 1500 m/s. The maximum iteration number is 5.

4.3.1. Comparison with Traditional Gradient-Based Method

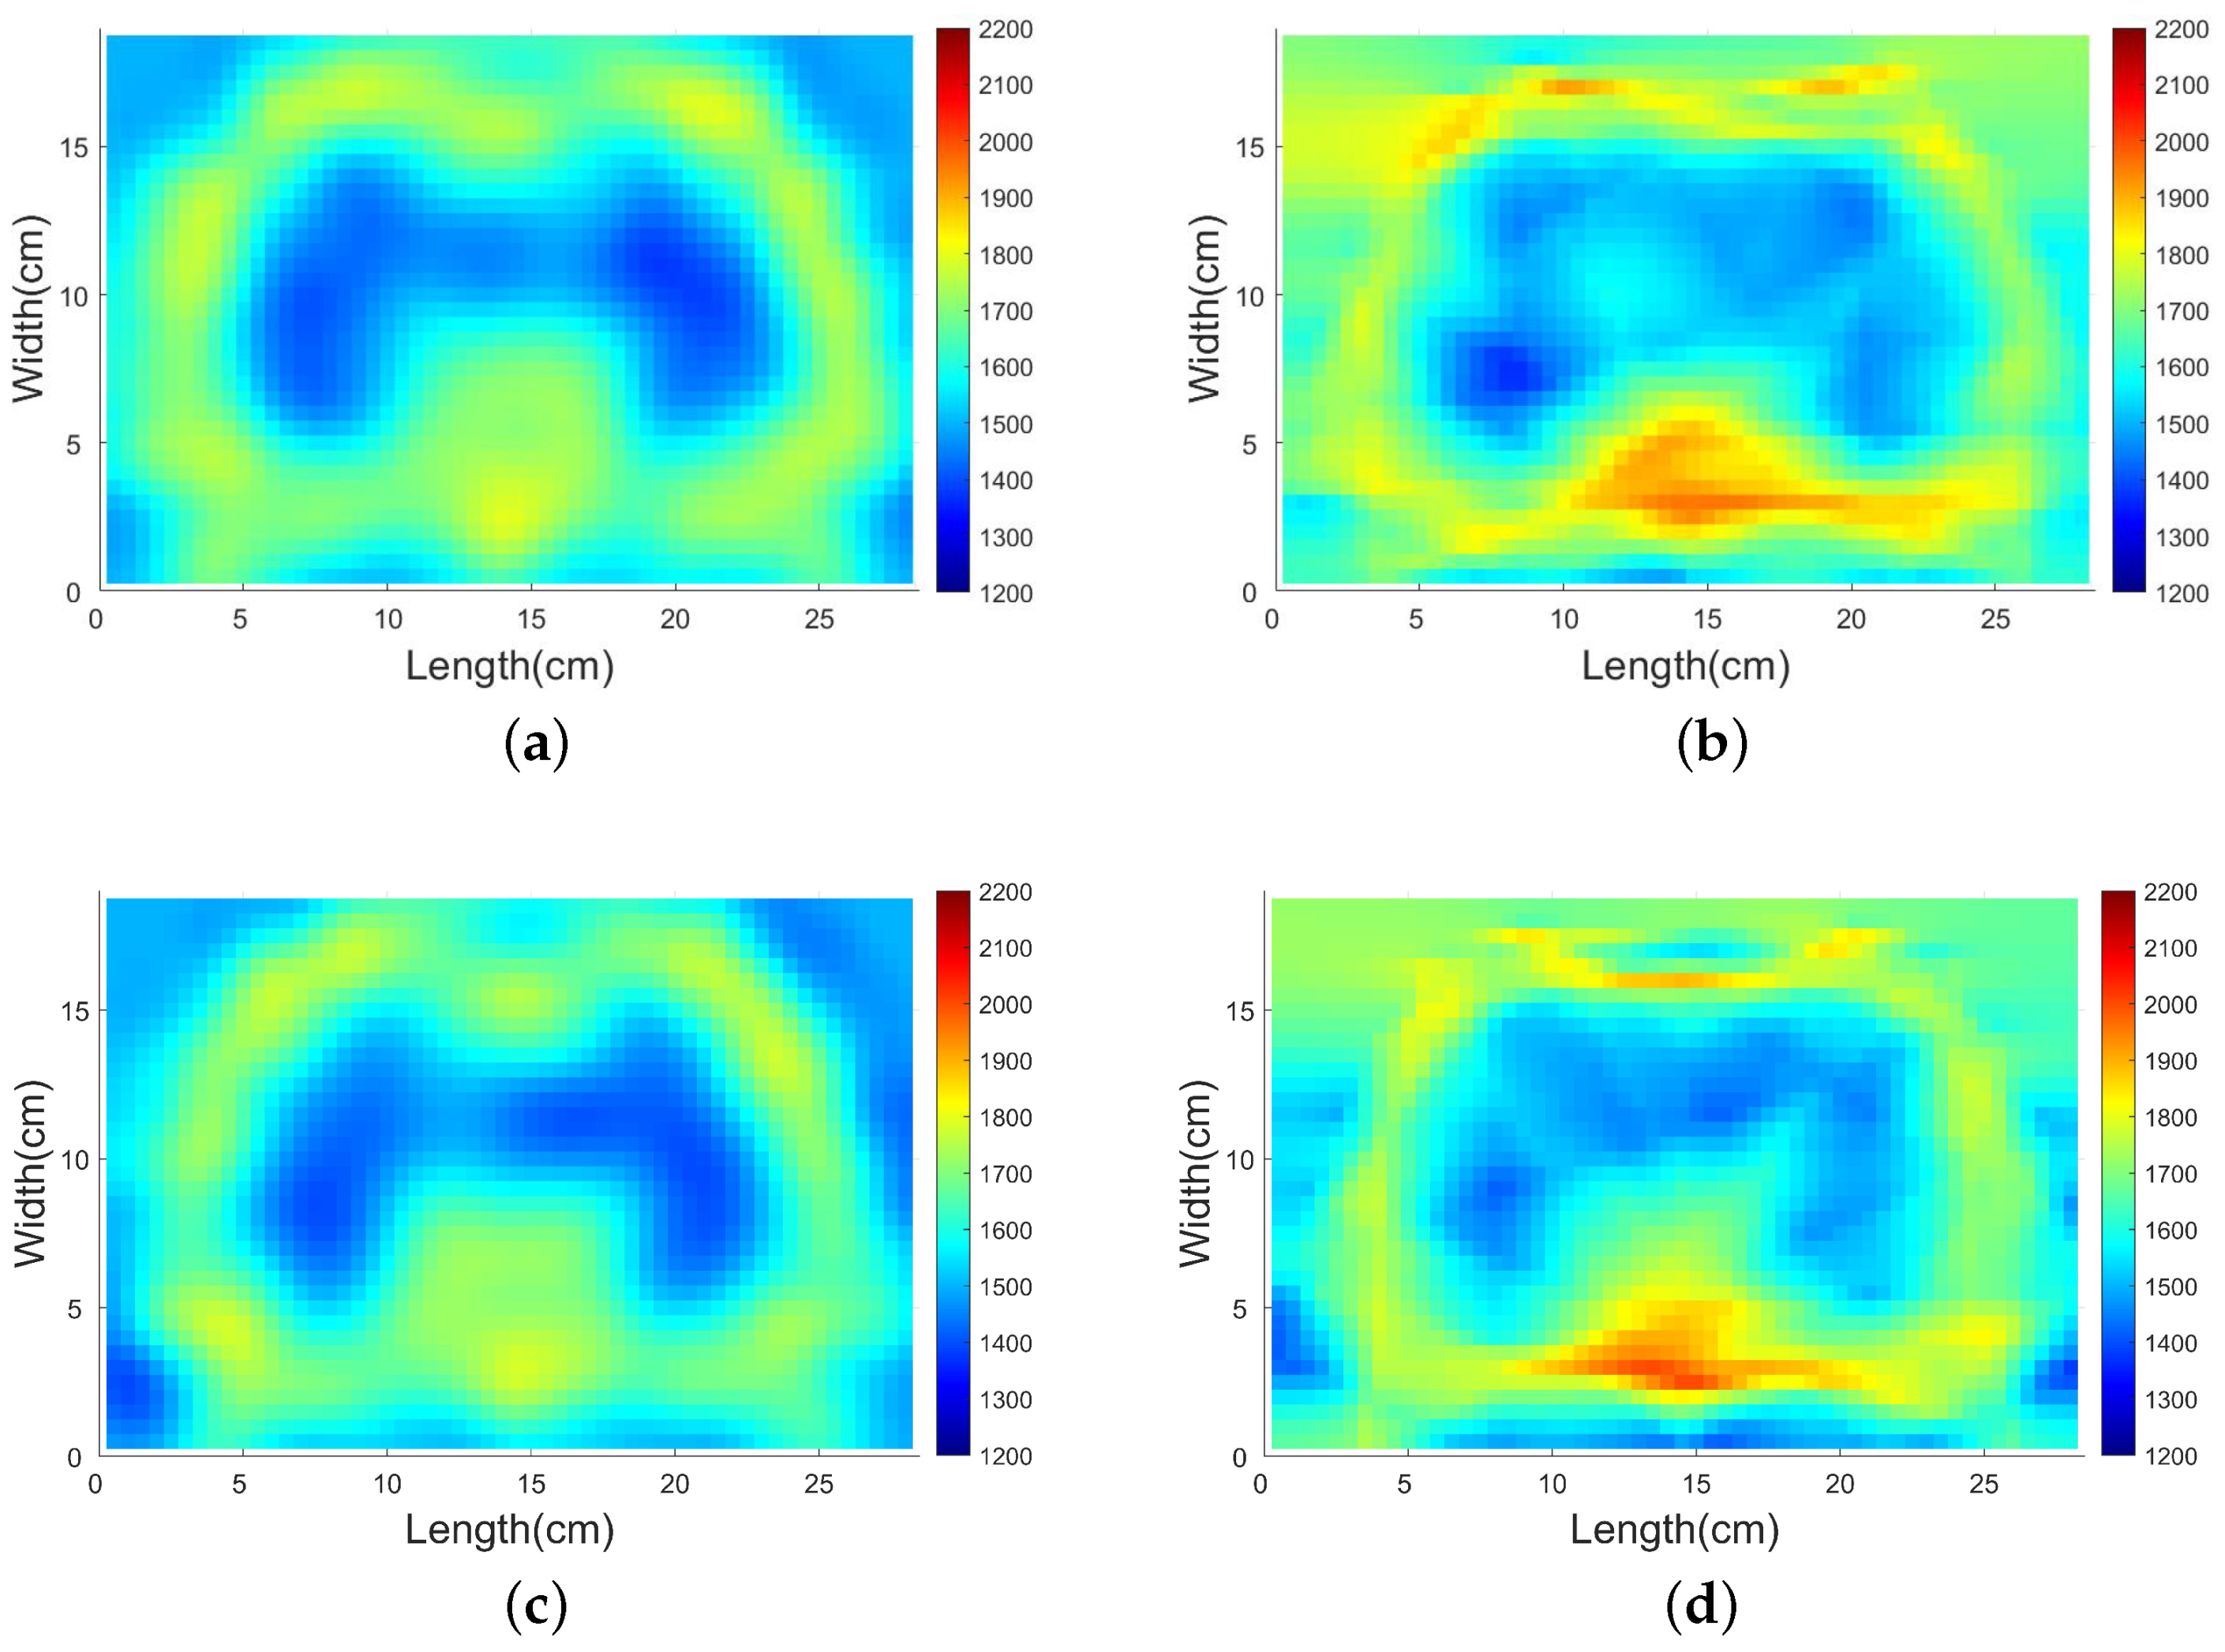
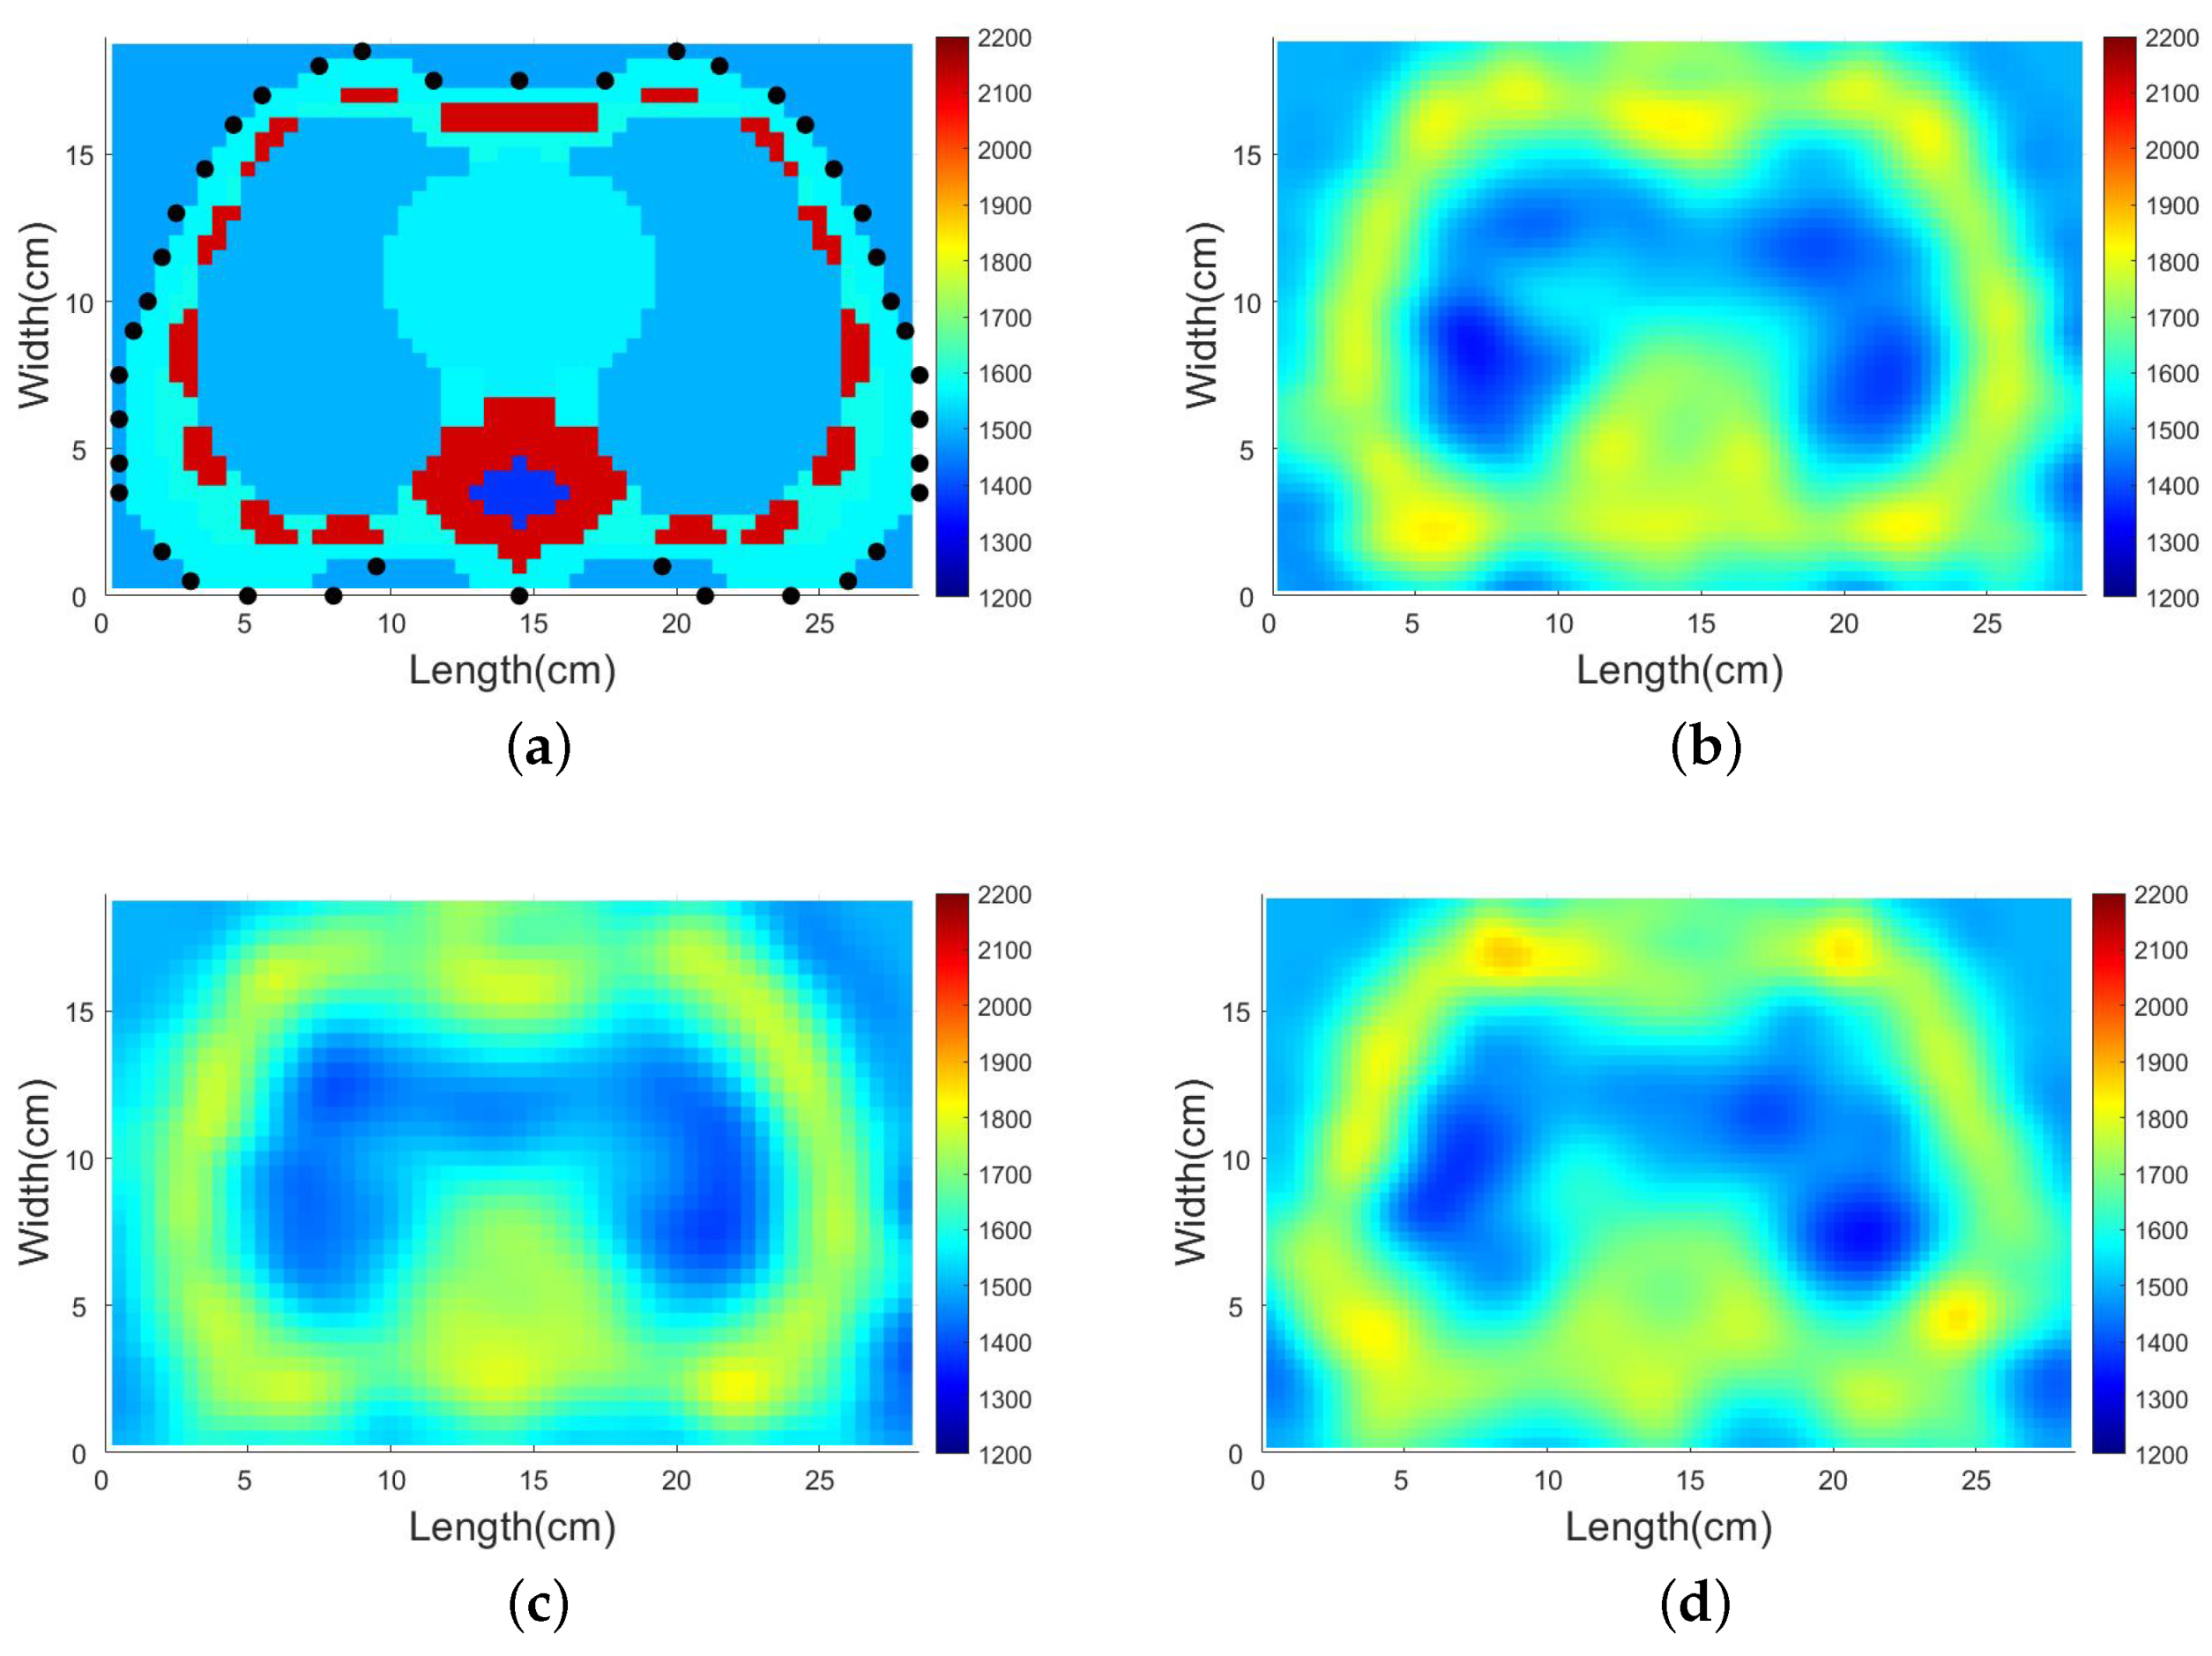
The performance of SDM inversion is compared with traditional Gauss–Newton inversion. The ground truth is the thorax model shown in Figure 2. The results of the two methods are shown in Figure 9. We conduct inversion based on SPR method traveltime data and k-wave simulation traveltime data.
For inversion based on SPR method data, see Figure 9a,b. SDM finishes the inversion in 49.9 s. Although the Gauss–Newton method takes 102.9 s. SDM takes only half of the time the traditional method takes. In addition, from the results we find that the acoustic velocity distribution computed by SDM has fewer artifacts around the thorax and more precise tissue boundaries for ribs. The edges of lungs, ribs, and spine are clear. Heart and lungs are hard to distinguish because their acoustic velocity is close. However, both methods cannot correctly reconstruct the acoustic velocity of marrow because few paths traverse this region. According to Fermat’s Principle, the wave will propagate along the path that takes the shortest time. The acoustic velocity of the marrow is significantly smaller than the spine around it, which means path would like to propagate in the spine rather than the marrow and result in low sensitivity of the marrow region. This example verifies the feasibility of imaging human thorax using ultrasound traveltime tomography with SDM. It also shows the strong generalization ability of SDM because little prior information on the shape of the thorax is added to the training set. The training model contains no structure information of thorax but only a rectangular high-velocity block and a homogeneous background. For inversion based on k-Wave simulation traveltime data, see Figure 9c,d, the results are similar to the inversion based on SPR method data, which further verifies the modeling and inversion algorithm. The traveltime data used in the following numerical experiment is all computed by SRP method with n n o d e s = 5 .
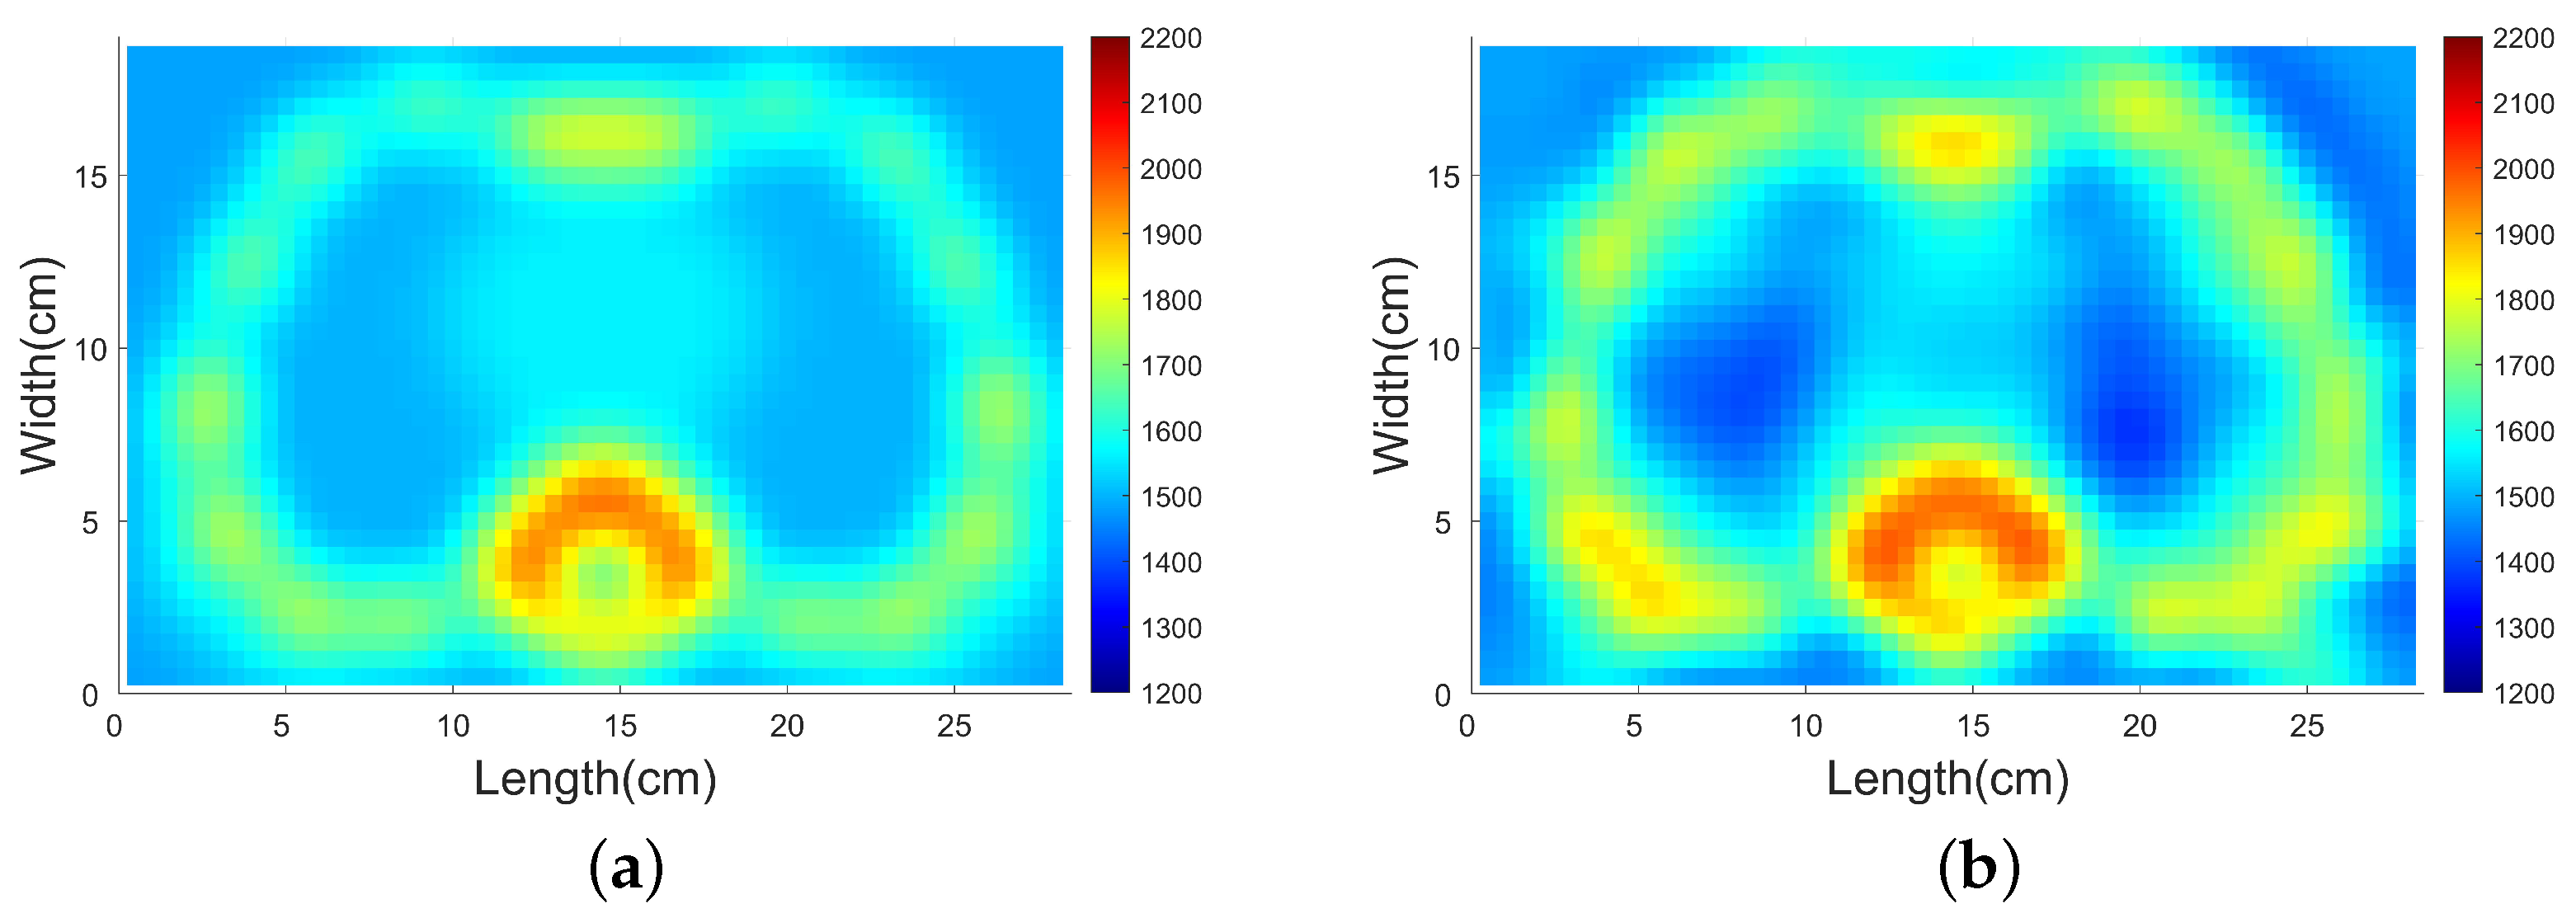
A better initial model would help the inversion. The new initial model is obtained by smoothing the true model with a Gauss filter, see Figure 10a. The result of SDM inversion is shown in Figure 10b. Comparing the new result with the result shown in Figure 9a, we found that the area of the heart, marrow, and bones is better reconstructed. In the future, the initial model can be derived from CT or other imaging modalities.
The inversion results cannot be improved by adding more transducers nor using a higher-resolution grid. We increase the number of transducers and the new array with 40 transducers is shown in Figure 11a. We also prepare a new grid whose size is 57 × 86. We conduct reconstruction on the same normal thorax model with previous array and new grid, new array and previous grid, and new array and new grid. New training sets are constructed for each task using the previous method. The inversion results are shown in Figure 11b–d. Compared with the inversion results shown in Figure 9b, no significant improvement can be seen. The reason the results have not improved might be that this traveltime tomography problem is too ill-posed. The current method cannot obtain the model out of the local minima. In addition, more transducers and higher-resolution grid will increase the time of inversion. The computation time of these three results is 132.9 s, 160.1 s, and 407.9 s, which are much longer than the previous 49.9 s.

4.3.2. SDM Traveltime Inversion of Thorax on Different States

Some respiratory system diseases might change the amount of gas and fluid in the thorax, which will cause changes in acoustic velocity because acoustic velocity in air is significantly smaller than in water. In this section, SDM traveltime tomography will be used to test whether these changes can be detected. Here, we take pleural effusion and pneumothorax as examples. Patients with pleural effusion tend to have more fluid in the thorax [59]. Although patients with pneumothorax will have more gas in the thorax [60].
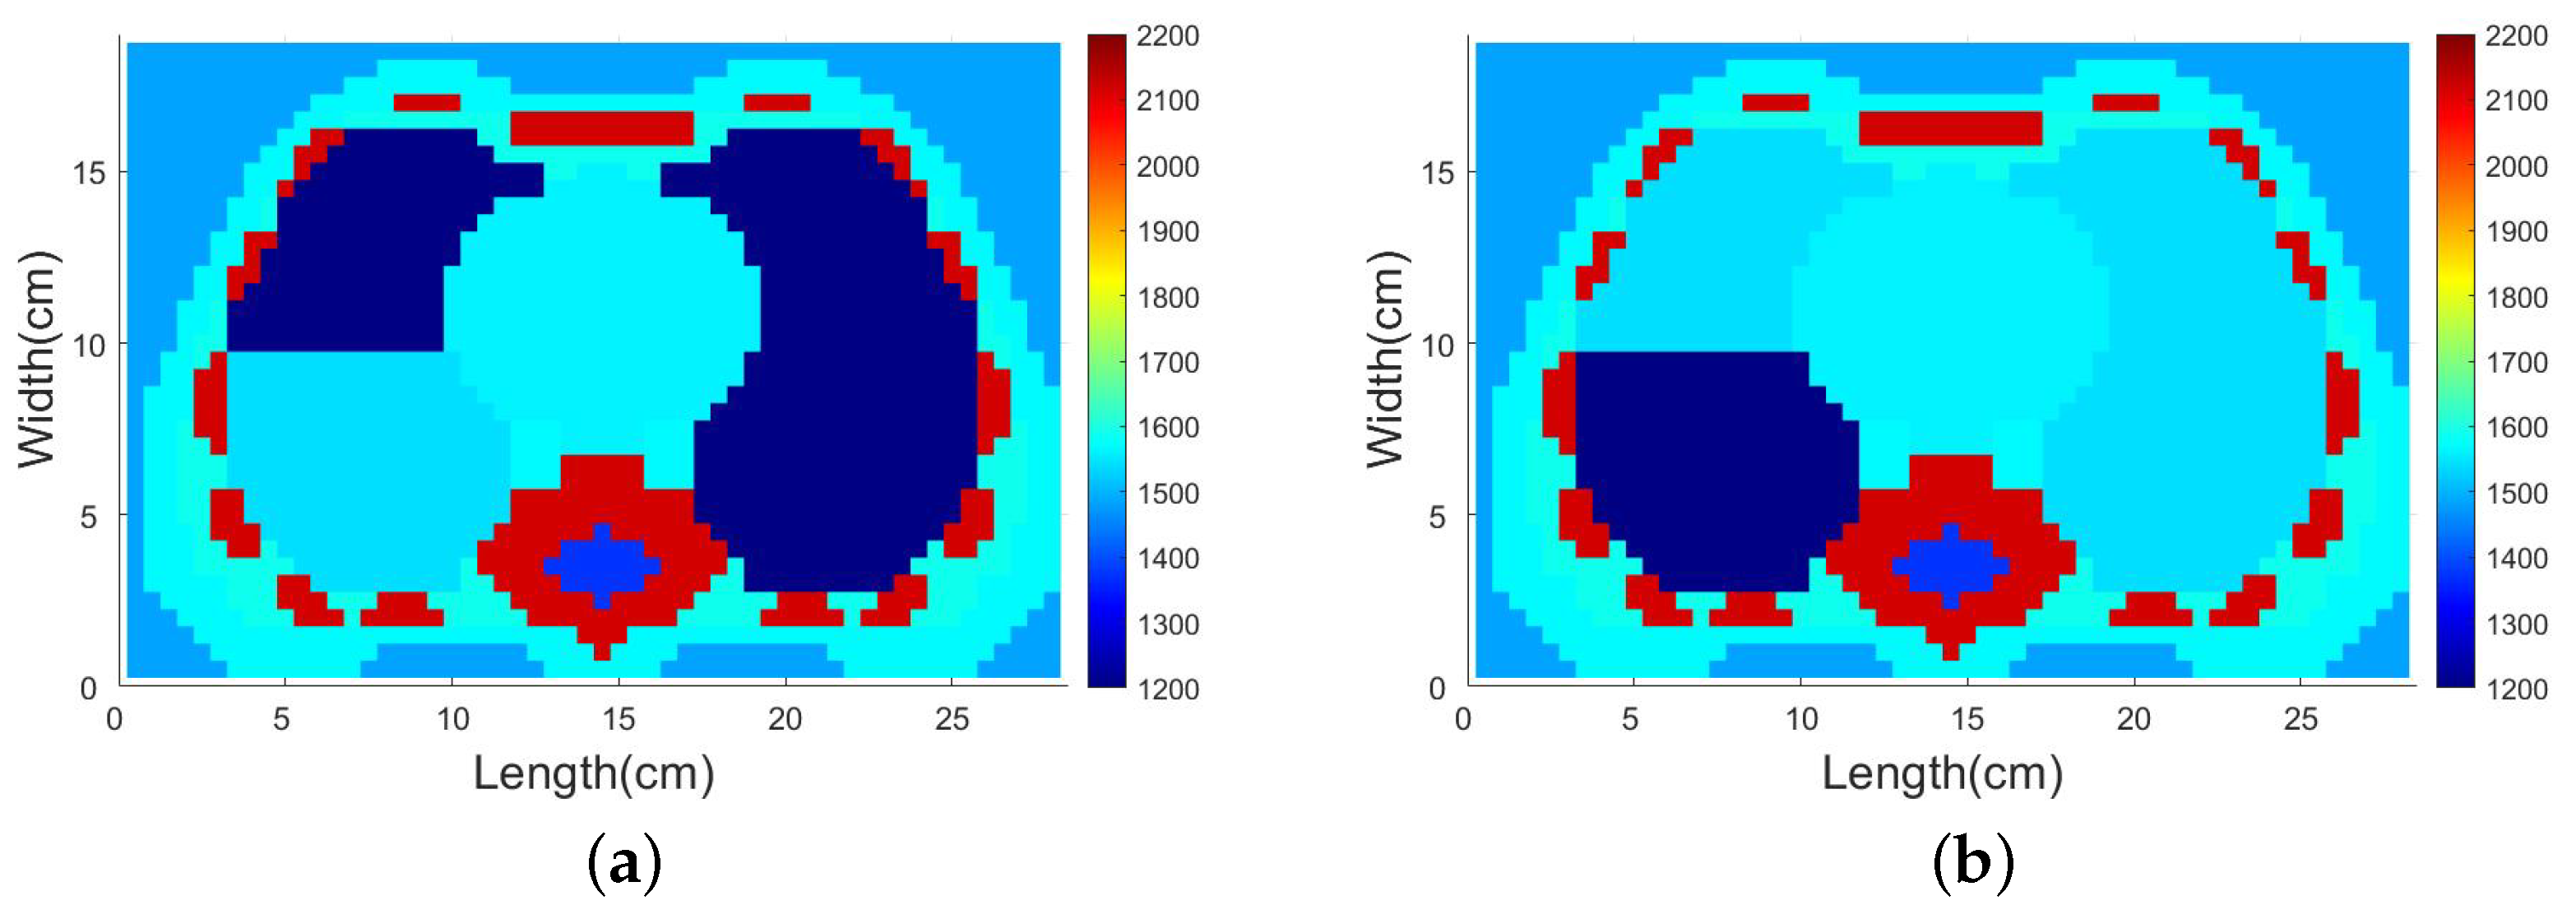
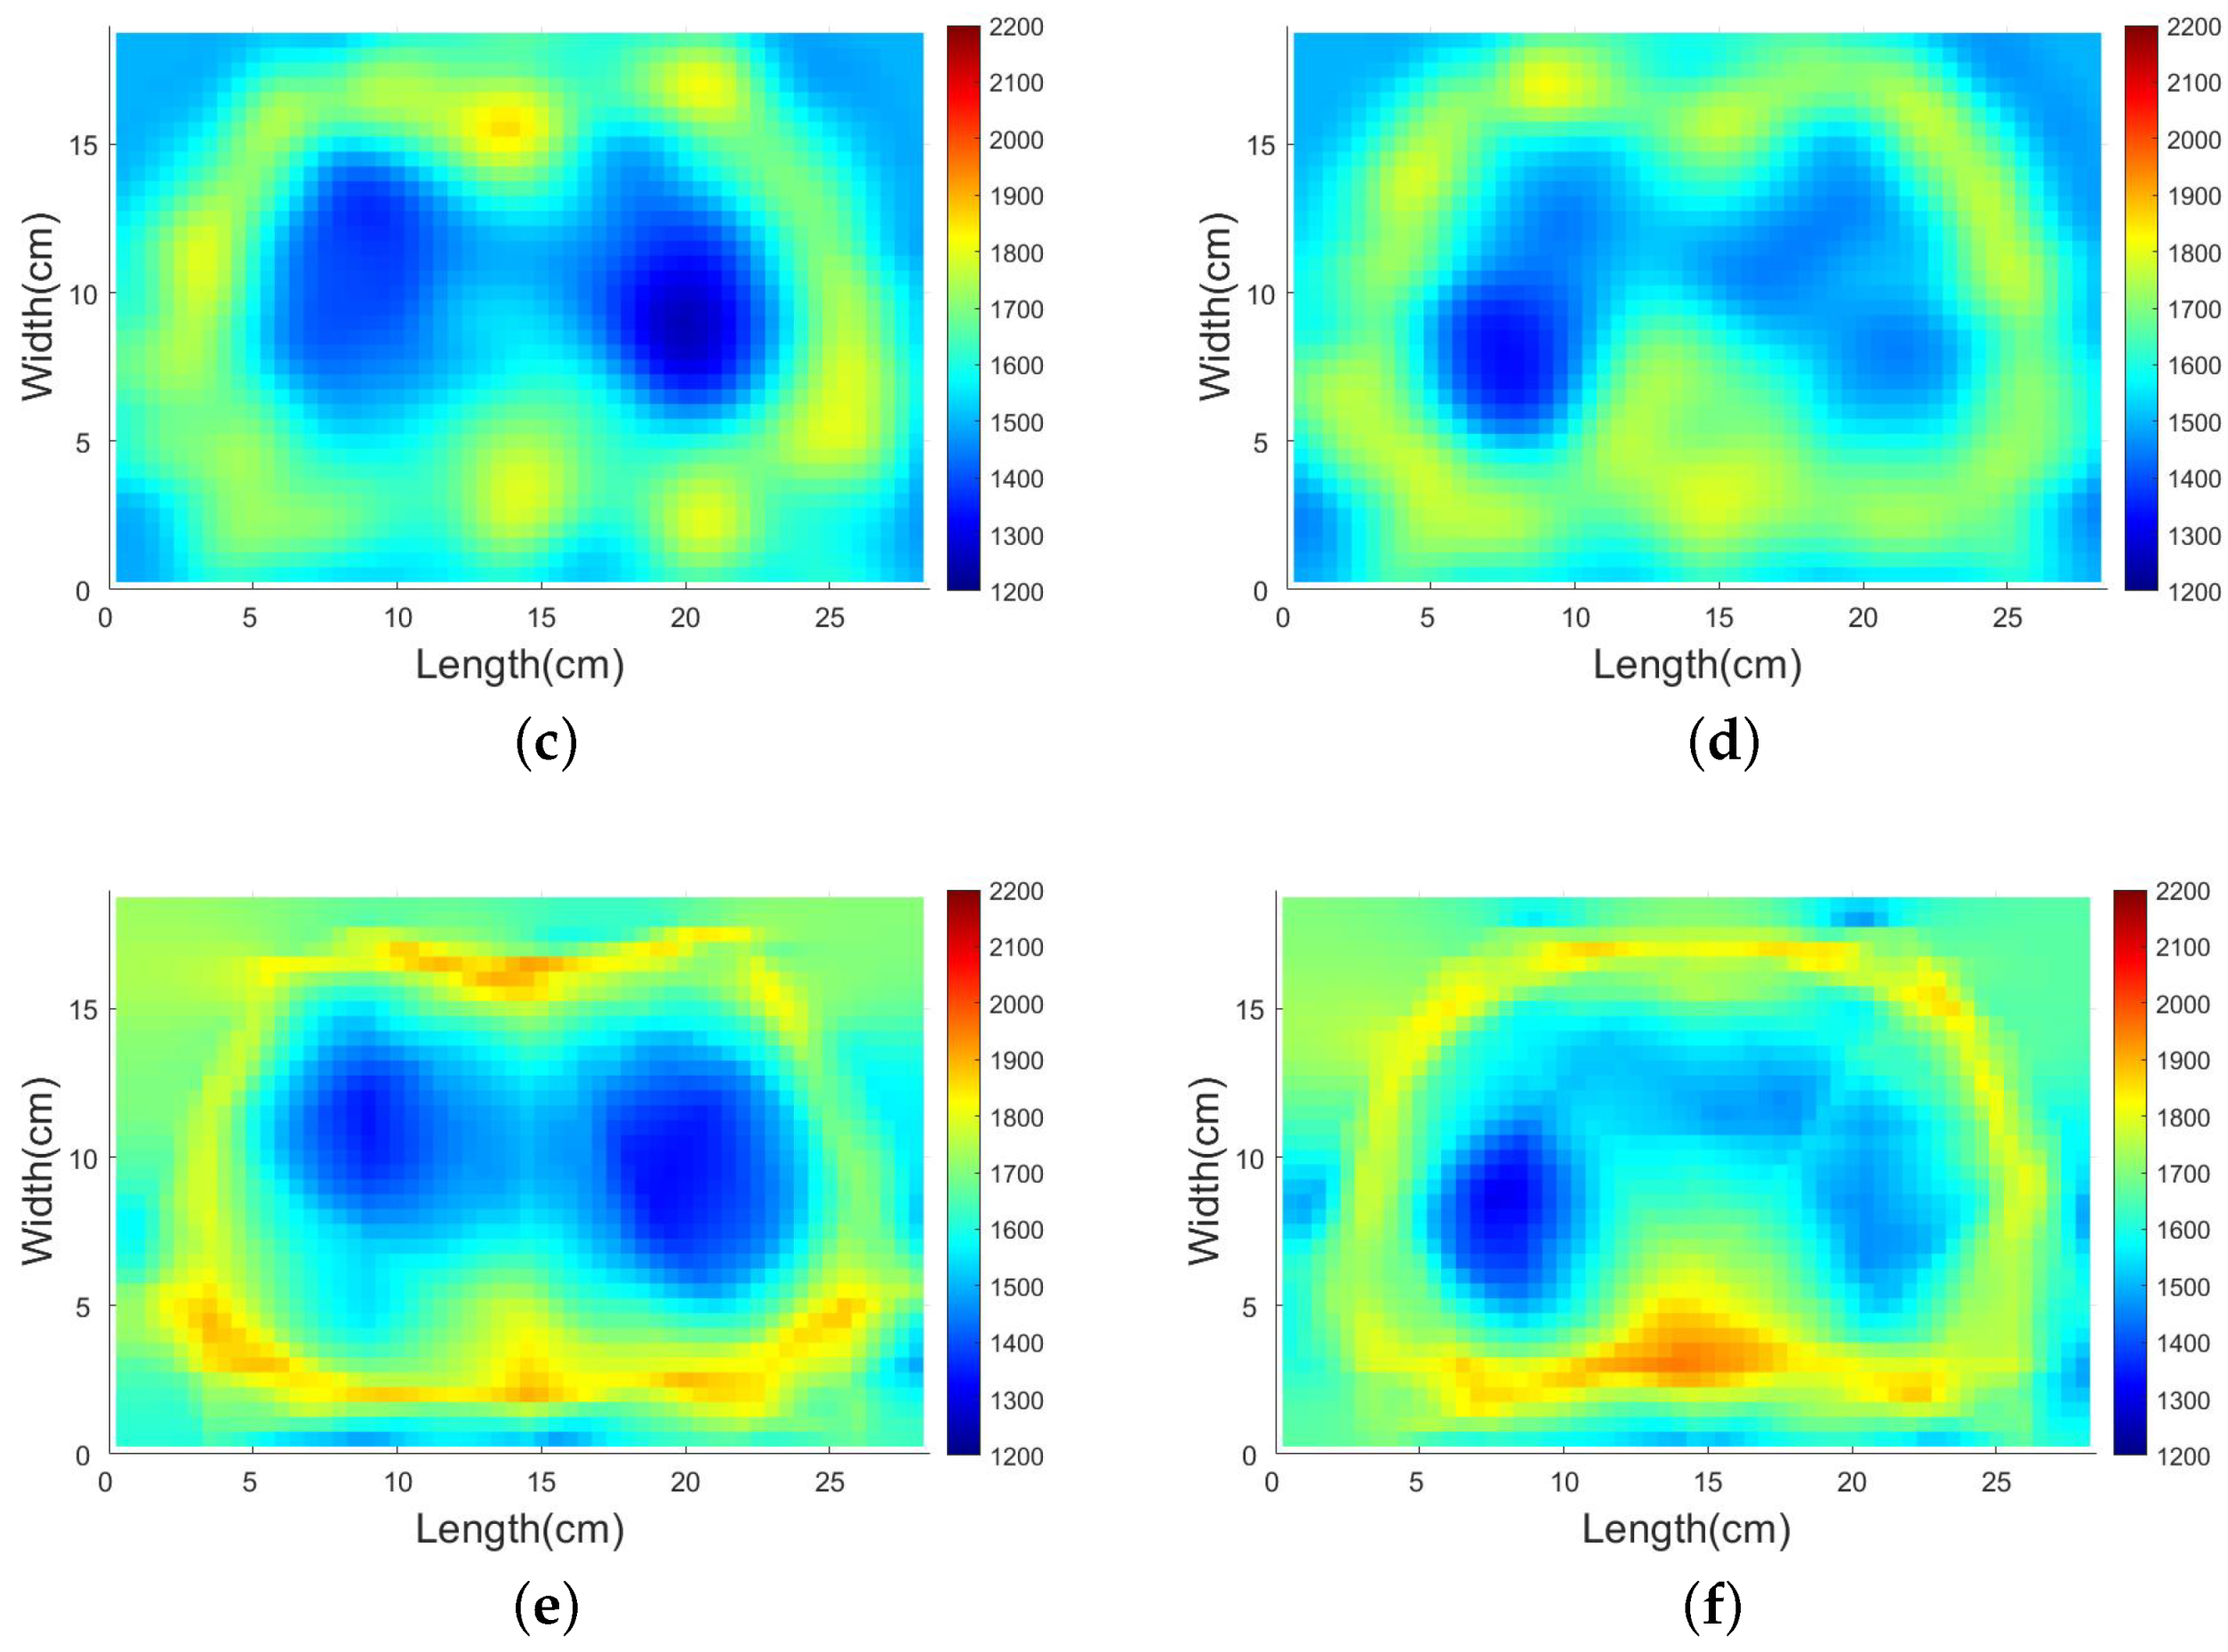
Firstly, a pleural effusion patient’s thorax acoustic velocity distribution is reconstructed, see the first column of Figure 12. We assume that the acoustic velocity of lungs when breathing in air will decrease to 1200 m/s (lower than average tissue acoustic velocity of 1540 m/s and higher than air acoustic velocity of 340 m/s). We suppose that the velocity distribution of a pleural effusion patient when breathing in air is like Figure 12a. The lower part of the left lung is the pleural effusion area. We suppose that the velocity of this area is 1540 m/s, same as the average tissue acoustic velocity. We want to reconstruct this high-velocity area near the low-velocity area through SDM traveltime tomography. The reconstruction result is shown in Figure 12c. The reconstruction result shows that both lungs’ boundaries are clear and the left lung is smaller than the right one because the effusion area’s velocity is higher than the normal lung area. For comparison, the result of the Gauss–Newton method is shown in Figure 12e, which has more artifacts. This example verifies that the change of acoustic velocity resulting from pleural effusion can be detected by SDM traveltime inversion.
Then, thorax acoustic velocity distribution of a pneumothorax patient is reconstructed, see the second column of Figure 12. We suppose that the velocity distribution of a pneumothorax patient when breathing out air is like Figure 12b. We suppose that the pneumothorax area is also located in the lower-left part of the thorax. The acoustic velocity of the pneumothorax area is assumed to be 1200 m/s, the same as the normal thorax region when breathing in air. In this example, a low-velocity region among high-velocity region will be reconstructed. The reconstruction result is shown in Figure 12d. The result shows that the boundaries of both lungs are clear and the pneumothorax area is reconstructed. The lower part of the left lung is darker than the lower part of the right lung. For comparison, the result of the Gauss–Newton method is shown in Figure 12f, where the boundary between normal area and pneumothorax area is not clear. This example verifies that the change of acoustic velocity resulting from pneumothorax can be detected by SDM traveltime inversion. In addition, the generalization ability of the method can also be demonstrated in these experiments. The learned descent direction can be applied to thorax under different conditions.

5. Conclusions

In this paper, we verify the feasibility of imaging the human thorax using ultrasound traveltime tomography with SDM and detecting the change of acoustic velocity distribution resulting from respiratory diseases. A training set containing training models with homogeneous background and a high-velocity block covering the whole DoI is introduced. The average descent direction is learned from the training set and all elements in the DoI are sensed. Thanks to the offline training process, the online predicting process is fast and stable. In numerical experiments, SDM traveltime inversion is compared with the traditional gradient-based method on a normal thorax model. A slightly better result is obtained in half the time as the Gauss–Newton method, which means SDM traveltime inversion can be used to image human thorax efficiently. Then, we test its ability to detect the change in acoustic velocity distribution resulting from respiratory diseases. Thorax velocity distribution of pleural effusion and pneumothorax is assumed and inversed by our method. The results show that the synthetic change in acoustic velocity distribution can be detected. SDM also shows good generalization ability. No prior information about thorax structure is added to the training set and the learned descent direction can be applied to inverse thorax at different states. Computing the acoustic velocity distribution can help to monitor human respiratory system, as the acoustic velocity is closely related to tissues’ physical properties. In conclusion, ultrasound traveltime tomography with SDM can be used to image human thorax and detect the change in thorax acoustic velocity distribution efficiently. It might be helpful for the diagnosis and quantitative evaluation of respiratory diseases and the localization of the lesion area.

Author Contributions

Project administration, T.Z., M.L., F.Y. and S.X.; Resources, T.Z.; software, T.Z., R.G., H.Z. (Hongyu Zhou), H.Z. (Haolin Zhang) and Y.C.; Supervision, M.L.; Writing—original draft preparation, T.Z. All authors have read and agreed to the published version of the manuscript.

Funding

This research was funded by National Natural Science Foundation of China (61971263), the National Key R&D Program of China (2018YFC0603604), and Institute for Precision Medicine, Tsinghua University, Beijing, China, and Biren Tech, Beijing, China.

Conflicts of Interest

The authors declare no conflict of interest.

Abbreviations

The following abbreviations are used in this manuscript:
SDMSupervised Descent Method
SPRShortest Path Ray
DoIDomain of Interest
NDENondestructive Evaluation
CTComputed Tomography
MRIMagnetic Resonance Imaging
SNRSignal to Noise Ratio
EITElectrical Impedance Tomography

References

  1. Chiao, R.Y.; Thomas, L.J. Analytic evaluation of sampled aperture ultrasonic imaging techniques for NDE. IEEE Trans. Ultrason. Ferroelectr. Freq. Control 1994, 41, 484–493. [Google Scholar] [CrossRef]
  2. Sun, H.; Zhu, J. Nondestructive evaluation of steel-concrete composite structure using high-frequency ultrasonic guided wave. Ultrasonics 2020, 103, 106096. [Google Scholar] [CrossRef]
  3. Liu, H.; Xia, H.; Zhuang, M.; Long, Z.; Liu, C.; Cui, J.; Xu, B.; Hu, Q.; Liu, Q.H. Reverse time migration of acoustic waves for imaging based defects detection for concrete and CFST structures. Mech. Syst. Signal Process. 2019, 117, 210–220. [Google Scholar] [CrossRef]
  4. Gardner, P.; Fuentes, R.; Dervilis, N.; Mineo, C.; Pierce, S.; Cross, E.; Worden, K. Machine learning at the interface of structural health monitoring and non-destructive evaluation. Philos. Trans. R. Soc. A 2020, 378, 20190581. [Google Scholar] [CrossRef] [PubMed]
  5. Ricciardi, L.; Perissinotto, A.; Dabala, M. Mechanical monitoring of fracture healing using ultrasound imaging. Clin. Orthop. Relat. Res. 1993, 293, 71–76. [Google Scholar] [CrossRef]
  6. Dong, F.; Jiang, Z.; Qiao, X.; Xu, L. Application of electrical resistance tomography to two-phase pipe flow parameters measurement. Flow Meas. Instrum. 2003, 14, 183–192. [Google Scholar] [CrossRef]
  7. Tan, C.; Li, X.; Liu, H.; Dong, F. An ultrasonic transmission/reflection tomography system for industrial multiphase flow imaging. IEEE Trans. Ind. Electron. 2019, 66, 9539–9548. [Google Scholar] [CrossRef]
  8. Yang, M.; Schlaberg, H.I.; Hoyle, B.S.; Beck, M.S.; Lenn, C. Real-time ultrasound process tomography for two-phase flow imaging using a reduced number of transducers. IEEE Trans. Ultrason. Ferroelectr. Freq. Control 1999, 46, 492–501. [Google Scholar] [CrossRef]
  9. Gonçalves, L.F.; Espinoza, J.; Romero, R.; Kusanovic, J.P.; Swope, B.; Nien, J.K.; Erez, O.; Soto, E.; Treadwell, M.C. Four-dimensional ultrasonography of the fetal heart using a novel Tomographic Ultrasound Imaging display. J. Perinat. Med. 2006, 34, 39–55. [Google Scholar] [CrossRef] [Green Version]
  10. Brekke, S.; Tegnander, E.; Torp, H.; Eik-Nes, S. Tissue Doppler gated (TDOG) dynamic three-dimensional ultrasound imaging of the fetal heart. Ultrasound Obstet. Gynecol. Off. J. Int. Soc. Ultrasound Obstet. Gynecol. 2004, 24, 192–198. [Google Scholar] [CrossRef]
  11. Papadacci, C.; Finel, V.; Villemain, O.; Tanter, M.; Pernot, M. 4D ultrafast ultrasound imaging of naturally occurring shear waves in the human heart. IEEE Trans. Med. Imaging 2020, 39, 4436–4444. [Google Scholar] [CrossRef] [PubMed]
  12. Xue, L.Y.; Jiang, Z.Y.; Fu, T.T.; Wang, Q.M.; Zhu, Y.L.; Dai, M.; Wang, W.P.; Yu, J.H.; Ding, H. Transfer learning radiomics based on multimodal ultrasound imaging for staging liver fibrosis. Eur. Radiol. 2020, 30, 2973–2983. [Google Scholar] [CrossRef] [PubMed] [Green Version]
  13. Berzigotti, A.; Castera, L. Update on ultrasound imaging of liver fibrosis. J. Hepatol. 2013, 59, 180–182. [Google Scholar] [CrossRef] [PubMed] [Green Version]
  14. Imbault, M.; Chauvet, D.; Gennisson, J.L.; Capelle, L.; Tanter, M. Intraoperative functional ultrasound imaging of human brain activity. Sci. Rep. 2017, 7, 7304. [Google Scholar] [CrossRef] [Green Version]
  15. Demene, C.; Baranger, J.; Bernal, M.; Delanoe, C.; Auvin, S.; Biran, V.; Alison, M.; Mairesse, J.; Harribaud, E.; Pernot, M.; et al. Functional ultrasound imaging of brain activity in human newborns. Sci. Transl. Med. 2017, 9, eaah6756. [Google Scholar] [CrossRef]
  16. Macé, E.; Montaldo, G.; Cohen, I.; Baulac, M.; Fink, M.; Tanter, M. Functional ultrasound imaging of the brain. Nat. Methods 2011, 8, 662–664. [Google Scholar] [CrossRef]
  17. Szabo, T.L. Diagnostic Ultrasound Imaging: Inside Out; Academic Press: Cambridge, MA, USA, 2004. [Google Scholar]
  18. Zhou, B.; Yang, X.; Zhang, X.; Curran, W.J.; Liu, T. Ultrasound elastography for lung disease assessment. IEEE Trans. Ultrason. Ferroelectr. Freq. Control. 2020, 67, 2249–2257. [Google Scholar] [CrossRef]
  19. Wang, X.; Peng, Y.; Lu, L.; Lu, Z.; Bagheri, M.; Summers, R.M. Chestx-ray8: Hospital-scale chest X-ray database and benchmarks on weakly-supervised classification and localization of common thorax diseases. In Proceedings of the IEEE Conference on Computer Vision and Pattern Recognition, Honolulu, HI, USA, 21–26 July 2017; pp. 2097–2106. [Google Scholar]
  20. Nehmeh, S.; Erdi, Y.; Pan, T.; Pevsner, A.; Rosenzweig, K.; Yorke, E.; Mageras, G.; Schoder, H.; Vernon, P.; Squire, O.; et al. Four-dimensional (4D) PET/CT imaging of the thorax: 4D PET/CT. Med. Phys. 2004, 31, 3179–3186. [Google Scholar] [CrossRef]
  21. Ates, O.F.; Taydas, O.; Dheir, H. Thorax magnetic resonance imaging findings in patients with coronavirus disease (COVID-19). Acad. Radiol. 2020, 27, 1373–1378. [Google Scholar] [CrossRef]
  22. Zhang, K.; Li, M.; Yang, F.; Xu, S.; Abubakar, A. Three-dimensional electrical impedance tomography with multiplicative regularization. IEEE Trans. Biomed. Eng. 2019, 66, 2470–2480. [Google Scholar] [CrossRef]
  23. Zhang, H.; Li, M.; Yang, F.; Xu, S.; Zhou, H.; Yang, Y.; Chen, L. A low-profile compact dual-band l-shape monopole antenna for microwave thorax monitoring. IEEE Antennas Wirel. Propag. Lett. 2020, 19, 448–452. [Google Scholar] [CrossRef]
  24. Martelius, L.; Heldt, H.; Lauerma, K. B-lines on pediatric lung sonography: Comparison with computed tomography. J. Ultrasound Med. 2016, 35, 153–157. [Google Scholar] [CrossRef] [PubMed]
  25. Mento, F.; Soldati, G.; Prediletto, R.; Demi, M.; Demi, L. Quantitative lung ultrasound spectroscopy applied to the diagnosis of pulmonary fibrosis: The first clinical study. IEEE Trans. Ultrason. Ferroelectr. Freq. Control 2020, 67, 2265–2273. [Google Scholar] [CrossRef] [PubMed]
  26. Dargent, A.; Chatelain, E.; Kreitmann, L.; Quenot, J.P.; Cour, M.; Argaud, L.; COVID-LUS Study Group. Lung ultrasound score to monitor COVID-19 pneumonia progression in patients with ARDS. PLoS ONE 2020, 15, e0236312. [Google Scholar] [CrossRef]
  27. Wang, G.; Ji, X.; Xu, Y.; Xiang, X. Lung ultrasound: A promising tool to monitor ventilator-associated pneumonia in critically ill patients. Crit. Care 2016, 20, 1–10. [Google Scholar] [CrossRef] [Green Version]
  28. Buonsenso, D.; Brancato, F.; Valentini, P.; Curatola, A.; Supino, M.; Musolino, A.M. The use of lung ultrasound to monitor the antibiotic response of community-acquired pneumonia in children: A preliminary hypothesis. J. Ultrasound Med. 2020, 39, 817–826. [Google Scholar] [CrossRef]
  29. Rueter, D.; Hauber, H.P.; Droeman, D.; Zabel, P.; Uhlig, S. Low-frequency ultrasound permeates the human thorax and lung: A novel approach to non-invasive monitoring. Ultraschall Der Med.-Eur. J. Ultrasound 2010, 31, 53–62. [Google Scholar] [CrossRef]
  30. Dai, Z.; Peng, Y.; Mansy, H.A.; Sandler, R.H.; Royston, T.J. Comparison of poroviscoelastic models for sound and vibration in the lungs. J. Vib. Acoust. 2014, 136, 050905. [Google Scholar] [CrossRef]
  31. Peng, Y.; Dai, Z.; Mansy, H.A.; Henry, B.M.; Sandler, R.H.; Balk, R.A.; Royston, T.J. Sound transmission in porcine thorax through airway insonification. Med. Biol. Eng. Comput. 2016, 54, 675–689. [Google Scholar] [CrossRef] [Green Version]
  32. Mansy, H.A.; Balk, R.A.; Warren, W.H.; Royston, T.J.; Dai, Z.; Peng, Y.; Sandler, R.H. Pneumothorax effects on pulmonary acoustic transmission. J. Appl. Physiol. 2015, 119, 250–257. [Google Scholar] [CrossRef] [Green Version]
  33. Palnitkar, H.; Henry, B.M.; Dai, Z.; Peng, Y.; Mansy, H.A.; Sandler, R.H.; Balk, R.A.; Royston, T.J. Sound transmission in human thorax through airway insonification: An experimental and computational study with diagnostic applications. Med. Biol. Eng. Comput. 2020, 58, 2239–2258. [Google Scholar] [CrossRef] [PubMed]
  34. Morenz, K.; Biller, H.; Wolfram, F.; Leonhadt, S.; Rüter, D.; Glaab, T.; Uhlig, S.; Hohlfeld, J.M. Detection of air trapping in chronic obstructive pulmonary disease by low frequency ultrasound. BMC Pulm. Med. 2012, 12, 8. [Google Scholar] [CrossRef] [PubMed]
  35. Pohlmann, A.; Sehati, S.; Young, D. Effect of changes in lung volume on acoustic transmission through the human respiratory system. Physiol. Meas. 2001, 22, 233. [Google Scholar] [CrossRef] [PubMed]
  36. Li, C.; Duric, N.; Littrup, P.; Huang, L. In vivo breast sound-speed imaging with ultrasound tomography. Ultrasound Med. Biol. 2009, 35, 1615–1628. [Google Scholar] [CrossRef] [PubMed] [Green Version]
  37. Duric, N.; Littrup, P.; Poulo, L.; Babkin, A.; Pevzner, R.; Holsapple, E.; Rama, O.; Glide, C. Detection of breast cancer with ultrasound tomography: First results with the Computed Ultrasound Risk Evaluation (CURE) prototype. Med. Phys. 2007, 34, 773–785. [Google Scholar] [CrossRef]
  38. Zhang, H.; Thurber, C.; Rowe, C. Automatic P-wave arrival detection and picking with multiscale wavelet analysis for single-component recordings. Bull. Seismol. Soc. Am. 2003, 93, 1904–1912. [Google Scholar] [CrossRef] [Green Version]
  39. Li, C.; Huang, L.; Duric, N.; Zhang, H.; Rowe, C. An improved automatic time-of-flight picker for medical ultrasound tomography. Ultrasonics 2009, 49, 61–72. [Google Scholar] [CrossRef] [Green Version]
  40. Fatemi, A.; Måsøy, S.E.; Rodriguez-Molares, A. Row–Column-Based Coherence Imaging Using a 2-D Array Transducer: A Row-Based Implementation. IEEE Trans. Ultrason. Ferroelectr. Freq. Control 2020, 67, 2303–2311. [Google Scholar] [CrossRef]
  41. Wodicka, G.R.; Stevens, K.N.; Golub, H.L.; Cravalho, E.G.; Shannon, D.C. A model of acoustic transmission in the respiratory system. IEEE Trans. Biomed. Eng. 1989, 36, 925–934. [Google Scholar] [CrossRef]
  42. Picano, E.; Pellikka, P.A. Ultrasound of extravascular lung water: A new standard for pulmonary congestion. Eur. Heart J. 2016, 37, 2097–2104. [Google Scholar] [CrossRef] [Green Version]
  43. Porcel, J.M.; Light, R.W. Pleural effusions due to pulmonary embolism. Curr. Opin. Pulm. Med. 2008, 14, 337–342. [Google Scholar] [CrossRef] [PubMed]
  44. Xiong, X.; De la Torre, F. Supervised descent method and its applications to face alignment. In Proceedings of the IEEE Conference on Computer Vision and Pattern Recognition, Portland, OR, USA, 23–28 June 2013; pp. 532–539. [Google Scholar]
  45. Guo, R.; Li, M.; Yang, F.; Xu, S.; Abubakar, A. Application of supervised descent method for 2D magnetotelluric data inversion. Geophysics 2020, 85, WA53–WA65. [Google Scholar] [CrossRef]
  46. Zhang, H.; Li, M.; Yang, F.; Xu, S.; Yin, Y.; Zhou, H.; Yang, Y.; Zeng, S.; Shao, J. A feasibility study of 2-d microwave thorax imaging based on the supervised descent method. Electronics 2021, 10, 352. [Google Scholar] [CrossRef]
  47. Zhang, K.; Guo, R.; Li, M.; Yang, F.; Xu, S.; Abubakar, A. Supervised descent learning for thoracic electrical impedance tomography. IEEE Trans. Biomed. Eng. 2020, 68, 1360–1369. [Google Scholar] [CrossRef]
  48. Lin, M.; Liu, Y. Guided Wave Tomography Based on Supervised Descent Method for Quantitative Corrosion Imaging. IEEE Trans. Ultrason. Ferroelectr. Freq. Control 2021, 68, 3624–3636. [Google Scholar] [CrossRef]
  49. Rawlinson, N.; Sambridge, M. Seismic traveltime tomography of the crust and lithosphere. Adv. Geophys. 2003, 46, 81–199. [Google Scholar]
  50. Moser, T. Shortest path calculation of seismic rays. Geophysics 1991, 56, 59–67. [Google Scholar] [CrossRef]
  51. Zhang, H.; Zhang, T.; Zhou, H.; Li, M.; Yang, F.; Xu, S.; Cao, Y. A Preliminary Experiment Based on One-step Measurement-trained Supervised Descent Method for Microwave Thorax Imaging. In Proceedings of the 2021 Photonics & Electromagnetics Research Symposium (PIERS), Hangzhou, China, 21–25 November 2021; pp. 1921–1930. [Google Scholar]
  52. Guo, R.; Li, M.; Yang, F.; Xu, S.; Abubakar, A. First arrival traveltime tomography using supervised descent learning technique. Inverse Probl. 2019, 35, 105008. [Google Scholar] [CrossRef]
  53. Tikhonov, A.N.; Arsenin, V.Y. Solutions of Ill-Posed Problems; VH Winston & Sons: New York, NY, USA, 1977. [Google Scholar]
  54. Song, X.; Li, M.; Yang, F.; Xu, S.; Abubakar, A. Feasibility study of acoustic imaging for human thorax using an acoustic contrast source inversion algorithm. J. Acoust. Soc. Am. 2018, 144, 2782–2792. [Google Scholar] [CrossRef]
  55. Song, X.; Li, M.; Yang, F.; Xu, S.; Abubakar, A. Study on joint inversion algorithm of acoustic and electromagnetic data in biomedical imaging. IEEE J. Multiscale Multiphysics Comput. Tech. 2019, 4, 2–11. [Google Scholar] [CrossRef]
  56. Hasgall, P.; Di Gennaro, F.; Baumgartner, C.; Neufeld, E.; Lloyd, B.; Gosselin, M.; Payne, D.; Klingenböck, A.; Kuster, N. IT’IS Database for Thermal and Electromagnetic Parameters of Biological Tissues, version 4.1; Elsevier: Boston, FL, USA, 2022. [Google Scholar]
  57. Treeby, B.E.; Budisky, J.; Wise, E.S.; Jaros, J.; Cox, B. Rapid calculation of acoustic fields from arbitrary continuous-wave sources. J. Acoust. Soc. Am. 2018, 143, 529–537. [Google Scholar] [CrossRef] [PubMed] [Green Version]
  58. Maeda, N. A method for reading and checking phase times in autoprocessing system of seismic wave data. Zisin 1985, 38, 365–379. [Google Scholar] [CrossRef] [Green Version]
  59. Kuhlman, J.E.; Singha, N.K. Complex disease of the pleural space: Radiographic and CT evaluation. Radiographics 1997, 17, 63–79. [Google Scholar] [CrossRef] [PubMed] [Green Version]
  60. Currie, G.P.; Alluri, R.; Christie, G.L.; Legge, J.S. Pneumothorax: An update. Postgrad. Med. J. 2007, 83, 461–465. [Google Scholar] [CrossRef] [PubMed]
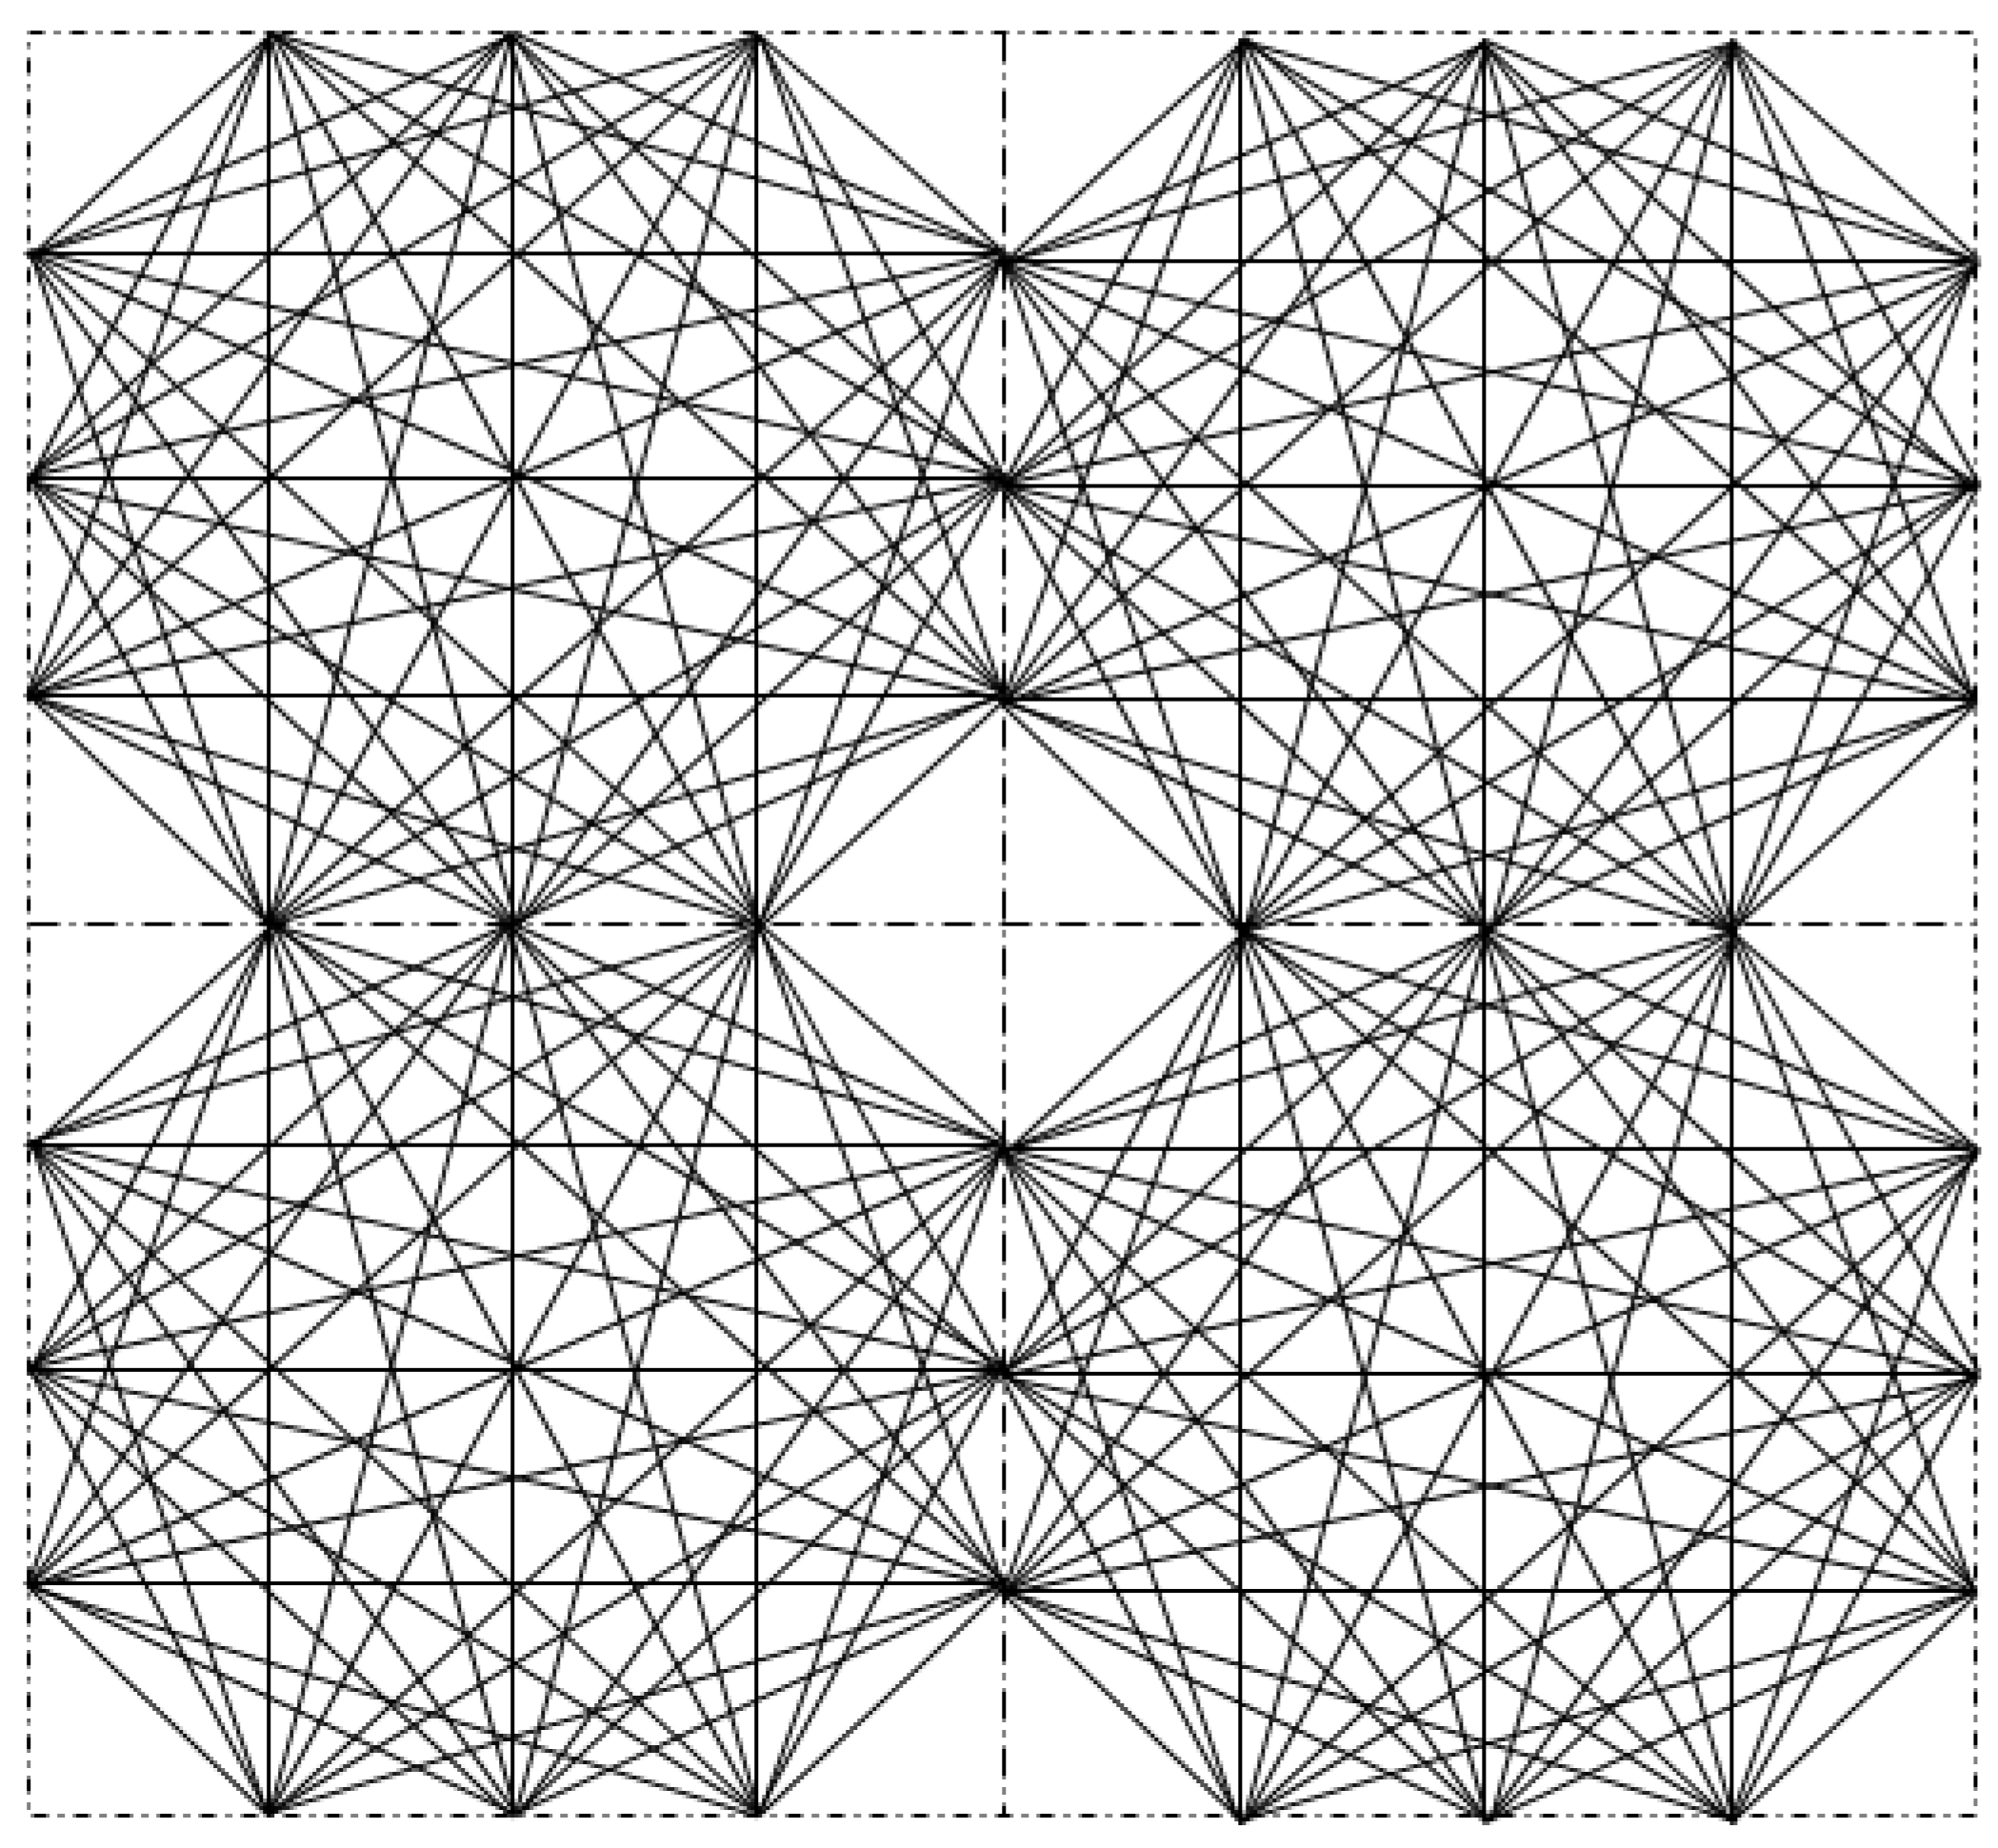
Figure 1. Example of element and possible ray path. Dashed lines: element boundaries. Solid lines: node connections.
Applsci 12 06763 g001
Figure 2. The thorax model in [55], containing lung, heart, rib, spine, etc. It is 28.5 cm in length and 19 cm in width. The blue background is set to be water. The black points around the thorax are where the transducers placed. The transducer is labeled counterclockwise and the top-middle transducer is the No. 1 transducer.
Applsci 12 06763 g002
Figure 3. (a) Computation time of the forward modeling versus n n o d e s . (b) The relative error of the traveltime data from transmitter No.6. The standard is the traveltime data obtained with n n o d e s = 7 .
Applsci 12 06763 g003
Figure 4. The distribution of 462 traveltime data. Maximum traveltime data is less than 180 μ s. The red line marks the position of the median, which is 101.58 μ s.
Applsci 12 06763 g004
Figure 5. The transmitted waveform and the received waveform from transmitter No. 9 and receiver No. 15. The blue line is the received waveform corresponding to the left blue scale. The yellow line is the transmitted waveform corresponding to the right yellow scale. The position of the marker is calculated using AIC method, which marks the waveform is received/transmitted. The difference of the two positions is the traveltime of the signal, which is 155.75 μ s.
Applsci 12 06763 g005
Figure 6. The absolute value of the traveltime data difference between SPR method with n n o d e s = 3 and k-Wave simulation. Colorbar: 0–4.5 μ s.
Applsci 12 06763 g006
Figure 7. Example of the training model. Red Block: high-velocity block (2200 m/s). Blue region: low-velocity (1500 m/s) background.
Applsci 12 06763 g007
Figure 8. The normalized model misfit versus the No. of iterations in the training stage.
Applsci 12 06763 g008
Figure 9. The inversion results of SDM inversion and Gauss–Newton inversion based on different traveltime data. (a) SDM inversion based on SPR method traveltime data, (b) Gauss–Newton inversion based on SPR method traveltime data, (c) SDM inversion based on k-Wave simulation traveltime data, (d) Gauss–Newton inversion based on k-Wave simulation traveltime data. Colorbar: 1200–2200 m/s. As a result (a), SDM takes 49.9 s to finish the inversion. As a result (b), the Gauss–Newton method takes 102.9 s.
Applsci 12 06763 g009
Figure 10. The new initial model and the resulf of SDM inversion. (a) The new initial model. (b) The result of SDM inversion. Colorbar: 1200–2200 m/s.
Applsci 12 06763 g010
Figure 11. The new transucer array and the SDM inversion results with different array and different grid. (a) The new transducer array with 40 transducers, (b) inversion result with previous array and new grid, (c) inversion result with new array and previous grid, (d) inversion result with new array and new grid. Colorbar: 1200–2200 m/s.
Applsci 12 06763 g011
Figure 12. Thorax acoustic velocity distribution of a pleural effusion patient breathing in air and a pneumothorax patient breathing out air and the corresponding reconstruction results. (a) Thorax acoustic velocity distribution of a pleural effusion patient when breathing in air. (b) Thorax acoustic velocity distribution of a pneumothorax patient when breathing out air. (c) SDM inversion result of the thorax model (a). (d) SDM inversion result of the thorax model (b). (e) Gauss–Newton inversion result of the thorax model (a). (f) Gauss–Newton inversion result of the thorax model (b). Colorbar: 1200–2200 m/s.
Applsci 12 06763 g012aApplsci 12 06763 g012b
Table 1. The acoustic velocity of primary tissues in the thorax model.
TissueAcoustic Velocity (m/s)
Heart1561
Lung (deflated)1500
Bone (cancellous)2117.5
Bone Marrow (yellow)1371.9
Publisher’s Note: MDPI stays neutral with regard to jurisdictional claims in published maps and institutional affiliations.