Abstract
Object detection plays an important role in safety monitoring, quality control, and productivity management at construction sites. Currently, the dominant method for detection is deep neural networks (DNNs), and the state-of-the-art object detectors rely on a bounding box regression (BBR) module to localize objects. However, the detection results suffer from a bounding box redundancy problem, which is caused by inaccurate BBR. In this paper, we propose an improvement of the object detection regression module for the bounding box redundancy problem. The inaccuracy of BBR in the detection results is caused by the imbalance between the hard and easy samples in the BBR process, i.e., the number of easy samples with small regression errors is much smaller than the hard samples. Therefore, the strategy of balancing hard and easy samples is introduced into the EIOU (Efficient Intersection over Union) loss and FocalL1 regression loss function, respectively, and the two are combined as the new regression loss function, namely EFocalL1-SEIOU (Efficient FocalL1-Segmented Efficient Intersection over Union) loss. Finally, the proposed EFocalL1-SEIOU loss is evaluated on four different DNN-based detectors based on the MOCS (Moving Objects in Construction Sites) dataset in construction sites. The experimental results show that the EFocalL1-SEIOU loss improves the detection ability of objects on different detectors at construction sites.
1. Introduction
In construction projects, inefficiencies are often caused by the occurrence of unknown accidents [1]. To improve productivity, the construction industry has continuously strengthened safety management and engineering supervision to reduce casualties and improve construction efficiency during construction. Taking China as an example, there were 34,600 accidents in 2021, of which 26,300 died. Construction industry casualties are consistently high across all industries, and more than half of them should have been preventable. The traditional methods of monitoring construction operations are through job sampling, personnel testing, etc. However, these methods require many human, material and financial resources [2]. Therefore, the application of modern information and communication technology is of great significance in preventing safety accidents and improving the efficiency of construction operations.
Computer vision techniques have aroused wide interest in academia and industry, such as smart glasses systems [3], automatic fire detection and notification [4], and construction worker safety inspection [5]. Many applications have been developed, such as collision risk prevention [6], ground engineering equipment activity analysis [7], safety helmet wearing detection [8], noncertified work detection [9], and construction activities identification [10]. For these applications, it is a basic requirement to accurately detect and correctly identify workers and equipment through digital images in construction sites [5,6,7,8,9,10]. However, the detectors used in previous studies [5] are mainly based on the form of hand-crafted features and sliding windows traversing the whole image; also, the algorithm runs slowly, with insufficient accuracy and without generalization.
In recent years, DNNs have shown superior performance in object detection. Compared with the previously artificially designed detectors, the detector based on DNNs realizes feature extraction by adaptive convolution, which improves the accuracy and speed of the algorithm and is more robust in object detection. The deep learning object detection method consists of three parts. First, the backbone [11,12,13,14,15] part of the network is responsible for extracting the necessary feature information from the input data. The quality of feature information extraction is crucial for subsequent object detection. The second part is the neck [16,17,18,19,20], which is followed by the backbone to better fuse and extract feature maps. The last part is the detection head, which is responsible for obtaining the object category and position from the extracted features. Deep neural network methods based on deep learning can be roughly divided into two categories. One is the regression-based one-stage method [21,22]. The other is a two-stage method [23].
Despite these different detection frameworks, BBR is a critical step in predicting rectangular boxes for localizing target objects. In terms of metrics to measure the localization of object detection, there are various loss functions for object detection, such as focal loss [24], class-balanced loss [25], balanced loss for classification and BBR [26], and gradient flow balancing loss [27]. Nevertheless, rectangular BBR loss is still the most popular loss function approach.
The loss functions are evolving through continuous innovation. Initially, L1 loss was used, but it is difficult to converge when the error is small in the later stages of training. The derivative of L2 loss used in R-CNN (regional convolutional neural network) [28] and SPP-Net (spatial pyramid pooling network) [29] is , but it is unstable against outliers. SmoothL1 loss [30] combines L1 loss and L2 loss to perfectly avoid their drawbacks and is applied in Fast R-CNN [30] and Faster R-CNN [23] but does not have scale invariance. YOLOv1 (You Only Look Once) [31] proposed that the square root of the difference of a bounding box can alleviate the scale sensitivity of the loss function. The loss used in YOLOv3 [22] also reduces the effect of scale on regression accuracy. The Dynamic SmoothL1 loss in Dynamic R-CNN [32] dynamically controls the shape of the loss function, thus gradually focusing on high-quality anchor boxes. BalancedL1 loss in Libra R-CNN [26] similarly focuses on increasing the weight of the easy sample gradient but does not control the gradient of outliers. FocalL1 [33] increases the gradient for high-quality samples and decreases the gradient for low-quality samples. However, any example of better regression will directly improve the quality of the final predicted boxes and should not overly suppress the contribution of low-quality samples. However, the -norm losses do not pay attention to the intrinsic connection in the four variables , and for this problem, IOU (Intersection over Union) [34] loss was proposed and achieved excellent results. Since then, GIOU (Generalized IOU) [35], DIOU (Distance IOU) [36], CIOU (Complete IOU) [36], and EIOU (Efficient IOU) [33] have been proposed to address the weaknesses of the IOU loss function for specific problems, resulting in faster convergence and better performance. PIOU (Pixels-IOU) [37] added angles to assist the IOU loss function. Alpha-IOU [38] is an existing uniform idempotent based on the IOU loss. The above research proves the importance of the loss function in the regression process of object detection. However, the current research on the loss function still has some shortcomings, and the detector based on anchors generally has a problem of imbalance between hard and easy samples.
Currently, object detection algorithms ensure that moving objects on construction sites can be detected by detectors. However, the bounding box redundancy problem in object detection is shown in Figure 1, especially for objects with large stretches. The reason for the redundant bounding box problem is the imbalance in the number of hard and easy samples in the regression process. Therefore, the hard-to-regress samples in the existing regression modules provide a larger contribution, resulting in bounding box redundancy. The hard-versus-easy sample balance strategy can improve the easy sample regression contribution and reduce the hard sample regression contribution. To this end, we address this problem by incorporating a hard–easy sample balancing strategy into the BBR module.
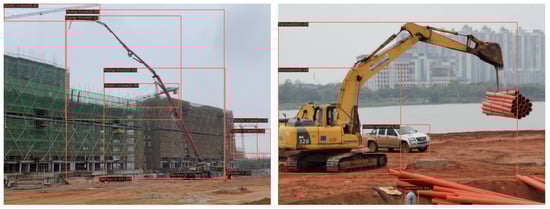
Figure 1.
Bounding box redundancy problem for object detection at a construction site.
In this paper, we propose a loss function for the object detection BBR module, which adopts a hard-versus-easy sample regression strategy. The design is based on the bounding box redundancy problem, and the regression module is studied to improve the accuracy of object detection. The proposed loss functions include three types: (1) A Segmented Efficient IOU (SEIOU) loss function is proposed, which uses a piecewise function to perform piecewise regression on the penalty term of the loss function. (2) A regression loss function focusing on the balance of hard and easy samples is designed to change the contribution of hard and easy samples in the model optimization process to improve the model accuracy. (3) Finally, the two methods are combined into a new BBR loss function EfocalL1-SEIOU loss to achieve more accurate object detection. The evaluation on several advanced object detection models, including Faster R-CNN [23], Mask R-CNN [39], Cascade R-CNN [40], and YOLOF [41], uses the construction site dataset MOCS (Moving Objects in Construction Sites) [42]. The results show that an improvement in the accuracy of significance is achieved, which illustrates the generalizability of this proposed loss function.
The contributions of this paper can be summarized as follows:
- Considering the redundancy problem of bounding boxes in the construction site, it is caused by the imbalance of hard and easy samples in the BBR process. The strategy of balancing hard and easy samples is introduced into the IOU-based loss to help the BBR as much as possible by segmenting the hard and easy samples.
- The strategy of balancing hard and easy samples is also introduced into the -norm loss by controlling the regression gradient to obtain better regression results.
- Compared with the previous object detection loss function, this loss function introduces the hard-versus-easy sample balancing strategy and combines the IOU-based loss and the -norm loss as a new loss function to obtain better performance.
The remainder of the paper is organized as follows. Section 2 introduces the recent literature on the hard-versus-easy sample balance problem and object detection in construction sites. In Section 3, we describe the limitations of IOU-based losses and the generation and analysis of SEIOU, EfocalL1 loss, and EfocalL1-SEIOU. In Section 4, we evaluate the performance of EfocalL1-SEIOU loss on four different advanced object detectors and perform some ablation experiments. In Section 5, we describe the limitations and discussion. In Section 6, we draw some conclusions.
2. Related Work
In this section, we briefly survey the related work of the problem of the imbalance of hard and easy samples and object detection in construction sites.
2.1. Imbalance of Hard and Easy Sample
There are two common problems with anchor-based detectors: positive and negative sample imbalance and hard and easy sample imbalance. Easy samples are samples with small loss. Hard samples are samples with large loss. For classification problems, the two above are included. For the regression problem, only the hard and easy sample imbalance problems are included.
For the classification problem, OHEM (Online Hard Example Mining) [43] considers that there are many simple negative samples; thus, the hard negative samples should be mined. However, OHEM is sensitive to noise. In Focal loss [24], the contribution of positive samples is increased, and the contribution of negative samples is decreased. Since GHM (Gradient Harmonizing Mechanism) [27] considers hard samples to be outliers, it reduces the weight of hard samples. For regression problems, GHM decreases the hard sample weight because it considers hard samples as outliers. However, it does not reduce the easy sample weight, because any example of better regression will directly improve the quality of the final predicted boxes. Both BalancedL1 loss [26] and FocalL1 loss [33] emphasize improving the gradient of the easy sample gradient, while the latter also reduces the hard sample gradient. However, compared to the SmoothL1 loss [30], the easy sample gradient does not increase significantly, while the hard sample gradient decreases significantly.
2.2. Object Detection in Construction Sites
Compared to general object detection, few research has been made on object detection in construction sites. Roberts et al. performed object detection for cranes to monitor crane-related safety hazards [44]. Kim et al. used YOLOv3 to detect workers and heavy machinery to prevent being attacked by hazards [6]. Roberts et al. trained a DNN-based detector on an advanced infrastructure management dataset [45] containing heavy machinery for five different types of construction work to analyze the productivity of excavators and trucks [7]. As the collected datasets tend to be small in size, the generalization performance of the algorithms is reduced. With the generation of large-scale datasets, a simple approach is to directly apply mainstream object detection algorithms to datasets under construction sites to improve detection accuracy and thus carry out various applications.
3. Materials and Methods
3.1. Experiments Details
3.1.1. Dataset and Evaluation Metric
The current dataset suitable for DNNs is MOCS [42], which contains 174 construction sites covering various projects. The dataset of moving objects in construction sites contains 41,668 images in 13 categories. A benchmark containing different DNN-based detectors was made using the MOCS dataset. The results show that all the trained detectors can detect the objects on the construction site.
Construction site images have more semantic information and complex texture information; thus, we conducted simulated experiments with the MOCS dataset to investigate the advantages of SEIOU and EfocalL1 loss and the importance of the balance between hard and easy samples, respectively. We present the experimental results of object detection with the dataset MOCS in construction sites. We use the MOCS training set for training and show the ablation studies of the MOCS validation set. COCO-style Average Precision (AP) is chosen as the evaluation index.
3.1.2. Implementation Details
For fair comparisons, all experiments are implemented with PyTorch [46]. The backbones used in the experiments are publicly available. For all experiments on the MOCS dataset, we use ResNet-50 backbone and run 12 epochs. We train detectors with a GPU (2 images per GPU), adopting the stochastic gradient descent (SGD) optimizer. The default weight of BBR is set to 1 based on -norm losses and 10 for IOU-based losses.
3.1.3. Network Architecture
There are roughly two types of deep learning object detection network architectures. One is a two-stage method based on region proposal, which performs two classifications and regressions, as shown in Figure 2. First, the candidate regions are generated and screened, the features of the region of interest (ROI) in the image are obtained, and then, the neural network is trained for classification. Another class of regression-based one-stage methods regresses the target in a single convolutional neural network, as shown in Figure 3. Despite the different detection frameworks, BBR is a critical step in locating target objects. As shown in the figure, the red dotted box in the two architecture diagrams is the placement of our proposed regression loss function.
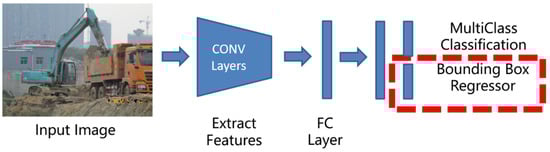
Figure 2.
Network architecture of a one-stage detector.
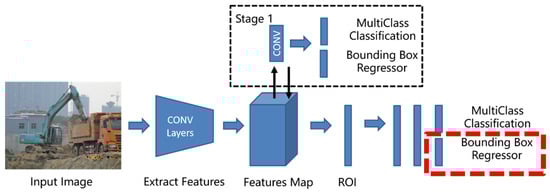
Figure 3.
Network architecture of a two-stage detector.
3.2. Limitations of IOU-Based Losses
In this subsection, we analyze the flaws of four IOU-based loss functions, i.e., the IOU [34], GIOU [35], CIOU [36], and EIOU [33] loss.
3.2.1. Limitations of IOU Loss
The IOU loss [34] for measuring similarity between two bounding boxes , is attained by:
which has some good properties, such as symmetry and scale insensitivity. However, it cannot reflect the closeness of and . Therefore, the direction of gradient descent cannot be provided for optimization. Second, the IOU loss does not reflect how the two boxes intersect, i.e., how good the overlap is.
3.2.2. Limitations of Generalized IOU Loss
To solve the drawback of IOU loss when the boxes overlap, GIOU [35] is proposed as follows.
is the closure of and . GIOU mitigates the problem of gradient disappearance in the non-overlapping case by penalizing the term and reflects the goodness of the overlap of the two boxes. However, in order to reduce the loss function, the regression process will first choose the optimized penalty term to reduce the closure and then choose the optimized IOU term. There is a problem that the area of the prediction frame is mistakenly increased.
3.2.3. Limitations of Complete IOU Loss
To solve the problem of incorrectly increasing the area of the predicted box, CIOU [36] is proposed as in Equation (3).
where is the Euclidean distance between the centroids of the two boxes, and is the diagonal of the closure of and . is used to measure the width-to-height ratio, and is the equilibrium factor. and are the width and height of the two boxes. CIOU loss adds a scaling coefficient penalty term to solve the problem of incorrectly increasing the area of the prediction box. However, there are still problems with the scale factor introduced by the CIOU loss. Width and height cannot be increased and decreased at the same time during the optimization process.
3.2.4. Limitations of Efficient IOU Loss
To solve the problem of optimizing the penalty term in aspect ratio, EIOU [33] is proposed for any two bounding boxes and , as in Equation (6).
is the diagonal of the closure of and , and are the width and height of the closure. EIOU proposes to optimize the width and height of the box, respectively. When the two bounding boxes keep approaching, the parallel set will keep decreasing. To make the loss decrease, the closure should keep increasing, which is contradictory.
3.3. EfocalL1-SEIOU Loss for BBR
As mentioned in FocalL1 loss [33], the problem of hard and easy sample imbalance also exists in the BBR problem. That is, the number of high-quality and easily regressive bounding boxes with small regression loss is far less than that of low-quality and hard-to-regress bounding boxes with large regression loss. In this subsection, we first propose SEIOU, and then, we propose EfocaL1 loss based on FocalL1 loss. In addition, we combine EfocalL1 loss with SEIOU to improve the performance of the BBR loss function.
3.3.1. Segmented Efficient Intersection over Union Loss
In this method, the hard–easy sample balance strategy is introduced into the EIOU by segmenting the loss function. As shown in Figure 4, green is the EIOU method, and both red and green are our method. For any two bounding boxes and defined as follows:
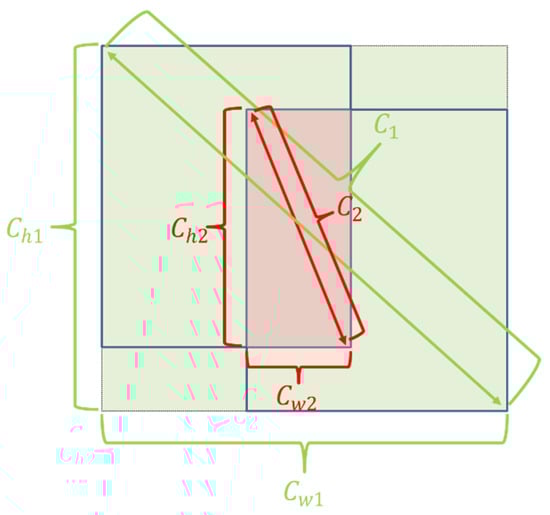
Figure 4.
Differences between EIOU (green) and our method (both green and red).
is the diagonal of the closure of and , and are the width and height of the closure. is the diagonal of the intersection, and are the width and height of the intersection. Similar to the definition of IOU-based losses, is used as the cut-off point to divide the samples with regression loss greater than 0.5 as easy samples, and those with regression loss less than 0.5 as hard samples. Among them, the intersection is used as the denominator of penalty terms for easy regression samples. As the predicted box keeps getting closer to the target box, the intersection keeps increasing, and the loss function keeps decreasing, which is the direction we expect. For the hard regression samples, we still use the closure as the denominator of the penalty term. When the two boxes keep getting closer, the closure is decreasing and the loss function is changing erratically. Therefore, the loss function regression is focused on the easy regression samples. This ensures the speed and accuracy of EIOU loss convergence while focusing more on the regression effect of high-quality bounding boxes, which makes the regression better.
3.3.2. Efficient FocalL1 Loss
The FocalL1 loss [33] emphasizes increasing the gradient of the easy sample regression and decreasing the gradient of the hard sample at the same time. However, compared with BalancedL1 loss [26], the effect of increasing the easy sample gradient is slightly less, but the hard sample gradient is reduced substantially. The outliers are harmful to the training, but the hard samples in the initial training are not necessarily outliers. It is mentioned in GHM [27] that better prediction of any example in the regression problem will directly improve the quality of the final bounding box. Therefore, it is crucial to increase the easy sample gradient and decrease the hard sample gradient appropriately. In this method, by increasing the gradient of easy samples and reducing the gradient of hard samples, the balance strategy of hard and easy samples is introduced into the loss FocalL1 loss.
Similar to the definition of -norm losses, is used as the dividing point, the samples with regression loss less than 1 are divided into easy samples, and the samples with regression loss greater than 1 are divided into hard samples. According to the idea that the gradient value increases relatively in the area with small error and decreases relatively in the area with large error, we design a function curve of the BBR gradient magnitude. As β increases, the gradient of hard samples will be further suppressed, and the gradient of the easy samples will be further suppressed, as shown in Figure 5a, which is not what we expect. Therefore, the change in the gradient of the easy sample is controlled by the parameter α. As α increases, the gradient of easy samples will further increase, as shown in Figure 5b. The final gradient loss function is written in the following form.
where is the difference between the predicted box and the target box.
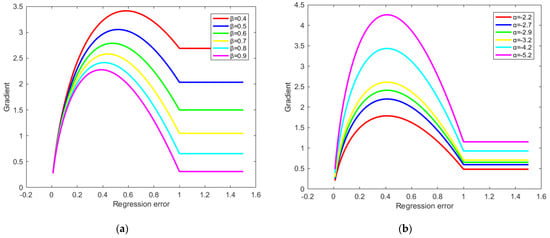
Figure 5.
Possible gradient curves: (a) use β to control curve shape; (b) use α to control curve shape.
By integrating the gradient formulation above, we can obtain the EfocalL1 loss for BBR,
where is a constant value. To ensure that in Equation (9) is continuous at , we have . As shown in Figure 6, the easy sample contribution can be increased substantially while the hard sample contribution can be decreased.
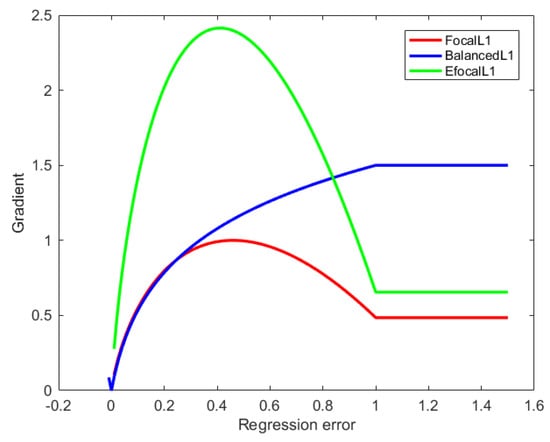
Figure 6.
Curves for the gradient of FocalL1 loss, BalancedL1 loss, and our EFocalL1 loss for BBR.
3.3.3. EfocalL1-SEIOU Loss
In this method, to combine the advantages of the two types of loss functions, the two types of loss functions are nested. To enable the SEIOU loss regression process to increase the easy sample regression gradient and relatively decrease the hard sample regression gradient, one can naturally consider replacing in Equation (9) with the SEIOU loss. However, we observe that the above combination does not work well. As approaches zero, approaches zero, and therefore, the global gradient also approaches zero, i.e., the weight influence of samples with a small loss of is weakened. To tackle this problem, we use the value of IOU to reweight the SEIOU loss and obtain high regression accuracy by paying more attention to the high IOU target. We obtain EfocalL1-SEIOU loss as follows.
γ is a parameter to control the degree of inhibition of outliers.
4. Results
4.1. Ablation Studies on SEIOU Loss
We first conducted experiments with the IOU, GIOU, CIOU, EIOU, and SEIOU losses in Table 1. Bounding box loss weights control the balance between classification loss and regression loss in object detection, and we set the weight for BBR to 10.0 for fair comparisons. In addition, we chose as the segmentation because it is mentioned in the review [47] that as the false positives. We also verified the segmentation point, as shown in Figure 7a; the performance of IOU at is maintained at 0.479. When the segmentation points are taken less at than 0.3 or more than 0.5, the performance decreases; thus, the segmentation point is set to . The experimental results show that for other IOU-based losses, the method has better performance.

Table 1.
Overall ablation studies on MOCS.
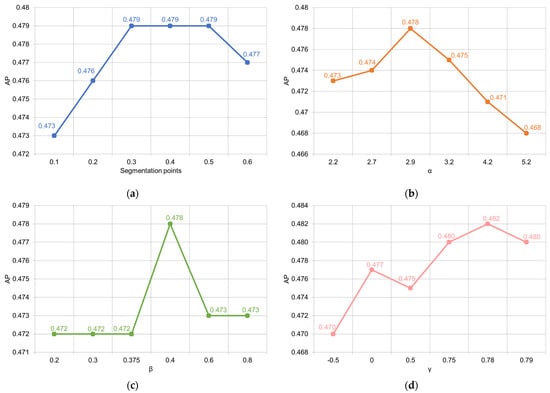
Figure 7.
Performance of methods with different value of parameters. (a) SEIOU loss with different segmentation points; (b) EfocalL1 loss with different α; (c) EfocalL1 loss with different β; (d) EfocalL1-SEIOU loss with different γ.
4.2. Ablation Studies on EfocalL1 Loss
As shown in Figure 7b,c, we test the EfocalL1 loss for different α and β. Setting a smaller α further increases the gradient of the easy samples, and setting a larger β further suppresses the gradient of the hard samples. Finally, we find that the optimal equilibrium AP value is 0.478 when and , which is 0.9 higher than the FocalL1 loss [33]. We also compare the previous work BalancedL1 loss [26], which improved the AP by 0.5. These experimental results show that the EfocalL1 loss makes the model perform better.
4.3. Ablation Studies on EfocalL1-SEIOU Loss
To illustrate the improvements brought by the different parameters for reweighting the SEIOU loss, we compare the results of the different adjustments here. We first find that replacing in Equation (9) with SEIOU leads to a reduction in the gradient of the easy samples and therefore does not improve the performance of this loss function. Then, we weight the EfocalL1 loss by IOU to obtain the EfocalL1-SEIOU loss. As shown in Figure 7d, we can obtain an improvement in performance. As γ increases, the performance of the loss function first increases and then decreases. We cannot suppress the gradient of hard samples extremely because the validity of hard samples still exists in the BBR process. We find that the best results are achieved when setting and using it as the default value for subsequent experiments.
4.4. Overall Ablation Studies
To demonstrate the effectiveness of each method, we performed overall ablation studies, as shown in Table 2. The SEIOU loss improved AP from 0.472 to 0.479 compared to the EIOU loss, and the EfocalL1 loss compared to the FocalL1 loss improved the AP by 0.9. Applying the SEIOU loss as x directly to Equation (9) is not satisfactory. The EfocalL1-SEIOU loss of Equation (10) is reasonable, improving the AP of baseline by 2.4. The visual effect is shown in Figure 8, where the first column is the original image, the second column is the result of Faster R-CNN using baseline, and the third column is the effect of Faster R-CNN using EfocalL1-SEIOU loss. From the comparison, our method can reduce the redundancy of bounding box in construction sites, which verifies the effectiveness of the EfocalL1-SEIOU loss function.
Table 2.
Ablation studies of the EfocalL1 loss on MOCS.
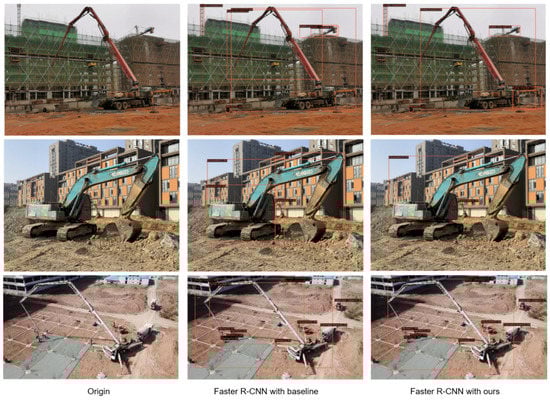
Figure 8.
Comparison chart of object detection results.
4.5. Incorporations with State-of-the-Arts
In this subsection, we evaluate the EfocalL1-SEIOU loss by incorporating it into popular object detectors, including Mask R-CNN [39], Cascade R-CNN [40], and YOLOF [41]. Figure 9 shows the AP trends of the baselines of the corresponding detectors compared to our method during training. Our method significantly outperforms the corresponding baseline when the network finally converges stably. The results in Table 3 show that training these models by the EfocalL1-SEIOU loss can consistently improve their performance compared to their own regression losses. Compared to other models, the improvements of Mask R-CNN and Cascade R-CNN are relatively small. There are two reasons for this. First, Mask R-CNN and Cascade R-CNN are both based on -norm loss with carefully adjusted parameters. These parameters may not apply to the proposed EfocalL1-SEIOU loss. Second, both Mask R-CNN and Cascade R-CNN have the process of adjusting the weighting for the respective losses. Mask loss is added in Mask R-CNN correspondingly, and iterative BBR is used in Cascade R-CNN. Although these adjustment weighting methods limit the effect brought by EfocalL1-SEIOU loss, they confirm the necessity of hard and easy sample balancing. In addition, the improved effect in YOLOF illustrates that there is also more room for improvement in the one-stage network for the hard and easy sample imbalance problem.
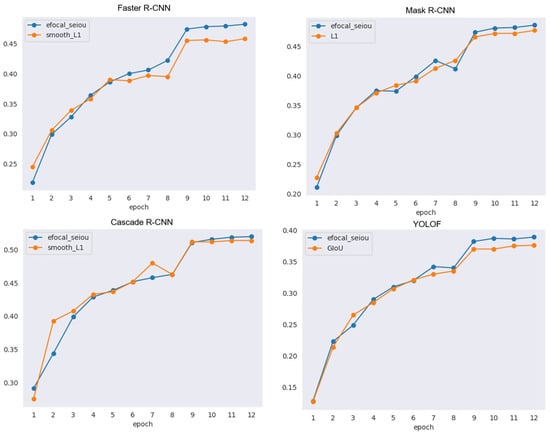
Figure 9.
Comparison chart of AP trend.
Table 3.
The performance when incorporating the EfocalL1-SEIOU loss with different SOTA models.
5. Limitation and Discussion
Despite the above achievements, the proposed loss function still suffers from certain shortcomings. Regarding the detection of workers, since there is often large equipment on construction sites, the pixel value of workers with large equipment accounts for a smaller proportion; thus, it is often missed, as shown in Figure 8. These limitations mainly focus on images obtained from surveillance perspectives at the height of the building. In addition, when there is a high degree of overlap between workers or machines on a construction site, there is still a problem of bounding box redundancy. Therefore, there is still some room for improvement in the detection effect. To this end, for the problem of unbalanced hard and easy samples, we hope to explore bounding box evaluation metrics that apply the hard and easy sample balance strategy to apply to the classification loss function, positive and negative sample allocation, and non-maximum suppression modules.
6. Conclusions
In this paper, we analyzed the bounding box redundancy problem of object detection in construction sites and found that there is still some room for improvement in the loss function of the regression module by introducing a balanced strategy of hard and easy samples. First, the existing loss functions all have certain defects that hinder the direction of the BBR. Second, the existing studies ignore the importance of hard and easy sample balance. As a result, the gradient of hard sample regression is too large, which limits the performance of BBR. Based on the above two problems, we propose the EfocalL1-SEIOU loss to address the shortcomings of the existing loss function and balance the gradient of the hard and easy sample regression. Extensive experiments on the MOCS dataset show that EfocalL1-SEIOU loss brings some improvements on many advanced object detectors, solves practical problems, and can be applied to various applications. In the future, we hope to design a low-light enhancement module and its loss function to perform low-light target detection tasks for building operation behaviors in scenes such as nighttime and tunnels.
Author Contributions
Conceptualization, X.W. and H.W.; methodology, X.W. and C.Z.; software, H.W.; validation, X.W., H.W. and C.Z.; investigation, X.W.; resources, Q.H.; data curation, Q.H. and L.H.; writing—original draft preparation, X.W.; writing—review and editing, X.W. and H.W.; visualization, X.W., C.Z. and L.H.; supervision, C.Z. and Q.H.; project administration, X.W. and H.W. All authors have read and agreed to the published version of the manuscript.
Funding
This research was funded by the National Natural Science Foundation of China (no. 62072024 and 41971396), the Projects of Beijing Advanced Innovation Center for Future Urban Design (no. UDC2019033324 and UDC2017033322), R&D Program of Beijing Municipal Education Commission (KM202210016002), and the Fundamental Research Funds for Municipal Universities of Beijing University of Civil Engineering and Architecture (no. X20084 and ZF17061).
Institutional Review Board Statement
Not applicable.
Informed Consent Statement
Not applicable.
Data Availability Statement
The dataset generated and analyzed during the current study can be obtained at http://www.anlab340.com/Archives/IndexArctype/index/t_id/17.html (accessed on 30 November 2020).
Acknowledgments
The authors are thankful to all the personnel who either provided technical support or helped with data collection. We also acknowledge all the reviewers for their useful comments and suggestions.
Conflicts of Interest
The authors declare no conflict of interest.
References
- Sacks, R.; Radosavljevic, M.; Barak, R. Requirements for building information modeling based lean production management systems for construction. Autom. Constr. 2010, 19, 641–655. [Google Scholar] [CrossRef] [Green Version]
- Su, Y.Y.; Liu, L.Y. Real-time tracking and analysis of construction operations. In Proceedings of the 2007 ASCE/CIB Construction Research Congress, Grand Bahama Island, Bahamas, 6–8 May 2007. [Google Scholar]
- Mukhiddinov, M.; Cho, J. Smart Glass System Using Deep Learning for the Blind and Visually Impaired. Electronics 2021, 10, 2756. [Google Scholar] [CrossRef]
- Mukhiddinov, M.; Abdusalomov, A.B.; Cho, J. Automatic Fire Detection and Notification System Based on Improved YOLOv4 for the Blind and Visually Impaired. Sensors 2022, 22, 3307. [Google Scholar] [CrossRef] [PubMed]
- Park, M.W.; Elsafty, N.; Zhu, Z.H. Hardhat-wearing detection for enhancing on-site safety of construction workers. J. Constr. Eng. Manag. 2015, 141, 04015024. [Google Scholar] [CrossRef]
- Kim, D.; Liu, M.Y.; Lee, S.H.; Kamat, V.R. Remote proximity monitoring between mobile construction resources using camera-mounted UAVs. Autom. Constr. 2019, 99, 168–182. [Google Scholar] [CrossRef]
- Roberts, D.; Golparvar-Fard, M. End-to-end vision-based detection, tracking and activity analysis of earthmoving equipment filmed at ground level. Autom. Constr. 2019, 105, 102811. [Google Scholar] [CrossRef]
- Fang, Q.; Li, H.; Luo, X.C.; Ding, L.Y.; Luo, H.B.; Rose, T.M.; An, W.P. Detecting non-hardhat-use by a deep learning method from far-field surveillance videos. Autom. Constr. 2018, 85, 1–9. [Google Scholar] [CrossRef]
- Fang, Q.; Li, H.; Luo, X.C.; Ding, L.Y.; Rose, T.M.; An, W.P.; Yu, Y.T. A deep learning-based method for detecting non-certified work on construction sites. Adv. Eng. Inform. 2018, 35, 56–68. [Google Scholar] [CrossRef]
- Luo, X.C.; Li, H.; Cao, D.P.; Dai, F.; Seo, J.; Lee, S.H. Recognizing diverse construction activities in site images via relevance networks of construction-related objects detected by convolutional neural networks. J. Comput. Civ. Eng. 2018, 32, 04018012. [Google Scholar] [CrossRef]
- Krizhevsky, A.; Sutskever, I.; Hinton, G.E. Imagenet classification with deep convolutional neural networks. NeurIPS 2012, 25, 1106–1114. [Google Scholar] [CrossRef]
- Sermanet, P.; Eigen, D.; Zhang, X.; Mathieu, M.; Fergus, R.; LeCun, Y. Overfeat: Integrated recognition, localization and detection using convolutional networks. arXiv 2013, arXiv:1312.6229. [Google Scholar]
- Szegedy, C.; Liu, W.; Jia, Y.; Sermanet, P.; Reed, S.; Anguelov, D.; Erhan, D.; Vanhoucke, V.; Rabinovich, A. Going deeper with convolutions. In Proceedings of the IEEE Conference on Computer Vision and Pattern Recognition, Boston, MA, USA, 7 June 2015; pp. 1–9. [Google Scholar]
- Simonyan, K.; Zisserman, A. Very deep convolutional networks for large-scale image recognition. arXiv 2014, arXiv:1409.1556. [Google Scholar]
- He, K.; Zhang, X.; Ren, S.; Sun, J. Deep residual learning for image recognition. In Proceedings of the IEEE Conference on Computer Vision and Pattern Recognition, Las Vegas, NV, USA, 26–30 June 2016; pp. 770–778. [Google Scholar]
- Lin, T.Y.; Dollár, P.; Girshick, R.; He, K.; Hariharan, B.; Belongie, S. Feature pyramid networks for object detection. In Proceedings of the IEEE Conference on Computer vision and Pattern Recognition, Honolulu, HI, USA, 16–21 July 2017; pp. 2117–2125. [Google Scholar]
- Liu, S.; Qi, L.; Qin, H.; Shi, J.; Jia, J. Path aggregation network for instance segmentation. In Proceedings of the IEEE Conference on Computer Vision and Pattern Recognition, Salt Lake City, UT, USA, 18–23 June 2018; pp. 8759–8768. [Google Scholar]
- Guo, C.; Fan, B.; Zhang, Q.; Xiang, S.; Pan, C. Augfpn: Improving multi-scale feature learning for object detection. In Proceedings of the IEEE/CVF Conference on Computer Vision and Pattern Recognition, Seattle, WA, USA, 13–19 June 2020; pp. 12595–12604. [Google Scholar]
- Ghiasi, G.; Lin, T.Y.; Le, Q.V. Nas-fpn: Learning scalable feature pyramid architecture for object detection. In Proceedings of the IEEE/CVF Conference on Computer Vision and Pattern Recognition, Long Beach, CA, USA, 15–21 June 2019; pp. 7036–7045. [Google Scholar]
- Xu, H.; Yao, L.; Zhang, W.; Liang, X.; Li, Z. Auto-fpn: Automatic network architecture adaptation for object detection beyond classification. In Proceedings of the IEEE/CVF International Conference on Computer Vision, Seoul, Korea, 27 October–3 November 2019; pp. 6649–6658. [Google Scholar]
- Liu, W.; Anguelov, D.; Erhan, D.; Szegedy, C.; Reed, S.; Fu, C.Y.; Berg, A.C. Ssd: Single shot multibox detector. In Proceedings of the European Conference on Computervision, Amsterdam, The Netherlands, 8–16 October 2016; pp. 21–37. [Google Scholar]
- Redmon, J.; Farhadi, A. Yolov3: An incremental improvement. arXiv 2018, arXiv:1804.02767. [Google Scholar]
- Ren, S.Q.; He, K.M.; Girshick, R.; Sun, J. Faster R-CNN: Towards real-time object detection with region proposal networks. In Proceedings of the Advances in Neural Information Processing Systems, Montreal, QC, Canada, 7–12 December 2015; pp. 91–99. [Google Scholar]
- Lin, T.Y.; Goyal, P.; Girshick, R.; He, K.M.; Dollár, P. Focal loss for dense object detection. In Proceedings of the IEEE International Conference on Computer Vision, Shenzhen, China, 22–29 October 2017; pp. 2999–3007. [Google Scholar]
- Cui, Y.; Jia, M.; Lin, T.Y.; Song, Y.; Belongie, S. Class balanced loss based on effective number of samples. In Proceedings of the IEEE/CVF Conference on Computer Vision and Pattern Recognition, Long Beach, CA, USA, 15–21 June 2019; pp. 9260–9269. [Google Scholar]
- Pang, J.M.; Chen, K.; Shi, J.P.; Feng, H.J.; Ouyang, W.L.; Lin, D.H. Libra R-CNN: Towards balanced learning for object detection. In Proceedings of the IEEE/CVF Conference on Computer Vision and Pattern Recognition, Long Beach, CA, USA, 15–21 June 2019; pp. 821–830. [Google Scholar]
- Li, B.; Liu, Y.; Wang, X. Gradient harmonized single-stage detector. In Proceedings of the AAAI Conference on Artificial Intelligence, Honolulu, HI, USA, 24 January–1 February 2019; Volume 33, pp. 8577–8584. [Google Scholar]
- Girshick, R.; Donahue, J.; Darrell, T.; Malik, J. Rich feature hierarchies for accurate object detection and semantic segmentation. In Proceedings of the IEEE Conference on Computer Vision and Pattern Recognition, Columbus, OH, USA, 23–28 June 2014; pp. 580–587. [Google Scholar]
- He, K.M.; Zhang, X.Y.; Ren, S.Q.; Sun, J. Spatial pyramid pooling in deep convolutional networks for visual recognition. IEEE Trans. Pattern Anal. Mach. Intell. 2015, 37, 1904–1916. [Google Scholar] [CrossRef] [PubMed] [Green Version]
- Girshick, R. Fast R-CNN. In Proceedings of the IEEE International Conference on Computer Vision, Santiago, Chile, 13–16 December 2015; pp. 1440–1448. [Google Scholar]
- Redmon, J.; Divvala, S.; Girshick, R.; Farhadi, A. You only look once: Unified, real-time object detection. In Proceedings of the IEEE Conference on Computer Vision and Pattern Recognition, Las Vegas, NV, USA, 26–30 June 2016; pp. 779–788. [Google Scholar]
- Zhang, H.K.; Chang, H.; Ma, B.P.; Wang, N.Y.; Chen, X.L. Dynamic R-CNN: Towards high quality object detection via dy-namic training. In European Conference on Computer Vision; Springer: Cham, Switzerland, 2020; pp. 260–275. [Google Scholar]
- Zhang, Y.F.; Ren, W.Q.; Zhang, Z.; Jia, Z.; Wang, L.; Tan, T.N. Focal and efficient IOU loss for accurate bounding box regression. arXiv 2021, arXiv:2101.08158. [Google Scholar]
- Yu, J.H.; Jiang, Y.N.; Wang, Z.Y.; Cao, Z.M.; Huang, T. Unitbox: An advanced object detection network. In Proceedings of the 24th ACM International Conference on Multimedia, New York, NY, USA, 15–19 October 2016; pp. 516–520. [Google Scholar]
- Rezatofighi, H.; Tsoi, N.; Gwak, J.Y.; Sadeghian, A.; Reid, I.; Savarese, S. Generalized intersection over union: A metric and a loss for bounding box regression. In Proceedings of the IEEE/CVF Conference on Computer Vision and Pattern Recognition, Long Beach, CA, USA, 15–20 June 2019; pp. 658–666. [Google Scholar]
- Zheng, Z.H.; Wang, P.; Liu, W.; Li, J.Z.; Ye, R.G.; Ren, D.W. Distance-iou loss: Faster and better learning for bounding box regression. In Proceedings of the AAAI Conference on Artificial Intelligence, New York, NY, USA, 7–16 February 2020; pp. 12993–13000. [Google Scholar]
- Chen, Z.M.; Chen, K.A.; Lin, W.Y.; See, J.; Yu, H.; Ke, Y.; Yang, C. Piou loss: Towards accurate oriented object detection in complex environments. In European Conference on Computer Vision; Springer: Cham, Switzerland, 2020; pp. 195–211. [Google Scholar]
- He, J.B.; Erfani, S.; Ma, X.J.; Bailey, J.; Chi, Y.; Hua, X.S. Alpha-IoU: A Family of Power Intersection over Union Losses for Bounding Box Regression. Proc. Adv. Neural Inf. Process. Syst. 2021, 34, 20230–20242. [Google Scholar]
- He, K.M.; Gkioxari, G.; Dollár, P.; Girshick, R. Mask R-CNN. In Proceedings of the IEEE International Conference on Computer Vision, Shenzhen, China, 22–29 October 2017; pp. 2980–2988. [Google Scholar]
- Cai, Z.W.; Vasconcelos, N. Cascade R-CNN: Delving into high quality object detection. In Proceedings of the IEEE Conference on Computer Vision and Pattern Recognition, Salt Lake City, UT, USA, 18–23 June 2018; pp. 6154–6162. [Google Scholar]
- Chen, Q.; Wang, Y.M.; Yang, T.; Zhang, X.Y.; Cheng, J.; Sun, J. You only look one-level feature. In Proceedings of the IEEE/CVF Conference on Computer Vision and Pattern Recognition, Nashville, TN, USA, 13 November 2021; pp. 13034–13043. [Google Scholar]
- An, X.H.; Zhou, L.; Liu, Z.G.; Wang, C.Z.; Li, P.F.; Li, Z.W. Dataset and benchmark for detecting moving objects in construction sites. Autom. Constr. 2021, 122, 103482. [Google Scholar]
- Shrivastava, A.; Gupta, A.; Girshick, R. Training region-based object detectors with online hard example mining. In Proceedings of the IEEE Conference on Computer Vision and Pattern Recognition, Las Vegas, NV, USA, 26–30 June 2016; pp. 761–769. [Google Scholar]
- Roberts, D.; Bretl, T.; Golparvar-Fard, M. Detecting and classifying cranes using camera-equipped UAVs for monitoring crane-related safety hazards. J. Comput. Civ. Eng. 2017, 2017, 442–449. [Google Scholar]
- Kim, H.; Kim, H.; Hong, Y.W.; Byun, H. Detecting construction equipment using a region-based fully convolutional network and transfer learning. J. Comput. Civ. Eng. 2018, 32, 04017082. [Google Scholar] [CrossRef]
- Paszke, A.; Gross, S.; Chintala, S.; Chanan, G.; Yang, E.; DeVito, Z.; Lin, Z.M.; Desmaison, A.; Antiga, L.; Lerer, A. Automatic differentiation in pytorch. In Proceedings of the 31st Conference on Neural Information Processing Systems, Long Beach, CA, USA, 3–9 December 2017. [Google Scholar]
- Oksuz, K.; Cam, B.C.; Kalkan, S.; Akbas, E. Imbalance problems in object detection: A Review. IEEE Trans. Pattern Anal. Mach. Intell. 2020, 43, 3388–3415. [Google Scholar] [CrossRef] [PubMed] [Green Version]
Publisher’s Note: MDPI stays neutral with regard to jurisdictional claims in published maps and institutional affiliations. |
© 2022 by the authors. Licensee MDPI, Basel, Switzerland. This article is an open access article distributed under the terms and conditions of the Creative Commons Attribution (CC BY) license (https://creativecommons.org/licenses/by/4.0/).