1. Introduction
Most indoor positioning algorithms are based on the idea of a LANDMARC (Location Identification based on Dynamic Active RFID Calibration) [
1] approach to perform localization. LANDMARC uses reference tags in order to increase reader accuracy. Because tags are relatively inexpensive and multiple tags can be placed in one area, the reference tag system with LANDMARC helps to eliminate environmental factors such as weather and particle propagation in free space, because all the tags are subject to the exact same environmental hazards, and hence it can carry the same bias when being implemented. This allows for a more adaptive system and also robust results compared to conventional methods of placing multiple antennas, which also has extremely high costs because RFID readers or antennas are expensive.
For most indoor positioning systems, ultra-high-frequency (UHF) RFID technology is preferred, because the higher frequency allows for a wider read/write spectrum and more metadata of the RFID tag being read, and advanced operations are better supported in the higher-frequency bands. The LANDMARC system has the following three advantages compared to conventional means of RFID localization. First, there is no need for a large number of expensive RFID readers. Instead, it uses additional and cheaper RFID tags. Second, the environmental dynamics can easily be accommodated. The approach helps to offset many environmental factors that contribute to the variations in detected range because the reference tags are subject to the same effects in the environment as the tags to be located. Thus, it can dynamically update the reference information for lookup based on the detected range from the reference tags in real time. Third, the location information is more accurate and reliable. The LANDMARC approach is more flexible and dynamic and can achieve much more accurate and closer to real-time location sensing. Obviously, the placement of readers and reference tags is very important to the overall accuracy of the system. In order to implement LANDMARC, the RFID Electronic Product Code (EPC), which is a unique identifier per RFID tag, and the RSSI value are needed.
The main contributions of this paper are listed in the following:
- (1)
A single xArray RFID reader is used to detect the location of the target tag by using reference tags and adaptive beam pattern changing. By analyzing the location accuracy of different beam patterns, the larger scale for indoor positioning systems can be achieved.
- (2)
Optimizations between the effective range, number of reference tags, beam pattern and refresh rate are weighed and their tradeoffs are compared. The results show that the proposed method has a wide positioning range and better positioning accuracy.
- (3)
The proposed system’s superiority is highlighted, especially in its range–accuracy performance. It can be widely used in indoor positioning requirement scenarios, such as libraries, warehouses, and so on.
2. Related Work
Many researchers have brought forward optimizations to the LANDMARC approach in order to stabilize the results and obtain higher accuracy, robustness and depth of operation when implementing localization. These modifications include antenna and reader positioning, such as ANTspin: Efficient Absolute Localization Method of RFID Tags via Spinning Antenna, which introduces a rotary table in the experiment. The reader antenna is fixed on the rotary table to continuously collect dynamic data. When compared with static acquisition, there is more information for localization [
2]. Excluding antenna-based optimization approaches, data processing and predictive modeling approaches have been used, such as 3DLRA, which proposes a new three-dimensional localization method based on deep learning: combining RFID absolute location with relative location, analyzing the variation characteristics of the received signal strength (RSSI) and phase, further mining data characteristics by deep learning [
3]. Some researchers have applied newer technologies such as ZigBee. ZigBee technology is the main technical index in the transmission, using data information as a carrier. It is widely used in human daily communication transmission. It is of great research value to apply the LANDMARC algorithm to ZigBee technology [
4]. Floarea et al. presented a positioning system which uses two widely applied algorithms including Cell of Origin and the LANDMARC approach [
5]. Other improvements include the Human Movement-based Relative Localization system, namely HMRL, using passive RFID to achieve accurate relative localization, and even some deep learning-inspired ones, such as advanced LANDMARC with the adaptive k-nearest neighbor algorithm [
6,
7,
8,
9,
10,
11].
All these improvements highlight how LANDMARC is the cornerstone of most indoor positioning systems (IPS). Using smart bracelets as wearable hardware as a part of the medical IPS is a more appropriate solution because there is a broad choice of this type of device on the market [
12]. The VIRE algorithm improves the LANDMARC algorithm by inserting virtual tags evenly between reference tags [
13]. Usually, in RFID positioning systems, we need more than one antenna to allow the positioning algorithm to achieve more accuracy. Moreover, some researchers have proposed single antenna-based positioning methods, which are more appropriate to be used in indoor environments. In addition, we can use data mining methods to improve the accuracy of indoor localization algorithms [
14] and more sensors can be used for indoor positioning [
15]. Wang et al. presented the power-adaptation scheme, which enhanced the positioning accuracy in a single antenna RFID system [
16]. In the practical test, as a result of the complex environmental factors and multipath effect, the RSSI value from the RFID system cannot directly reflect the distance between the tag and the antenna. Unlike other RFID-based localization systems, Saab et al. proposed a novel RFID-based methodology which employs a single nonsteered stationary antenna and three passive tags mounted on each object to estimate the location and orientation of objects. This work provides an alternative and relatively cheap approach for remotely estimating the pose of an object [
17].
3. LANDMARC Methodology
The implementation of the LANDMARC algorithm mainly starts from creating a mathematical model to classify the antenna and tag relationships, thus creating an array of antenna number rows and RSSI value columns. With each RFID, a successful read tag event contains the corresponding EPC code and the RSSI value. Thus, the needed inputs and parameters for determining the location of the target tag are shown below:
—number of RF readers;
—tag to be used as reference tag;
—the target tags that will be tracked;
— denotes the RSSI of each target tag highlighted by each reader i;
denotes the signal strength.
With these values and parameters, we can then calculate the Euclidian distance vector per RFID tag and antenna, and the resultant vector would be the Euclidian distance for reference tags and target tags. Suppose that in an indoor room, there are evenly spaced reference tags and readers, and the tags to be tested are randomly distributed indoors. The matrix of signal strength values measured by the reader for each reference tag [
4] is:
where
Smn represents the signal strength of the
n-th reference tag measured by the
m-th reader [
4]. The reader measures the signal strength matrix of the tag under test, where
Tmu represents the signal strength of the
u-th tag to be detected by the
m-th reader [
18].
The magnitude of the spacing between the label is to be tested, and also the LANDMARC is used as our reference point, which will be determined by the Euclidian distances of the vector. The Euclidian distance of the vector is calculated as
Eij. This is the distance between the
i-th reference label and also the
j-th label to be located [
18].
For each target to be measured, we need find the
k nearest reference labels. According to the distance between the
k reference labels and the label to be tested, the weight coefficient occupied by each reference label is as shown below:
where
wi represents the weight coefficient of the
k nearest reference labels of the label to be tested. In order to find the nearest reference tag to the tracking tag, we can use the coordinate of the reference tag with the smallest
E value as the unknown tag’s coordinate. It can be called the 1-nearest neighbor algorithm [
18]. Unlike conventional LANDMARC approaches, when using antenna beams, the accuracy can vary because of differences when switching between antenna beams, and its positioning is an independent value; hence, finding the equilibrium point between the number of reference points and also the accuracy and range relationship is the key problem.
4. Proposed Sing-Ant Methodology
In our method, we use the Impinj xArray Reader, where the antenna used is able to produce 52 beams, albeit sequentially, which means that only one antenna can be accessed at a time. Though the xArray gateway reader already has wide-area monitoring, there are some setbacks which need improvement. In this paper, with our proposed method and implementation, the following questions can be solved.
- (1)
The first issue of xArray is a lack of environmental adaptability. Because there are no reference tags, the existing model cannot factor in the effects of the environment. Thus, when we use the LANDMARC approach, there is no weather bias since all the tags are subject to the exact same weather conditions.
- (2)
Due to the fluctuating nature of RFID tag reads, the current RFID positioning system is highly unstable; usually, the location of the target tags is changed with every antenna beam change. This is solved by having clusters and sectors of antennas, which are more accurate, and also reference tags are used for positioning, so there is less fluctuation.
- (3)
In addition, the operation range can be extended depending on the degree of accuracy required by changing the number of neighbors and reference tags used. The current xArray reader has a fixed location sensing algorithm that cannot factor in the dynamism of different working environments without the use of reference tags.
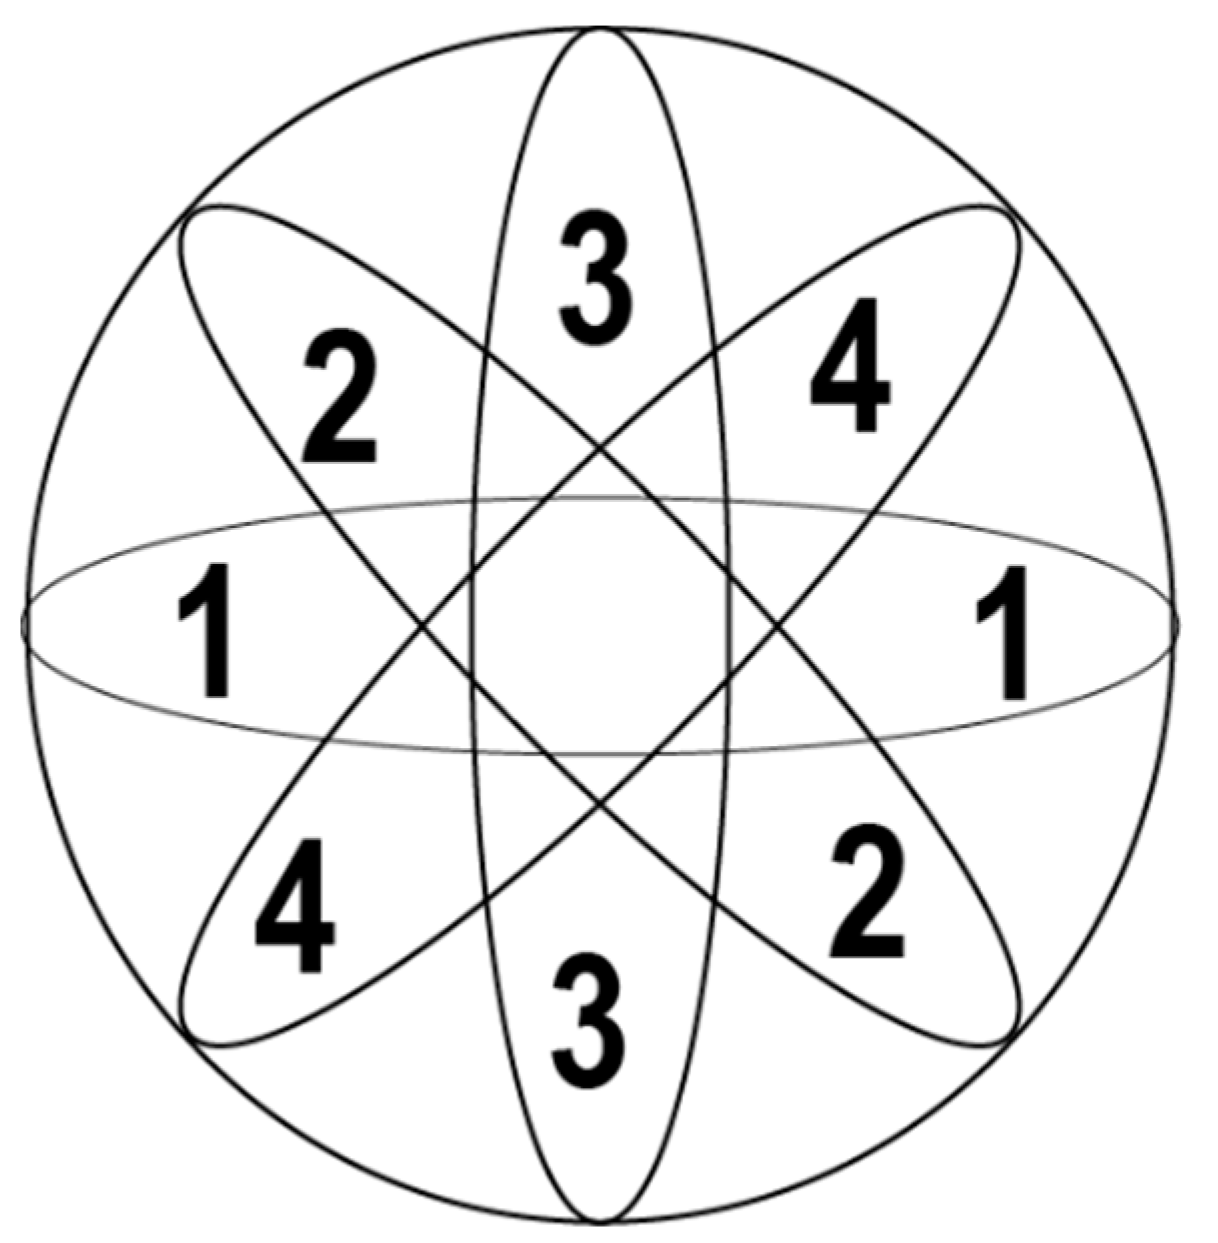
The proposed method has the following settings for the xArray reader: the antenna read pattern, unless manually configured, always reads in ascending order. The first four make up the core center of the reading range, with each beam occupying almost a quarter of the central sphere. The rest of the beams are divided into circular rings around these four core beams, and the ring of beams consists of 8 antenna beams. Each ring expands outwards beyond the circle, forming circular as well as linear sections inside the overall functioning area. The ring and central core will be labeled as a cluster, whilst the combinations of linear beams being displaced further from the core will be named sectors. The first four antennas make up the core. This combination of the core and its sectors and clusters, respectively, will be the one used to locate tags in free space. Various combinations of arrangement and weighing will lead to better results and higher accuracy, at the same time accommodating longer ranges without any additional overhead.
4.1. Central Core
The central core plays a unique role in determining the location tag and accuracy of the IPS system. Due to the sequential activation of antennas, it will be the first group of beams to determine the position of the target tag. Moreover, it is the only beam combination that effectively scans the center of the effective area when the antenna is activated; hence, there is need to ensure that it is fully functioning. It is made up of four beams, all of them being perfectly symmetrical along the
x-axis and
y-axis. Hence, it has to be considered when working with the central antenna and in order to accommodate multiple scenarios and read events. The average wake time for any antenna beam is around 1.25 s, and there is a direct relationship between the number of scans of a system and also the distance from the main antenna. The core antenna beams of the Impinj xArray reader are shown in
Figure 1, which shows that 4 antenna beams are used in our methods.
4.2. Antenna Clusters
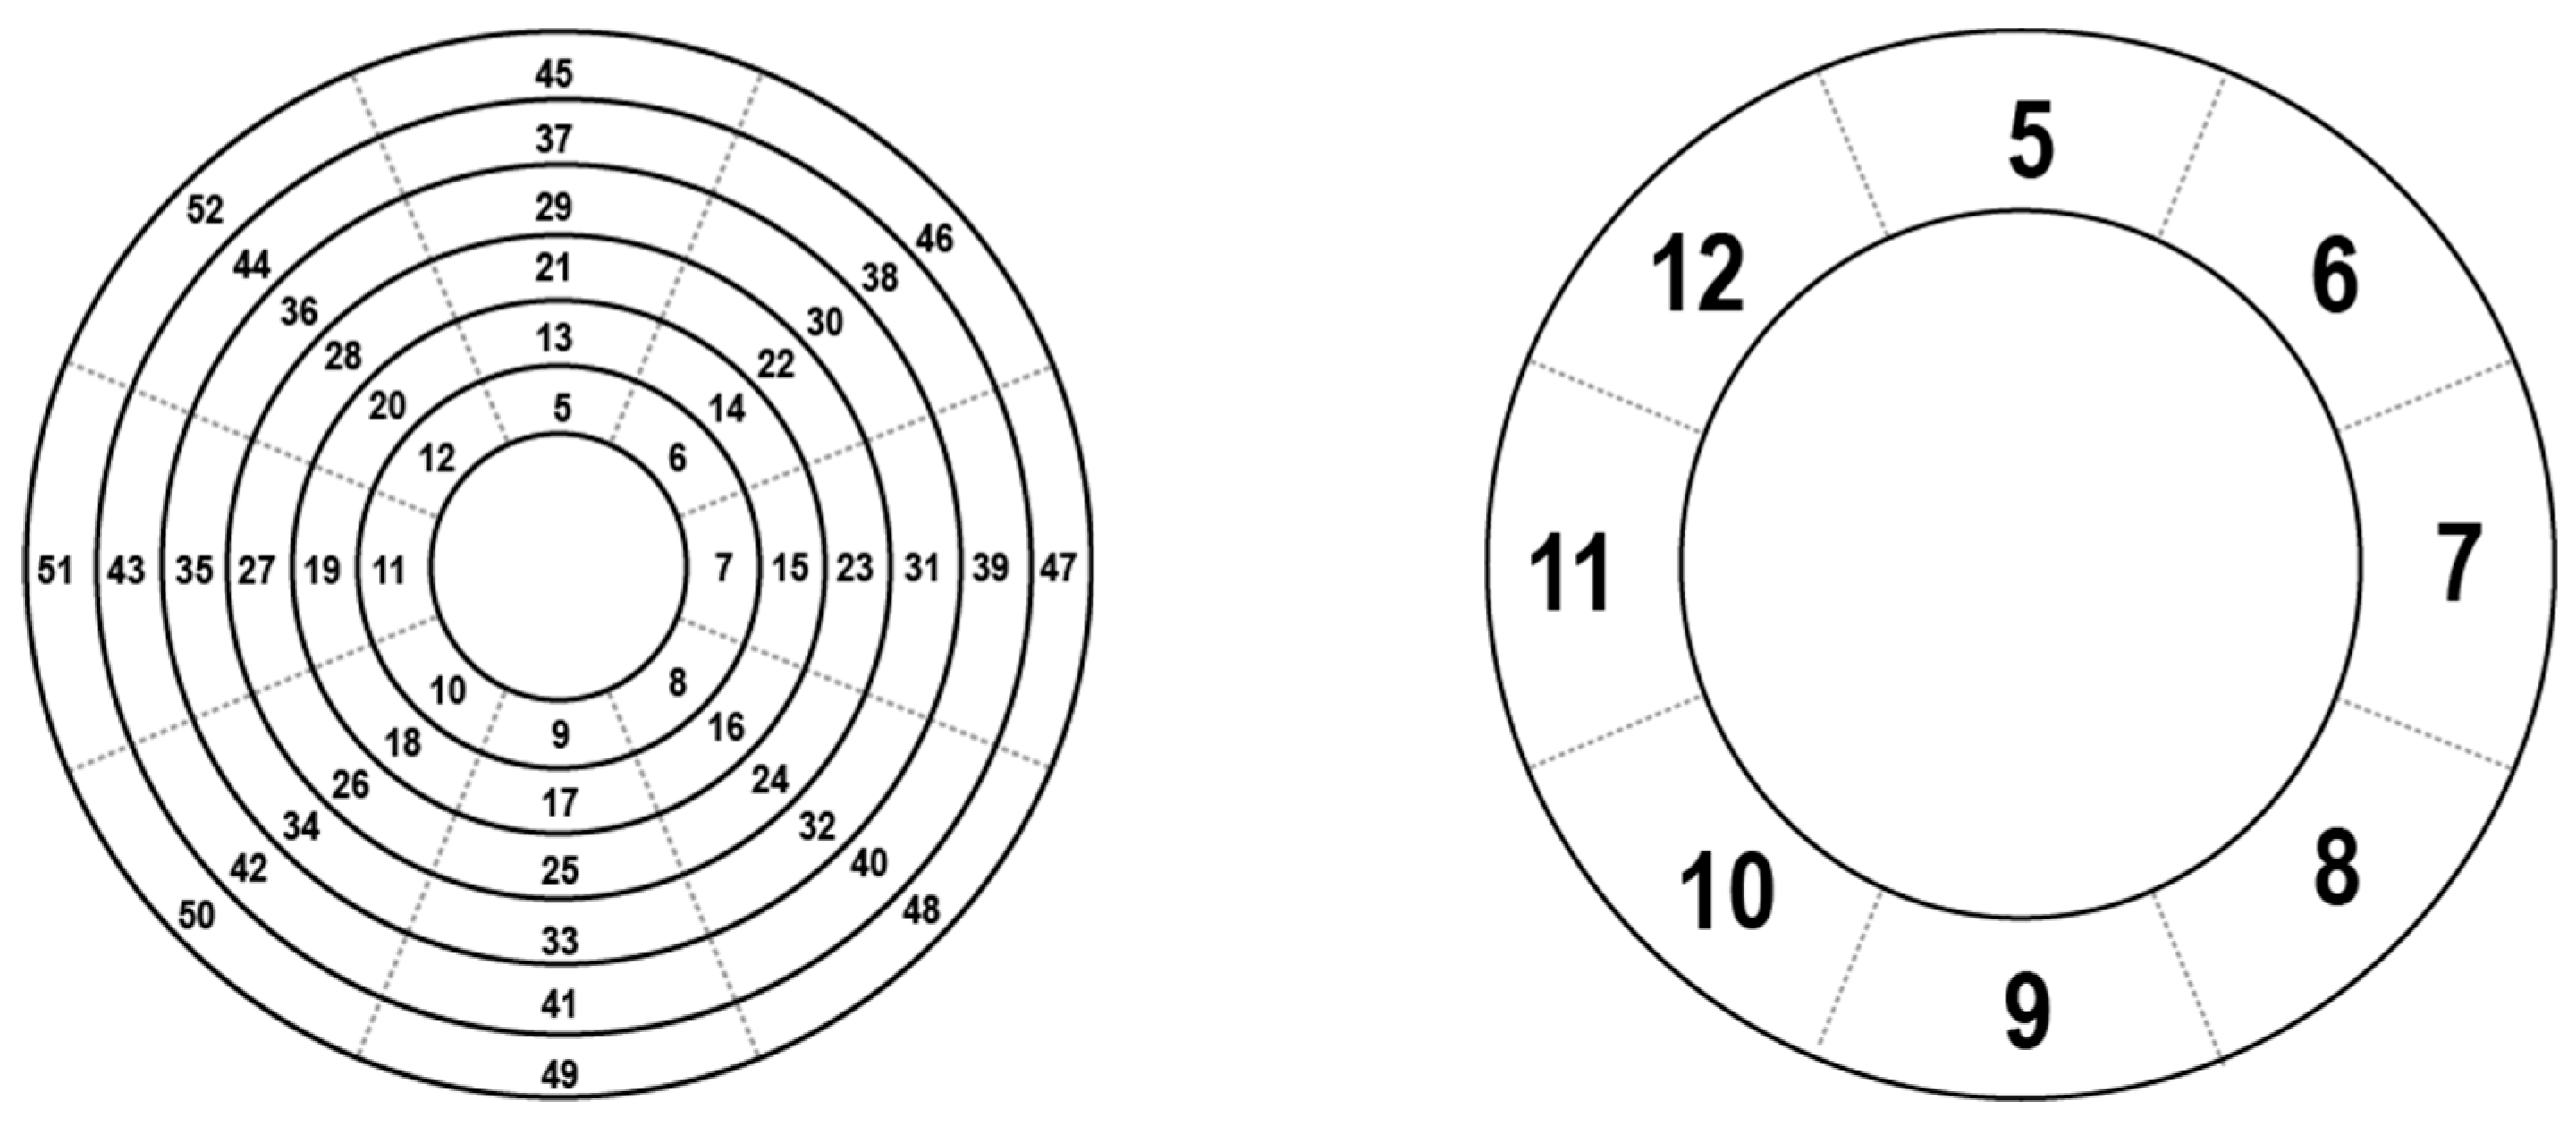
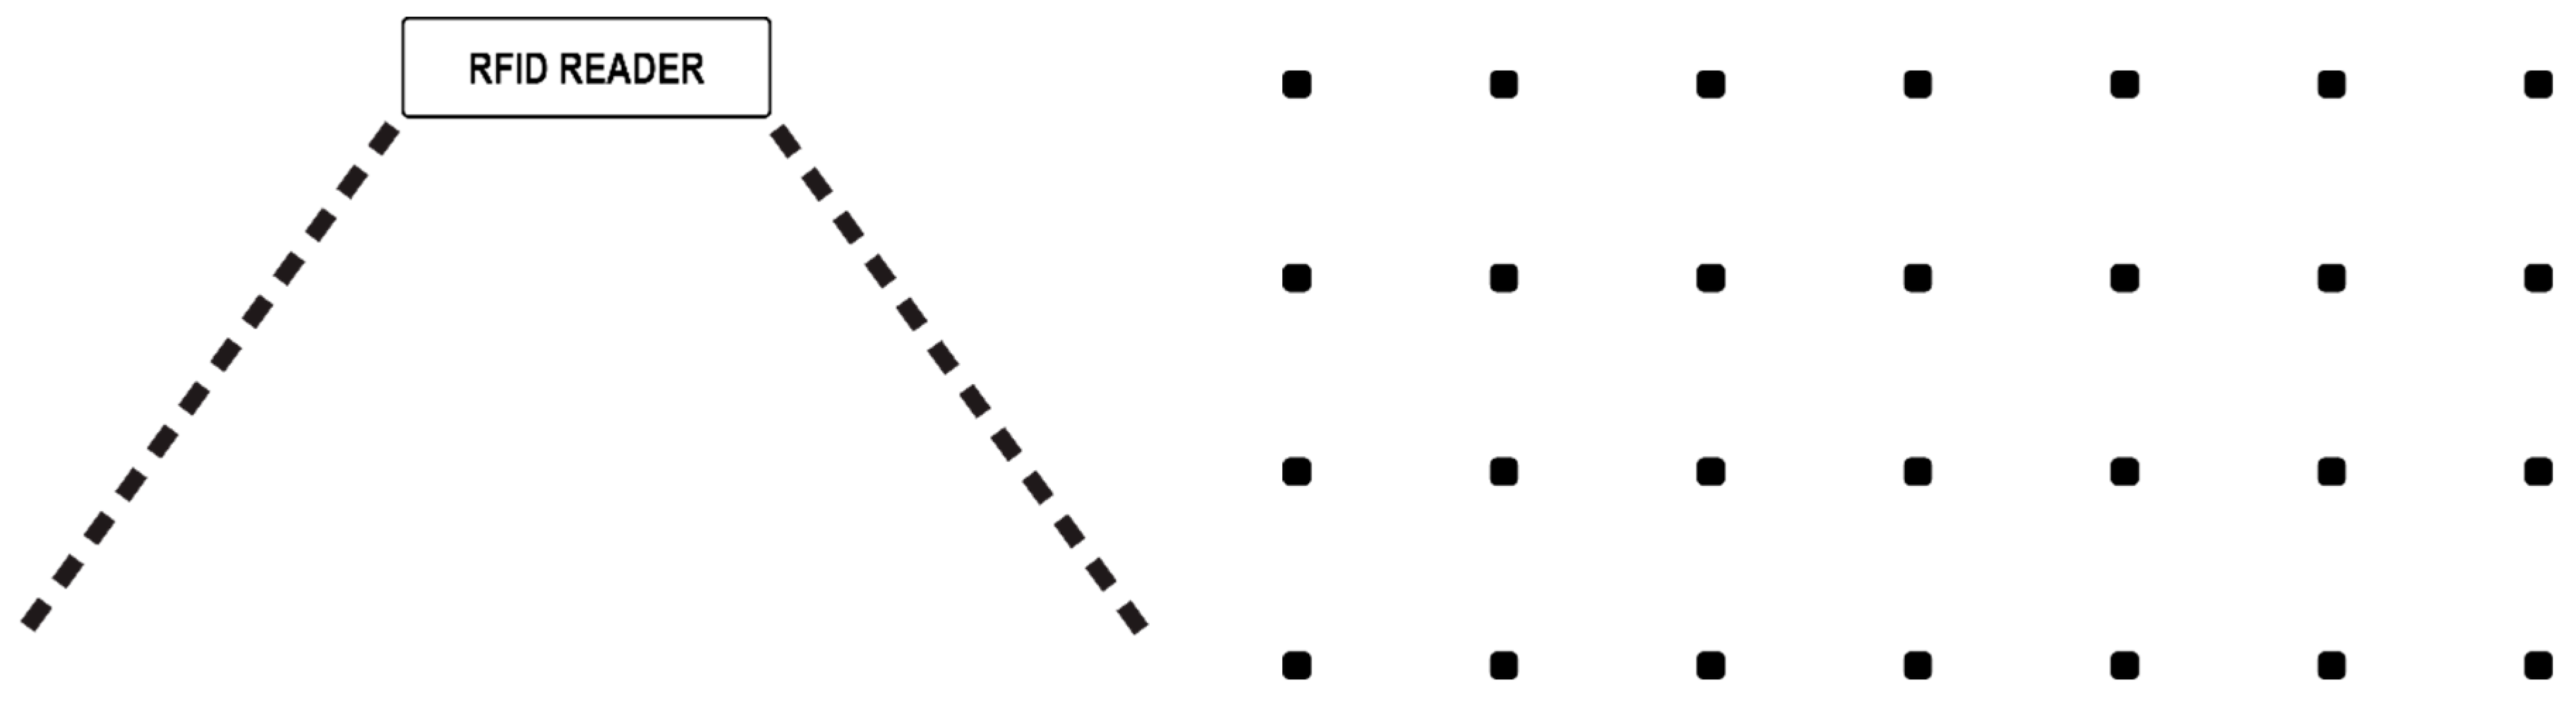
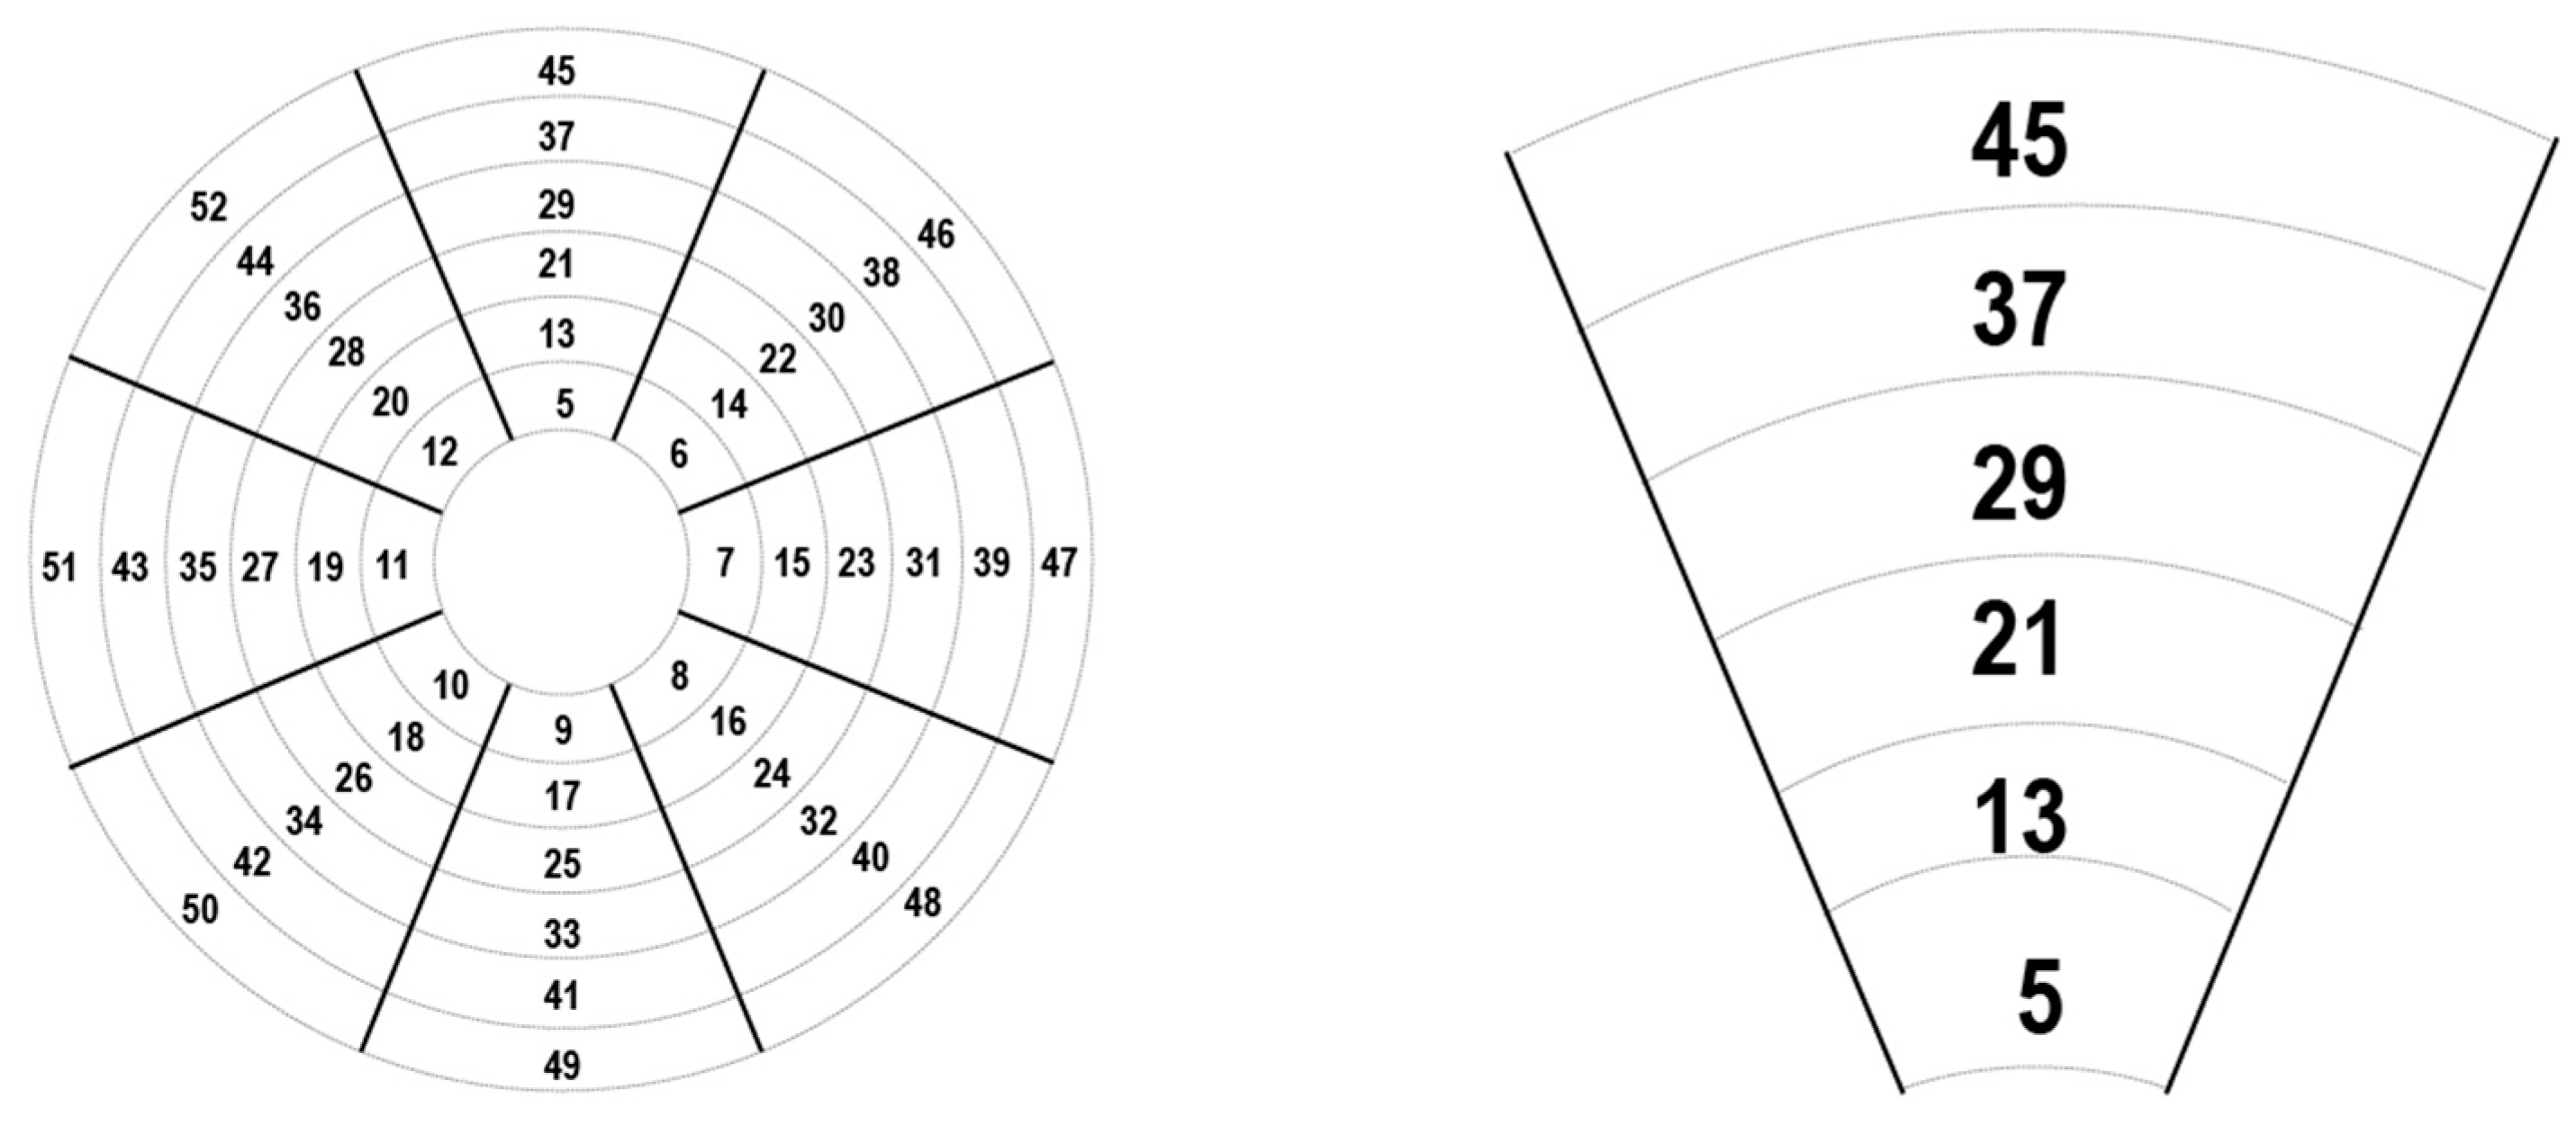
Antenna clusters are made up of the outer centric rings of antenna beams that surround the core and they are made up of 8 antenna beams, all scanning successively one after the other. The cluster’s area of operation increases with each cluster, and as the circular area of coverage grows after each antenna is finished. Due to the large number of antennas, the sectors tend to have higher reliability and outrange the core. The mathematical operations required to work on the clusters are identical to the operations needed by the core. The structure of all the antenna cores is shown in
Figure 2, where shows the examples of antenna clusters on the left side of the image, and a single isolated core is shown on the right side.
Figure 2 shows that the antenna clusters are rings around the core. They are adept at determining the location of the target tag due to their lack of polarity, because, whilst they contain the same spread as the core cluster in that they calculate the difference in direction at 45° angles, they do not suffer from the same polarity drawbacks as the core does, and hence they can locate the target tag without having to be optimized.
4.3. Antenna Sectors
The antenna sectors protrude linearly outward from the core and are adept at measuring the distance from the core. They are composed of antenna beams that are protruding outwards from the core and are displaced in a line. They are made up of columns of antenna beams. Through the pattern in
Figure 3, the entire sectors in our target area and a single isolated sector are shown. The mathematical calculation remains the same as for the central core and antenna cluster, with the only variations being in the number of antenna beams used by each single sector. The sectors of all antennas and a single antenna are shown in
Figure 3.
Figure 3 shows that the lines of the antennas are spreading straight upwards and hence this method allows for easier calculation of the
y-axis spread as compared to clusters in which it is necessary to compare entire clusters in order to find the ideal point.
When handling clusters, the main challenge is the lack of sequential activation; it can be seen that they have a rather arbitrary antenna beam selection count, and these sequences appear at inconsistent intervals for the sequential calculation of a tag location. Hence, when working with antenna sectors, the position of the target tag relative to the sectors being measured must be calculated.
5. Design and Implementation of Sing-Ant
The main goal of the proposed system is to allow the accurate prediction of the location by using a combination of passive RFID reference tags via the LANDMARC approach and also use multiple antennas to better perceive the depth and different orientations of distance from the center. Therefore, this proposed system would allow for more accurate localization as it utilizes antenna positioning and also reference tags in order to narrow down the precise location of the target tag. The details of our proposed method are as follows.
From Equations (1) and (2), we can obtain multiple sub-matrices of the Euclidian distance between the target tag and the total number of reference tags, which are all mapped to the corresponding antenna that is being read. In order to make meaningful sense of the data, we split them into three calculations in order to best determine the mathematical model used to calculate the outcome. The three main calculation models are core, sector and cluster.
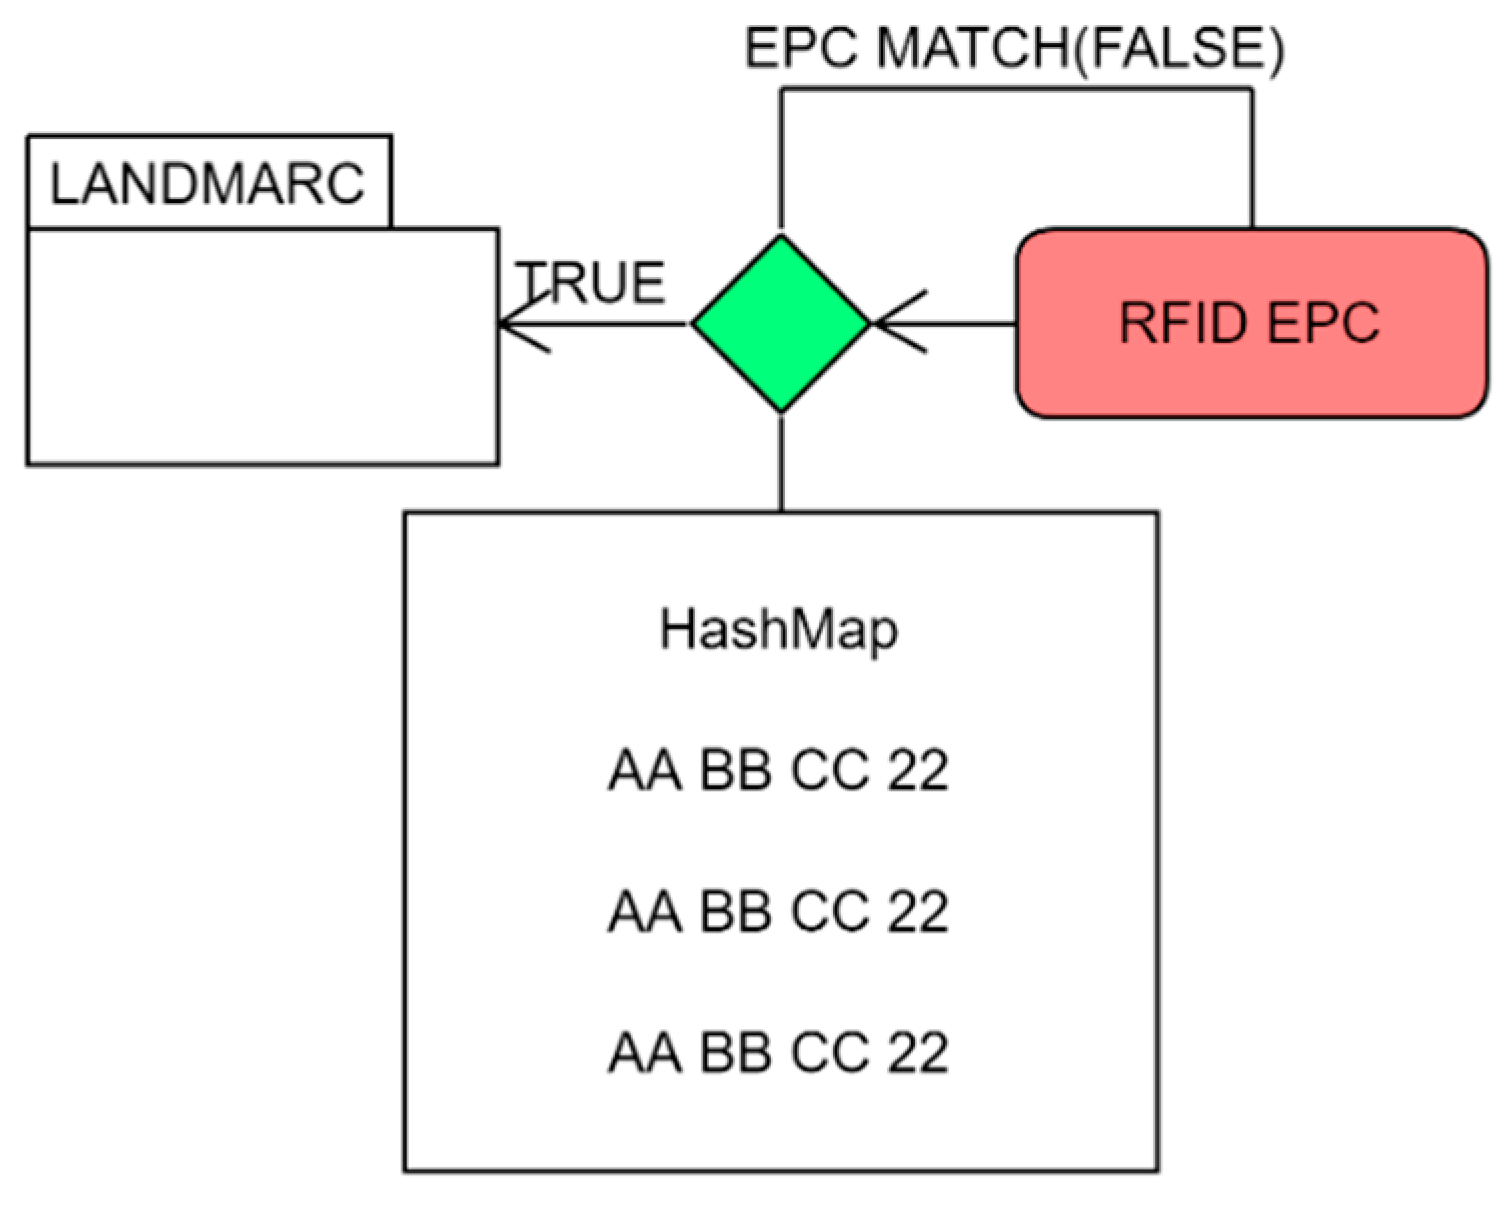
Since each of these calculations uses different configurations individually, which might be unable to accurately predict the location of the target tag, this can narrow down the location by focusing on their major advantages and lessening the disadvantages of the other systems. The core is ideal when tags are displaced near the center of the effective area of operation. Thus, when calculating the location of the target tag near the center, the first task is to create a reference list of all the tags that need to be scanned and create a custom RFID tag filter in order to limit reads, and hence devote more resources to the target tags and also allow higher read event success by limiting unwanted cards. This can be easily implemented by the use of a HashMap filter. The block diagram for filtering out unwanted tags is shown in
Figure 4.
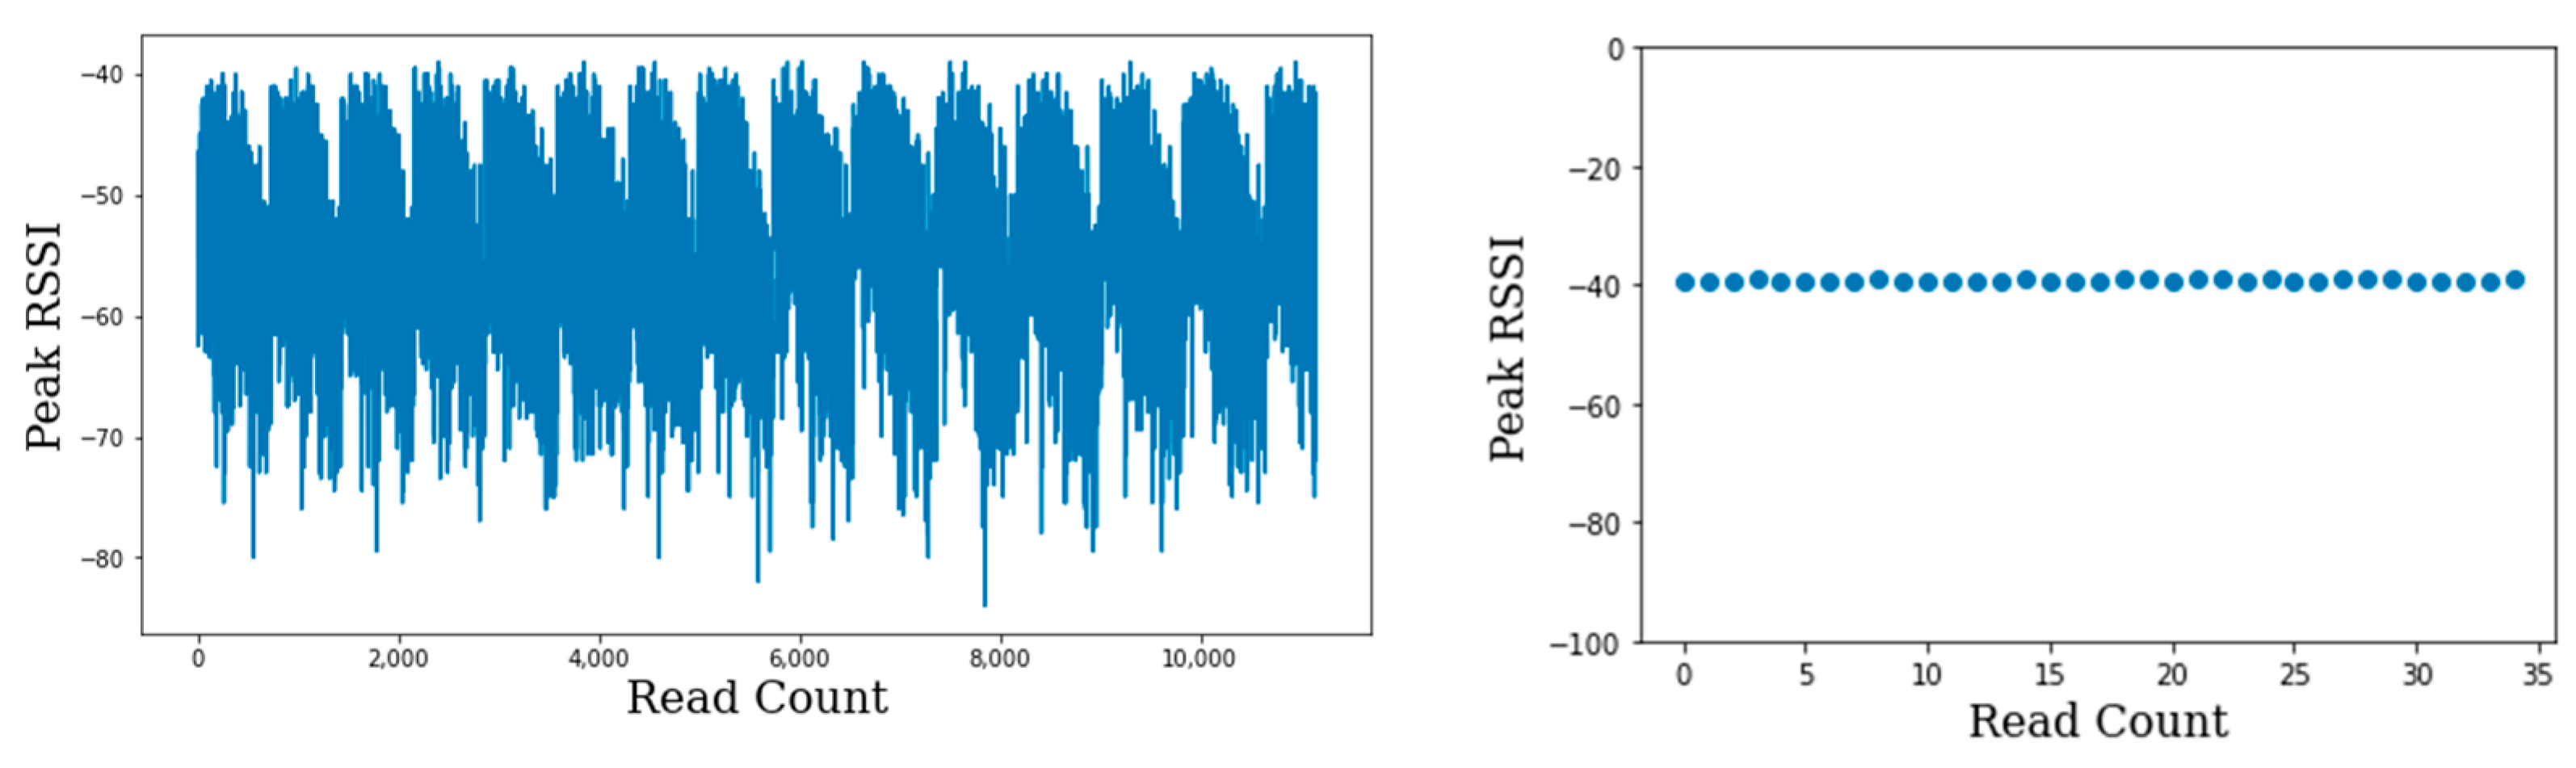
After tag filtering is finished, the next step is to choose the best values per antenna beam in order to select a single value to represent the RSSI. Because the RSSI is a fluctuating value that is highly inconsistent, in one antenna activation cycle, if the distance is close enough, we can obtain an average of 15 successful tag reads. The values, however, are sinusoidal in nature, and hence multiple mathematical modeling techniques can be used to filter the EPC values obtained, and the values are smoothed to be considered for calculation.
Figure 5 shows the oscillating values of EPC. One of the easiest and most primitive methods to stabilize the results is to consider only those above or below the minimum and maximum average. This forces the final results to either be floor results or ceiling results. Throughout this test, the results are used. If only one EPC RSSI value is needed, then the maximum RSSI value per antenna beam cycle can be chosen.
In
Figure 5, the two diagrams show how we can parse the received RSSI values in order to accommodate and allow for steadier and linear results; by choosing either the floor or the ceiling threshold, we can obtain fewer conflicting data. During the calculation, we deferred to the ceiling values as they showed the highest possible RSSI per RFID tag. In an ideal situation, lower RSSI values would arise from tags at a further distance. However, in the practical test, as a result of the complex environmental factors and multipath effect, the RSSI value from the device could not directly reflect the distance between the tag and the antenna [
16]. Some RSSIs of reference tags and tags to be tested can be grouped into theoretical values and measured values according to different formulas [
18]. The results can be logged to allow for further study, such as for deep learning models of estimation. The main idea behind position estimation via mapping techniques is to determine a regression scheme based on a set of reference tags’ data, and then to estimate the position of a given node according to this regression function [
19]. Whilst the results are pseudo-periodic, there is visible randomness. Due to the great interference brought by complex indoor channel environments to the wireless signal propagation, the RSSI value of tags appears to undergo random fluctuations [
20].
When collecting the tag data and preparing to place them into our calculation matrices, it is necessary to account for unsuccessful tag read events. These are events whereby there is no RSSI value returned after an antenna beam has been activated and eventually deactivated. Null values can be handled in three ways depending on preference. They are listed as follows: omission, zero padding and infinity padding.
Omission simply requires the removal of all the data with missing values and instead using only fully read antenna matrices. Zero padding works by replacing the missed RSSI values with zero instead when they are not read. In infinite padding, if there is no read event, then a large number is used instead; the number has to be large enough to render the Euclidian distance value trivial.
In order to calculate multiple scenarios at one time, we wait for one cycle to complete and then record all the entries from one RFID reader cycle consisting of all the reference tags, target tags and their respective antenna beam RSSI value; the ideal resultant matrix would be split into two. The first matrix shows the antenna beam number and the RSSI of the reference tag.
Defining the signal strength of the tag to be tested as a matrix
S,
Sij (
i = 1, 2 ...
M,
j = 1, 2 ...
A) represents the RSSI value of tag
i to be located and read by the antenna
j [
2]. The actual targets will also have their own matrix, mapped out in a similar nature to the original shown here. Therefore, in the event of having only one antenna tag as the target, it will be a vector matrix instead. This will be a regular occurrence, especially when trying to locate only one tag. Lastly, the matrix will appear as shown below:
Defining the signal strength of the reference tag as a matrix
θij (
i = 1, 2,
N,
j = 1, 2, ...
A) represents the RSSI value of the reference tag
i read by the antenna
j [
5]. We then followed up with the standard LANDMARC protocol for calculating the Euclidian distances and the value with the lowest figures represents the reference tag that is closest to our target tag. However, this is merely the beginning of our calculative process. Consequently, we need to optimize it for range and also direction, so we set antenna clusters and sectors in order to narrow down and fine tune the actual location and also attain better precision with less tags and a wider range. Thus, for the second phase of calculations, we assume that our input values are a row in a matrix
T that contains all the Euclidian distances for the target matrix. For all reference points, we can have a corresponding matrix as shown. For example, if we have 5 reference points, then we can use 5 matrices representing this antenna beam, landmark and target tag matrix. By comparing the relationships and values between each antenna and the reference tags, we can assess the location of the tags by using similar amounts of reference tags.
With each value representing the Euclidian distance and the antenna beam towards it, we can assess which combination of read values better reflects the actual position of the tag, even at further ranges than normal. We can assign each antenna beam a pseudo-landmark, and the pattern configuration is shown in
Figure 6.
Thus, for the wide-range approach, we propose a single neighbor approach, meaning that the reference tag with the lowest Euclidian distance per antenna cluster, core and sector will be assigned as the location.
6. System Deployment
With a functional mathematical model, the implementation was carried out in a standard lab room in open space. Our proposed design consists of one Impinj xArray Gateway RFID Reader located at the highest point (usually hanging from the ceiling) in our lab and the reference tags located on the floor. For the reference tags, we mapped them out in a square matrix arrangement of n * n, and each reference tag was assigned a location value for the first test of a wider range with less accuracy. For the experiments, since we used one neighbor, there was no need for weight adjustment and hence we could use the actual reference tag as the location. Since the Impinj xArray reader is a fixed infrastructure RFID reader, we used its SDK and low-level-reader protocol to change its mode and configure it to work in wide monitoring scenarios.
For the reference tags, we chose UHF passive RFID cards. The tags were passive tags, meaning that they did not have an independent power source and they relied entirely ion the reader for their power. The main reason for choosing UHF tags the read range, which is the largest compared to other tags, as shown in
Table 1.
Table 1 clearly shows that the higher the frequency, the longer the read range. We set RFID reference tags almost in a standard square manner and each passive tag represented a set coordinate point ranging from
and
. The final reference tag’s location would be the coordinates from the two values. Thus, if our target tag was located at the bottom right corner (with respect to the antenna reader) of the room, then the location entry would be validated as
, with the two values being the maximum values of row and column length, respectively.
Thus, depending on the accuracy and range, we could determine the overall location. Moreover, for finer locations and pinpointing exact coordinates, we can use more neighbors and then obtain weights for each reference tag; upon obtaining the weights, we can then simply place the location points using the weighted value. This would be practical for finer location values, but considering the abundancy and relative price of passive RFID tags, being cheap, we can afford to instead simply use multiple RFID tags. When the final setup is made, the arrangement will resemble
Figure 7.
The UHF RFID tag has 4 memory banks, and they are the Electronic Product Code (EPC), user memory, reserved memory and tag identifier memory (TID). To identify the tags in the most efficient way possible, we configured our antenna as shown in
Table 2.
Once the EPC and RSSI values were matched, we obtained the corresponding matrix of reference and target tags. Then, we started to calculate the Euclidean distances of the target tag with respect to the landmarks. The distances were calculated using the following formula below:
where
is the Euclidean distance in signal strength between a tracking tag and the reference tag
. Let
E denote the location relationship between the reference tags and the tracking tag, i.e., the nearer the reference tag to the tracking tag, the smaller the
E value. Upon acquiring the Euclidian distances, we could use the number of neighbors to calculate the location of the tags. If we use one neighbor, then the tag with the lowest values means that it has the highest correlation with the target tag, and it is designated as the location of the target tag. However, if we use multiple reference tags and use more than one neighbor to determine the location of our RFID target tag, then we use the formula below to acquire the exact location of the target tag.
The value of
refers to the factor of weight provided by the
-th nearest neighbor of the system; the weights are another independent design parameter but can be factored in when there is a need to obtain two-dimensional coordinates in a pseudo-linear nature as compared to simply using a single reference tag as our location point. The weight formula is calculated as shown below.
This approach provided the least error in most of the experiments, which means that the reference tag with the smallest
E value has the largest weight. This may be explained by the fact that the signal strength is inversely proportional to the square of the distance. Note that our approach can be easily extended to a three-dimensional coordinate [
3]. As compared to other algorithms such as tri-lateration, which is a method that can find the coordinates of a sensor node, the sensor coordinates are the intersection point of three of the anchor nodes, and the intersection point is known as a localized node [
11].
7. Results and Discussion
With the implementation of RFID mapping, the result is the physical layout. The first result when mapping out the coordinates was the relationship between the number of reference tags and the overall accuracy of the system. Having kept our lab operating area size constant, we discovered that, for the 1-Nearest Neighbor approach, the highest accuracy was obtained when we had the least amount of reference tags. Because of the higher polarization between antenna RSSI values, there is maximum displacement of landmark tags.
Table 3 shows the results.
Table 3 shows that without adjusting for weights, high accuracy becomes much more difficult to obtain, and also sometimes, when the target tag is placed perfectly between the reference tags, then problems of multiple tags with very similar Euclidian values arise.
From
Table 3, we can see that there is a tradeoff in 1-Nearest Neighbor, so considering multiple neighbors is an appealing approach, because there are some incorrect readings in the neighborhood of the correct one.
7.1. Antenna Beam Path Optimization
Having obtained all the data from our antennas and completed one full antenna cycle from beam 1 to 52, we can begin optimizations to smooth out the results that we obtain and allow for even higher levels of optimization. Instead of applying the weights on our RFID tags, we can instead use our antennas and their corresponding RSSI values to determine the rough location and improve the result from our reference tags. To do this, we sacrifice finer accuracy (usually around 10 cm) and instead compensate with range (more than 2 m from the reader). This distance creates a buffer for smaller margins of error and allows the use of fewer RFID cards to obtain the course location of the target tag via the 1-Nearest Neighbor approach; we can then optimize the results and map them out using the antenna clusters and sectors instead.
Starting with our clusters, in order to determine the sector of highest correlation with our reference tags, we create nested Euclidian vectors. The first is the vector matrix of each cluster
C and each sector having the same Euclidian vector matrix.
Thus, in order to determine the location of the target tag, we first choose the highest correlation of the Euclidian value cluster. This will give the closest distance from the core. We perform a similar operation with the sectors and whichever pair of sector and cluster yield the highest values, which become the target RFID tag location point. Then, we cross-reference with our standard LANDMARC approach in order to validate the results, and if the selected antenna beam is in the neighborhood of our target tag, then we designate the localization event. As the graph below shows, the narrowing optimization is based on sectors and clusters.
The main aim of single antenna use for RFID localization is to improve the following features that preexisting models are unable to provide:
- (1)
Widen the range of effective scanned area;
- (2)
Maintain low RFID reader overhead;
- (3)
Use a single fixed antenna.
Our system stands out by using a single antenna and also relying on successive antenna beam shifting in order to predict the final results. Regarding its limitations, firstly, there are some blind spots from the antenna diagram as we can clearly see in the core that some areas are not covered by the antenna. Moreover, because only one beam can be active at one time, this means that we cannot obtain simultaneous real-time values as compared to conventional models that use multiple antennas in their setup. Thus, when predicting the model, a good amount of accuracy is traded off, especially working with the sector. Due to their irregular calculation scheme, they can only be fully utilized once a complete cycle (beam 1 through 52) of changing antenna beams has been completed. This means that other systems operate faster than ours because, on average, one complete antenna beam cycle will cost, on average, 0.4 s; hence, overall, we can obtain all results after more than 40 s. The core and sectors are used for LANDMARC location prediction whenever their beams are finished and data are collected. Then, the overall location is checked twice with the results. Therefore, the location refresh rate is refreshed much faster depending on the user configuration. Below, we present a list of the refresh times depending on how many sectors and clusters are being used altogether. Distance was increased or decreased to analyze the change in the relative positioning accuracy [
3]. Whilst there was a slight drop in the tag count, overall, the number of successful tag reads was high enough to be equally as adequate as closely placed tags. As long as the target tags are in the effective range, then they will not affect the refresh rate.
Table 4 shows the results of different clusters used.
7.2. Model Comparison
The proposed method allows us to flexibly choose an adaptive refresh rate because we need minimal system tweaking and only adjust when the end system gives the location feedback. This should allow the setup to operate in real time and also allow it to operate on par with other systems.
There are many more comparative advantages of using this system compared to others and, as can be seen from the table below, the results are clear. With a proper cost–benefit analysis, our system surpasses several more systems and can be applied in industrial settings. The only trade-off would be accuracy for range and also its three-dimensional capabilities stripped away in return for maintaining the use of one antenna. However, these methods are not mutually exclusive and hence can be combined to work together—for example, allowing a different system to have multiple phases of operation. An example is the COCKTAIL algorithm. COCKTAIL is a more comprehensive localization algorithm. It also runs in two phases. The first phase is the same as the SA phase of SA-LANDMARC, which aims to determine a subarea where the target object exists [
21]. These results can also be logged to allow for deep learning to distinguish and observe any hidden patterns, as when deep CNN is applied to RFID multi-tag localization with the joint fingerprint features of the RSSI and the phase difference of arrival (PDOA). The CNN for RFID localization has great advantages, such as the capability of processing a large amount of data, extracting and training fingerprint features, sharing the parameter structure and reducing the complexity of the neural network [
22]. The model comparison results are shown in
Table 5.
7.3. ItemTest vs. Sing-Ant
The Impinj xArray reader already comes with an inbuilt location sensing algorithm that is accessible through ItemTest, their default application for connecting the reader. This, however, cannot be compared to the multiple advantages that Sing-Ant possesses. Firstly, there is environmental bias in the ItemTest location method due to a lack of reference tags, so when deploying, one has to factor in the environment to operate. Sing-Ant overcomes this by using reference tags, since they carry the same environmental bias as the target tags. Secondly, the stability of target location is greatly improved. Because ItemTest recalculates the position after every beam change, its position is always shifting, even if the target tag has not moved, and there are always shifting changes. Due to the nature of recalculating the position of each tag entry, it is scanned every time. Because of the margin of error when reporting analog values, we notice that every update event log ends up shifting the position of the tag, even when stationary, whereas, with Sing-Ant, unless the displacement is large enough to move the target tag near another landmark, the location values remain constant. Third, there are redundant entries when using ItemTest. Because it recalculates the position after every successful tag report event, a single beam can choose over five entries from the same tag, and the result is needless overcalculation, which reduces the robustness. Meanwhile, with Sing-Ant, only after a cluster, core or sector has been finished is the location calculated. Thus, when multiple entries are noticed, only one is used for calculation. This helps to stabilize the final results as unnecessary entries are not considered. Some of the key differences are shown in
Table 6.


