Article

Ethanol Extract of Pinus koraiensis Leaves Mitigates High Fructose-Induced Hepatic Triglyceride Accumulation and Hypertriglyceridemia

1
Department of Food Science & Services, Eulji University, Seongnam 13135, Korea
2
Dain Natural Co., Ltd., Seoul 04788, Korea
3
Department of Science in Korean Medicine, College of Korean Medicine, Graduate School, Kyung Hee University, 26, Kyungheedae-ro, Dondaemun-gu, Seoul 02447, Korea
4
Department of Cancer Preventive Material Development, College of Korean Medicine, Graduate School, Kyung Hee University, 26, Kyungheedae-ro, Dongdamun-gu, Seoul 02447, Korea
5
Department of Food and Nutrition, Eulji University, Seongnam 13135, Korea
*
Author to whom correspondence should be addressed.
These authors contributed equally to this work.
Appl. Sci. 2022, 12(13), 6745; https://doi.org/10.3390/app12136745
Submission received: 27 May 2022 / Revised: 24 June 2022 / Accepted: 28 June 2022 / Published: 3 July 2022
(This article belongs to the Special Issue Bioactive Potential of Plants)

Abstract

:
Pinus koraiensis is a valuable plant source of functional health foods and medicinal materials. Hypertriglyceridemia affects about 15–20% of adults and is related to stroke, metabolic syndromes, cardiovascular diseases, and diabetes mellitus. Dietary fructose, a risk factor for developing hypertriglyceridemia, significantly increases postprandial triglyceride (TG) levels and aggravates non-alcoholic fatty liver disease. In this study, we aimed to analyze the effect of ethanol extract from P. koraiensis needles (EPK) on fructose (Fr)-induced cell culture and animal models, respectively. Our team determined the bioactivity, such as anti-cancer, anti-obesity, anti-diabetic, and anti-hyperlipidemic functions, of P. koraiensis needle extract. The EPK markedly reduced TG levels in the liver and serum and enhanced TG excretion through feces in high-fructose-fed rats. Furthermore, the EPK inhibited de novo lipogenesis and its markers—carbohydrate response element-binding protein (ChREBP), sterol regulatory element-binding protein 1 (SREBP-1), fatty acid synthase (FAS), 3-Hydroxy-3-Methylglutaryl-CoA Reductase (HMGCR), and tumor necrosis factor-alpha (TNF-α), a pro-inflammatory marker. Consistent with the results of the in vivo experiment, the EPK decreased SREBP-1, ChREBP, HMGCR, FAS, TNF-α, and iNOS expression levels, resulting in slower lipid accumulation and lower TG levels in Fr-induced HepG2 cells. These findings suggest that EPK mitigates hypertriglyceridemia and hepatic TG accumulation by inhibiting de novo lipogenic and pro-inflammatory factors.

1. Introduction

The consumption of soft drinks and processed foods containing sugar additives is a potential risk factor for developing non-alcoholic fatty liver disease (NAFLD) and hypertriglyceridemia. Dietary foods and drinks contain various types of fructose, including monosaccharides (free fructose), disaccharides (sucrose), and polysaccharides (fructan). The metabolism of sugars, especially fructose, occurs mainly in the liver; high fructose inflow gives rise to promoted hepatic triglyceride (TG) accumulation and elevated TG levels in the blood, bringing about impaired glucose and lipid metabolism and amplified pro-inflammatory cytokine expression [1,2,3,4].
NAFLD reflects various liver diseases, ranging from steatosis to non-alcoholic steatohepatitis, which may advance to fibrosis, cirrhosis, and liver cancer. Fructose intake contributes to the synthesis of fats by activating lipogenesis and promoting de novo lipogenesis (DNL), leading to hepatic lipid accumulation [5,6,7]. Moreover, it causes hypertriglyceridemia, a condition in which TG levels in the blood are elevated (>200 mg/dL), by directly stimulating hepatic very-low-density lipoprotein (VLDL)-TG secretion [8]. Hypertriglyceridemia is a common clinical condition: it affects 15–20% of the adult population. Previous studies have reported that elevated fasting and non-fasting hypertriglyceridemia or VLDL cholesterol levels are related to a high risk of coronary heart disease, even after adjustment for high-density lipoprotein (HDL) cholesterol concentrations [9,10].
High fructose intake promotes DNL by driving key transcription factors, such as carbohydrate response element-binding protein (ChREBP) and sterol regulatory element-binding protein 1 (SREBP-1), which regulate their key target enzymes for lipid synthesis—acetyl-CoA carboxylase (ACC) and fatty acid synthase (FAS) [11,12]. SREBPs have three isoforms (SREBP-1a, SREBP-1c, and SREBP-2) that regulate lipid homeostasis in hepatocytes. SREBP-2 mainly activates genes associated with cholesterol biosynthesis, while SREBP-1 triggers genes involved in fatty acid and TG synthesis preferentially. Hepatic and plasma TG accumulation is fully involved in transcriptional activity and SREBP-1c levels [13]. ChREBP (or MLXIPL) is an adept transcriptional regulator of glycolytic and lipogenic genes; carbohydrate metabolites activate it in key metabolic tissues, including the liver [14]. ChREBP plays important roles in regulating DNL, lipid composition, and plasma TG levels [15].
Pinus koraiensis, commonly known as Korean nut pine, grows in the wild in China, Japan, Korea, and eastern Russia. Pinus koraiensis leaf extract has been reported to contain essential oil. Pinus koraiensis leaves have been reported to possess anti-cancer [16], anti-hyperlipidemic, anti-obesity [17], and anti-diabetic properties [18]. In this study, we purposed to inspect the effect of the ethanol extract of P. koraiensis needles (EPK) on mitigating hypertriglyceridemia and NAFLD in fructose (Fr)-induced cells and rat models.

2. Materials and Methods

2.1. EPK

To obtain the EPK, dried and pulverized P. koraiensis leaves were hydrodistilled. The methods of EPK preparation were the same as in our previous study, which described the details [17].

2.2. Ethics Statement

The International Animal Care Use for Research Committee of Biotoxtech approved the protocol for animal use (210163: 29 March 2021) in the present study. Handling of laboratory rats was performed according to the Association for Assessment and Accreditation of Laboratory Animal Care International recommendations and protocols.

2.3. Animal Models

Fifty-eight male Sprague–Dawley rats (6 weeks old; 150–220 g), provided by Orientbio Inc. (Gyeonggi-do, Seongnam, Korea), were cared for in a temperature-controlled room (12 h light/dark cycle) and had free access to food and water. After one week of acclimation, eight rats were randomly assigned to the normal diet (N) group and given Teklad Certified Irradiated Global 18% Protein Rodent Diet 2918C (Envigo RMS Inc., Madison, WI, USA). To induce hypertriglyceridemia among the 50 rats that were randomly assigned to the high-fructose diet (HFrD) group, they were given rodent diets (D02022704) with 10 kcal% fat and 60% fructose (Research Diets Inc., New Brunswick, NJ, USA) for two weeks, before undergoing drug treatment. Forty rats that exhibited hypertriglyceridemia were chosen from the 50 rats. They were then randomly divided into five groups with eight rats each: HFrD control, EPK 60, EPK 125, EPK 250, and omega-3. For four weeks, the rats in all groups were continuously fed with HFrD; EPK (60, 125, and 250 mg/kg) and omega-3 (500 mg/kg) were administered by oral gavage once a day to the designated groups (Table 1). Their body weights were determined once a week. In addition, TG, total cholesterol (TC), low-density lipoprotein (LDL), and HDL cholesterol levels in the serum were measured by biochemical analysis once every two weeks.

2.4. Biochemical Analysis

Plasma was obtained by centrifuging the blood containing heparin at 2500× g for 10 min. The supernatant was isolated from liver tissue (50 mg) by homogenization for biochemical analyses. Rat feces were collected 8 h after the last test substance administration, according to the Folch method [19]. TG, HDL, LDL, and TC levels were measured from the fecal samples, isolated plasma, and supernatant from the liver tissue by applying a biochemical analyzer (7180, HITACHI, Tokyo, Japan).

2.5. RNA Isolation and Real-Time RT-PCR

RNA isolation and real-time RT-PCR methods are the same as in our previous study, which described the details [20]. Custom-designed primers (SREBP-1: forward primer 5′-TCAAGGCACATTTTTGCTCC-3′, reverse primer 5′-ATCGCAAACAAGCTGACCTG-3′; GAPDH: forward primer 5′-TGATTCTACCCACGGCAAGT-3′, reverse primer 5′-AGCATCACCCCATTTGATGT-3′) were used for this study.

2.6. Hepatic Histology

Paraffin sections (5 μm thick) prepared from the liver tissue were stained with hematoxylin (Sigma-Aldrich, St. Louis, MO, USA) and eosin (Sigma-Aldrich, St. Louis, MO, USA).

2.7. Western Blotting

HepG2 cells were pretreated with 10 mM fructose for 48 h and treated with 50 μg/mL EPK for 24 h. The cells and liver tissue obtained from the animals were lysed in radioimmunoprecipitation assay buffer (Thermo Fisher Scientific, Waltham, MA, USA). The Bio-Rad DCTM Protein Assay Kit II (Bio-Rad, Hercules, CA, USA) was used to quantify protein. Protein loading and transfer to membrane methods were the same as in our previous study [21]. After blocking the membranes, the membranes were incubated overnight at 4 °C with the following primary antibodies: SREBP-1, ChREBP (Santa Cruz, Dallas, TX, USA), FAS, tumor necrosis factor-alpha (TNF-α) (Cell Signaling Technology, Beverly, MA, USA), 3-hydroxy-3-methylglutaryl-CoA reductase (HMGCR) (Bioss, Woburn, MA, USA), inducible nitric oxide synthase (iNOS) (Aviva, San Diego, CA, USA), and β-actin (Sigma-Aldrich, St. Louis, MO, USA). After washing the membranes with 1×Tris-buffered saline with 0.1% Tween® 20 detergent (1X TBS-T), the membranes were incubated in a 1:5000–1:10,000 dilution of horseradish-peroxidase-conjugated secondary antibody for 2 h at room temperature. Proteins were detected using an enhanced chemiluminescence reagent (GE Healthcare, Little Chalfont, Buckinghamshire, UK). Each protein band was quantified using Image J 1.53 k software (National Institute of Health, Bethedes, MD, USA). The quantification of protein levels was calculated from a duplicate analysis of each sample. Obtained protein levels of interest were normalized to β-actin.

2.8. Oil Red O Staining

Oil Red O staining was performed as described in a previous study [22].

2.9. Cell Culture

The human hepatocarcinoma cell line HepG2 was obtained from the Korean Cell Line Bank (KCLB, Seoul, Korea) and cultured in Dulbecco’s Modified Eagle’s Medium supplemented with 10% fetal bovine serum (Welgene, Daegu, Korea) and 1% antibiotics (Welgene, Daegu, Korea).

2.10. Statistical Analysis

The data were analyzed by applying GraphPad Prism software. The mean ± standard deviation of three replicates was indicated in every experiment. Statistical significance, which was set at p < 0.05, p < 0.01, and p < 0.001, was evaluated by applying the Sigma Plot software.

3. Results

3.1. The HFrD Administered for Six Weeks Did Not Affect Body Weight

All groups had a 22–27% increase in body weight on day 22 of the experiment (Table 2). The HFrD control group had a slightly higher mean body weight than the normal group, but the difference was insignificant (Table 2).

3.2. The HFrD Did Not Affect TC, HDL, and LDL Levels

On Day 29, TC, HDL, and LDL levels were monitored. An 8.29 mg/dL increase in TC levels of the HFrD control group was recorded (Table 3). However, such an increase was not statistically significant compared to the normal group. A significant decrease in TC levels was observed in the omega-3 group (Table 3). HDL levels dropped in most groups, except the EPK 125 and 250 groups. Lastly, LDL levels increased in the HFrD group, but the increase was not statistically significant compared with that of the other groups (Table 3).

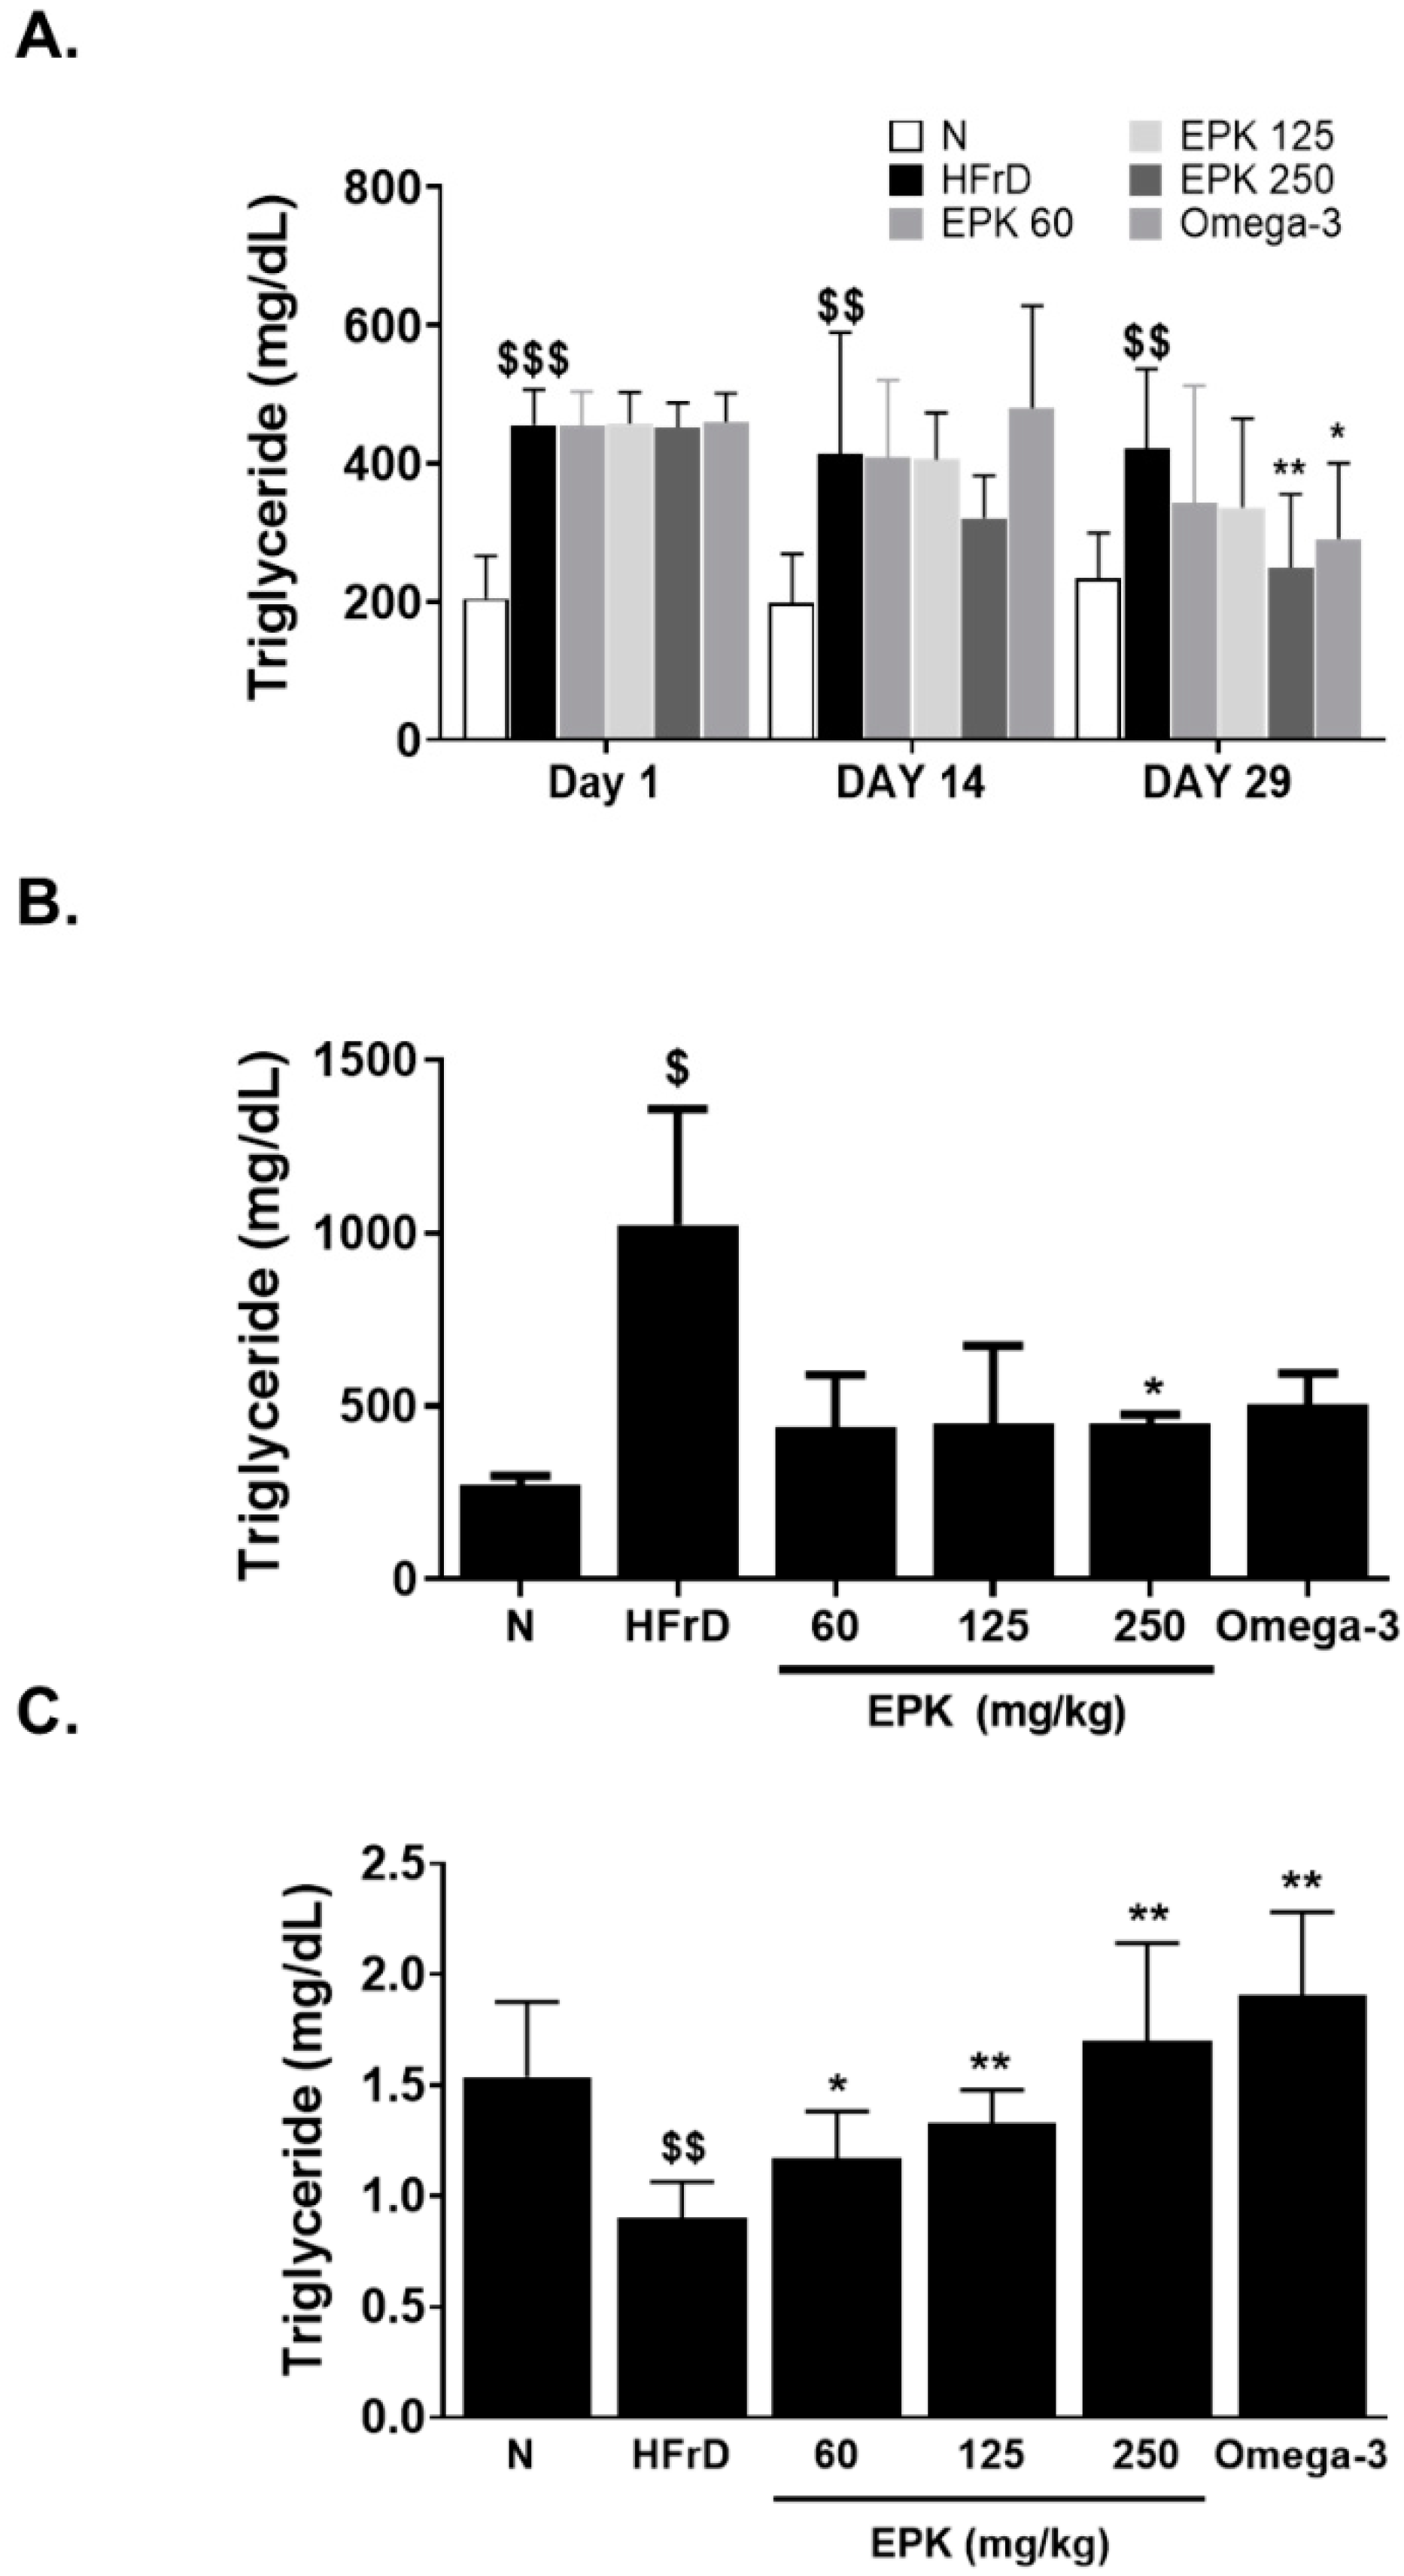
3.3. EPK Decreased Serum and Hepatic TG Levels and Increased TG Excretion through Feces in High Fructose–Induced Hypertriglyceridemia Animal Models

To induce hypertriglyceridemia in the HFrD control, EPK 60, 125, 250, and omega-3 groups, they were given an HFrD (Research Diet, New Brunswick, NJ, USA) for two weeks, before undergoing drug treatment. In Week 3, they were administered with EPK, omega-3, or vehicle by oral gavage, and this procedure was performed for the next four weeks. Serum TG levels were measured on Days 1, 14, and 29. On Day 1, serum TG levels were elevated in all groups fed with HFrD, except in the normal group. For instance, the TG levels of the HFrD control group were two-fold higher than that of the normal group. On Day 14, the EPK 250 group (321 ± 61 mg/dL) had lower TG levels than the HFrD control group (413.2 ± 115 mg/dL). The omega-3 group had higher TG levels (480 ± 148 mg/dL) than the HFrD control group. On Day 29, all EPK-treated groups (60, 125, and 250) had lower serum TG levels than the HFrD control group. In particular, the EPK 250 group had the lowest serum TG levels among the HFr-induced groups: its serum TG level was only 249 ± 106 mg/dL, while that of the HFrD control was 422 ± 115 mg/dL (Figure 1A). Furthermore, the significant reduction in hepatic TG levels in the EPK 60 (440 ± 151 mg/dL), EPK 125 (449 ± 225 mg/dL), EPK 250 (449 ± 26 mg/dL), and omega-3 (504 ± 91 mg/dL) groups can be attributed to the administration of EPK and omega-3 supplements. However, an HFrD enhanced the accumulation of hepatic TG. As shown in Figure 1B, the hepatic TG levels of the HFrD control group (1023 ± 335 mg/dL) were 3.8-fold higher than that of the normal group (272 ± 27 mg/dL). EPK supplementation increased excretory TG levels in feces dose-dependently compared with the HFrD control group. Omega-3 supplementation resulted in the highest excretory TG content among the HFrD-fed groups (Figure 1C).

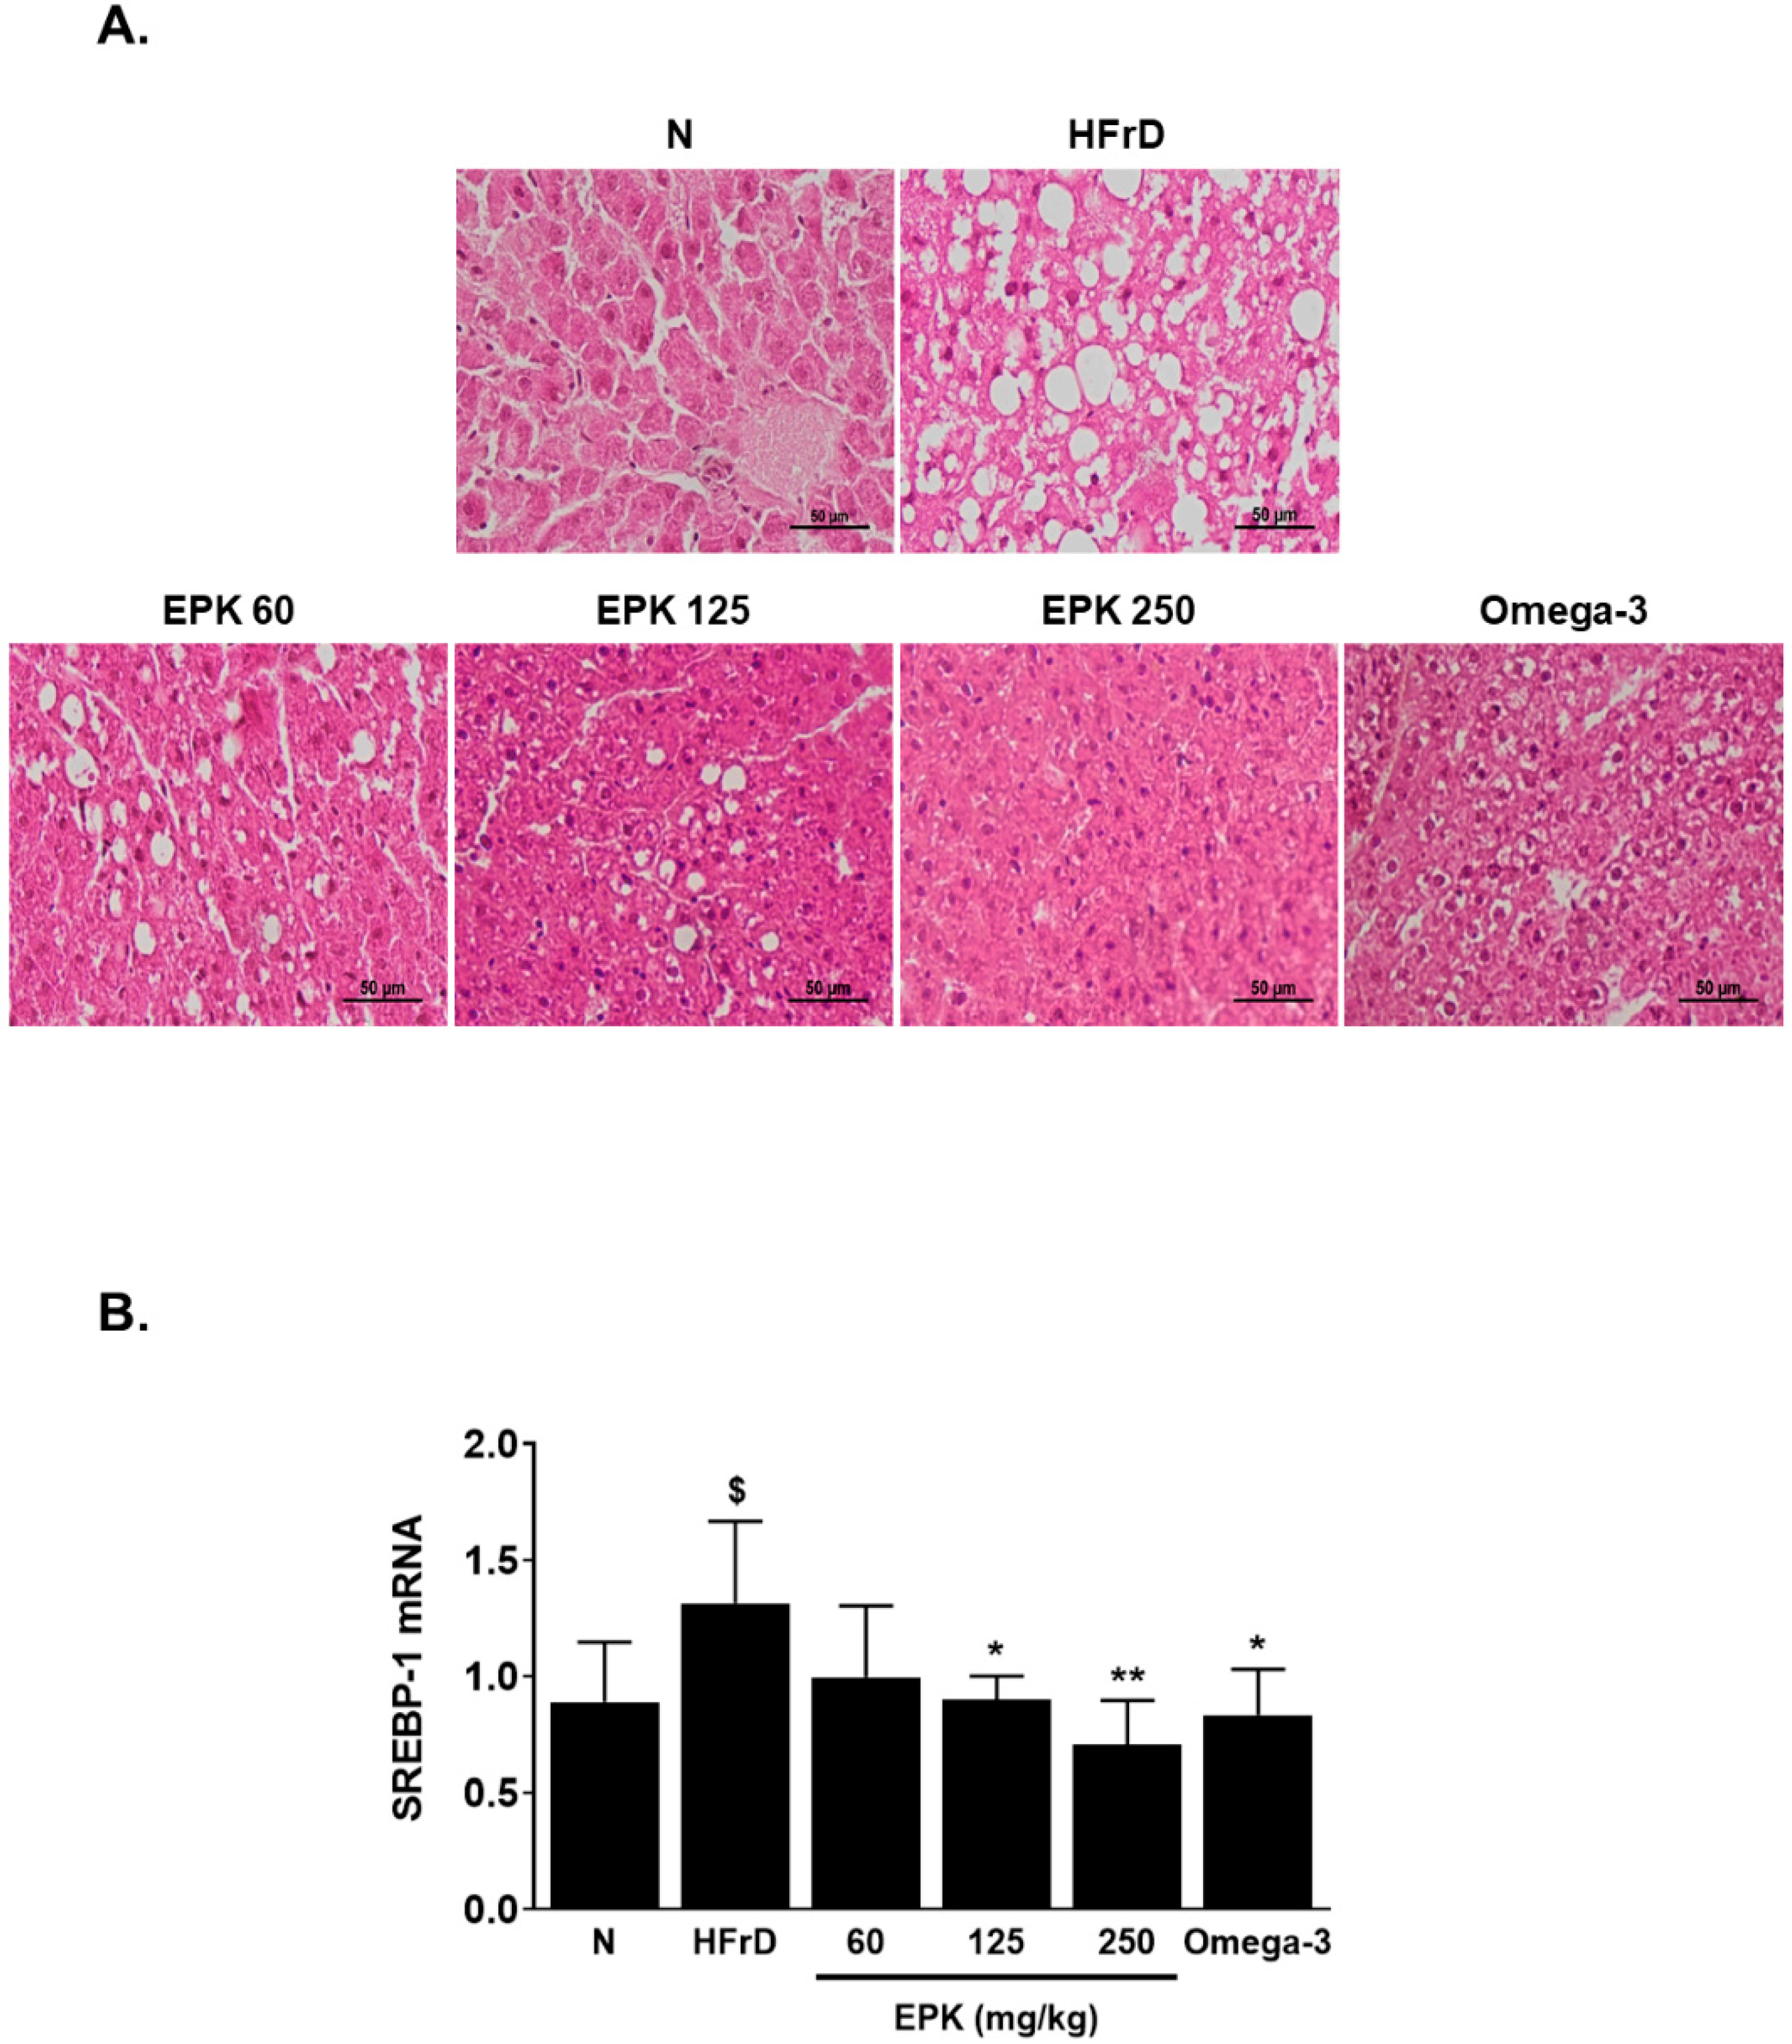
3.4. EPK Mitigated Fructose-Induced Fatty Liver

Micro- and macrovesicular steatosis and hepatocellular hypertrophy were observed in the hepatic tissue samples of the HFrD control group. In contrast, no inflammatory foci and less micro- and macrovesicular steatosis were observed in the hepatic tissue samples of the EPK-treated groups. Meanwhile, hepatocellular hypertrophy, less macrovesicular steatosis, and inflammatory foci were observed in the hepatic tissue samples of the omega-3 group (Figure 2A).

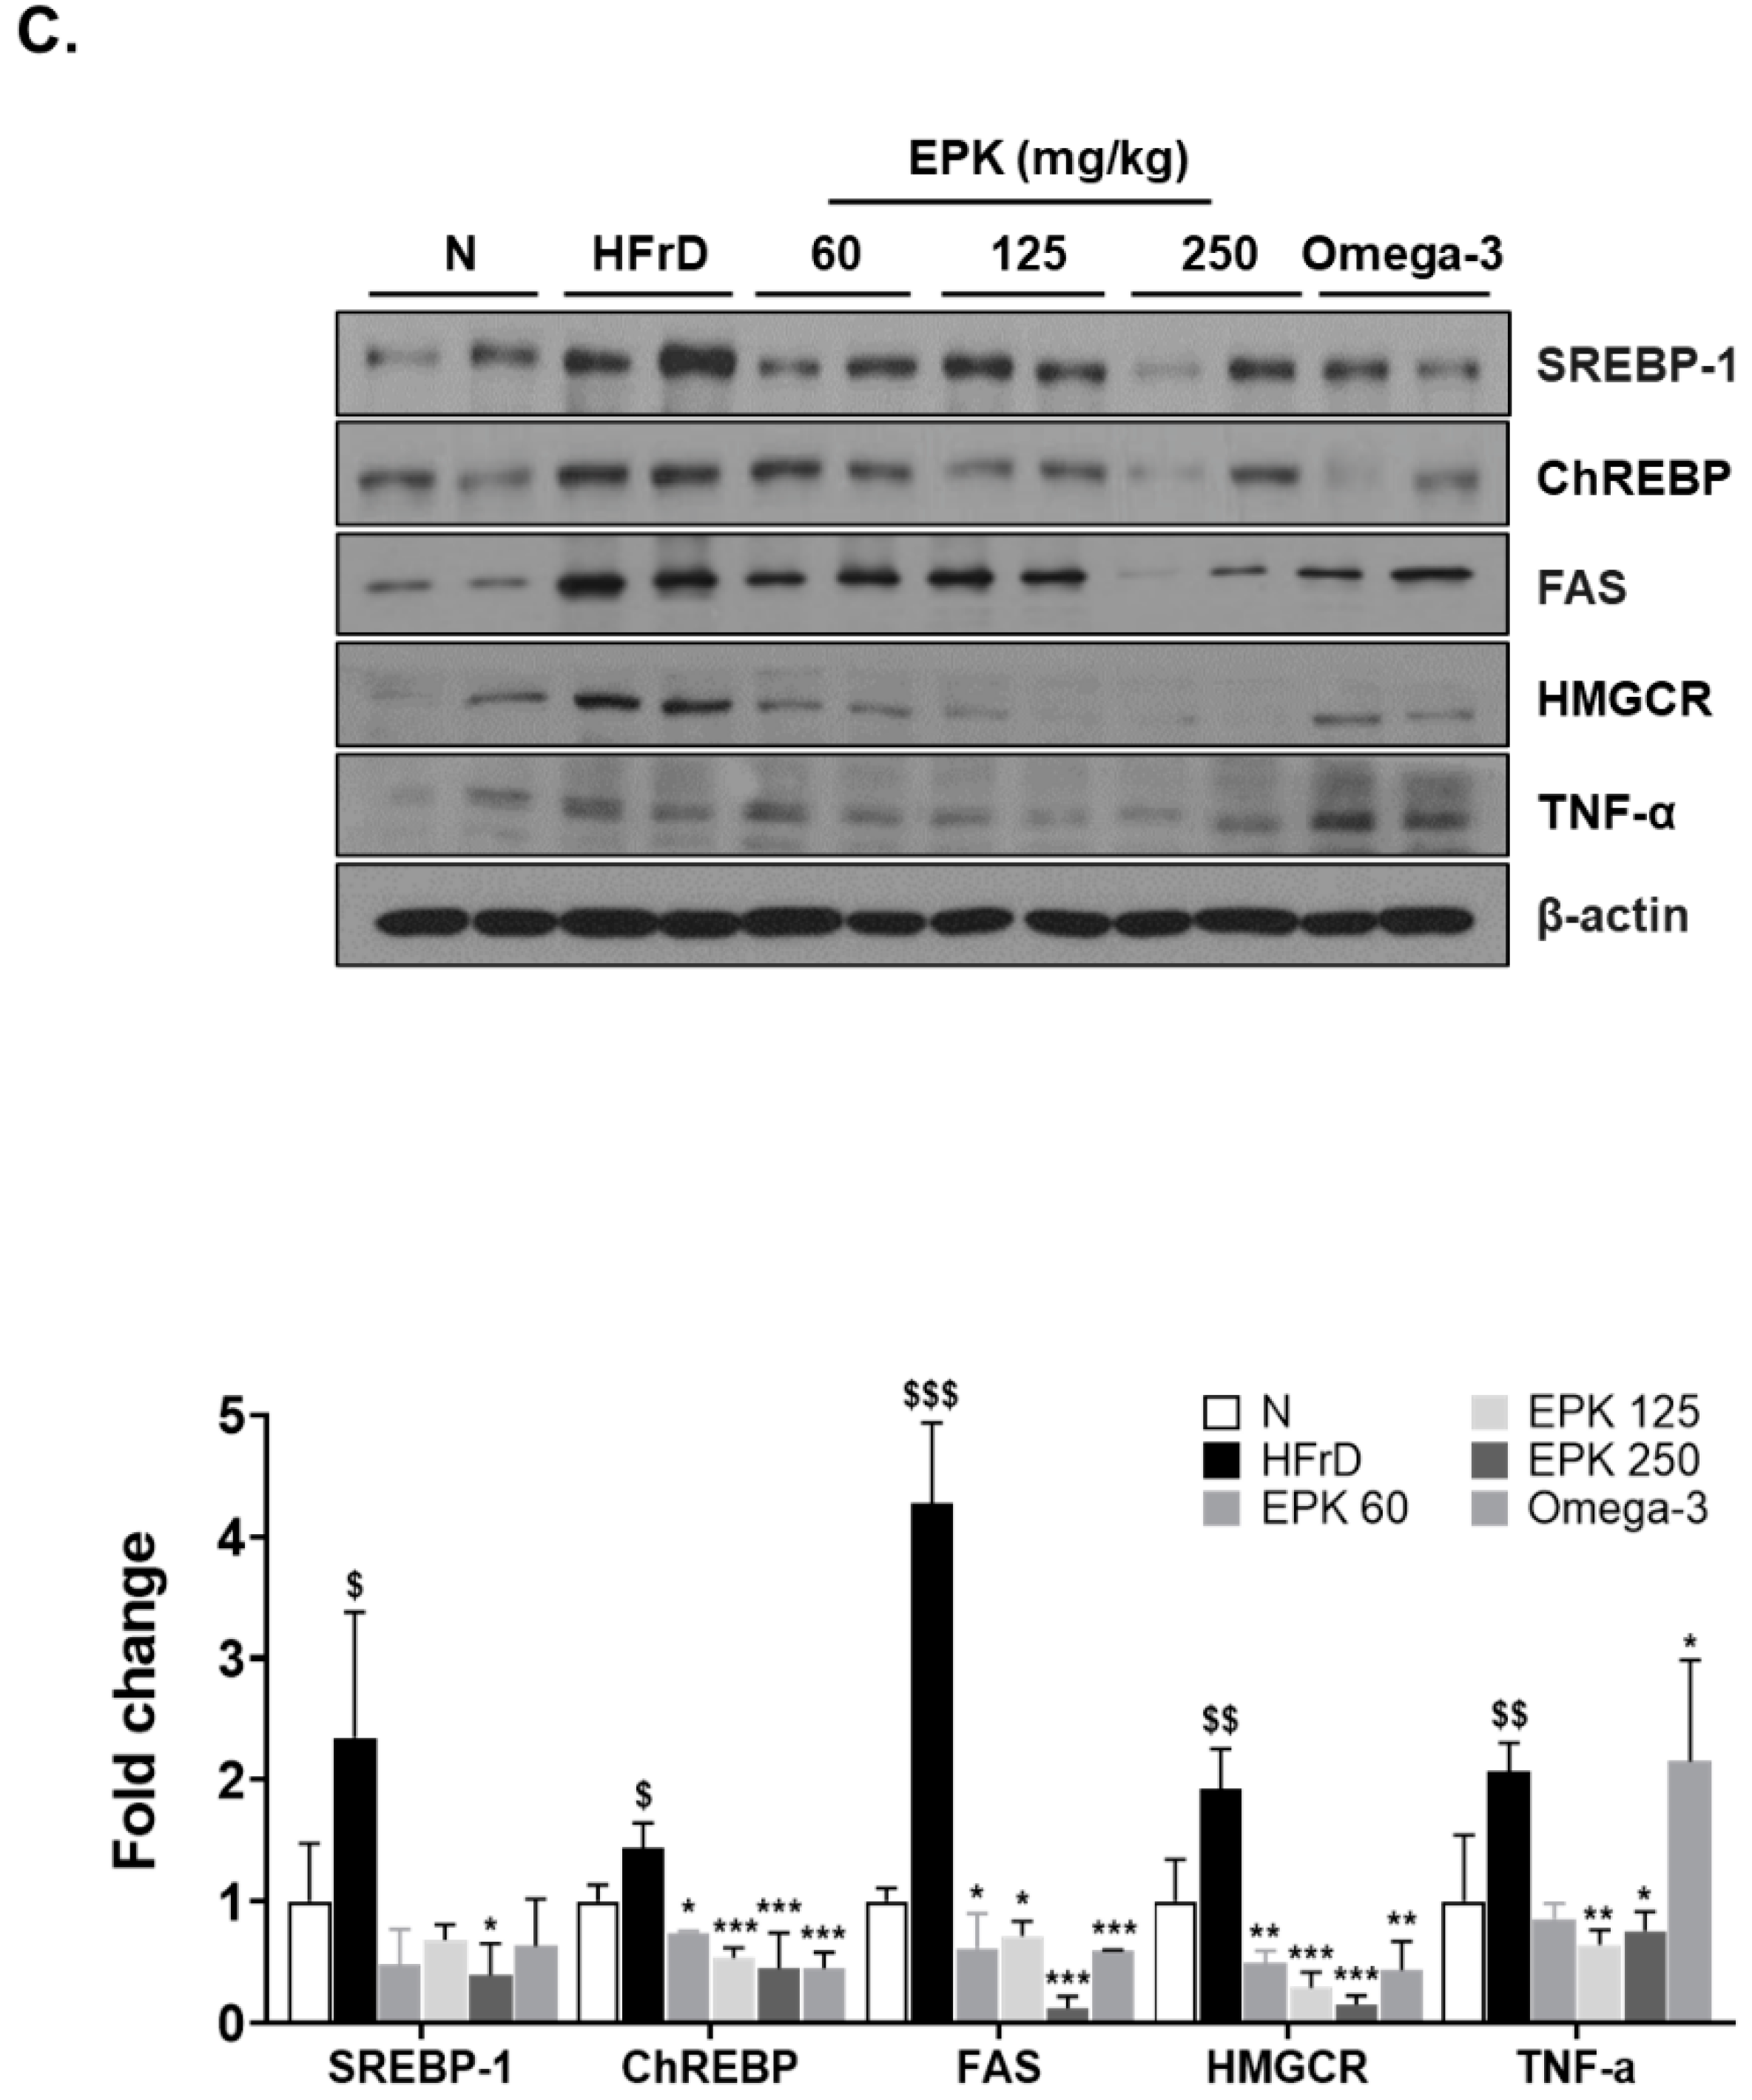
3.5. EPK Inhibited DNL-Related Proteins in HFrD-Induced Fatty Liver

As shown in Figure 1B and Figure 2A, EPK could reduce hepatic TG accumulation and steatosis induced by an HFrD. To confirm whether the inhibitory effect of EPK is linked to SREBP-1, an important factor of TG synthesis, SREBP-1 mRNA and protein levels in the liver tissue were measured. The SREBP-1 mRNA and protein levels of the HFrD control group were, respectively, 1.47- and 1.7-fold higher than those of the normal group (Figure 2B,C). The decrease in HFrD-induced SREBP-1 mRNA and protein levels could be attributed to EPK and omega-3 supplementation; SREBP-1 mRNA and protein expression levels were decreased in the EPK 250 group. The expression of ChREBP, FAS, HMGCR, and DNL-related factors was also amplified by an HFrD. However, moderated HFrD-induced ChREBP, FAS, and HMGCR protein expression was detected in the EPK- and omega-3-treated groups (Figure 2C). Similar to the SREBP-1 results, significantly reduced FAS and HMGCR levels were observed in the EPK 250 group.

3.6. EPK Inhibited TNF-α, a Pro-Inflammatory Marker, in HFrD-Induced Fatty Liver

The expression level of TNF-α, a hepatic inflammatory cytokine, was appraised to establish the effect of EPK on liver inflammation. A significant increase in hepatic TNF-α expression was detected in the HFrD control group but not in the EPK 125 and 250 groups. Congruent with the hepatic histology results, higher TNF-α expression levels were observed in the omega-3 group than in the HFrD control group (Figure 2C).

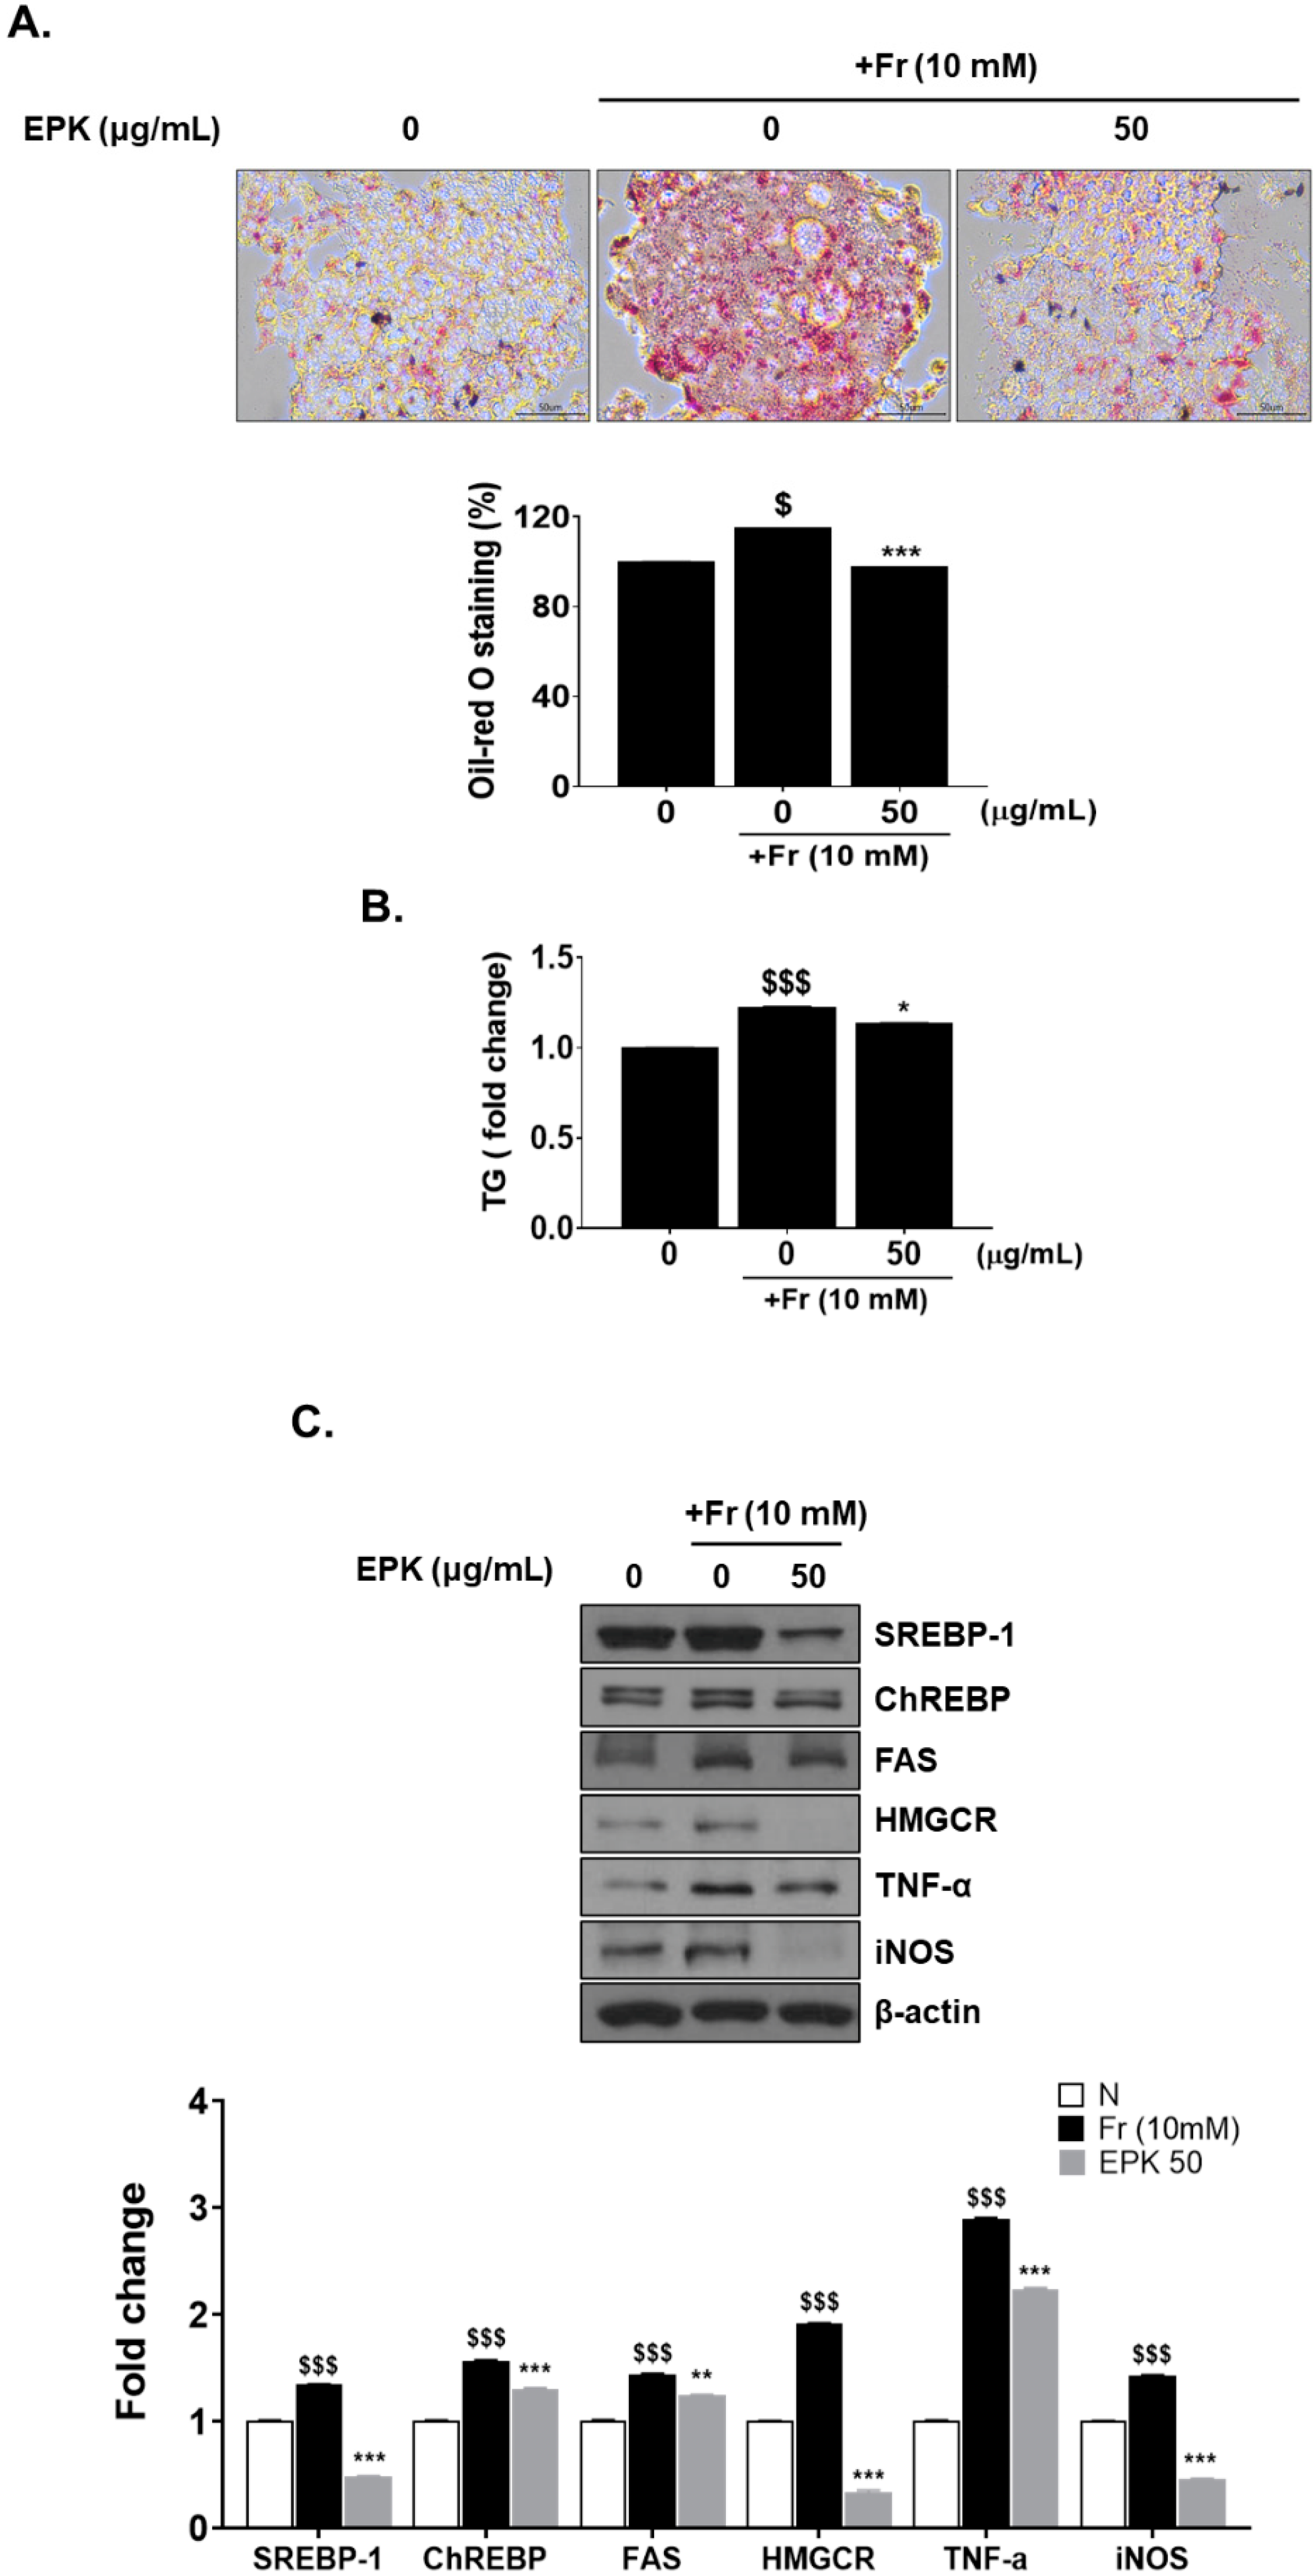
3.7. EPK Inhibited Fr-Induced Cellular Lipid Accumulation in HepG2 Cells

Here, 50 μg/mL of EPK was determined to be the concentration that did not affect cell viability. Oil Red O staining was performed to investigate whether EPK could suppress cellular lipid accumulation. Fr increased the intracellular lipid content, as shown in Figure 3A. The EPK-treated cells had fewer and smaller lipid droplets than the Fr-induced group.

3.8. EPK Decreased Fr-Induced Intracellular TG Level

Cellular TG levels were measured to determine the effect of EPK on TG accumulation in Fr-induced HepG2 cells. TG levels had increased by 21% in the Fr-induced control group, whereas TG levels had diminished by 15.3% in the EPK-treated cells, as shown in Figure 3B.

3.9. EPK Inhibited Fr-Induced Core Factors of DNL, such as SREBP-1 and ChREBP, and Their Target Enzymes

To assess the regulatory function of EPK on SREBP-1, the key lipogenesis-related factor, the expression level of SREBP-1 and FAS in Fr-induced HepG2 cells was determined. As shown in Figure 3C, Fr-treated cells displayed increased SREBP-1, ChREBP, FAS, and HMGCR expression by 1.2-, 1.5-, 1.2-, and 2-fold, respectively, compared with the control. EPK attenuated the expression of SREBP-1, ChREBP, FAS, and HMGCR that had been induced by Fr treatment (Figure 3C).

3.10. EPK Reduced Fr-Induced TNF-α and iNOS (Inflammatory Factors)

TNF-α is related to the dysfunction of hepatic lipid metabolism and insulin signaling in Fr-induced cells and in vivo models. TNF-α is associated with a systemic inflammatory response and is a hallmark of inflammation. Inflammation results in a stress response in hepatocytes that may lead to lipid accumulation. Fr has been known for inducing hepatic steatosis by enhancing the formation of reactive oxygen species by modulating iNOS. In this study, Fr-induced HepG2 cells showed an increased expression of TNF-α and iNOS. In contrast, EPK treatment attenuated the expression of TNF-α and iNOS (Figure 3C).

4. Discussion

Triglycerides are fats consisting of three fatty acids covalently bonded to a glycerol molecule and are the primary form of lipids in the liver tissue. Hypertriglyceridemia, which is related to excess accumulation of non-esterified fatty acids and cholesterol in the liver tissue, may result in hepatic steatosis, also known as NAFLD [23].
It was shown in this study, involving a rat model and Fr-induced HepG2 cells, that an HFrD caused hypertriglyceridemia, triggered hepatic TG accumulation, and amplified the expression of ChREBP and SREBP-1 and their target enzymes HMGCR and FAS on molecular lipid metabolism markers. Fructose is sweeter and cheaper than sucrose and is widely used in the food industry. Every day, we unknowingly consume food items that contain high-fructose corn syrup, such as beverages, dairy products, and baking products. Regular fructose intake contributes to the development of lipid disorders, oxidative stress, and mild chronic inflammation, which are directly associated with obesity, NAFLD, and cardiovascular diseases [24]. This concern is supported by observations in human and rodent epidemiological studies that HFrD induces hepatic intrahepatocellular lipids, hepatic DNL, and abdominal aortic thickness, and increases hepatic insulin resistance [25,26,27]. Furthermore, consistent with our data, several studies have reported that HFrD-fed rats have increased hepatic levels of upstream regulators of DNL, such as SREBP-1, ChREBP, key lipogenic enzymes, and pro-inflammatory cytokines [28,29,30,31,32]. ChREBP is a transcriptional operator of lipid and glucose metabolism, changing surplus carbohydrates into triglycerides [24]. The liver-specific inhibition of ChREBP aggravates insulin resistance, hepatic steatosis, and hypertriglyceridemia, followed by the downregulation of hepatic expression of gluconeogenetic and lipogenic genes in leptin-deficient mice [33,34]. HFrD triggers ChREBP, which acts synergistically with SREBP-1 to amplify lipogenic gene expressions [35]. SREBP-1 is stimulated by insulin [36]. SREBP-1 mediates the long-term regulation of lipid and glucose homeostasis by insulin; it alone does not appear to fully describe the stimulation of lipogenic and glycolytic gene expression in reaction to a carbohydrate diet [37].
In this study, an HFrD increased the levels of inflammatory cytokine TNF-α and the oxidative stress protein iNOS in the hepatic tissue and HepG2 cells. Consistent with our data, previous studies have shown that HFrD causes a significant increase in oxidative stress markers (lipid peroxidation) such as iNOS, active cytokines such as TNF-α, and neutrophil infiltration in the liver, indicating an inflammatory response [38]. Moreover, some studies have reported that even short-term fructose feeding induces oxidative stress and inflammation in the hippocampus [39,40]. Lipotoxicity caused by the excessive accumulation of hepatic lipids can lead to inflammation, fibrosis, and pathological angiogenesis [41].
EPK administration mitigated induced hypertriglyceridemia and hepatic steatosis. In addition, EPK downregulated the expression of lipogenesis factors, pro-inflammatory cytokine TNF-α, and iNOS. Our previous study demonstrated that EPK exerts anti-obesity effects in 3T3-L1 adipocytes and in high-fat-diet–induced obese rats [17]. Consistent with the present data, despite differences in the experimental model, EPK decreased lipid accumulation, TG levels, and SREBP-1, HMGCR, and FAS expression in the differentiated 3T3-L1 cells and high-fat-diet animal model. Many researchers, including us, have reported that P. koraiensis contains α-pinene, camphene, borneol, D-limonene, lambertianic acid, bicyclo-hept-3-ene, β-pinene, 3-carene, fencyl alcohol, and β-phellandrene. It has been reported that D-limonene has anti-inflammatory properties [42]. Camphene has also been shown to have hypolipidemic effects in hyperlipidemic rats [43]. Lambertianic acid has been reported to significantly decrease lipid accumulation and the expression of lipogenesis factors, such as SREBP-1, HMGCR, and FAS in adipocytes [17]. Therefore, the bioactive compounds that EPK contains may contribute to the mitigation of hepatic steatosis and hypertriglyceridemia in EPK-treated HFrD-induced models.
In summary, we found that EPK decreased serum and hepatic TG levels and downregulated the expression of ChREBP, SREBP-1, FAS, HMGCR, and TNF-α in HFrD-induced rat models and HepG2 cells. Finally, our findings show the potential of EPK as an anti-hypertriglyceridemic and anti-NAFLD agent.

Author Contributions

H.-J.L.: project administration, methodology, writing—original draft preparation. M.-H.L.: validation, resource, data curation. S.P.: investigation, validation, data curation. Y.X. and J.-E.K.: validation, investigation, data curation. H.H.: investigation, data curation. J.-H.L.: software. J.K.P.: validation. All authors have read and agreed to the published version of the manuscript.

Funding

This work was supported by the Technology Development Program (S3004306) funded by the Ministry of SMEs and Startups (MSS, Korea).

Institutional Review Board Statement

The International Animal Care Use for Research Committee of Biotoxtech approved the protocol for animal use (210163: 29 March 2021) in the present study. Handling of laboratory rats was performed according to the Association for Assessment and Accreditation of Laboratory Animal Care International recommendations and protocols.

Informed Consent Statement

Not applicable.

Conflicts of Interest

We declare that the research was conducted in the absence of any commercial or financial relationship that could be construed as a potential conflict of interest.

References

  1. Khosrow, A.; Lisa, F.; Heather, B. Fructose, insulin resistance, and metabolic dyslipidemia. Nutr. Metab. 2005, 2, 5. [Google Scholar]
  2. Hallfrisch, J. Metabolic effects of dietary fructose. FASEB J. 1990, 4, 2652–2660. [Google Scholar] [CrossRef] [PubMed]
  3. Mayes, P.A. Intermediary metabolism of fructose. Am. J. Clin. Nutr. 1993, 58, 754S–765S. [Google Scholar] [CrossRef] [PubMed]
  4. Tetri, L.H.; Basaranoglu, M.; Brunt, E.M.; Yerian, L.M.; Neuschwander-Tetri, B.A. Severe NAFLD with hepatic necroinflammatory changes in mice fed trans fats and a high-fructose corn syrup equivalent. Am. J. Physiol.-Gastrointest. Liver Physiol. 2008, 295, G987–G995. [Google Scholar] [CrossRef]
  5. Sobrecases, H.; Lê, K.-A.; Bortolotti, M.; Schneiter, P.; Ith, M.; Kreis, R.; Boesch, C.; Tappy, L. Effects of short-term overfeeding with fructose, fat and fructose plus fat on plasma and hepatic lipids in healthy men. Diabetes Metab. 2010, 36, 244–246. [Google Scholar] [CrossRef]
  6. Softic, S.; Cohen, D.E.; Kahn, C.R. Role of dietary fructose and hepatic de novo lipogenesis in fatty liver disease. Dig. Dis. Sci. 2016, 61, 1282–1293. [Google Scholar] [CrossRef] [Green Version]
  7. Jegatheesan, P.; De Bandt, J.P. Fructose and NAFLD: The multifaceted aspects of fructose metabolism. Nutrients 2017, 9, 230. [Google Scholar] [CrossRef] [Green Version]
  8. Zavaroni, I.; Chen, Y.-D.I.; Reaven, G.M. Studies of the mechanism of fructose-induced hypertriglyceridemia in the rat. Metabolism 1982, 31, 1077–1083. [Google Scholar] [CrossRef]
  9. Bhatt, D.; Tannock, L. Risk of fasting and non-fasting hypertriglyceridemia in coronary vascular disease and pancreatitis. In Endotext; MDText.com, Inc.: South Dartmouth, MA, USA, 2018. [Google Scholar]
  10. Siri-Tarino, P.W.; Krauss, R.M. The early years of lipoprotein research: From discovery to clinical application. J. Lipid Res. 2016, 57, 1771–1777. [Google Scholar] [CrossRef] [Green Version]
  11. Herman, M.A.; Samuel, V.T. The sweet path to metabolic demise: Fructose and lipid synthesis. Trends Endocrinol. Metab. 2016, 27, 719–730. [Google Scholar] [CrossRef] [Green Version]
  12. Jegatheesan, P.; Beutheu, S.; Ventura, G.; Nubret, E.; Sarfati, G.; Bergheim, I.; De Bandt, J.-P. Citrulline and nonessential amino acids prevent fructose-induced nonalcoholic fatty liver disease in rats. J. Nutr. 2015, 145, 2273–2279. [Google Scholar] [CrossRef] [PubMed] [Green Version]
  13. Li, X.; Li, Y.; Yang, W.; Xiao, C.; Fu, S.; Deng, Q.; Ding, H.; Wang, Z.; Liu, G.; Li, X. SREBP-1c overexpression induces triglycerides accumulation through increasing lipid synthesis and decreasing lipid oxidation and VLDL assembly in bovine hepatocytes. J. Steroid Biochem. Mol. Biol. 2014, 143, 174–182. [Google Scholar] [CrossRef] [PubMed]
  14. Kim, M.-S.; Krawczyk, S.A.; Doridot, L.; Fowler, A.J.; Wang, J.X.; Trauger, S.A.; Noh, H.-L.; Kang, H.J.; Meissen, J.K.; Blatnik, M. ChREBP regulates fructose-induced glucose production independently of insulin signaling. J. Clin. Investig. 2019, 126, 4372–4386. [Google Scholar] [CrossRef] [PubMed] [Green Version]
  15. Iizuka, K.; Takao, K.; Kato, T.; Horikawa, Y.; Takeda, J. ChREBP reciprocally regulates liver and plasma triacylglycerol levels in different manners. Nutrients 2018, 10, 1699. [Google Scholar] [CrossRef] [Green Version]
  16. Cho, S.-M.; Lee, E.-O.; Kim, S.-H.; Lee, H.-J. Essential oil of Pinus koraiensis inhibits cell proliferation and migration via inhibition of p21-activated kinase 1 pathway in HCT116 colorectal cancer cells. BMC Complementary Altern. Med. 2014, 14, 275. [Google Scholar] [CrossRef] [Green Version]
  17. Lee, M.-S.; Cho, S.-M.; Lee, M.-h.; Lee, E.-O.; Kim, S.-H.; Lee, H.-J. Ethanol extract of Pinus koraiensis leaves containing lambertianic acid exerts anti-obesity and hypolipidemic effects by activating adenosine monophosphate-activated protein kinase (AMPK). BMC Complementary Altern. Med. 2016, 16, 51. [Google Scholar] [CrossRef] [Green Version]
  18. Joo, H.-E.; Lee, H.-J.; Sohn, E.J.; Lee, M.-H.; Ko, H.-S.; Jeong, S.-J.; Lee, H.-J.; Kim, S.-H. Anti-diabetic potential of the essential oil of Pinus koraiensis leaves toward streptozotocin-treated mice and HIT-T15 pancreatic β cells. Biosci. Biotechnol. Biochem. 2013, 77, 1997–2001. [Google Scholar] [CrossRef] [Green Version]
  19. Folch, J.; Lees, M.; Sloane Stanley, G.H. A simple method for the isolation and purification of total lipids from animal tissues. J. Biol. Chem. 1957, 226, 497–509. [Google Scholar] [CrossRef]
  20. Lee, S.-O.; Xu, Y.; Han, H.; Jeong, S.-T.; Lee, Y.-K.; Paik, J.K.; Cha, J.-S.; Lee, H.-J. Fermented Rhus verniciflua Stokes extract alleviates nonalcoholic fatty liver through the AMPK/SREBP1/PCSK9 pathway in HFD-induced nonalcoholic fatty liver animal model. Appl. Sci. 2020, 10, 6833. [Google Scholar] [CrossRef]
  21. Xu, Y.; Cha, J.-S.; Lee, S.-O.; Ryu, S.-I.; Lee, Y.-K.; Han, H.; Kim, J.-E.; Lee, M.-H.; Lee, E.-O.; Lee, H.-J. HMT Exerts an Anticancer Effect by Targeting PAK-1. Appl. Sci. 2021, 11, 6034. [Google Scholar] [CrossRef]
  22. Lee, M.-S.; Kim, J.-S.; Cho, S.-M.; Lee, S.O.; Kim, S.-H.; Lee, H.-J. Fermented Rhus verniciflua Stokes extract exerts an Antihepatic Lipogenic effect in oleic-acid-induced HepG2 cells via Upregulation of AMP-activated protein kinase. J. Agric. Food Chem. 2015, 63, 7270–7276. [Google Scholar] [CrossRef] [PubMed]
  23. Ballestri, S.; Nascimbeni, F.; Romagnoli, D.; Baldelli, E.; Lonardo, A. The role of nuclear receptors in the pathophysiology, natural course, and drug treatment of NAFLD in humans. Adv. Ther. 2016, 33, 291–319. [Google Scholar] [CrossRef] [PubMed]
  24. Ter Horst, K.W.; Serlie, M.J. Fructose consumption, lipogenesis, and non-alcoholic fatty liver disease. Nutrients 2017, 9, 981. [Google Scholar] [CrossRef] [PubMed] [Green Version]
  25. Ma, J.; Fox, C.S.; Jacques, P.F.; Speliotes, E.K.; Hoffmann, U.; Smith, C.E.; Saltzman, E.; McKeown, N.M. Sugar-sweetened beverage, diet soda, and fatty liver disease in the Framingham Heart Study cohorts. J. Hepatol. 2015, 63, 462–469. [Google Scholar] [CrossRef] [PubMed] [Green Version]
  26. Choi, Y.; Abdelmegeed, M.A.; Song, B.-J. Diet high in fructose promotes liver steatosis and hepatocyte apoptosis in C57BL/6J female mice: Role of disturbed lipid homeostasis and increased oxidative stress. Food Chem. Toxicol. 2017, 103, 111–121. [Google Scholar] [CrossRef] [PubMed] [Green Version]
  27. Handayani, D.; Febrianingsih, E.; Kurniawati, A.D.; Kusumastuty, I.; Nurmalitasari, S.; Widyanto, R.M.; Oktaviani, D.N.; Innayah, A.M.; Sulistyowati, E. High-fructose diet initially promotes increased aortic wall thickness, liver steatosis, and cardiac histopathology deterioration, but does not increase body fat index. J. Public Health Res. 2021, 10, 2181. [Google Scholar] [CrossRef] [PubMed]
  28. Ren, L.-P.; Song, G.-Y.; Hu, Z.-J.; Zhang, M.; Peng, L.; Chen, S.-C.; Wei, L.; Li, F.; Sun, W. The chemical chaperon 4-phenylbutyric acid ameliorates hepatic steatosis through inhibition of de novo lipogenesis in high-fructose-fed rats. Int. J. Mol. Med. 2013, 32, 1029–1036. [Google Scholar] [CrossRef] [Green Version]
  29. Nakamura, K.; Fukunishi, S.; Yokohama, K.; Ohama, H.; Tsuchimoto, Y.; Asai, A.; Tsuda, Y.; Higuchi, K. A long-lasting dipeptidyl peptidase-4 inhibitor, teneligliptin, as a preventive drug for the development of hepatic steatosis in high-fructose diet-fed ob/ob mice. Int. J. Mol. Med. 2017, 39, 969–983. [Google Scholar] [CrossRef] [Green Version]
  30. Yu, X.; Ren, L.-P.; Wang, C.; Zhu, Y.-J.; Xing, H.-Y.; Zhao, J.; Song, G.-Y. Role of X-box binding protein-1 in fructose-induced de novo lipogenesis in HepG2 cells. Chin. Med. J. 2018, 131, 2310–2319. [Google Scholar] [CrossRef]
  31. Vasiljević, A.; Bursać, B.; Djordjevic, A.; Milutinović, D.V.; Nikolić, M.; Matić, G.; Veličković, N. Hepatic inflammation induced by high-fructose diet is associated with altered 11βHSD1 expression in the liver of Wistar rats. Eur. J. Nutr. 2014, 53, 1393–1402. [Google Scholar] [CrossRef]
  32. Gao, H.; Guan, T.; Li, C.; Zuo, G.; Yamahara, J.; Wang, J.; Li, Y. Treatment with ginger ameliorates fructose-induced Fatty liver and hypertriglyceridemia in rats: Modulation of the hepatic carbohydrate response element-binding protein-mediated pathway. Evid.-Based Complement. Altern. Med. 2012, 2012, 570948. [Google Scholar] [CrossRef] [PubMed]
  33. Dentin, R.; Benhamed, F.; Hainault, I.; Fauveau, V.; Foufelle, F.; Dyck, J.R.; Girard, J.; Postic, C. Liver-specific inhibition of ChREBP improves hepatic steatosis and insulin resistance in ob/ob mice. Diabetes 2006, 55, 2159–2170. [Google Scholar] [CrossRef] [PubMed] [Green Version]
  34. Iizuka, K.; Miller, B.; Uyeda, K. Deficiency of carbohydrate-activated transcription factor ChREBP prevents obesity and improves plasma glucose control in leptin-deficient (ob/ob) mice. Am. J. Physiol.-Endocrinol. Metab. 2006, 291, E358–E364. [Google Scholar] [CrossRef] [PubMed] [Green Version]
  35. Tappy, L.; Lê, K.-A. Metabolic effects of fructose and the worldwide increase in obesity. Physiol. Rev. 2010, 90, 23–46. [Google Scholar] [CrossRef] [Green Version]
  36. Postic, C.; Girard, J. Contribution of de novo fatty acid synthesis to hepatic steatosis and insulin resistance: Lessons from genetically engineered mice. J. Clin. Investig. 2008, 118, 829–838. [Google Scholar] [CrossRef] [Green Version]
  37. Postic, C.; Dentin, R.; Denechaud, P.-D.; Girard, J. ChREBP, a transcriptional regulator of glucose and lipid metabolism. Annu. Rev. Nutr. 2007, 27, 179–192. [Google Scholar] [CrossRef]
  38. Kanuri, G.; Spruss, A.; Wagnerberger, S.; Bischoff, S.C.; Bergheim, I. Role of tumor necrosis factor α (TNFα) in the onset of fructose-induced nonalcoholic fatty liver disease in mice. J. Nutr. Biochem. 2011, 22, 527–534. [Google Scholar] [CrossRef]
  39. Cigliano, L.; Spagnuolo, M.S.; Crescenzo, R.; Cancelliere, R.; Iannotta, L.; Mazzoli, A.; Liverini, G.; Iossa, S. Short-term fructose feeding induces inflammation and oxidative stress in the hippocampus of young and adult rats. Mol. Neurobiol. 2018, 55, 2869–2883. [Google Scholar] [CrossRef]
  40. Van der Borght, K.; Köhnke, R.; Göransson, N.; Deierborg, T.; Brundin, P.; Erlanson-Albertsson, C.; Lindqvist, A. Reduced neurogenesis in the rat hippocampus following high fructose consumption. Regul. Pept. 2011, 167, 26–30. [Google Scholar] [CrossRef]
  41. Povero, D.; Feldstein, A.E. Novel molecular mechanisms in the development of non-alcoholic steatohepatitis. Diabetes Metab. J. 2016, 40, 1–11. [Google Scholar] [CrossRef] [Green Version]
  42. d’Alessio, P.A.; Ostan, R.; Bisson, J.-F.; Schulzke, J.D.; Ursini, M.V.; Béné, M.C. Oral administration of d-limonene controls inflammation in rat colitis and displays anti-inflammatory properties as diet supplementation in humans. Life Sci. 2013, 92, 1151–1156. [Google Scholar] [CrossRef] [PubMed]
  43. Vallianou, I.; Peroulis, N.; Pantazis, P.; Hadzopoulou-Cladaras, M. Camphene, a plant-derived monoterpene, reduces plasma cholesterol and triglycerides in hyperlipidemic rats independently of HMG-CoA reductase activity. PLoS ONE 2011, 6, e20516. [Google Scholar] [CrossRef] [PubMed] [Green Version]
Figure 1. Effect of EPK on triglyceride levels (TG) in HFrD rat model. (A) Serum TG level measured every two weeks. (B) Liver TG level. (C) Fecal TG level. Data are expressed as mean ± SD. * p < 0.05 and ** p < 0.01 versus HFrD control group. $ p < 0.05, $$ p < 0.01, and $$$ p < 0.001 versus normal group.
Applsci 12 06745 g001
Figure 2. Effect of EPK on SREBP-1 and FAS in HFrD rats (A) The liver pathology (B) Analysis of SREBP-1 mRNA level in liver tissue. Values were indicated as mean ± SD in each group. * p < 0.05 and ** p < 0.01 versus the HFrD control group. $ p < 0.05 versus normal group. (C) SREBP-1, ChREBP, FAS, HMGCR, and TNFα protein expression in liver tissue. Quantitative protein levels are shown in the bar graph as mean ± SD. * p < 0.05, ** p < 0.01, and *** p < 0.001 versus HFrD control group. $ p < 0.05, $$ p < 0.01, and $$$ p < 0.001 versus normal group.
Applsci 12 06745 g002aApplsci 12 06745 g002b
Figure 3. Effect of EPK on lipid synthesis in high-fructose (HF)-induced HepG2 cells. HepG2 cells were pretreated with 10 mM fructose for 48 h, and then EPK (50 μg/mL) and fructose (10 mM) were treated on the HepG2 cells for 24 h. (A) Effect of EPK on lipid accumulation in fructose-induced HepG2 cells. An Oil-Red-O-stained cell represents an accumulation of lipid. The graph showed a percentage of cellular lipid accumulation. *** p < 0.001 versus HFrD control group. $ p < 0.05 versus normal group. (B) Effect of EPK on TG content in fructose-induced HepG2 cells. The bar graph represents the TG contents as the mean ± SD. * p < 0.05 versus HFrD control, $$$ p < 0.001 versus normal group. (C) Effect of EPK on SREBP-1, ChREBP, FAS, HMGCR, TNF-α, and iNOS protein levels by Western blotting assay. Quantitative protein levels are shown in the bar graph as mean ± SD. ** p < 0.01 and *** p < 0.001 versus HFrD control group. $$$ p < 0.001 versus normal control.
Applsci 12 06745 g003
Table 1. Animal groups and treatment.
GroupRoutes of AdministrationDosage (mg/kg)No. of Mice
NormalOral administration08
HFrD (High fructose diet)08
EPK 60608
EPK 1251258
EPK 2502508
Omega-35008
Means ± SD.
Table 2. Body weight in experimental groups.
GroupTime after Administration (Days)
Body Weight (g)% of BW Change
Day1Day22
N427.08 ± 31.83538.16 ± 47.62+25.92 ± 3.65
HFrD418.27 ± 9.82530.20 ± 28.36+26.76 ± 6.07
EPK 60405.36 ± 17.08503.16 ± 16.79+24.74 ± 1.90
EPK 125390.32 ± 16.53492.51 ± 29.85+26.21 ± 6.51
EPK 250408.18 ± 14.16518.51 ± 26.61+27.01 ± 4.27
Omega-3417.59 ± 9.94510.38 ± 44.97+22.34 ± 11.77
Means ± SD.
Table 3. Serum lipid markers in experimental groups.
GroupConcentration (mg/dL)/Time after Administration (Days)
Total CholesterolHDL-CLDL-C
Day1Day29% of Total Cholesterol ChangeDay1Day29% of HDL-C ChangeDay1Day29% of LDL-C Change
N102 ± 14.42100.29 ± 15.84−1.13 ± 13.9533.46 ± 3.8629.21 ± 3.97−12.24 ± 10.659.82 ± 1.589.36 ± 2.96−5.80 ± 17.73
HFrD82.57 ± 13.2190.86 ± 10.14+11.97 ± 18.0729.18 ± 3.6427.9 ± 2.42−2.00 ± 13.875.84 ± 0.806.98 ± 1.38+18.92 ± 10.47
EPK 6089.57 ± 12.8185.14 ± 15.02−4.09 ± 16.1832.21 ± 5.8927.2 ± 4.87−14.52 ± 13.875.78 ± 1.865.7 ± 1.45+0.44 ± 16.66
EPK 12585.86 ± 16.4392.71 ± 20.69+8.58 ± 16.0330.65 ± 5.0632.87 ± 6.11+6.81 ± 16.615.62 ± 0.496.06 ± 0.79+8.10 ± 13.70
EPK 25086.57 ± 2.8894.43 ± 21.53+9.42 ± 26.7733.58 ± 1.8230.99 ± 3.94−7.65 ± 15.925.42 ± 0.985.9 ± 0.65+10.24 ± 12.89
Omega-390.71 ± 9.2371.29 ± 3.95−20.49 ± 11.5433.56 ± 2.1525.65 ± 1.83−24.41 ± 7.585.58 ± 0.675.8 ± 0.58+4.31 ± 6.57
Means ± SD.
Publisher’s Note: MDPI stays neutral with regard to jurisdictional claims in published maps and institutional affiliations.

