Impact and a Novel Representation of Spatial Data Uncertainty in Debris Flow Susceptibility Analysis
Abstract
1. Introduction
2. Study Area
3. Materials and Methods
4. Results
4.1. Impact of Locational Uncertainty on Precipitation as a Predisposing Factor
4.2. Impact of Locational Uncertainty on Fault Density as a Predisposing Factor
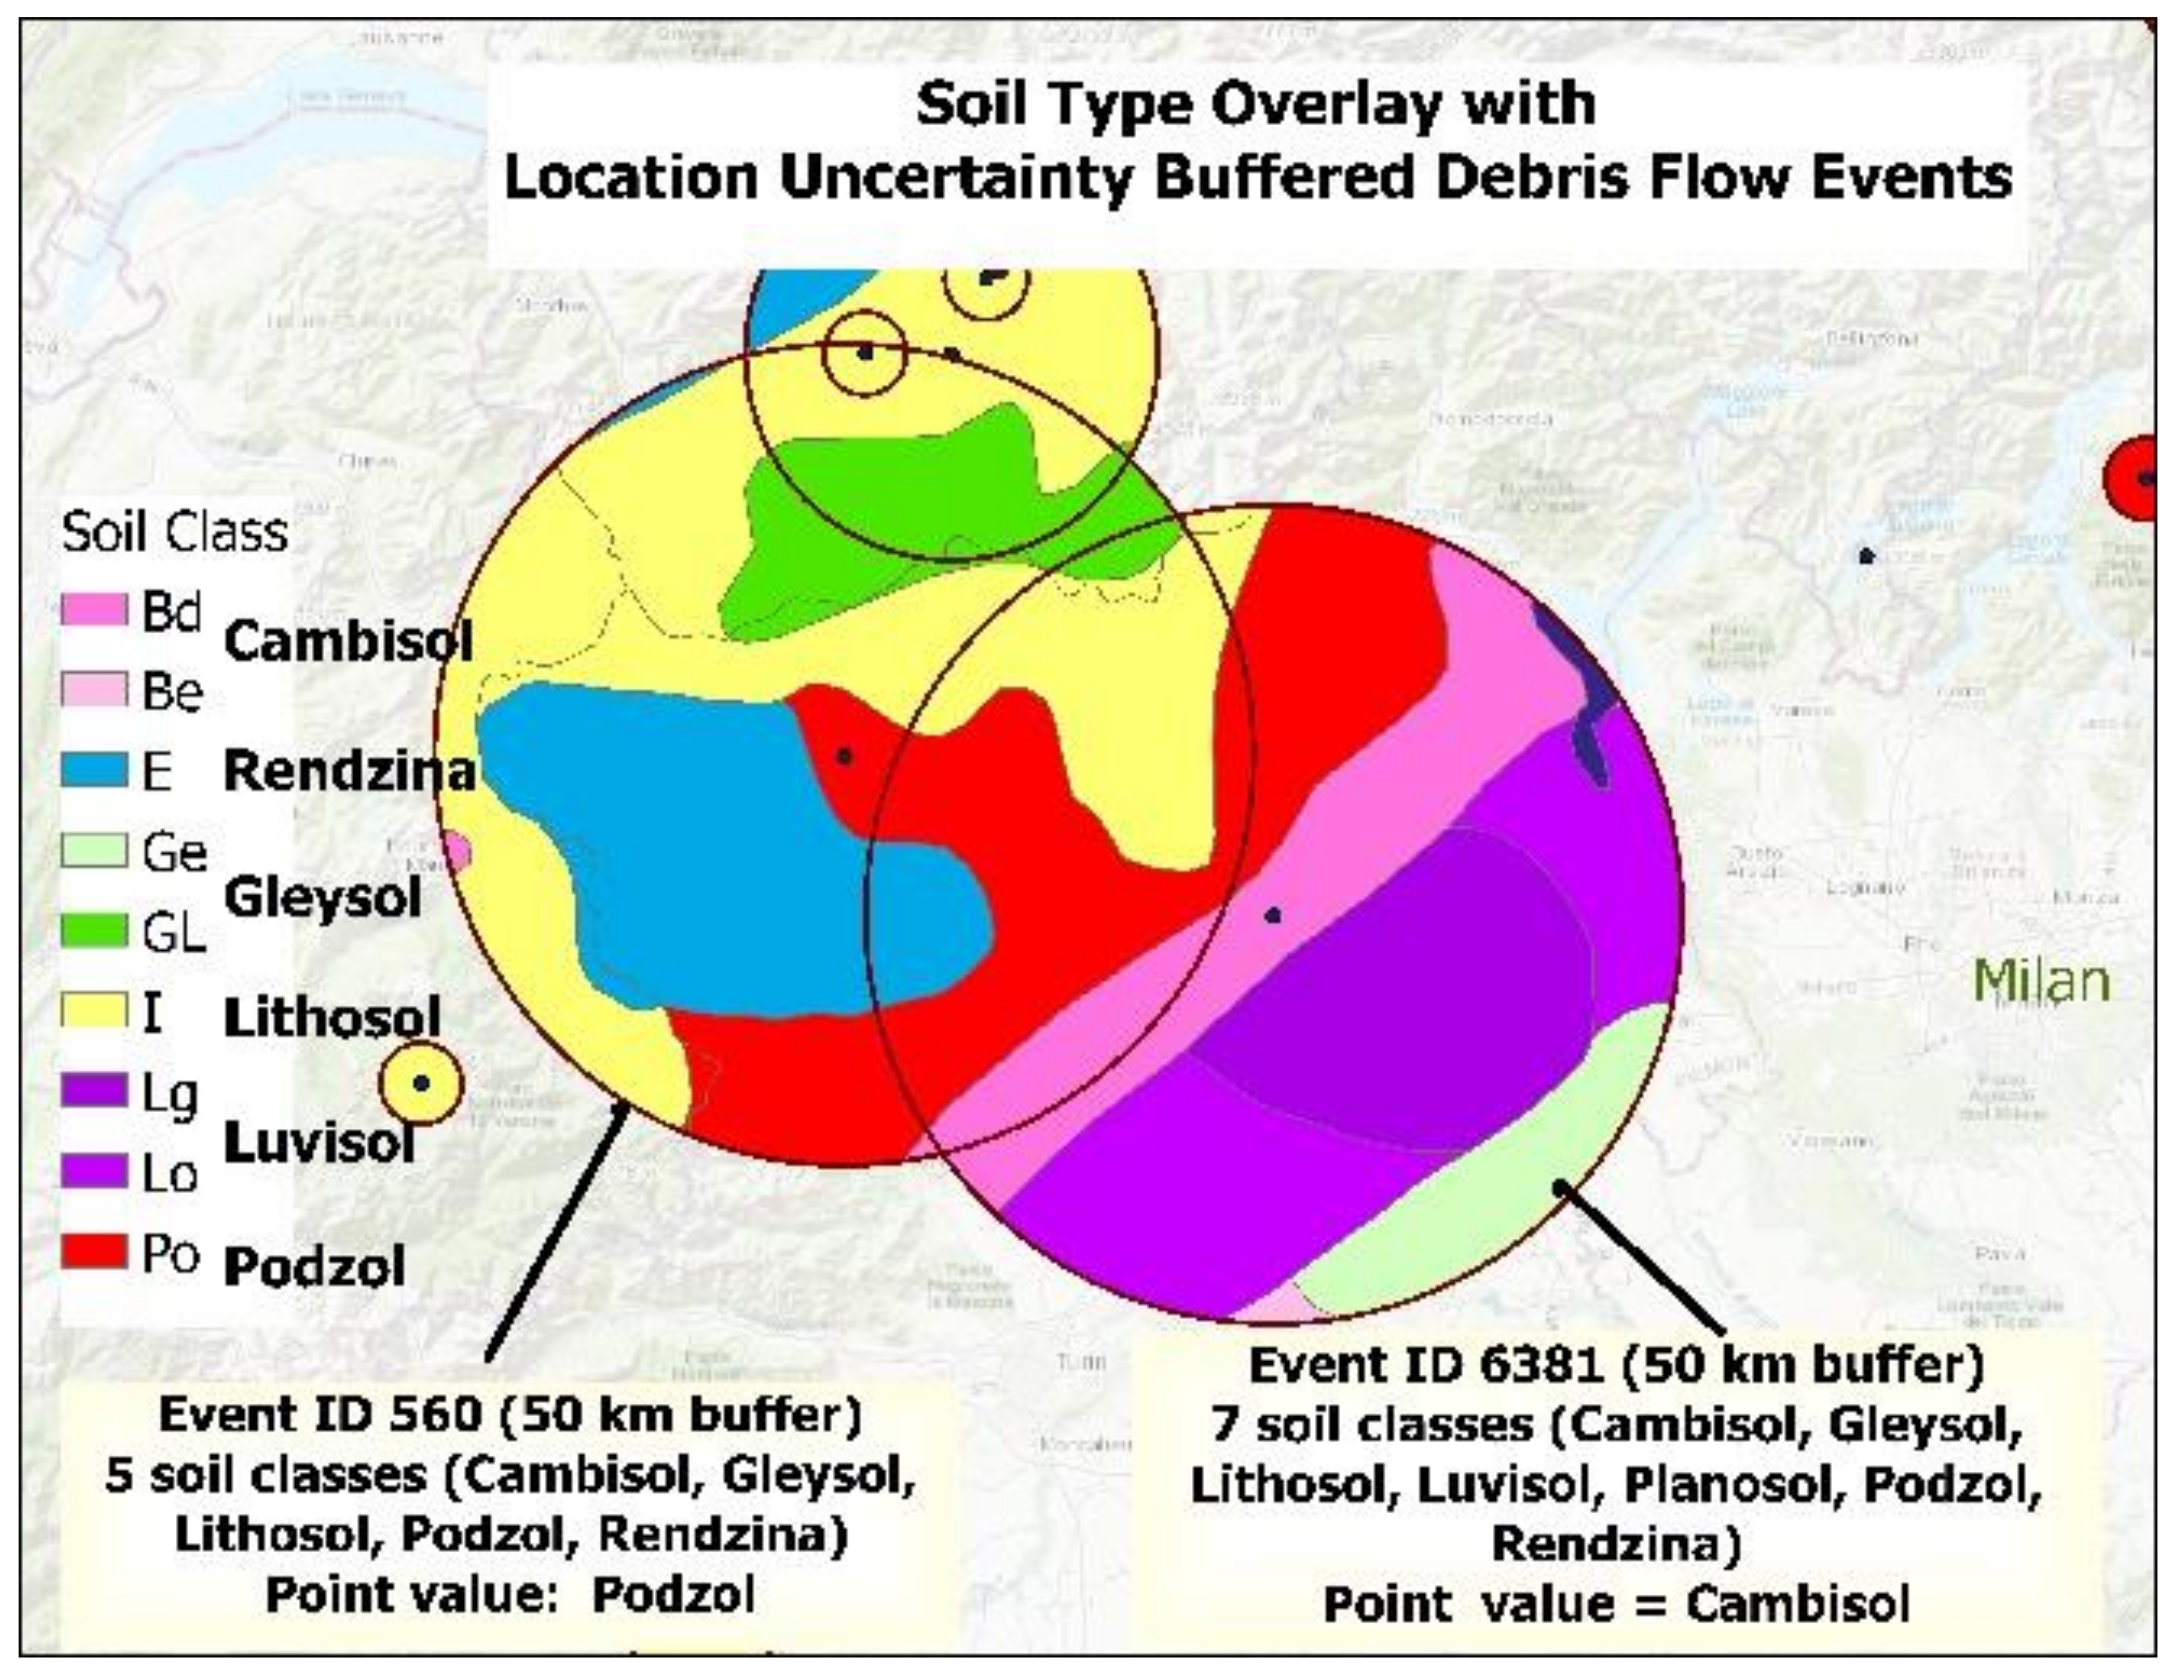
4.3. Impact of Locational Uncertainty on Soil as a Predisposing Factor
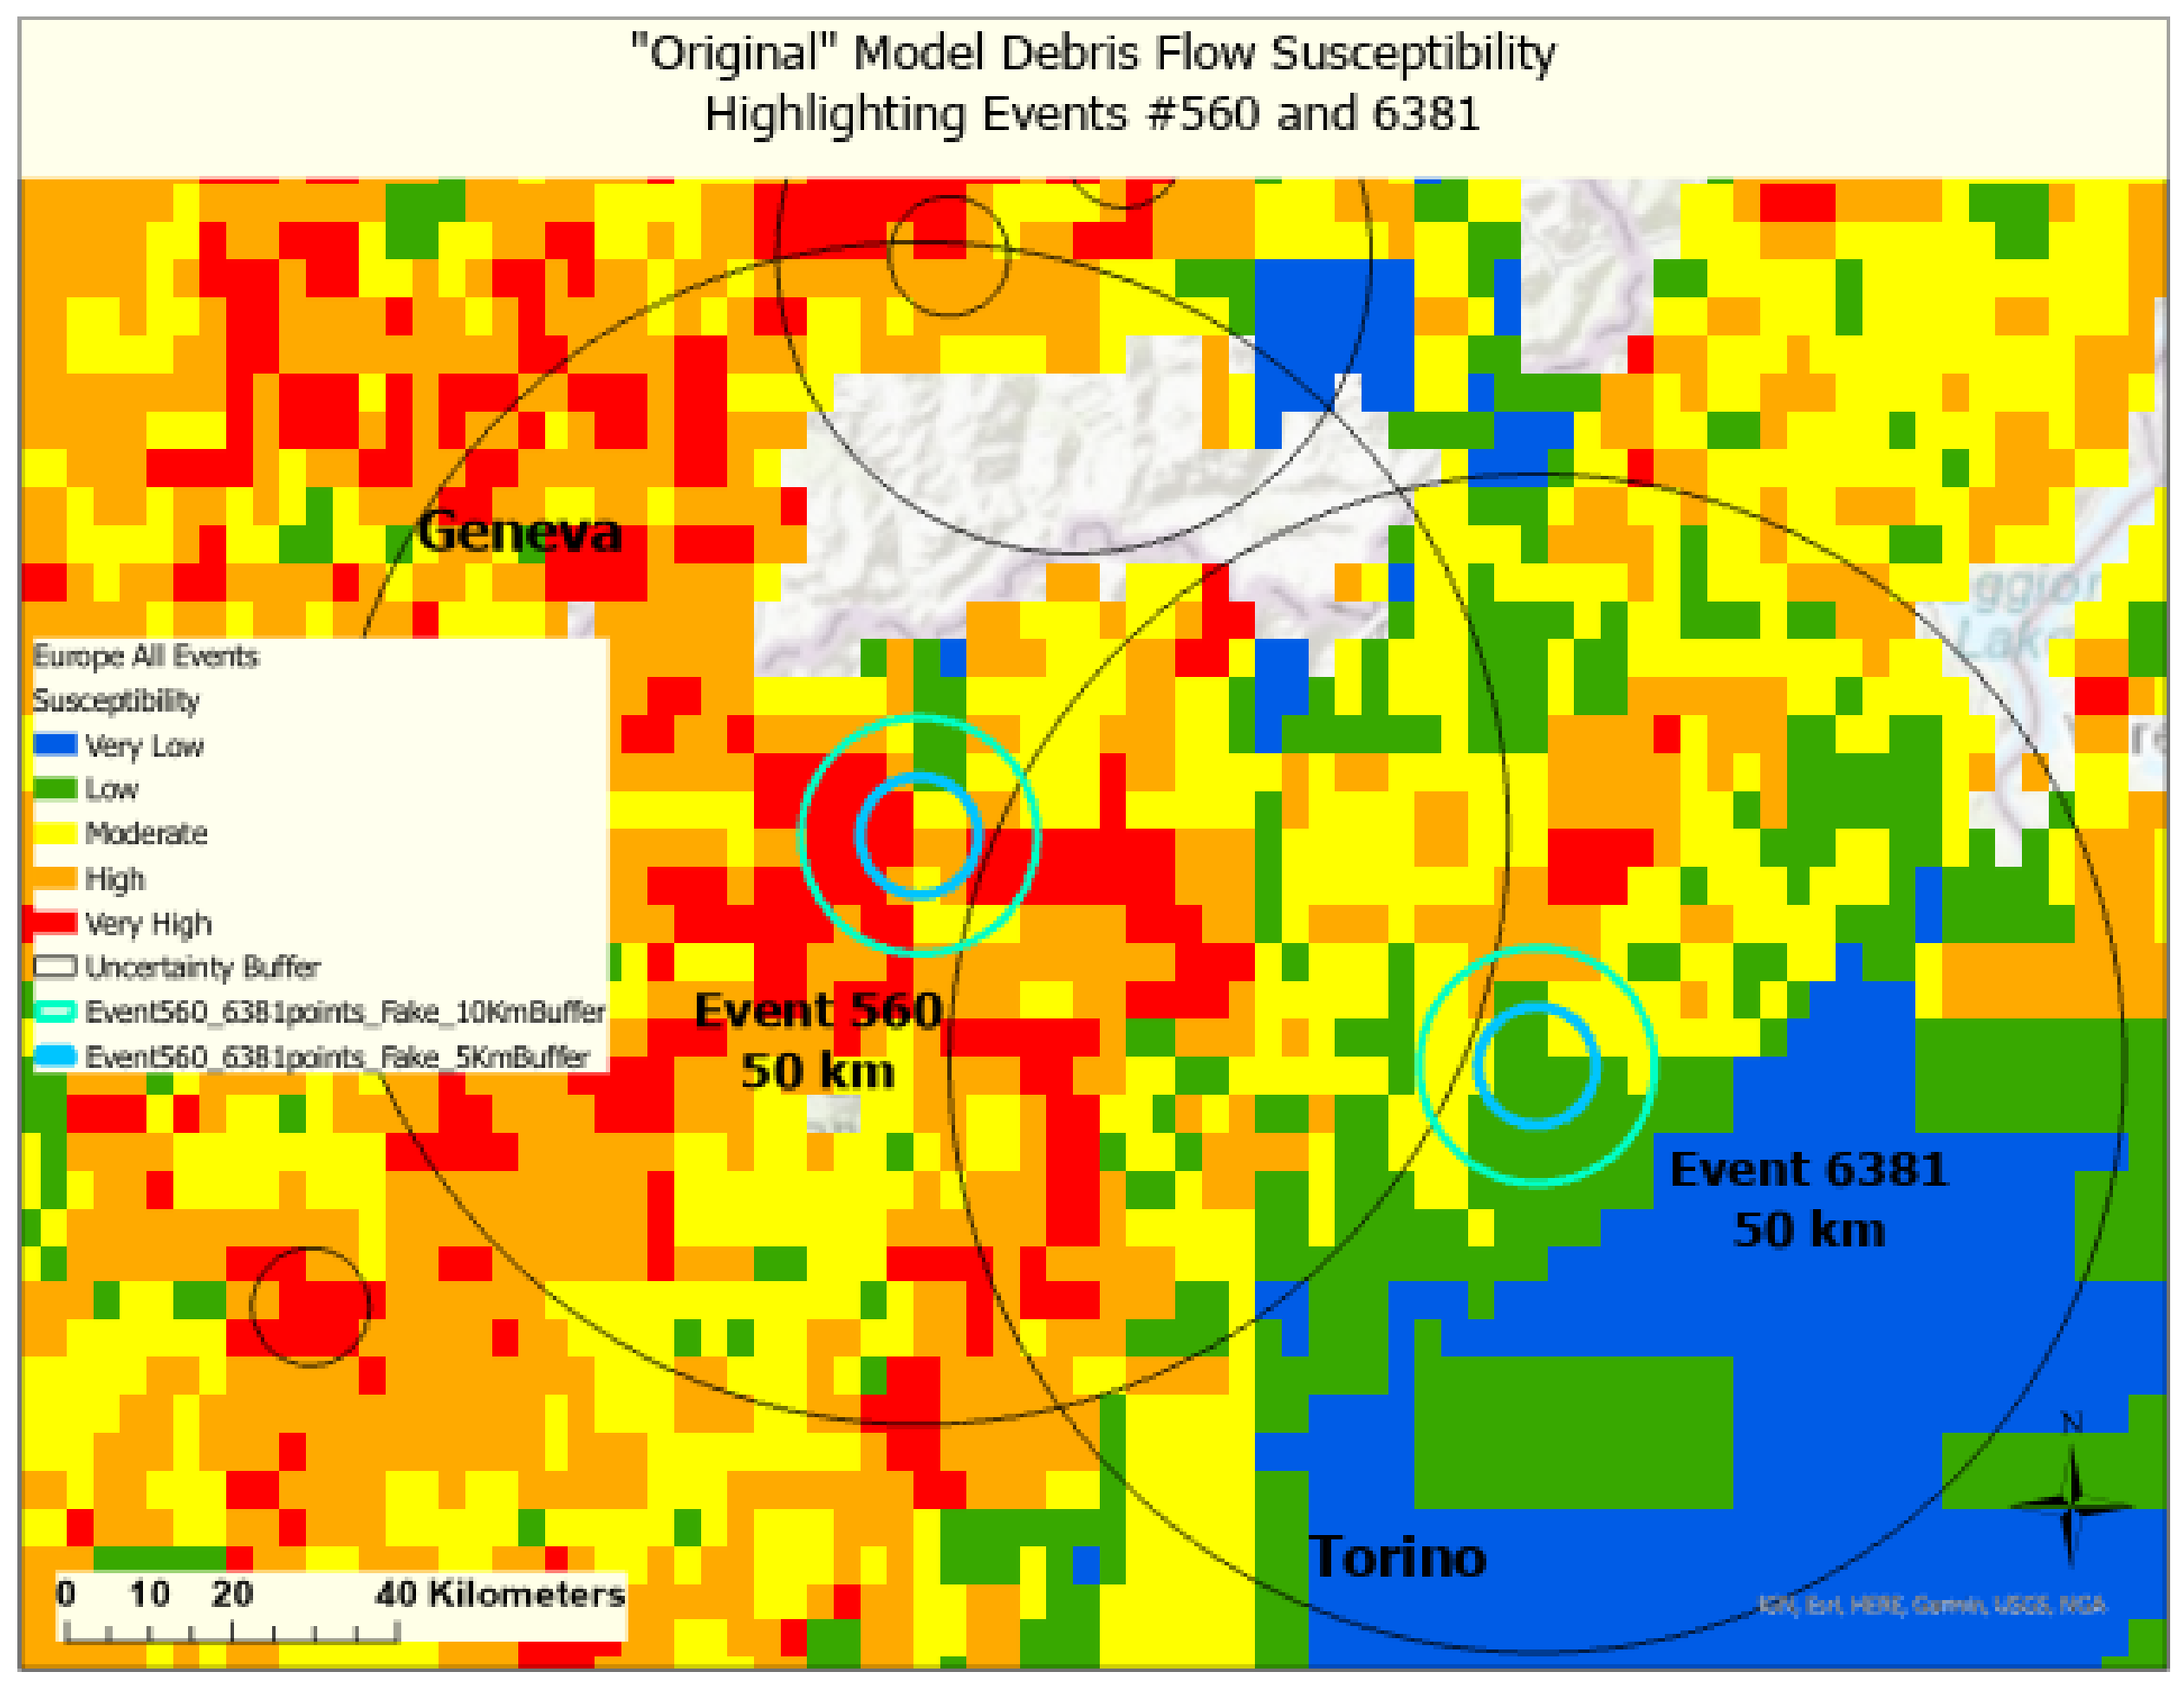
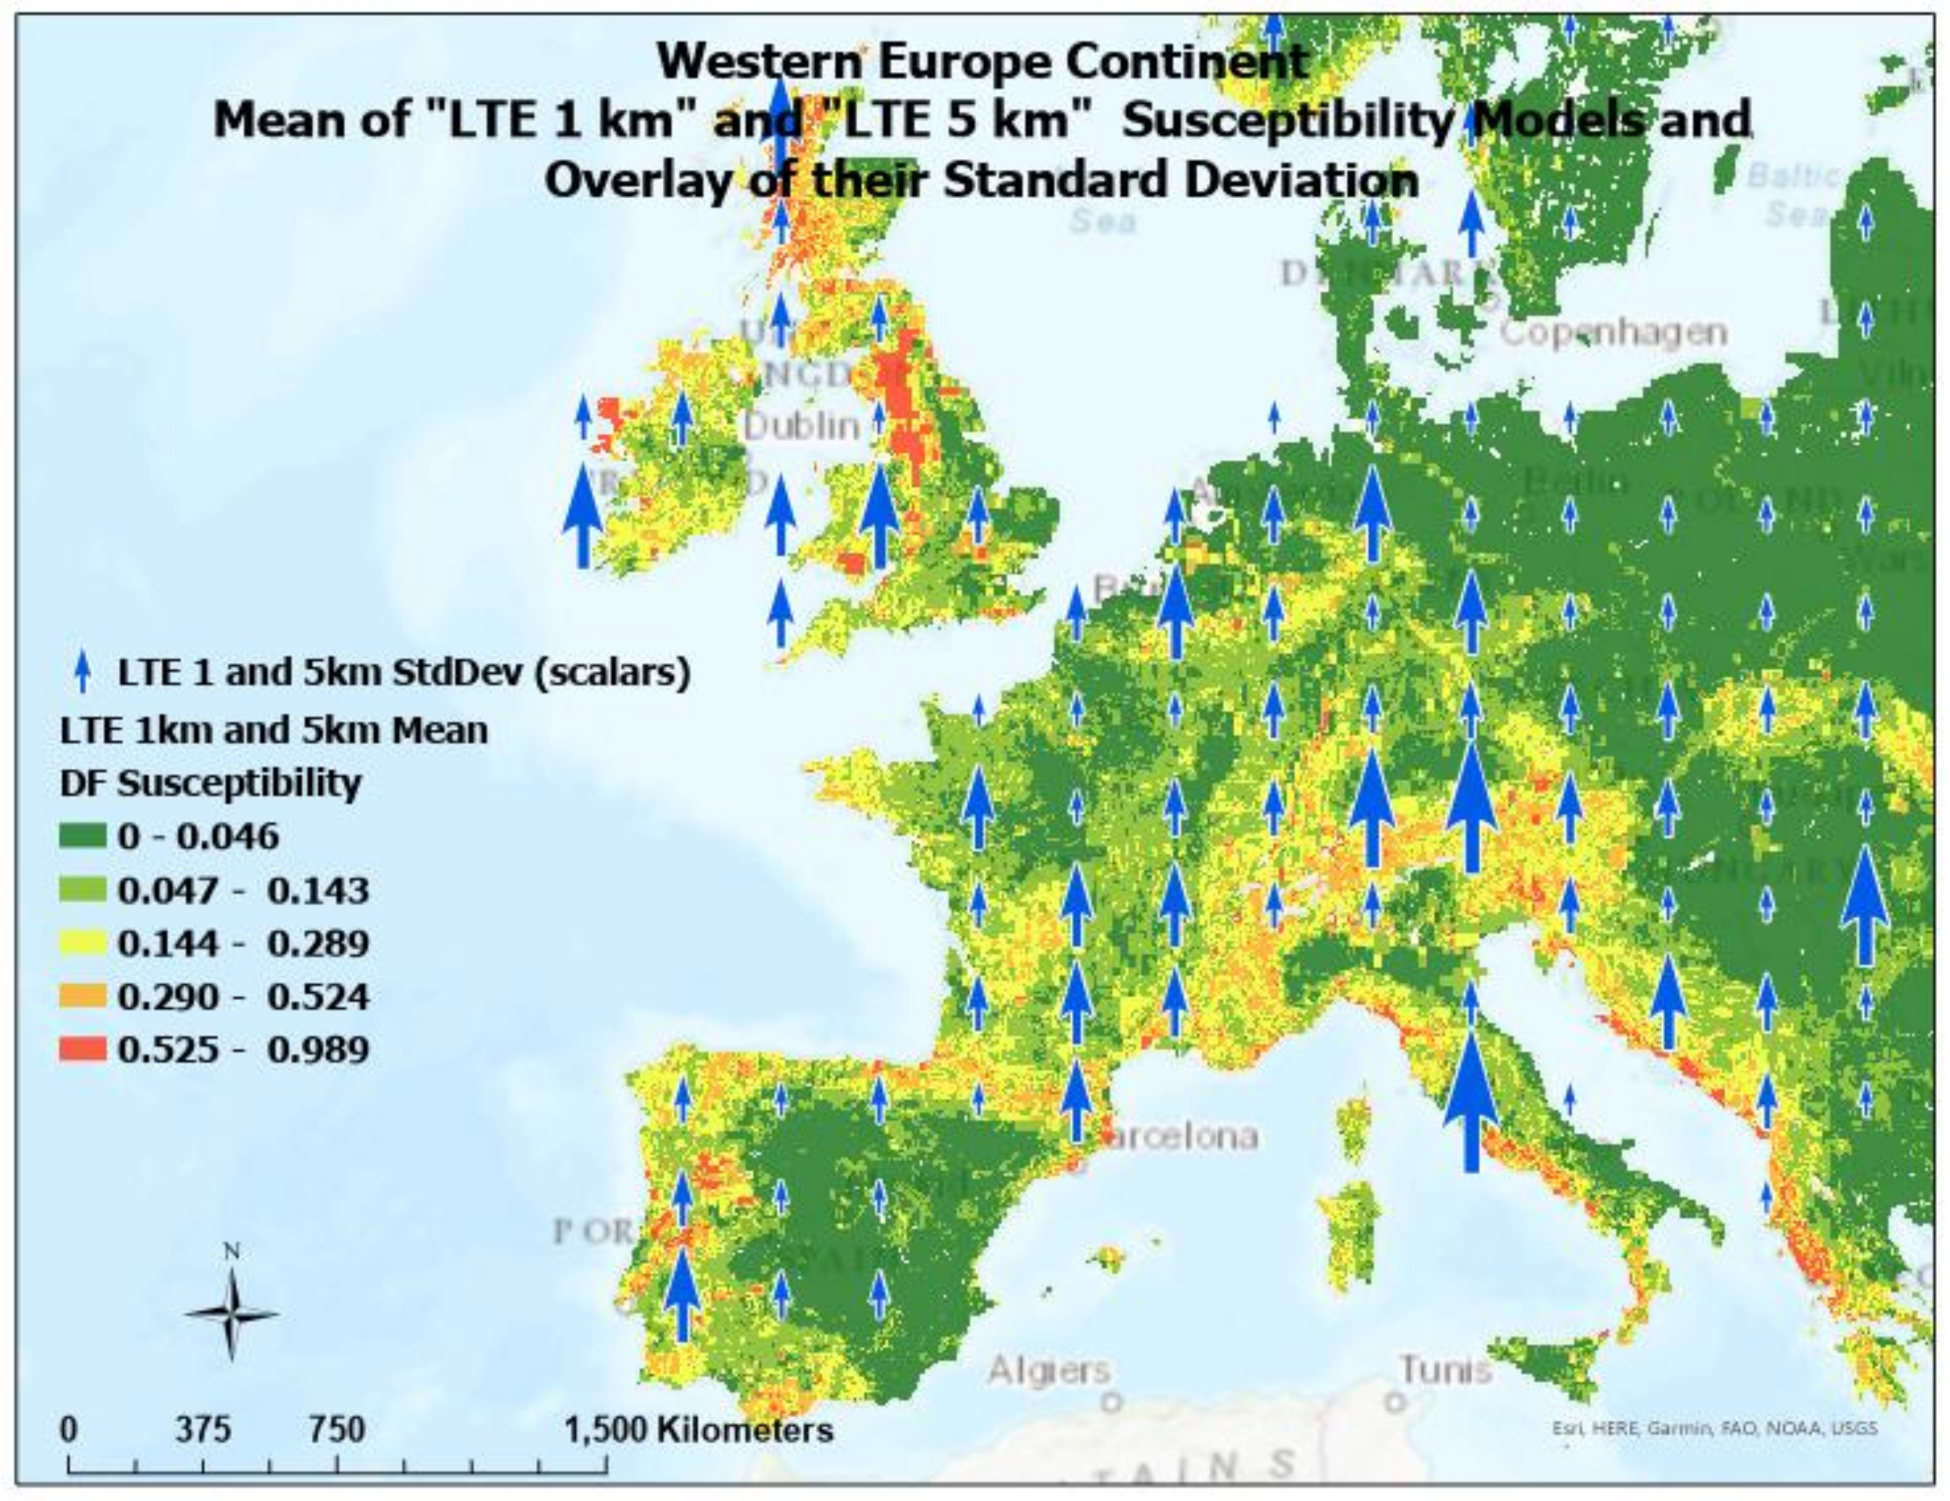
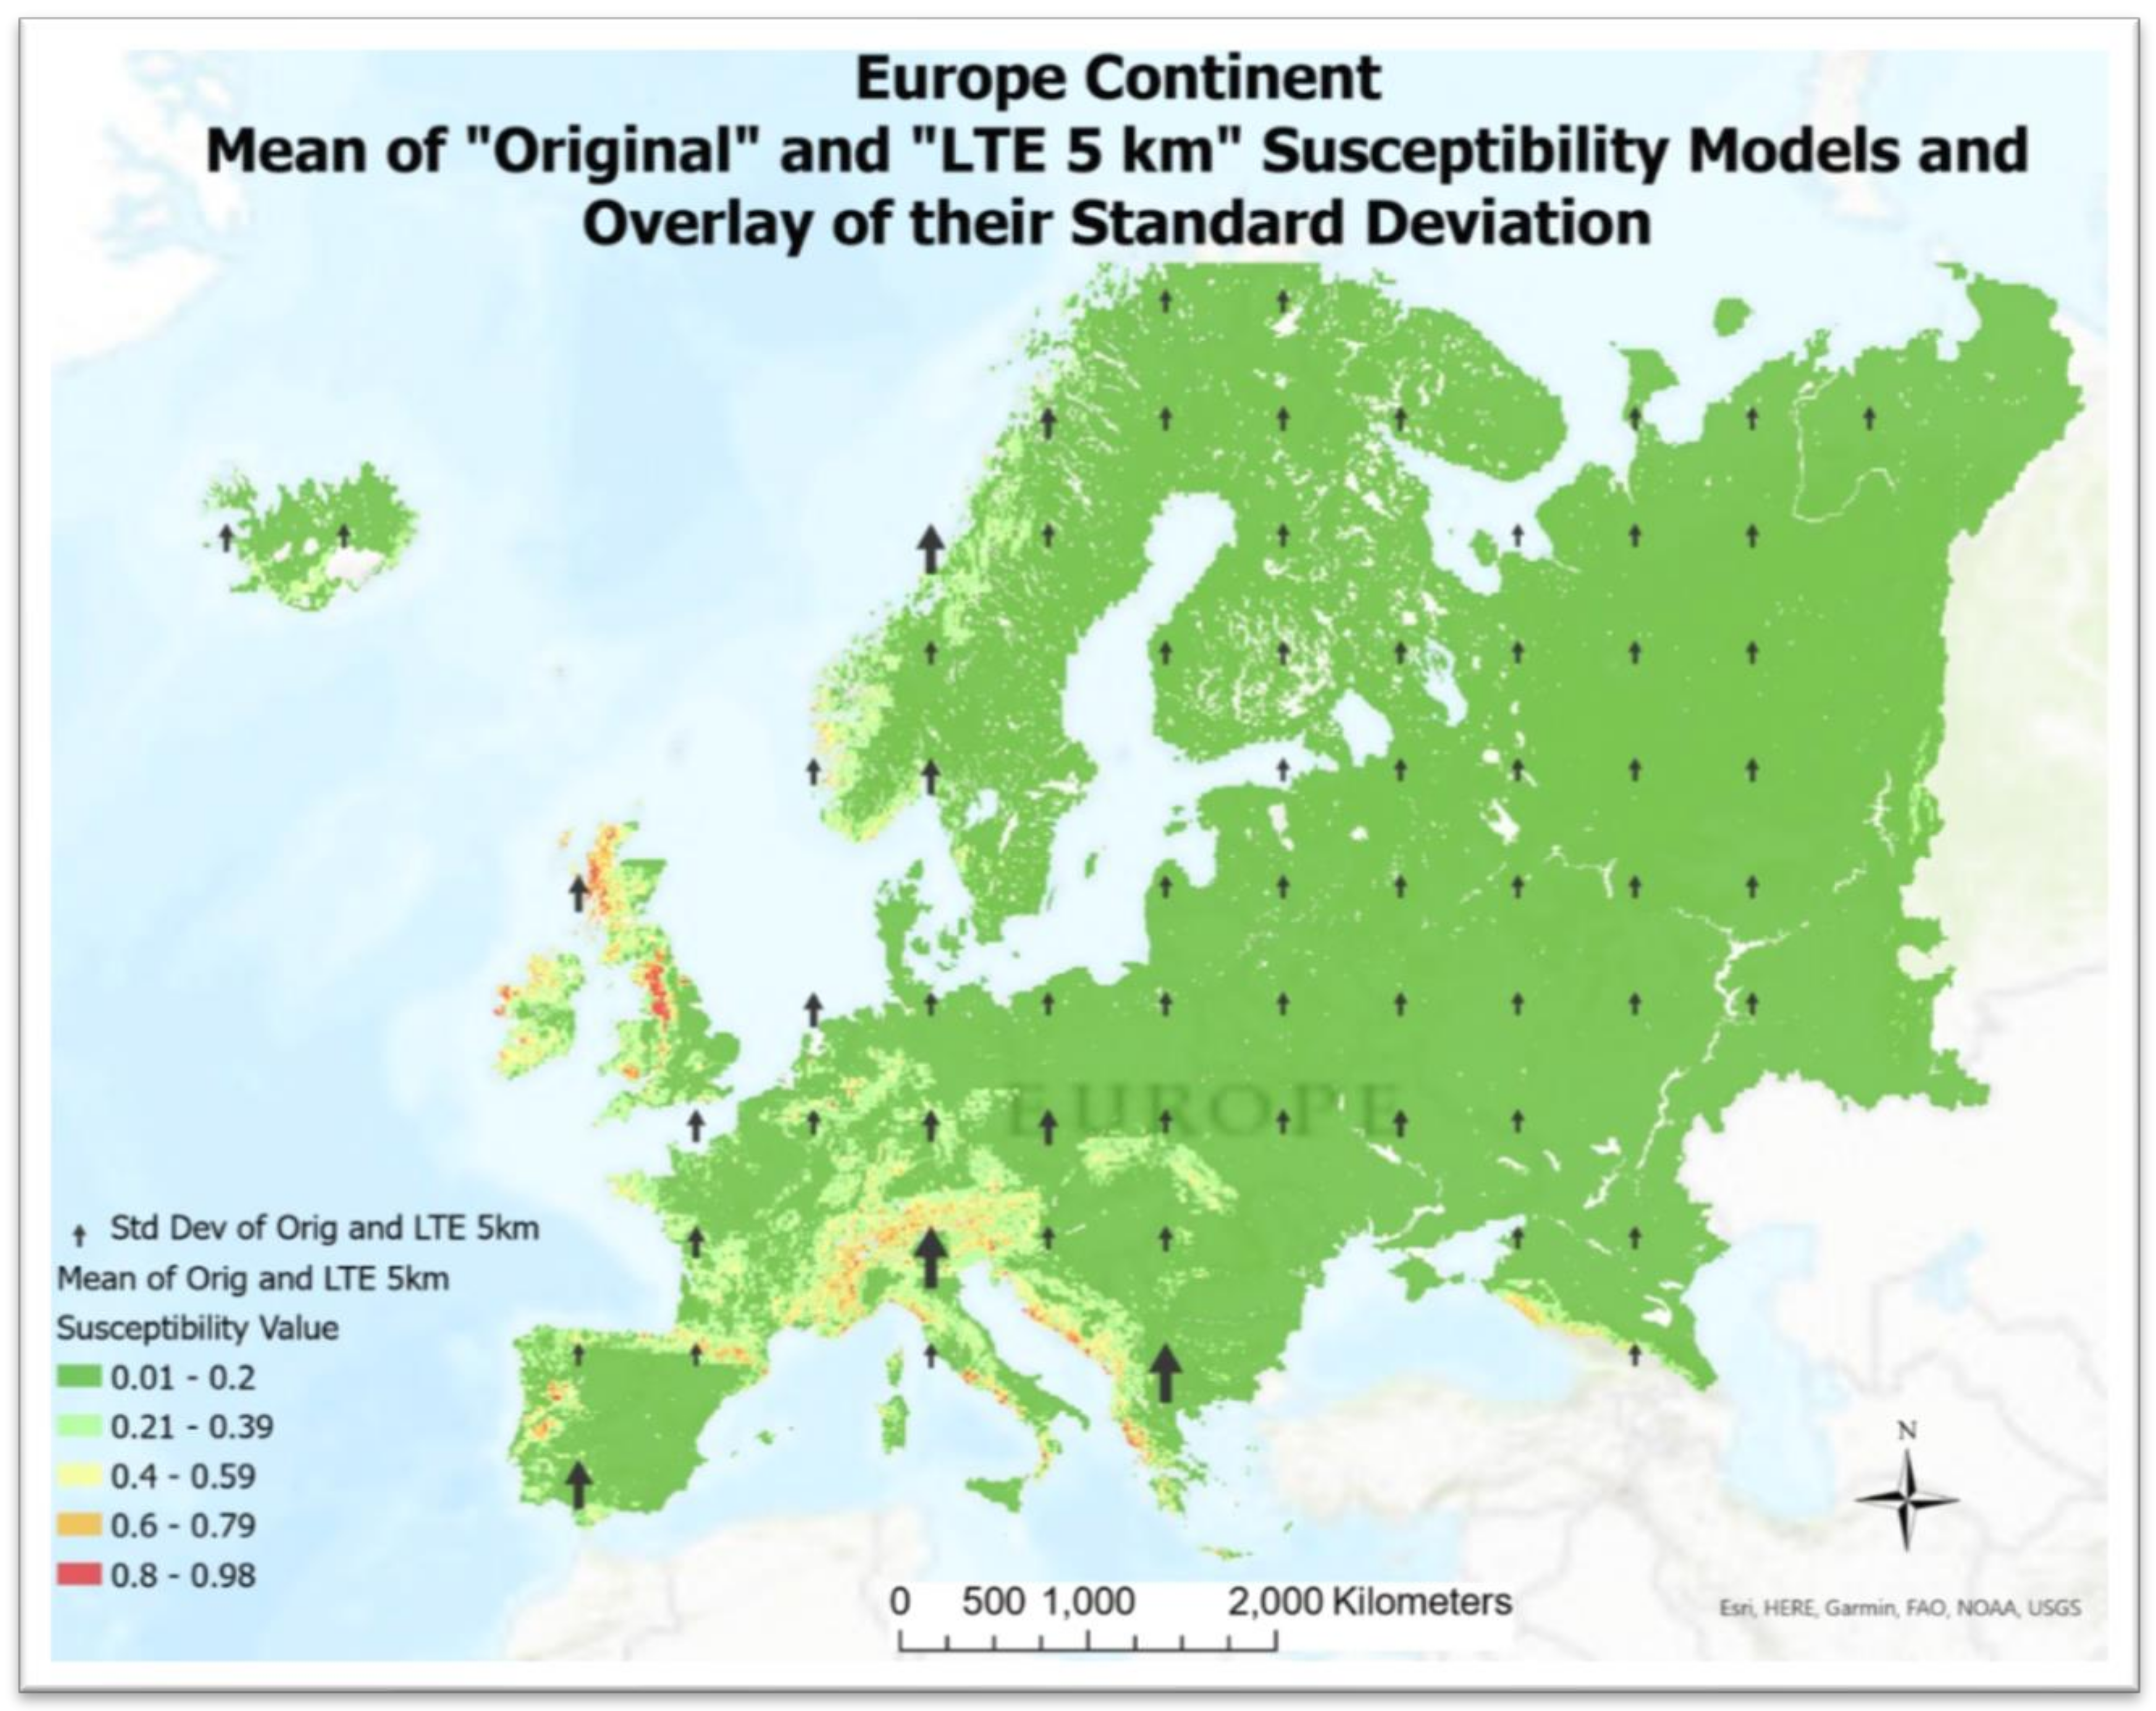
4.4. Impact of Factor Uncertainties on Susceptibility Results
5. Discussion
6. Conclusions
Author Contributions
Funding
Acknowledgments
Conflicts of Interest
References
- Brabb, E.E.; Colgan, J.P.; Best, T.C. Map Showing Inventory and Regional Susceptibility for Holocene Debris Flows and Related Fast-Moving Landslides in the Conterminous United States: Raster Data; USGS: Reston, VA, USA, 1999. [Google Scholar] [CrossRef]
- Brighenti, R.; Segalini, A.; Ferrero, A.M. Debris flow hazard mitigation: A simplified analytical model for the design of flexible barriers. Comput. Geotech. 2013, 54, 1–15. [Google Scholar] [CrossRef]
- Campbell, R.H. Debris flows originating from soil slips during rainstorms in Southern California. J. Eng. Geol. 1974, 7, 339–349. [Google Scholar] [CrossRef]
- Dowling, C.A.; Santi, P.M. Debris flows and their toll on human life: A global analysis of debris-flow fatalities from 1950 to 2011. Nat. Hazards 2013, 71, 203–227. [Google Scholar] [CrossRef]
- Froude, M.J.; Petley, D.N. Global fatal landslide occurrence from 2004 to 2016. Nat. Hazards Earth Syst. Sci. 2018, 18, 2161–2181. [Google Scholar] [CrossRef]
- Costa, J.E. Physical Geomorphology of Debris Flows. In Developments and Applications of Geomorphology; Costa, J.E., Fleisher, P.J., Eds.; Springer: Berlin/Heidelberg, Germany, 1984; pp. 268–317. [Google Scholar] [CrossRef]
- Highland, L.M.; Bobrowsky, P. The Landslide Handbook—A Guide to Understanding Landslides; US Geological Survey: Reston, VA, USA, 2008. [Google Scholar]
- Froude, M.J.; Petley, D.N. Guide to the Global Fatal Landslide Database on ArcGIS Online; Esri: Redlands, CA, USA, 2019. [Google Scholar]
- ISPRA. World Landslides Forum: Each Year, Landslide Cause Damage to 6 Billion Euros; ISPRA: Roma, Italy, 2020. [Google Scholar]
- Gunther, A.; Reichenbach, P.; Guzzetti, F.; Richter, A. Criteria for the identification of landslide risk areas in Europe: The Tier 1 approach. In Guidelines for Mapping Areas at Risk of Landslides in Europe; Joint Research Center, Institute for Environment and Sustainability, European Commission: Luxembourg, 2007; pp. 37–40. [Google Scholar] [CrossRef]
- Iverson, R.M. The Physics of Debris Flows. Am. Geophys. Union 1997, 35, 245–296. [Google Scholar] [CrossRef]
- Nettleton, I.M.; Martin, S.; Hencher, S.; Moore, R. Debris Flow Types and Mechanisms. In Scottish Road Network Landslide Study Scotland; Transport Research Laboratory: Crowthorne, UK, 2005. [Google Scholar]
- Ritchie, H.; Roser, M. Urbanization. 2018. Available online: https://ourworldindata.org/urbanization (accessed on 25 April 2021).
- Malamud, B.D.; Turcotte, D.L.; Guzzetti, F.; Reichenbach, P. Landslide inventories and their statistical properties. Earth Surf. Processes Landf. 2004, 29, 687–711. [Google Scholar] [CrossRef]
- Kirschbaum, D.; Stanley, T.; Zhou, Y.P. Spatial and temporal analysis of a global landslide catalog. Geomorphology 2015, 249, 4–15. [Google Scholar] [CrossRef]
- Chrisman, N. Modeling error in overlaid categorical maps. In The Accuracy of Spatial Databases; Goodchild, M., Gopal, S., Eds.; Taylor & Francis: Philadelphia, PA, USA, 1989; pp. 21–43. [Google Scholar]
- Maffini, G.; Arno, M.; Bitterlich, W. Observations and comments on the generation and treatment of error in digital GIS data. In Accuracy of Spatial Databases; Goodchild, M., Gopal, S., Eds.; Taylor & Francis: Philadelphia, PA, USA, 1989; pp. 55–68. [Google Scholar]
- Openshaw, S. Learning to live with errors in spatial databases. In Accuracy of Spatial Databases; Goodchild, M., Gopal, S., Eds.; Taylor & Francis: Philadelphia, PA, USA, 1989; pp. 263–276. [Google Scholar]
- Shi, W. Principles of Modeling Uncertainties in Spatial Data and Spatial Analyses; CRC Press: Boca Raton, FL, USA, 2010. [Google Scholar]
- Couclelis, H. The Certainty of Uncertainty: GIS and the Limits of Geographic Knowledge. Trans. GIS 2003, 7, 165–175. [Google Scholar] [CrossRef]
- Carrara, A.; Cardinali, M.; Guzzetti, F. Uncertainty in assessing landslide hazard and risk. ITC J. 1992, 2, 172–183. [Google Scholar]
- Ardizzone, F.; Cardinali, M.; Carrara, A.; Guzzetti, F.; Reichenbach, P. Impact of mapping errors on the reliability of landslide hazard maps. Nat. Hazards Earth Syst. Sci. 2002, 2, 3–14. [Google Scholar] [CrossRef]
- Lorente, A.; García-Ruiz, J.M.; Beguería, S.; Arnáez, J. Factors Explaining the Spatial Distribution of Hillslope Debris Flows. Mt. Res. Dev. 2002, 22, 32–39. [Google Scholar] [CrossRef]
- Devkota, K.C.; Regmi, A.D.; Pourghasemi, H.R.; Yoshida, K.; Pradhan, B.; Ryu, I.C.; Dhital, M.R.; Althuwaynee, O.F. Landslide susceptibility mapping using certainty factor, index of entropy and logistic regression models in GIS and their comparison at Mugling–Narayanghat road section in Nepal Himalaya. Nat. Hazards 2012, 65, 135–165. [Google Scholar] [CrossRef]
- Grozavu, A.; Patriche, C.V. Landslide Susceptibility Assessment: GIS Application to a Complex Mountainus Environment. In The Carpathians: Integrating Nature and Society towards Sustainability; Springer: Berlin/Heidelberg, Germany, 2013. [Google Scholar] [CrossRef]
- Dou, J.; Tien Bui, D.; Yunus, A.P.; Jia, K.; Song, X.; Revhaug, I.; Xia, H.; Zhu, Z. Optimization of Causative Factors for Landslide Susceptibility Evaluation Using Remote Sensing and GIS Data in Parts of Niigata, Japan. PLoS ONE 2015, 10, e0133262. [Google Scholar] [CrossRef] [PubMed]
- Meten, M.; PrakashBhandary, N.; Yatabe, R. Effect of Landslide Factor Combinations on the Prediction Accuracy of Landslide Susceptibility Maps in the Blue Nile Gorge of Central Ethiopia. Geoenvironmental Disasters 2015, 2, 9. [Google Scholar] [CrossRef]
- Kornejady, A.; Ownegh, M.; Bahremand, A. Landslide susceptibility assessment using maximum entropy model with two different data sampling methods. Catena 2017, 152, 144–162. [Google Scholar] [CrossRef]
- Kirschbaum, D.; Stanley, T. Satellite-Based Assessment of Rainfall-Triggered Landslide Hazard for Situational Awareness. Earth’s Future 2018, 6, 505–523. [Google Scholar] [CrossRef]
- Nsengiyumva, J.B.; Luo, G.; Nahayo, L.; Huang, X.; Cai, P. Landslide Susceptibility Assessment Using Spatial Multi-Criteria Evaluation Model in Rwanda. Int. J. Environ. Res. Public Health 2018, 15, 243. [Google Scholar] [CrossRef]
- Bridges, E.M. World Geomorphology; Cambridge University Press: Cambridge, UK, 2012. [Google Scholar] [CrossRef]
- Toth, G.; Montanarell, L.; Stolbovoy, F.; Bodis, K.; Jones, A.; Panagos, P.; Liedekerke, M. Soils of the European Union; European Commissiono Joint Research Centre Institute for Environment and Sustainability: Roma, Italy, 2008; pp. 1018–5593. [Google Scholar] [CrossRef]
- Styron, R.; Pagani, M. The GEM Global Active Faults Database. Earthq. Spectra 2020, 36, 160–180. [Google Scholar] [CrossRef]
- Phillips, S.; Dudik, M. Modeling of species distributions with Maxent: New extensions and a comprehensive evaluation. Ecography 2008, 31, 161–175. [Google Scholar] [CrossRef]
- Phillips, S.J.; Elith, J. On estimating probability of presence from use-availability or presence-background data. Ecology 2013, 94, 1409–1419. [Google Scholar] [CrossRef]
- Convertino, M.; Troccoli, A.; Catani, F. Detecting fingerprints of landslide drivers: A MaxEnt model. J. Geophys. Res. Earth Surf. 2013, 118, 1367–1386. [Google Scholar] [CrossRef]
- Park, N.-W. Using maximum entropy modeling for landslide susceptibility mapping with multiple geoenvironmental data sets. Environ. Earth Sci. 2014, 73, 937–949. [Google Scholar] [CrossRef]
- Lombardo, L.; Fubelli, G.; Amato, G.; Bonasera, M. Presence-only approach to assess landslide triggering-thickness susceptibility: A test for the Mili catchment (north-eastern Sicily, Italy). Nat. Hazards J. Int. Soc. Prev. Mitig. Nat. Hazards 2016, 84, 565–588. [Google Scholar] [CrossRef]
- Yuan, S.; Huang, G.; Xiong, H.; Gong, Q.; Wang, J.; Chen, J. Maximum Entropy-Based Model of High-Threat Landslide Disaster Distribution in Zhaoqing, China. J. Risk Anal. Crisis Response 2017, 7, 108–126. [Google Scholar] [CrossRef][Green Version]
- GÁL, A.; Poszet, S.L.; Kerekes, A.H. Landslide susceptibility assessment using the maximum entropy model in a sector of the Cluj–Napoca Municipality, Romania. Rev. Geomorfol. 2018, 20, 130–146. [Google Scholar] [CrossRef]
- Phillips, S.; Dudik, M.; Schapire, R.E. Maxent Software for Modeling Species Niches and Distributions (Version 3.4.1) [Code]. 2021. Available online: http://biodiversityinformatics.amnh.org/open_source/maxent/ (accessed on 20 April 2021).
- Esri, I. ArcGIS Pro (Version 2.7); ESRI, Inc.: Redlands, CA, USA, 2020. [Google Scholar]
- Hengl, T. Visualisation of uncertainty using the HSI colour model: Computations with colours. In Proceedings of the Seventh International Conference on GeoComputation, Southampton, UK, 8–10 September 2003. [Google Scholar]
- Ślusarski, M.; Jurkiewicz, M. Visualisation of Spatial Data Uncertainty. A Case Study of a Database of Topographic Objects. ISPRS Int. J. Geo-Inf. 2019, 9, 16. [Google Scholar] [CrossRef]
- Li, L. Spatial data uncertainty. In The Geographic Information Science & Technology Body of Knowledge, 4th Quarter 2017 ed.; Wilson, J.P., Ed.; Association of American Geographers: Washington, DC, USA, 2017. [Google Scholar]
- MacEachren, A.M.; Robinson, A.; Hopper, S.; Gardner, S.; Murray, R.; Gahegan, M.; Hetzler, E. Visualizing Geospatial Information Uncertainty: What We Know and What We Need to Know. Cartogr. Geogr. Inf. Sci. 2005, 32, 139–160. [Google Scholar] [CrossRef]
- Hunter, G.J.; Goodchild, M. Communicating uncertainty in spatial databases. Trans. GIS 1996, 1, 13–24. [Google Scholar] [CrossRef]
- Hunter, G.J. Managing uncertainty in GIS. Geogr. Inf. Syst. 1999, 2, 633–641. [Google Scholar]
- Wechsler, S.P. Digital Elevation Model (DEM) Uncertainty: Evaluation and Effect on Topographic Parameters. In Proceedings of the ESRI User Conference, San Diego, CA, USA, 26–30 July 1999. [Google Scholar]
- Zufle, A.; Trajcevski, G.; Pfoser, D.; Renz, M.; Rice, M.T.; Leslie, T.; Delamater, P.; Emrich, T. Handling Uncertainty in Geo-Spatial Data. In Proceedings of the 2017 IEEE 33rd International Conference on Data Engineering (ICDE), San Diego, CA, USA, 19–22 April 2017. [Google Scholar] [CrossRef]
- Veregin, H. Error modeling for the map overlay operation. In The Accuracy of Spatial Databases; Goodchild, M., Gopal, S., Eds.; Taylor & Francis: Philadelphia, PA, USA, 1989; pp. 3–18. [Google Scholar]
- Soma, A. Landslide Susceptibility Map Using Certainty Factor for Mitigation in Mountainous Area of Ujung-Loe Watershed South Sulawesi Indonesia. For. Soc. 2018, 2, 79–91. [Google Scholar]
- Hunter, G.J.; Goodchild, M.; Robey, M. A Toolbox for Assessing Uncertainty in Spatial Databases. In Proceedings of the 22nd Annual Conference of the Australasian Urban and Regional Information Systems Association, Sydney, NSW, Australia, 21–25 November 1994. [Google Scholar]


| Locational Uncertainty Radius (km) | Frequency Distribution (Europe Debris Flows) | Percent of Total Debris Flow Events | Cum Percent | Frequency Distribution (World Debris Flows) | Percent of Total Debris Flow Events | Cum Percent | Frequency Distribution (World All Landslide Types) | Percent of Total Landslide Events | Cum Percent |
|---|---|---|---|---|---|---|---|---|---|
| exact | 5 | 5.1 | 5.1 | 174 | 7.6 | 7.6 | 1386 | 12.6 | 12.6 |
| 1 | 19 | 19.2 | 24.3 | 620 | 27.0 | 34.6 | 2185 | 19.8 | 32.4 |
| 5 | 31 | 31.3 | 55.6 | 763 | 33.3 | 67.9 | 3178 | 28.8 | 61.2 |
| 10 | 20 | 20.2 | 75.8 | 277 | 12.1 | 79.9 | 1435 | 13.0 | 74.2 |
| 25 | 12 | 12.1 | 87.9 | 240 | 10.5 | 90.4 | 1470 | 13.3 | 87.5 |
| 50 | 6 | 6.1 | 93.9 | 125 | 5.4 | 95.9 | 794 | 7.2 | 94.7 |
| 100 | 0 | 9 | 0.4 | 96.3 | 25 | 0.2 | 94.9 | ||
| 250 | 0 | 4 | 0.2 | 96.4 | 16 | 0.1 | 95.1 | ||
| “unknown” | 6 | 6.1 | 99.9 | 82 | 3.6 | 100.0 | 546 | 4.9 | 100.0 |
| Total | 99 | 2294 | 11,033 |
| Climate Class | Distance to Fault | Drainage | Percent Clay | Lithology | Soil Type | Precip | Elev | Soil Thick | Aridity Index | Landform | Landcover | Slope | Fault Density | Depth to Bedrock | |
|---|---|---|---|---|---|---|---|---|---|---|---|---|---|---|---|
| Climate Class | 1 | −0.180 | 0.107 | −0.246 | −0.051 | −0.009 | −0.109 | −0.009 | −0.036 | −0.065 | −0.029 | 0.041 | 0.026 | −0.010 | −0.052 |
| Distance to Fault | 1 | −0.068 | 0.072 | 0.050 | 0.093 | 0.011 | 0.001 | −0.012 | 0.015 | 0.038 | −0.015 | 0.023 | −0.016 | −0.026 | |
| Drainage | 1 | −0.416 | 0.006 | 0.040 | −0.135 | −0.016 | −0.001 | −0.087 | 0.067 | 0.019 | −0.041 | −0.057 | −0.017 | ||
| Percent Clay | 1 | 0.026 | −0.013 | 0.020 | −0.001 | 0.022 | 0.005 | 0.017 | −0.025 | 0.024 | −0.001 | 0.025 | |||
| Lithology | 1 | 0.087 | −0.120 | 0.053 | −0.003 | −0.095 | 0.011 | 0.009 | 0.041 | 0.018 | −0.052 | ||||
| Soil Type | 1 | −0.315 | 0.096 | −0.010 | −0.274 | 0.148 | 0.102 | 0.030 | 0.029 | −0.107 | |||||
| Precip | 1 | −0.261 | 0.010 | 0.864 | −0.436 | −0.174 | −0.058 | −0.102 | 0.252 | ||||||
| Elev | 1 | −0.213 | −0.240 | −0.070 | −0.143 | 0.027 | −0.067 | −0.061 | |||||||
| Soil Thick | 1 | −0.015 | −0.052 | 0.241 | 0.036 | 0.026 | 0.007 | ||||||||
| Aridity Index | 1 | −0.416 | −0.162 | −0.058 | −0.081 | 0.217 | |||||||||
| Landform | 1 | −0.008 | −0.015 | 0.076 | −0.096 | ||||||||||
| Landcover | 1 | 0.030 | 0.105 | −0.047 | |||||||||||
| Slope | 1 | 0.043 | −0.012 | ||||||||||||
| Fault Density | 1 | −0.016 | |||||||||||||
| Depth to Bedrock | 1 |
| Variable/Model | “Original” Factor Contribution to Model |
|---|---|
| AUC | 0.891 |
| precipitation | 42.0 |
| fault density | 27.6 |
| soil type | 8.6 |
| landcover | 4.7 |
| climate | 4.5 |
| lithology | 2.1 |
| soil thickness | 2.4 |
| landform | 4.9 |
| elevation | 0.2 |
| drainage | 2.3 |
| topsoil percent clay | 0.1 |
| depth to bedrock | 0.0 |
| aridity | 0.5 |
| Event ID | 560 | 6381 |
|---|---|---|
| Precipitation point value | 92 mm | 73 mm |
| Locational uncertainty buffer | 50 km | 50 km |
| Number of different precipitation factor classes within buffer | 32 | 31 |
| Precipitation range of values within buffer | 58–141 mm | 49–94 mm |
| Event ID | 560 | 6381 |
|---|---|---|
| Single fault density class at point (km/sq km) | 0.0065–0.0084 | 0.000001–0.05 |
| Locational Uncertainty Buffer | 50 km | 50 km |
| Range of multiple fault density classes within buffer (km/sq km) | 0.0050–0.0840 | 0.0–0.059 |
| Event ID | 560 | 6381 |
|---|---|---|
| Soil class at point | Podzol | Cambisol |
| Locational Uncertainty Buffer | 50 km | 50 km |
| Number of different soil classes within buffer | 5 | 7 |
| Soil classes within buffer | Cambisol, Gleysol, Lithosol, Podzol, Rendzina | Cambisol, Gleysol, Lithosol, Luvisol, Planosol, Podzol, Rendzina |
| Uncertainty buffer | Event 560 | Event 6381 |
|---|---|---|
| 50 km | Very Low to Very High | Very Low to Very High |
| 10 km | Low to Very High | Low to High |
| 5 km | Low to Very High | Low, Moderate |
| Variable/Model | “Original” Factor Contribution (99 Events) | “93 Random” Factor Contribution (93 Events) | “LTE 5km” Factor Contribution (55 Events) | “LTE 1km” Factor Contribution (24 Events) | “EXACT” Factor Contribution (5 Events) |
|---|---|---|---|---|---|
| AUC | 0.891 | 0.893 | 0.896 | 0.921 | 0.93 |
| precipitation | 42 | 37.4 | 30.2 | 11.9 | 3 |
| fault density | 27.6 | 29.7 | 24.8 | 10.3 | 0.1 |
| soil type | 8.6 | 10.5 | 13.6 | 25.8 | 75.3 |
| landcover | 4.7 | 7.9 | 8.9 | 18.8 | 2.3 |
| climate | 4.5 | 2.8 | 8.1 | 11.1 | 1.4 |
| lithology | 2.1 | 1.6 | 4.1 | 3.1 | 0.5 |
| soil thickness | 2.4 | 1.8 | 3.3 | 4 | 13.3 |
| landform | 4.9 | 3.2 | 3.1 | 10.4 | 2.2 |
| elevation | 0.2 | 1.6 | 2.1 | 1.1 | 1.5 |
| drainage | 2.3 | 2.9 | 1.6 | 1.5 | 0.2 |
| topsoil percent clay | 0.1 | 0.2 | 0.1 | 1.5 | 0.2 |
| depth to bedrock | 0.0 | 0.1 | 0.1 | 0.4 | 0.0 |
| aridity | 0.5 | 0.3 | 0.1 | 0.1 | 0.0 |
| Factor/Model | “Original” | “93 Random” | “LTE 5km” | “LTE 1km” |
|---|---|---|---|---|
| precipitation (monthly average mm 1970–2000) | 275–300 | 300–325 | 260–280 | 275–300 |
| fault density (km/sq km) | 0.02–0.14 | 0.01–0.02 | 0.13–0.14 | 0.01–0.14 |
| soil type | Gleysol | Fluvisol, Gleysol | Fluvisol, Gleysol | Gleysol |
| landcover | urban | urban | urban | sparse vegetation |
| Climate (Köppen-Geiger) | Dfa—hot summer humid continental climate | BSk—semi arid steppe | Csa—Mediterranean hot summer climate and Cfc—subpolar oceanic climate | Csa—Mediterranean hot summer climate |
| lithology | unconsolidated sedimentary (su) | intermediate volcanic (vi) | unconsolidated sedimentary (su) | basic plutonic (pb) |
| soil thickness (m) | 0–2.5 | 0–1 | 0–2 | 0–2.5 |
| landform | Plains on sedimentary lithology | Humid plains on sedimentary lithology | Plains on sedimentary lithology | Plains in alpine system |
| elevation (m) | 3250–3500 | 3200–3500 | 0–500 | 3250–5000 |
| drainage | “Very poor” | “Imperfectly” | “Imperfectly” | “Moderately well” |
| topsoil percentclay | 5–18 | 20 | 20 | 0–22 |
| depth to bedrock (cm) | 0 | 114 | 0 | 0–2000 |
| aridity (dimensionless index) | ~1300 (Arid) | ~1300 (Arid) | ≥60,000 (Humid) | ~15,000 (Humid) |
| Model | # Events | Percent Area in Very High Susceptibility | AUC |
|---|---|---|---|
| “Original” | 99 | 0.5 | 0.891 |
| “93 Random” | 93 | 0.3 | 0.893 |
| “LTE 5km” | 55 | 0.2 | 0.896 |
| “LTE 1km” | 24 | 0.1 | 0.921 |
| “Exact” | 5 | 0.1 | 0.930 |
Publisher’s Note: MDPI stays neutral with regard to jurisdictional claims in published maps and institutional affiliations. |
© 2022 by the authors. Licensee MDPI, Basel, Switzerland. This article is an open access article distributed under the terms and conditions of the Creative Commons Attribution (CC BY) license (https://creativecommons.org/licenses/by/4.0/).
Share and Cite
Kurilla, L.J.; Fubelli, G. Impact and a Novel Representation of Spatial Data Uncertainty in Debris Flow Susceptibility Analysis. Appl. Sci. 2022, 12, 6697. https://doi.org/10.3390/app12136697
Kurilla LJ, Fubelli G. Impact and a Novel Representation of Spatial Data Uncertainty in Debris Flow Susceptibility Analysis. Applied Sciences. 2022; 12(13):6697. https://doi.org/10.3390/app12136697
Chicago/Turabian StyleKurilla, Laurie Jayne, and Giandomenico Fubelli. 2022. "Impact and a Novel Representation of Spatial Data Uncertainty in Debris Flow Susceptibility Analysis" Applied Sciences 12, no. 13: 6697. https://doi.org/10.3390/app12136697
APA StyleKurilla, L. J., & Fubelli, G. (2022). Impact and a Novel Representation of Spatial Data Uncertainty in Debris Flow Susceptibility Analysis. Applied Sciences, 12(13), 6697. https://doi.org/10.3390/app12136697


