Abstract
One of the basic requirements for controlled traffic farming (CTF) is the precise motion of all agricultural equipment on permanent traffic lanes (PTL). Tractors of machine-tractor units are then equipped with a GNSS (global navigation satellite) RTK (real-time kinematic) system, even though in many parts of the world, and Europe as well, satellite navigation is not yet used. In this case, for implementation of the CTF system, it needs to lay such PTL tracks that would be sufficiently visible, especially when using the CTF system in multi-year agricultural crop cultivation. The PTL track depth is influenced by both tractor and soil parameters and, in this paper, this influence is studied considering the dimensionless π-terms of the similarity theory. To obtain a greater depth of PTL tracks (h), the soil cone index must be low. The low density of the soil is important, even if its effect on the parameter h is less than that of the soil cone index. A greater depth of PTL tracks is also obtained by increasing the inflation pressure in the tractor tires. Ballasted wheels are the least effective for increasing the value of the parameter h.
1. Introduction
The consistent use of heavy machinery in agricultural fields in past decades caused an increased risk of soil compaction [1,2,3,4]. According to various authors, this phenomenon is accentuated by the intensity of transits [5,6,7], the increase in the axle load of agricultural machinery [8,9], and the rise in power and traction capacity of tractors [10,11,12,13]. The row crop systems, in which agricultural machinery frequently transits between rows during the entire growth cycle, also lead to a high risk of soil compaction [14,15,16]. Soil compaction results in several and variously interconnected detrimental outcomes, such as air reduction, increased water reserve and nutrient absorption by plant lowering, and crop yield diminution [17,18,19,20].
In this context, controlled traffic farming (CTF) systems represent an excellent solution to this phenomenon, whereby traffic-induced soil compaction is minor, as the cultivation area is separated from the permanent traffic lanes (PTL) [21,22,23]. The crop area is thus not touched by the machinery wheels, which instead run only on the PTL [24,25]. In this way, it is possible to optimize the performance of both the cultivation zone and PTL [26].
The effectiveness of controlled traffic farming (CTF) in agricultural production has long been proven and its basic requirements have been formulated [27,28,29,30]. One of the requirements is the precise motion of all equipment on permanent traffic lanes (PTL). For this purpose, it is recommended to equip the technical means with a rather expensive GNSS (global navigation satellite) RTK (real-time kinematic) system [31,32]. Moreover, the accuracy and reliability of the GNSS-RTK system depend on weather conditions and the terrain [33]. In this regard, the scheme of the machine-tractor unit has a certain influence on the efficiency of the GNSS-RTK system [34].
However, the CTF method is still implemented without using satellite navigation systems in many countries, including Ukraine [35,36]. In these contexts, the PTL tracks are arranged earlier so that they will be detectable during the full crop growing cycle and then be used by the wheels or tracks of all implements and tractors for cultivation works. Furthermore, existing CTF systems are mainly used in a single field [37]. At the same time, the long-term use of the same PTL in the appropriate crop rotation is of interest. In Ukraine, the following variant is very promising: «sunflower» − «black fallow» − «winter wheat».
To implement CTF in such a crop rotation, it is desirable that the PTL are highly visible and deep enough. Otherwise, they may become almost undetectable after the first year of use. This problem has been solved by using a special machine-tractor unit, which the authors have developed [38]. This machine used a special front device, equipped with two plow bodies spaced as wide as the tractor gauge, to plow the PTL at a given depth.
However, the question arises: “Is it possible to form PTL tracks of a given depth without using a special machine, but with solely a wheeled tractor?”
PTL depth (h) depends on some tractor and soil parameters, and it is obvious that the greater the value of the parameter h, the greater the soil compaction.
The influence of many of the tractor’s design parameters on soil compaction has been studied in some detail. For example, soil compaction has been estimated as a function of the inflation pressure of the tire and the vertical load on it [39]. Furthermore, in studying this problem, the bearing capacity of the soil has been proposed to be evaluated by a special index, the field compaction capacity (FCC) [40].
The sealing effect of the tractor undercarriage system type has also been examined [41]. In addition, the effectiveness of changing the inflation pressure in twin traction vehicle tires has been analyzed [42].
The effects on soil compaction caused by tractor ballasting have been outlined in [43], in which study the equation for determining the track depth after the tractor wheels have passed is given, even if this equation only includes tractor manufacturing parameters (operating vertical load on the wheel, tire inflation pressure, tire diameter, and tire width) and does not contain soil parameters.
For laying PTL of a given depth, it is necessary to have information about the complex influence of both tractor and soil parameters on the depth. For the latter, the most important are density and soil cone index. Unfortunately, at present such information is scarce.
With the final objective of using solely a wheeled tractor to make PTL of a given depth h, this paper reports the results of research aiming at analyzing the complex interactions of the parameters concerning the characteristics of both the tractor and the soil on the depth of PTL (Figure 1). The above influences, experimentally evaluated, allowed for the setup of an ad hoc mathematical model, based on Buckingham’s π-theorem, which can be useful to support CTF users in obtaining PTL of suitable depth. According to our scientific hypothesis, this problem can be solved if we take into account not a separate (as was performed earlier), but a complex effect on the process of PTL formation of the tractor and soil parameters.
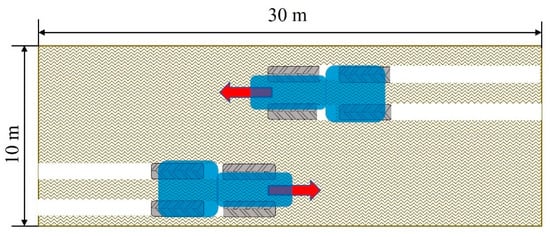
Figure 1.
Single plot sizes with tracks made by the tractor.
2. Materials and Methods
2.1. Theoretical Premises
The relationship that makes it possible to evaluate the influence of both tractor and soil parameters on the depth of the PTL has been studied using dimensional analysis and Buckingham’s π-theorem [44,45]. As is known, Buckingham’s π-theorem states that the original number nv of independent variables in a relationship between dimensional physical quantities is reduced to nπ (called π-terms) if the same relationship is expressed in a dimensionless form, according to the following equation [46]:
where nb is the maximum number of dimensionally independent quantities that can be identified within the nv ones. nb = 3 if the phenomenon is dynamic, and the corresponding parameters are called basic variables [47].
The design parameters (variables) of a wheeled tractor and the physical–mechanical characteristics of the soil, which significantly affect the process of PTL track-making, and their corresponding dimensions and units with respect to the International System of Units (SI Units) are reported in Table 1. Considering that soil deformation moves its mass, these parameters are supplemented by a constant characteristic of the earth’s gravitational field, i.e., the acceleration of gravity (Table 1).

Table 1.
Variable influencing the depth of PTL.
The functional dependence of PTL track depth (h) on the above-mentioned parameters is given by:
The following are the basic variables: (i) the tire pressure Pw; (ii) the soil density ρ; (iii) and gravity g.
To check the correctness of the parameters selected as the basic variables, we need to verify that the following monomial is dimensionless:
Thus, the dimension of expression (3) gives:
The monomial (3) is thus dimensionless if and only if the determinant of the coefficients of the following homogeneous system is nonzero:
The determinant of the coefficients is given by:
Since the determinant D of the coefficients of the system (4) is nonzero, the parameters and are indeed mutually independent.
The dimensionless π-terms are given, respectively, by the following equations:
The monomial placed as the denominator in Equation (6) must have the same dimension as the numerator h in the same equation thus:
Equation (9) gives rise to the following system of equations:
which makes it possible to calculate the coefficients A0, B0, and C0. Therefore, A0 = 1, B0 = −1, and C0 = −1
Considering these results, Equation (6) gives:
Similarly, the coefficients A1, B1, and C1 have been assessed for Equation (7) and A2, B2, and C1 for Equation (8), obtaining, respectively:
Finally, in agreement with the π-theorem, we get:
or, considering expression (11), we get:
2.2. Mathematical Model
To build a mathematical model corresponding to Equation (14), we use the well-known technique of planning a full factorial experiment according to scheme 22, (i.e., 2 factors at 2 levels of values) at a statistical significance level of 0.05 [48]. In this case, the factors are represented by the p-terms and , which in turn are functions, represented by the Equations (12) and (13), respectively. The experiment planning matrix is shown in Table 2. As follows from Equation (12), the lower level (−1, Table 2) of the p-term is obtained at the minimum value of parameter H and the maximum value of parameter . Conversely, at the maximum value of H and the minimum value of , we obtain the upper level (+1) of the p-term .
Table 2.
Levels and interval variation of parameters and p-terms.
The lower level (−1) of the p-term is obtained, as the analysis of Equation (13) shows, at the minimum value of the parameters N and ρ and the maximum value of the parameter . On the other hand, at the maximal values of the parameters N and ρ and the minimal value of , we obtain the upper (+1) level of the p-term (Table 2).
2.3. Field Tests
To perform the aforesaid full factorial experiment, tests were carried out in spring (March) in an agricultural field, which had been plowed with a chisel to 25 cm depth the previous autumn (September). Place of the field experiments: Ukraine, Melitopol (46°50′56″ north latitude, 35°21′55″ east longitude, altitude: 37 m).
A BELARUS model MTZ-1221.2 wheel tractor was used, whose main technical characteristics were: (i) rate power, 95.6 kW; (ii) total weight, 54.6 kN; (iii) front wheels, 420/70R24; (iv) rear wheels, 18.4R38; (v) weight on front wheels, 16.2 kN.
In the chosen agricultural field 4 plots of 10 × 30 m each were considered. In each plot the MTZ-1221.2 tractor formed the PTL tracks of depth h, moving in the forward and reverse directions with the same gear to ensure the double repetition of the experiments (Figure 1). The average speed of the tractor during the experimental studies was constant and equal to 2.1 m s−1.
The minimum and maximum values of the parameters H and ρ of Table 2 were assessed as follows. The values of the soil density (ρ) and soil cone index (H) of all plots were measured in the spring (March) before the experiment tests and were considered the maximum values for these parameters. Both the soil density and the soil cone index were measured in 50 points within each plot. The values of all these measurements performed in all the plots were used to assess the average values of soil density (ρ) and soil cone index (H), respectively, reported in Table 2.
Furthermore, the soil on 2 plots of the field (plot 2 and plot 4) was then tilled with a disc harrow to a depth of 15 cm. After the tillage, through the same method described above the average values of the soil density (ρ) and soil cone index (H) of these two plots were measured and considered as the minimum values for these parameters (Table 2). The test plan reported in Table 3 was then implemented.
Table 3.
Plan summary of test performed in March.
The PTL trace depth was measured on each site as follows. The left track depth made by the MTZ-1221.2 tractor was measured in duplicate with a ruler-depth meter with an error of ±0.005 m. Measurements were carried out at the center of the wheel track, as shown by the white points along the red line in Figure 2. The measurement points were 100, with a measurement step of 0.1 m [35].
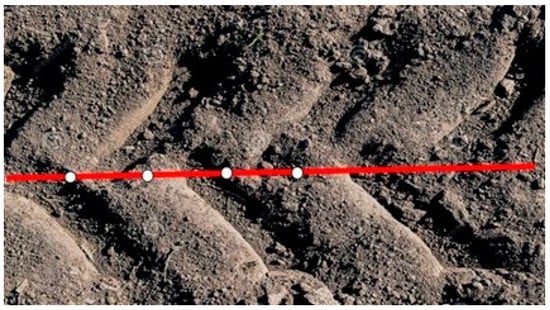
Figure 2.
Measures of the PTL trace depth formed by the tractor front wheel.
The soil cone index H was assessed using a Model Lan-M penetrometer (VP Dilis, Kyiv, Ukraine) with the following main technical characteristics: 0 to 7.8 MPa soil cone index measure range and 0.05 MPa accuracy.
The soil bulk density ρ was evaluated as follows [49,50]. The soil sample was taken with a 28.35 cm3 cylinder (height—1.7 cm; diameter—4.6 cm) and weighed on the scales, which were configured to measure in ounces. As 1 oz. = 28.35 g, the scales showed the soil mass value that was equal to its density in g cm−3.
In addition to soil cone index H and soil bulk density ρ, soil moisture Ms was measured during field studies. Measurements of these parameters were carried out in the same zone where the depth of the wheels was determined after the passage of the tractor (see Figure 2). The depth of the soil layer for measuring soil moisture and soil density was 0–15 cm. The average soil moisture content Ms value was determined using soil samples dried at 105 °C for 3 h in an ARGOLAB model TCF 200 forced air oven (Argolab-XS Instruments s.r.l. Industry, Carpi, Modena district, Italy). Soil samples were weighed before and after drying using an electronic ABT model 220-5DM analytical balance (KERN & SOHN GmbH Industry, Balingen, Germany) with the following technical characteristics: 0.22 kg max. capacity and 10−8 kg readability.
The minimum and maximum tractor tire inflation pressures were 0.100 MPa and 0.160 Mpa, respectively, (Table 2) in two-fold repetition. The pressure was measured using an Intertool model RT-0500 manometer (Intertool Ltd., Kyiv, Ukraine) with a measurement accuracy of ±10 kPa.
The max value of vertical load on the tractor’s front axle was obtained with the help of 8 metal weights. Half of them loaded the left and half the right front wheels. The weight of each ballast was in the range of 50 ± 0.1 kg.
The methodology of processing the experimental data was performed as follows [51]:
- -
- Evaluation of the arithmetic mean and variance for each series of parallel experiments;
- -
- Assessment of the reproducibility of experiments and homogeneity of dispersions by the Cochran criterion;
- -
- Calculation and evaluation of the significance of the regression equation coefficients using Student’s test;
- -
- Checking the adequacy of the obtained regression equation using Fisher’s criterion.
All these procedures were performed in Microsoft Excel.
In conclusion, the research steps performed to obtain the mathematical model corresponding to Equation (14) can be summarized in the algorithm of Figure 3.
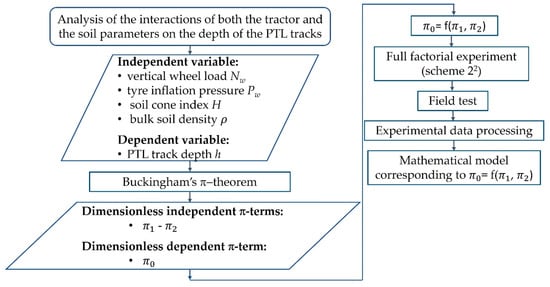
Figure 3.
Research algorithm.
3. Results and Discussion
Experimental studies were carried out on the soil, which was dark chestnut chernozem with a humus content of up to 4.5%.
Before the experiment, the soil moisture content Ms was 20.9%, the soil cone index H was 0.90 MPa and density ρ was 1260 kg m−3. After the tillage with a disc harrow, the soil cone index in the range from 0 to 5 cm layer decreased to 0.48 MPa and density to 1020 kg m−3.
Processing of the experimental data shows that the functional dependence (15) can be approximated by a linear polynomial:
If we substitute Equations (12) and (13), Equation (16) takes the following final form:
Analysis of Equation (17) shows that as the tractor front tires inflation pressures increases, and the track depth increases (Figure 4). In principle, this occurs according to a nonlinear law.
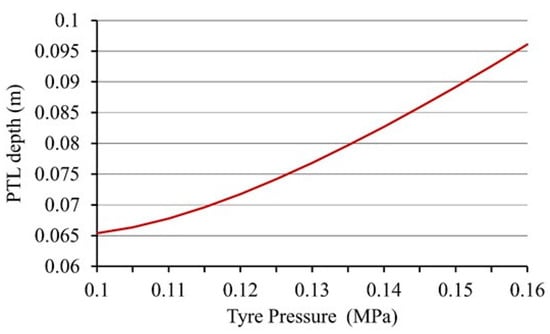
Figure 4.
Dependence of the track depth PTL (h) on the tractor tire inflation pressure ().
As the vertical load Nw on the wheel increases, the parameter h changes in direct proportion, and therefore according to the straight-line law (Figure 5).
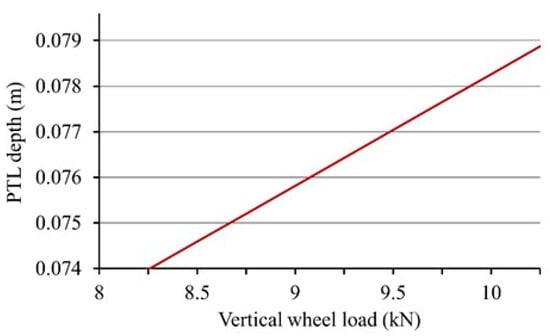
Figure 5.
Dependence of the PTL track depth () on the vertical load on the tractor wheel (Nw).
With increasing soil density ρ, the depth h of the PTL trace naturally decreases (Figure 6). The same occurs with increasing soil cone index (Figure 7).
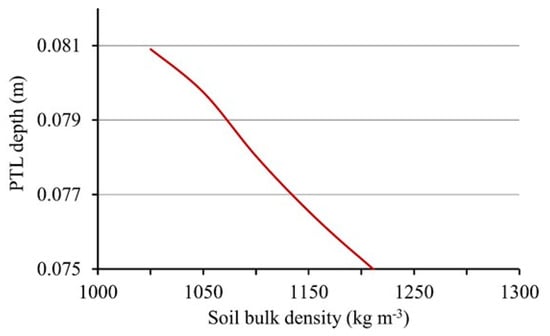
Figure 6.
Dependence of the PTL track depth (h) on the soil density ().
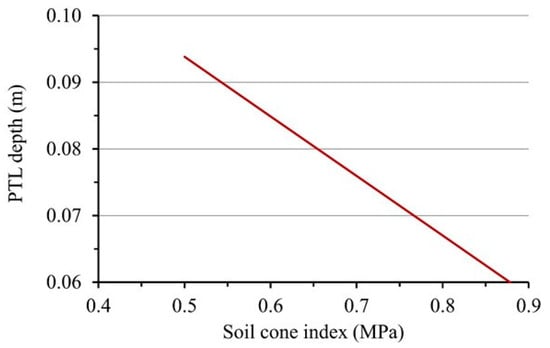
Figure 7.
Dependence of the PTL track depth (h) on the soil cone index (H).
According to scientific logic, the regularities shown in Figure 4, Figure 5 and Figure 6 are quite natural and understandable. In qualitative terms, the influence of the parameters , , and H on the value of h are known to researchers [52,53].
Of interest is their quantitative influence. At the same time, their quantitative and qualitative influence are not separate, but joint, i.e., complex. As follows from Table 2, the parameters , , and H had different limits of variation. The inflation pressure in the wheel tire was considered from 0.10 to 0.16 MPa, i.e., increased by 60%. The soil cone index H increased even more: from 0.48 to 0.90 MPa, i.e., by 88%. As for the values of the soil density and vertical load on the tractor wheel, their changes were almost the same and approximately equal to 25%.
On this basis, it has been estimated the degree of change in the PTL track depth if the parameters , , and H are increased by the same amount: 25%. It makes no sense to take a larger value because and H increased by no more than 25% during the study of the mathematical model (17).
The analysis of the experimental data obtained considering such restrictions showed that the greatest contribution to the change in the parameter h is made by the soil cone index H (Figure 8). In this case, this contribution has been 24.0%.
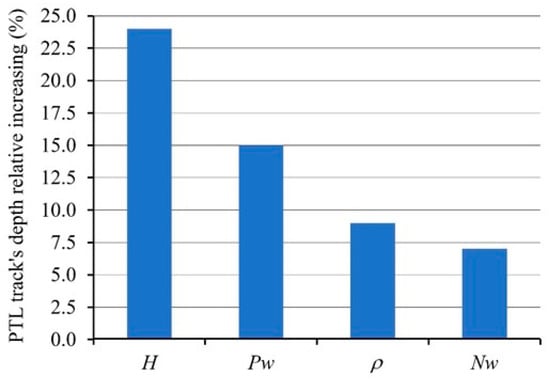
Figure 8.
Degree of influence on the PTL track depth of parameters , , and H when changing their values by 25%.
The contribution of the tractor front tires inflation pressures to the change in the PTL track depth h has been less and is 15%. Soil density ρ and vertical wheel load had approximately the same effect on the change in the parameter h, namely 9 and 7%, respectively.
It follows from this analysis that to obtain PTL tracks of acceptable (specified) depth h, the initial soil background should have a low cone index.
The lesser degree of influence of the parameter on the PTL depth (h) can be explained by the following. Although there is a direct correlation between soil density and soil cone index H, it is not directly proportional. According to our studies of about 300 soil samples with 12–20% moisture content, a decrease in soil cone index H by 0.5 MPa led to a decrease in soil density ρ by only 50–80 g m−3. Approximately the same data with a difference of no more than 5% were obtained by other authors [54]. In principle, at relatively low moisture content Ms, a highly porous soil is characterized by low density ρ but sufficiently high cone index H.
A reduction in soil density ρ is a desirable condition for obtaining a PTL track depth h that will provide good visibility without the use of a GPS. The coordinates (X; Y) of the machine-tractor unit (MTU) in the field (Figure 9) in this case can easily be determined from the expression:
where S is the PTL’s step and n is the PTL’s number where the MTU is located.
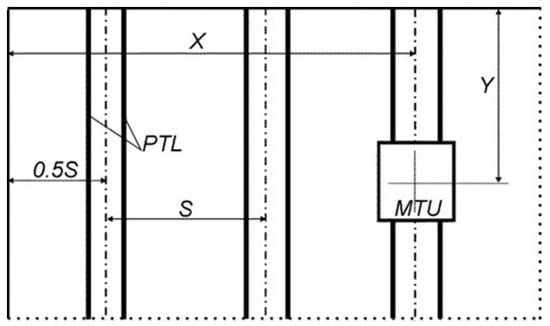
Figure 9.
Diagram for determining MTU coordinates on a field with PTL.
To determine the Y coordinate, it is enough to equip the tractor with a simple displacement sensor.
4. Conclusions
The authors of the article are aware of numerous studies by other scientists on the effects on soil caused by the air pressure in tractor tires (Pw) and the vertical load (Nw), as well as of the studies focused on the effect of Pw and Nw on the depth of the furrow after the passage of the tractor wheels. However, the impact of each of these parameters on the soil was considered separately over time.
The undoubted novelty of this research is that the influence of the parameters Pw and Nw on the depth of the furrow traced by the tractor wheels is considered in their overall effect and in combination with other important parameters of the soil such as its density (ρ) and cone index (H). In the experimental study, the authors of the article did not operate separately on each of the parameters ρ, H, Pw, and Nw (as all the researchers did), but on the parametric functions and . Under the field conditions, modifying and with the method of a full factorial 22 experiment is anything but a trivial task. However, its solution allowed us to obtain new and useful results both for the scientific community and for practical users.
In conclusion, to obtain a greater depth of PTL tracks (h), the soil must have a low cone index. The soil’s low-density ρ is important, but its influence on the parameter h is less than the influence of the cone index H.
The second step in obtaining a greater depth of PTL tracks is to increase tractor front tires inflation pressures . Ballasting, (i.e., placing ballast weights on the wheels) of the wheels to solve this problem is the least effective, since increasing the vertical load , on them has the least effect on the value of the parameter h.
The obtained results of the research can be used in practice when choosing tractor parameters (, ) and taking into account soil parameters () in order to obtain sufficiently visible (moreover, in a long-term crop rotation of agricultural crops) traces of the PTL without the use of navigation systems.
Author Contributions
Conceptualization and methodology, V.B., S.P. and V.A.; formal analysis, investigation and data curation, S.P., F.S., V.A. and V.K. (Viktor Kaminskiy); writing—original draft preparation, V.B., S.P., V.N., F.S., V.A. and V.K. (Volodymyr Kyurchev); writing—review and editing, V.K. (Viktor Kaminskiy), S.P., F.S. and V.N.; Supervision, V.B., S.P., V.N., V.K. (Viktor Kaminskiy) and V.K. (Volodymyr Kyurchev). All authors have read and agreed to the published version of the manuscript.
Funding
This research received no external funding.
Institutional Review Board Statement
Not applicable.
Informed Consent Statement
Not applicable.
Acknowledgments
This research did not receive any specific grant from funding agencies in the public, commercial or not-for-profit sectors.
Conflicts of Interest
The authors declare no conflict of interest.
References
- Faloye, O.T.; Ajayi, A.E.; Zink, A.; Fleige, H.; Dörner, J.; Horn, R. Effective stress and pore water dynamics in unsaturated soils: Influence of soil compaction history and soil properties. Soil Tillage Res. 2019, 211, 104997. [Google Scholar] [CrossRef]
- Horn, R. Soils in Agricultural Engineering: Effect of Land-use management systems on mechanical soil processes. In Hydrogeology, Chemical Weathering, and Soil Formation; Hunt, A., Ed.; Wiley & Sons: Hoboken, NJ, USA, 2021; Chapter 10A; pp. 187–199. [Google Scholar]
- Pascuzzi, S.; Anifantis, A.S.; Santoro, F. The concept of a compact profile agricultural tractor suitable for use on specialised tree crops. Agriculture 2020, 10, 123. [Google Scholar] [CrossRef] [Green Version]
- Guerrieri, A.S.; Anifantis, A.S.; Santoro, F.; Pascuzzi, S. Study of a Large Square Baler with Innovative Technological Systems that Optimize the Baling Effectiveness. Agriculture 2019, 9, 86. [Google Scholar] [CrossRef] [Green Version]
- Kim, W.; Kim, Y.; Park, S.; Kim, Y. Influence of soil moisture content on the traction performance of a 78-kW agricultural tractor during plow tillage. Soil Tillage Res. 2021, 207, 104851. [Google Scholar] [CrossRef]
- Bulgakov, V.; Pascuzzi, S.; Adamchuk, V.; Ivanovs, S.; Pylypaka, S. A theoretical study of the limit path of the movement of a layer of soil along the plough mouldboard. Soil Tillage Res. 2019, 195, 104406. [Google Scholar] [CrossRef]
- Bulgakov, V.; Pascuzzi, S.; Anifantis, A.S.; Santoro, F. Oscillations analysis of front-mounted beet topper machine for biomass harvesting. Energies 2019, 12, 2774. [Google Scholar] [CrossRef] [Green Version]
- Molari, G.; Bellentani, L.; Guarnieri, A.; Walker, M.; Sedoni, E. Performance of an agricultural tractor fitted with rubber tracks. Biosyst. Eng. 2012, 111, 57–63. [Google Scholar] [CrossRef]
- Bulgakov, V.; Pascuzzi, S.; Beloev, H.; Ivanovs, S. Theoretical Investigations of the Headland Turning Agility of a Trailed Asymmetric Implement-and-Tractor Aggregate. Agriculture 2019, 9, 224. [Google Scholar] [CrossRef] [Green Version]
- Balsari, P.; Biglia, A.; Comba, L.; Sacco, D.; Alcatrão, L.E.; Varani, M.; Mattetti, M.; Barge, P.; Tortia, C.; Manzone, M.; et al. Performance analysis of a tractor-power harrow system under different working conditions. Biosyst. Eng. 2021, 202, 28–41. [Google Scholar] [CrossRef]
- Bulgakov, V.; Pascuzzi, S.; Nadykto, V.; Ivanovs, S. A mathematical model of the plane-parallel movement of an asymmetric machine-and-tractor aggregate. Agriculture 2018, 8, 151. [Google Scholar] [CrossRef] [Green Version]
- Bulgakov, V.; Pascuzzi, S.; Ivanovs, S.; Nadykto, V.; Nowak, J. Kinematic discrepancy between driving wheels evaluated for a modular traction device. Biosyst. Eng. 2020, 196, 88–96. [Google Scholar] [CrossRef]
- Battiato, A.; Diserens, E. Tractor traction performance simulation on differently textured soils and validation: A basic study to make traction and energy requirements accessible to the practice. Soil Tillage Res. 2017, 166, 18–32. [Google Scholar] [CrossRef]
- Bulgakov, V.; Pascuzzi, S.; Adamchuk, V.; Kuvachov, V.; Nozdrovicky, L. Theoretical study of transverse offsets of wide span tractor working implements and their influence on damage to row crops. Agriculture 2019, 9, 144. [Google Scholar] [CrossRef] [Green Version]
- Berli, M.; Kulli, B.; Attinger, W.; Keller, M.; Leuenberger, J.; Fluhler, H.; Springman, S.M.; Schulin, R. Compaction of agricultural and forest subsoils by tracked heavy construction machinery. Soil Tillage Res. 2004, 75, 37–52. [Google Scholar] [CrossRef]
- Pascuzzi, S.; Cerruto, E. An innovative pneumatic electrostatic sprayer useful for tendone vineyards. J. Agric. Eng. 2015, 458, 123–127. [Google Scholar] [CrossRef] [Green Version]
- Keller, T.; Sandin, M.; Colombi, T.; Horn, R.; Or, D. Historical evolution of soil stress levels and consequences for soil functioning. Soil Tillage Res. 2019, 194, 104293. [Google Scholar] [CrossRef]
- Baldoin, C.; Balsari, P.; Cerruto, E.; Pascuzzi, S.; Raffaelli, M. Improvement in Pesticide Application on Greenhouse Crops: Results of a Survey about Greenhouse Structures in Italy. Acta Hortic. 2008, 801, 609–614. [Google Scholar] [CrossRef]
- Li, Y.X.; Tullberg, J.N.; Freebairn, D.M. Wheel traffic and tillage effects on runoff and crop yield. Soil Tillage Res. 2007, 97, 282–292. [Google Scholar] [CrossRef]
- Radford, B.; Yule, D.; McGarry, D.; Playford, C. Crop responses to applied soil compaction and to compaction repair treatments. Soil Tillage Res. 2001, 61, 157–166. [Google Scholar] [CrossRef]
- Hefner, M.; Labouriau, R.; Nørremark, M.; Hanne Kristensen, H.L. Controlled traffic farming increased crop yield, root growth, and nitrogen supply at two organic vegetable farms. Soil Tillage Res. 2019, 191, 117–130. [Google Scholar] [CrossRef]
- Gasso, V.; Sørensen, C.A.G.; Oudshoorn, F.W.; Green, O. Controlled traffic farming: A review of the environmental impacts. Eur. J. Agron. 2013, 48, 66–73. [Google Scholar] [CrossRef]
- McHugh, A.D.; Tullberg, J.N.; Freebairn, D.M. Controlled traffic farming restores soil structure. Soil Tillage Res. 2009, 104, 164–172. [Google Scholar] [CrossRef]
- Hussein, M.A.; Antille, D.L.; Kodur, S.; Chen, G.; Tullberg, J.N. Controlled traffic farming effects on productivity of grain sorghum, rainfall and fertiliser nitrogen use efficiency. J. Agric. Food Res. 2021, 3, 100111. [Google Scholar] [CrossRef]
- Pulido-Moncada, M.; Munkholm, L.J.; Schjønning, P. Wheel load, repeated wheeling, and traction effects on subsoil compaction in northern Europe. Soil Tillage Res. 2019, 186, 300–309. [Google Scholar] [CrossRef]
- Bochtis, D.D.; Sørensen, C.G.; Busato, P.; Hameed, I.A.; Rodias, E.; Green, O.; Papadakis, G. Tramline establishment in controlled traffic farming based on operational machinery cost. Biosyst. Eng. 2010, 107, 221–231. [Google Scholar] [CrossRef]
- Antille, D.L.; Peets, S.; Galambošová, J.; Botta, G.F.; Rataj, V.; Macak, M.; Tullberg, J.N.; Chamen, W.C.T.; White, D.R.; Misiewicz, P.A.; et al. Review: Soil compaction and controlled traffic farming in arable and grass cropping systems. Agron. Res. 2019, 17, 653–682. [Google Scholar] [CrossRef]
- Chamen, T. Controlled traffic farming-From worldwide research to adoption in Europe and its future prospects. Acta Technol. Agric. 2015, 18, 64–73. [Google Scholar] [CrossRef] [Green Version]
- Raper, R.L. Agricultural traffic impacts on soil. J. Terramech. 2005, 42, 259–280. [Google Scholar] [CrossRef]
- Tullberg, J.N. Wheel traffic effects on tillage draught. J. Agric. Eng. Res. 2000, 75, 375–382. [Google Scholar] [CrossRef]
- Bulgakov, V.; Pascuzzi, S.; Nikolaenko, S.; Santoro, F.; Anifantis, A.S.; Olt, J. Theoretical study on sieving of potato heap elements in spiral separator. Agron. Res. 2019, 17, 33–48. [Google Scholar] [CrossRef]
- Pascuzzi, S.; Santoro, F.; Manetto, G.; Cerruto, E. Study of the correlation between foliar and patternator deposits in a “Tendone” vineyard. Agricultural Engineering International: CIGR J. 2018, 20, 97–107. [Google Scholar]
- Dussault, C.; Courtois, R.; Ouellet, J.P.; Huot, J. Influence of Satellite Geometry and Differential Correction on GPS Location Accuracy. Wildl. Soc. Bull. 2001, 29, 171–179. [Google Scholar]
- Gan-Mor, S.; Clark, R.L.; Upchurch, B.L. Implement lateral position accuracy under RTK-GPS tractor guidance. Comput. Electron. Agric. 2007, 59, 31–38. [Google Scholar] [CrossRef]
- Bulgakov, V.; Pascuzzi, S.; Ivanovs, S.; Kuvachov, V.; Postol, Y.; Santoro, F.; Melnyk, V. Study of the steering of a wide span vehicle controlled by a local positioning system. J. Agric. Eng. 2021, LII, 1144. [Google Scholar] [CrossRef]
- Kuvachov, V. The study wide span tractor (vehicles) for controlled traffic farming. Mechan. Agric. Conser. Res. 2017, 1, 15–18. [Google Scholar]
- Srivastava, A.K.; Goering, C.E.; Rohrbach, R.P.; Buckmaster, D.R. Engineering Principles of Agricultural Machines, 2nd ed.; American Society of Agricultural and Biological Engineers: St. Joseph, MI, USA, 2012; ISBN 978-1892769503. [Google Scholar]
- Bulgakov, V.; Pascuzzi, S.; Nadykto, V.; Ivanovs, S.; Adamchuk, V. Experimental study of the implement-and-tractor aggregate used for laying tracks of permanent traffic lanes inside controlled traffic farming systems. Soil Tillage Res. 2021, 208, 104895. [Google Scholar] [CrossRef]
- Battiato, A.; Diserens, E. Influence of Tyre Inflation Pressure and Wheel Load on the Traction Performance of a 65 kW MFWD Tractor on a Cohesive. Soil. J. Agric. Sci. 2013, 5, 197–215. [Google Scholar] [CrossRef]
- Prikner, P.; Kotek, M.; Jindra, P.; Pražan, R. Field compaction capacity of agricultural tyres. Agron. Res. 2017, 15, 806–816. [Google Scholar]
- Ansorge, D.; Godwin, R.J. The effect of tyres and a rubber track at high axle loads on soil compaction-Part 2: Multi-axle machine studies. Biosyst. Eng. 2008, 99, 338–347. [Google Scholar] [CrossRef] [Green Version]
- Keller, T.; Arvidsson, J. Technical solutions to reduce the risk of subsoil compaction: Effects of dual wheels, tandem wheels and tyre inflation pressure on stress propagation in soil. Soil Tillage Res. 2004, 79, 191–205. [Google Scholar] [CrossRef]
- Bulgakov, V.; Nadykto, V.; Kyurchev, S.; Nesvidomin, V.; Ivanovs, S.; Olt, J. Theoretical background for increasing grip properties of wheeled tractors based on their rational ballasting. Agraarteadus 2019, 30, 78–84. [Google Scholar] [CrossRef]
- Kasprzak, W.; Lysik, B.; Rybacruk, M. Dimensional Analysis in the Identification of Mathematical Models; World Scientific Publishing Co. Pte. Ltd.: Singapore, 1990; ISBN 978-9810203054. [Google Scholar]
- Langhaar, H.L. Dimensional Analysis and Theory of Models; John Wiley&Sons Ltd.: New York, NY, USA, 1951; ISBN 978-0471516781. [Google Scholar]
- Sonin, A.A. The Physical Basis of Dimensional Analysis, 2nd ed.; Department of Mechanical Engineering MIT Cambridge: Cambridge, MA, USA, 2001; Available online: http://goo.gl/2BaQM6 (accessed on 10 April 2022).
- Tarhan, S.; Carman, K. Modeling the torque and power requirements of traction tires of horticultural tractors using dimensional analysis. Math. Comput. Appl. 2004, 9, 427–434. [Google Scholar] [CrossRef]
- Fisher, R.A. Statistical Methods for Research Workers. In Breakthroughs in Statistics; Kotz, S., Johnson, N.L., Eds.; Springer Series in Statistics (Perspectives in Statistics); Springer: New York, NY, USA, 1992. [Google Scholar] [CrossRef]
- Bulgakov, V.; Pascuzzi, S.; Adamchuk, V.; Gadzalo, J.; Nadykto, V.; Olt, J.; Nowak, J.; Kaminskiy, V. Dynamics of temperature variation in soil under fallow tillage at different depths. Agriculture 2022, 12, 450. [Google Scholar] [CrossRef]
- Nadykto, V.; Kotov, O. Method for determining soil bulk density (in Ukrainian: Sposib viznachennya shchilnosti gruntu). Patent number UA 97828, G 01N 1/00, 10 April 2015. [Google Scholar]
- Jeff Wu, C.F.; Hamada, M.S. Experiments: Planning, Analysis, and Optimization; John Wiley & Sons: Hoboken, NJ, USA, 2011. [Google Scholar]
- Shafei, S.M.; Loghavi, M.; Kamgar, S. Profound insight into tractor energy dissipation through inevitable interaction inside wheel-soil interface for the period of plowing works. Soil Tillage Res. 2021, 211, 104998. [Google Scholar] [CrossRef]
- Reichert, J.M.; da Rosa, V.T.; Vogelmann, E.S.; da Rosa, D.P.; Horn, R.; Reinert, D.J.; Sattler, A.; Denardin, J.E. Conceptual framework for capacity and intensity physical soil properties affected by short and long-term (14 years) continuous no-tillage and controlled traffic. Soil Tillage Res. 2016, 158, 123–136. [Google Scholar] [CrossRef] [Green Version]
- Chyba1, J.; Kroulík, M.; Krištof, K.; Misiewicz, P.A. The influence of agricultural traffic on soil infiltration rates. Agron. Res. 2017, 15, 664–674. [Google Scholar]
Publisher’s Note: MDPI stays neutral with regard to jurisdictional claims in published maps and institutional affiliations. |
© 2022 by the authors. Licensee MDPI, Basel, Switzerland. This article is an open access article distributed under the terms and conditions of the Creative Commons Attribution (CC BY) license (https://creativecommons.org/licenses/by/4.0/).