Abstract
With the rapid development of power grid informatization, the power system has evolved into a multi-dimensional heterogeneous complex system with high cyber-physical integration, denoting the Cyber-Physical Power System (CPPS). Network attack, in addition to faults, becomes an important factor restricting the stable operation of the power system. Under the influence of network attacks, to improve the operational stability of CPPSs, this paper proposes a CPPS network attack detection method based on ensemble learning. First, to solve the shortcomings of a low detection precision caused by insufficient network attack samples, a power data balancing processing method was proposed. Then, the LightGBM ensemble was constructed to detect network attack events and lock the fault points caused by the attack. At the same time, in the process of gradient boost, the focal loss was introduced to optimize the attention weight of the classifier to the misclassified samples, thus improving the network attack detection precision. Finally, we propose an effective evaluation method of the network attack detection model based on cyber-physical comprehensive consideration. In addition, the cyber-physical power system stability under the action of the network attack detection model is quantitatively analyzed. The experimental results show that the F1 score of network attack detection increases by 16.73%, and the precision increases by 15.67%.
1. Introduction
1.1. Background
The power system is a strategic system for national economic development, and its stable operation ensures the energy supply required for economic development. As the amount of electricity consumed by citizens rises, the scale of the power system is growing, the network structure is becoming more complicated, and the requirements for preventive control of power system stability are increasing [1,2,3]. With the gradual progress of smart grid construction, the rapid development of power measurement technology and power communication technology, large amounts of data such as wide-area measurement and external information (environment, meteorology, society, etc.) are connected to the grid. The power system has developed into a CPPS, which has the characteristics of multi-source information interaction and high-dimensional time-varying nonlinearity [4,5]. The dependence of physical devices on communication channels makes network security more difficult, and it raises the potential of network attacks on power systems in particular. Following transient factors, network attacks have become another key factor affecting the stable operation of the power system [6]. Unlike network attacks on the Internet, network attacks on CPPSs are designed to cause large-scale chain failures, causing widespread power supply interruptions and irreversible damage to the power system. Therefore, detecting network attacks and defects on the power system quickly and accurately, as well as providing a foundation for developing appropriate defense measures, is a crucial part of ensuring the power system’s safe and stable functioning [7,8].
The smart grid detects abnormal data and abnormal events through state estimation, but traditional state estimation methods cannot meet the fast calculation requirements of multidimensional heterogeneous data, and the intelligence is relatively low [9]. Machine learning algorithm theory is developing, and its application in the field of CPPS network attack detection is becoming increasingly common [10,11,12]. Ensemble learning algorithms, as a branch of machine learning algorithms, have the advantages of both detection efficiency and accuracy without the need for complex time–frequency domain modeling calculations. The deployment of a wide-area measurement system provides large sample data support for ensemble learning algorithms. Therefore, the ensemble learning algorithm has certain advantages for network attack detection [13,14]. However, under a closed system sampling dataset, the lack of the network attack sample brings serious challenges to the training precision of the machine learning model. The lack of network attack samples causes serious data imbalance. The imbalance increases the low precision of network attack and fault detection. In the physically measured data, the network attack samples and the fault sample show a high degree of similarity. The classic machine learning algorithm has the disadvantages of insufficient detection rate and high false detection rate [15].
Aiming at the above problems, this paper proposes a network attack and fault detection method with an ensemble classifier; this method has been verified to apply to the following attack types: false data injection attack, control signal tampering attack, and fragile device attack. The pseudo sample generation strategy is used to solve the shortcomings of the low detection precision caused by the failure and insufficient network attack samples. At the same time, we constructed and improved the LightGBM ensemble classifier to further improve the detection precision of network attacks. It also proposes the reliability evaluation method of the network attack detection model. Under the action of the network attack detection model, the main contributions of the quantitative analysis of the power system security are as follows:
- (1)
- Imbalanced datasets where the majority of samples are benign may lead to high rates of false alarms. To overcome the problem, a centralized SMOTE oversampling approach is presented to obtain sufficient network attack pseudo data and implement data balancing processing. The MRMR feature selection method is used to reduce the dimension of the data, reduce the training time of the network attack detection model, and improve the efficiency of network attack detection.
- (2)
- Based on the focal loss, a LightGBM-integrated learning classifier is built to correct errors during model iterations and increase the attention weights for misclassified samples. During the iterative process, the classification accuracy of such samples improves, increasing the efficiency of network attack and fault detection in general. The final attack detection rate is improved by 16.73%, and the precision is improved by 15.67%.
- (3)
- In the process of data flow transmission, the vulnerability index of each cyber-physical node is abstracted. Under the influence of network attacks, the vulnerability of the whole cyber-physical system is comprehensively quantified.
The remainder of the article is as follows: the second section introduces the related work, the third section is a brief description of the proposed methods and the technologies used, the fourth section is the experimental verification of the proposed methods, and the fifth section is the conclusions and prospects of this paper.
1.2. Related Works
Ganjkhani et al. [15] propose a network attack detection method based on a nonlinear autoregressive neural network. The method reduces the complexity of the algorithm to a certain extent and effectively improves the real-time performance of network attack detection. Xu et al. [16] propose a two-stage state prediction method to predict the measurement vector of the vulnerable node. Based on the threshold residual of the predicted value and the true value, the network attack is detected to realize the protection of the vulnerable node. Zhao et al. [17] propose a short-term prediction method to analyze the real-time condition and the consistency of the measured data of the power system. Based on norm and norm detect network attacks, the shortcomings of traditional detectors in dealing with decision boundary problems are solved.
Hu et al. [18] propose a bad data detection and correction method based on kernel density estimation, which increases the ability to restore error data and improves the elastic error control ability of the system. Chaojun et al. [19] propose a feature extraction method based on a genetic algorithm to obtain the key features of the data to be detected, combined with the Euclidean detector, to detect the outliers in the state estimation data. The Euclidean distance-optimized Kalman filter was used to detect network attacks [20]; the traditional state estimation method based on the least squares method could not identify network attacks, the model solves the problem and has a significant effect on reducing the false alarm rate caused by noise.
Ahmed et al. [21] propose an improved genetic algorithm for the feature selection of state estimation data. It filters out redundant and irrelevant features and selects the optimal low-dimensional feature combination to represent the raw data. It then uses a support vector machine (SVM) as a classifier to identify network attacks, which improves the efficiency of network attack detection. Mohammadpourfard et al. [22] propose a new physical model to resist the false data injection attack. The model uses the GAN algorithm to capture the deviation between actual and ideal measured values and maintain the integrity of state estimation in real-time. Xue et al. [23] propose a One-Class-One-Network (OCON) framework based on extreme learning machine (ELM) to identify network attacks and data recovery based on spatial correlation analysis of power data. The method ensures the normal state estimation of the power system. James et al. [24] propose an online identification mechanism for AC system network attacks based on deep learning. To identify potential network attacks in real-time, the spatial characteristics of historical data were extracted by wavelet transform, and the recurrent neural network was constructed. The design of the machine learning algorithm avoids solving complex time–frequency domain problems of the power system, and the efficiency is relatively high.
In addition, the method using the same dataset of the works of literature is discussed in this section. The work conducted by Hink et al. [25] had an accuracy of approximately 90% and 75% over the multi-class dataset for JRipper–Adaboost and random forest, respectively. Wu et al. [26] propose a sequential pattern mining approach to extract patterns of power system disturbances and network attacks accurately. The mining common path algorithm had an accuracy of 93% on the multi-class datasets. Mohsenian-Rad et al. [27] propose a privacy preservation intrusion detection technique based on the correlation coefficient and expectation–maximization clustering mechanisms, which select important portions of data and recognize intrusive events. The model had a recall rate of 88.9% over the multi-class datasets with 75% of features. However, this work did not consider network attack detection from the perspective of the interaction between the cyber layer and the physical layer. Li J et al. [28] study the potential vulnerabilities of machine learning applied in CPSs by proposing a general threat model for Constrained Adversarial Machine Learning (ConAML). Li B et al. [29] propose a novel federated deep learning scheme named DeepFed.
The current CPPS network attack detection methods are divided into the time state predicting method, the state estimation method, and the machine learning detection method. The time state prediction method improves the dynamic state estimation ability of the power system [15,16,17]. However, the above methods are prone to low detection precision when a transient process occurs in the power grid due to non-attack factors. The state estimation method represented by [18,19,20] is simple in principle, is more in line with the characteristics of the power system, and has a high detection speed. However, the setting of the detection threshold brings a certain experience error and low precision. The traditional machine learning algorithms represented by [21,22,23,24] are very dependent on data quality, and the imbalance of sample numbers has a great influence on the training precision of the model. The deep learning algorithm is extremely dependent on the training data of large samples; the model complexity is high and the training speed is low. This model, which still needs to be improved in dealing with data imbalances, did not conduct a cyber-physical security assessment of the test results. Due to its ensemble voting and parallel characteristics, the ensemble learning algorithm can better balance the training precision and training speed and has higher advantages in solving network attacks and fault detection methods.
Based on the above analysis, this paper proposes a CPPS network attack detection method. The method uses the ensemble learning classifier as the final detector and uses heterogeneous data of cyber-physical fusion as the driving force. On the one hand, it increases network attack detection and a CPPS’s capacity to prevent network attacks. On the other hand, it increases the power grid’s anti-disturbance capability and decreases the power system’s economic loss by providing timely fault location predictions.
2. Methodology
2.1. Analysis of Smart Grid Network Attack Path
The network attack path of the power system is shown in Figure 1; a remote terminal unit (RTU) was widely used to collect measured data. The measured data were transmitted to the Power Control Center (PCC) through the communication network system. The PCC estimated the state of the power system based on the measured data. The abnormal estimation results were filtered out by bad data detection (BDD), and then the accurate state estimation was carried out again [25,26]. Based on the final estimation results, the energy management system (EMS) made control decisions on the power system such as capacity control, emergency time analysis, and electric power flow optimization. It then sent the final control signals to the physical grid through the communication system to maintain the power system’s normal operation [27]. In recent years, with the deepening of academic research on power system network attacks, a variety of potential network attack modes have been proven to possibly threaten the normal operation of power systems, such as false data injection attacks, control signal tampering attacks, and fragile device attack. This article mainly analyzes these three types of network attacks. The network attack path is shown in Figure 1.
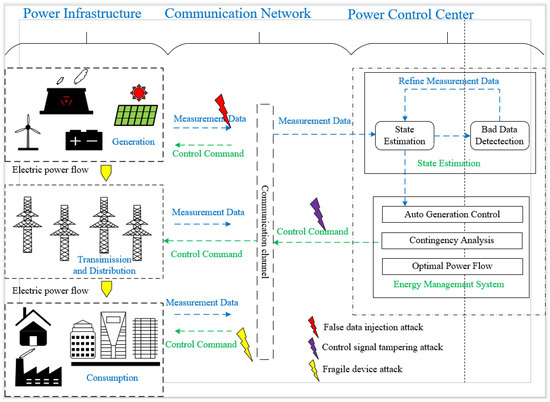
Figure 1.
Network attack intrusion path.
Among them, when a false data injection attack occurred, the underlying measurement data were uploaded to the power control center through the communication system. In addition, the data had been injected and bypassed the bad data detection mechanism, resulting in erroneous state estimation. The malicious control signal tampering attack modified the directives sent by the control center to the physical device, causing the device to lose control. The fragile device attack occurred on specific power equipment, and the equipment information was maliciously tampered with, which was not controlled by the power control center. The network attack on the CPPS seriously endangered the stable operation of the power system. To maintain the normal operation of the power system, a network attack detection method was urgently needed to predict the occurrence of network attacks or faults in the power system.
2.2. Network Attack Path Analysis of Smart Grid
The transient process from the occurrence of a network attack to the power system paralysis was very short. Therefore, it was difficult to obtain sufficient data to characterize the power grid state when the attack occurred, resulting in a serious imbalance between the number of network attack samples and normal samples. On the one hand, the number of network attack samples was insufficient to meet the modeling requirements of the machine learning algorithms. On the other hand, data imbalance made the learning ability of the model biased towards most class samples, which made the performance of the model unreliable [30,31]. To reduce the impacts of sample size differences, a central interpolation strategy was proposed to improve the Kmeans–SMOTE oversampling algorithm—Center interpolation Kmeans–SMOTE (CIKS), which implemented the oversampling of data to obtain a balanced network attack data.
The CIKS algorithm included three steps of clustering, filtering, and sampling. The algorithm execution process is shown in the Figure 2.
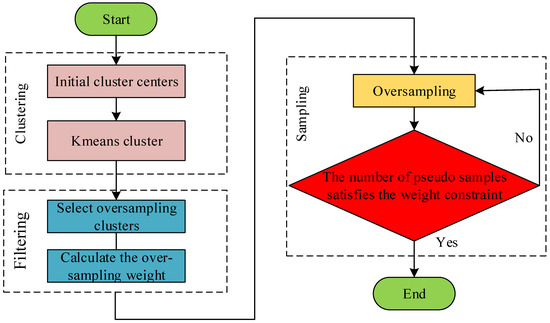
Figure 2.
The execution process of the CIKS algorithm.
- (1)
- Clustering: based on the Kmeans clustering algorithm, clustering centers were determined in the minority sample space, and the minority samples were clustered into clusters according to the location of the cluster centers.
- (2)
- Filtering: Select clusters that participated in oversampling. The principle was that several clusters containing a large number of minority class samples participated in oversampling. After determining the clusters participating in the oversampling, we calculated the sampling weight of the clusters participating in the oversampling. The sampling weight determined the number of pseudo samples generated in the cluster. The clusters participating in the oversampling were given a sampling weight between 0 and 1. At the same time, the minority sample density lower clusters were assigned high sampling weights and generated more pseudo samples. The sampling weight depended on the ratio between the density of a single cluster and the average density of all selected clusters. The weight calculation steps are as follows:
- (a)
- For each filtered cluster , the Euclidean distance matrix between a few types of samples is calculated.
- (b)
- Add all the off-diagonal elements of the Euclidean distance matrix, and then divide by the number of non-diagonal elements to calculate the average minority sample distance for each cluster.
- (c)
- The minority sample number in each cluster is divided by the power of its average minority sample distance, and the density of the cluster is calculated as shown in Equation (1):where represents the number of minority samples in the cluster , , represents the method for calculating the average minority sample distance.
- (d)
- Calculate the sparse factor .
- (e)
- The sampling weight of each cluster is equal to the sparse factor of the cluster divided by the sum of the sparse factors of all clusters.
The sum of all sampling weights was 1. According to this feature, the sampling weight of the cluster was multiplied by the total number of samples to be generated, which was the number of samples to be generated in the cluster.
- (3)
- Sampling: after the sampling weight was determined, in the filtering stage, for clusters involved in sampling, oversampling was performed in turn. The oversampling is shown in Figure 3. A sample in the cluster was then randomly selected, and we performed a linear interpolation between the cluster center to generate a new sample. We looped the above steps until all pseudo samples in the cluster matched the weights determined in step (2), and the oversampling was ended.
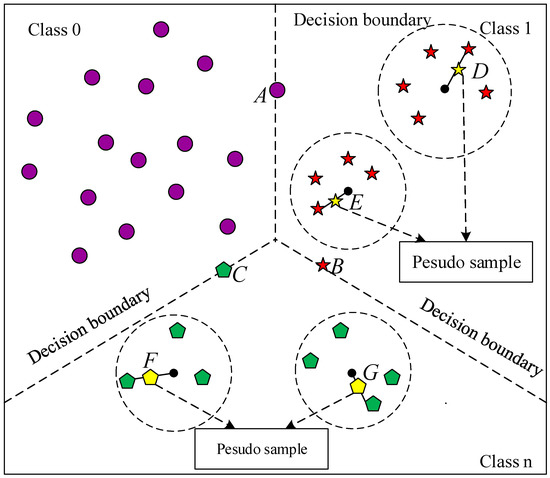 Figure 3. The construction method of the pseudo sample database.
The CIKS algorithm uses a simple Kmeans clustering algorithm and linear interpolation operation to obtain sufficient pseudo data which are highly similar to the original power data. It provides a large sample of training data for the ensemble learning algorithm and reduces the adverse effects of data imbalance on the network attack detection model.
2.3. Network Attack Detection Method Based on LightGBM
2.3.1. The Features of the LightGBM Algorithm
LightGBM is an ensemble learning algorithm based on a decision tree. The algorithm is an improved version of the gradient boosting decision tree (GBDT) algorithm. The gradient boosting decision tree (GBDT) is an ensemble learning framework based on decision trees. The GBDT uses gradient descent to approximate each decision tree in an additive model, as shown in Figure 4.
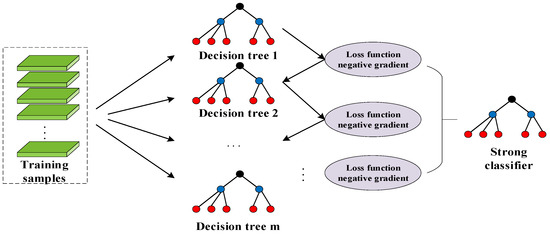
Figure 4.
The framework of the GBDT algorithm.
To improve prediction accuracy, a new decision tree was created in each iteration to minimize the loss function in the direction of the fastest decreasing loss function—the negative gradient direction. The GBDT model composed of decision trees are as shown in Equation (2):
The represents the linear combination coefficient of the decision trees, represents a decision tree model.
LightGBM is an improved GBDT that overcomes the shortcomings of GBDT overfitting and slow training speed. This improvement facilitates the detection of CPPS network attacks and failures [32]. The key improvement strategy is shown in Figure 5. The advantages of the LightGBM algorithm are shown below:
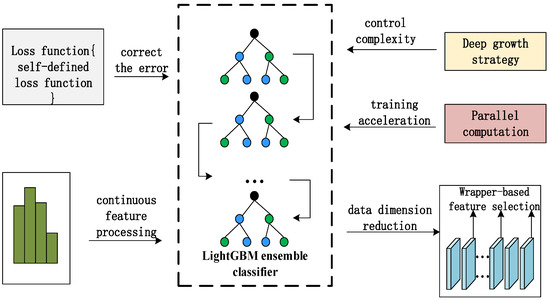
Figure 5.
LightGBM optimization strategy.
- (1)
- The mechanism that supports parallel training reduces the training time.
- (2)
- The algorithm supports a self-defined loss function, sets a reasonable loss function according to the business background, and constantly corrects errors in the iterative process, which improves the training precision.
- (3)
- The deep growth strategy controls the complexity of the model and reduces the risk of overfitting.
- (4)
- Data optimization uses the histogram algorithm to reduce model complexity.
2.3.2. The Improvement of the LightGBM Algorithm
To direct attention to the misclassified samples in the last iteration, the focal loss function was introduced to improve the LightGBM algorithm—focal loss LightGBM (FLGB), so that the classifier adjusted the attention of the misclassified samples in the training process, and then improved the training precision in the next iteration. The focal loss function is shown in Equation (3):
During the iteration, when a sample is misclassified, the value is very small and the regulatory factor is close to 1, the losses are unmediated; when the probability of a sample being classified correctly is large, the regulatory factor is close to 0, the losses unmediated, the weight of samples with high classification possibility is reduced. Super parametric smoothly adjusts the proportion of easy-to-segment samples to reduce weights. An increasing super parameter can enhance the influence of adjustment factors. The adjustment factor reduces the contribution of separable samples and broadens the scope of sample loss. From the above analysis, the focal loss reduces the samples’ weight, which is easy to classify. At the same time, it increases the samples’ weight which is difficult to classify [33]. Therefore, the classifier pays more attention to difficult classification samples, which further improves the precision of the classifier. The LightGBM algorithm optimized by focal loss improves the detection precision of network attacks; thus, the performance is more stable.
2.4. Reliability Evaluation of Network Attack Detection Model
The key feature of the CPPS is real-time perception and dynamic control. We uploaded measurement data from the physical layer to the information layer for data analysis, then the information layer returned the control signal, which constituted the closed-loop control. According to the actual power topology, the CPPS was divided into nodes to be measured: data acquisition nodes, information nodes, and control nodes. The closed-loop control forms the following topology: physical node to be measured → data acquisition node → information node → control node → physical node to be measured. According to the prediction results based on the network attack identification model, the security coefficient was assigned to the data communication between nodes. The higher the precision of network attack detection, the higher the security under the influence of network attack.
Suppose is the number of the information physical data transfer process (closed-loop), represents the network security index from the physical node to be measured to the measurement node, represents the network security index between measurement nodes and information nodes, represents the network security index from information node to control node, represents the network security index between the control node and the physical node to be measured. The safety index (SI) of the entire CPPS and the reliability of the CPPS network attack detection model is shown in Equation (4):
2.5. Network Attack Detection Model Construction
Based on the above theoretical analysis, this article combines ensemble learning techniques to design a set of power system network attack detection methods. The trained model can monitor the real-time state of the power system and detect potential attack events in a timely way by swiftly creating mapping links between data inputs and outputs and avoiding complex time-domain equation solutions. The network attack detection framework is shown in Figure 6:
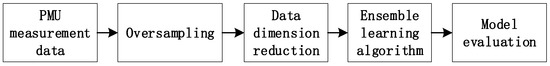
Figure 6.
The framework of the network attack detection method.
- (1)
- Collecting data based on a PMU, mainly including positive sequence, negative sequence, zero sequence voltage, current, and other continuous values, the average method is used to fill the missing value. The information layer data include discrete data such as relay logs, and structured heterogeneous data are constructed based on time.
- (2)
- To achieve data balancing, the number of samples to be sampled for each minority class of samples is established, and then pseudo samples are generated using the proposed CIKS algorithm and added to the original data. The minimum redundancy maximum relevance feature selection (MFS) algorithm is adopted to reduce the dimensionality and redundancy of the data.
- (3)
- The improved LightGBM classifier with focal loss function is trained on a balanced dataset to provide an autonomous network attack detection model, and the model’s performance is assessed on the test set.
- (4)
- Based on the results of network attack detection and cyber-physical topology, a reliability evaluation method of the network attack detection model is proposed. In the impact of network attacks, the method evaluates the risk of data interaction between cyber-physical nodes and obtains the final result based on the weighted average method. The weighted average approach is used to calculate the reliability quantification results of the final network attack identification model.
3. Example Analysis
3.1. Data Sources
The public data provided by Mississippi State University were used to assist in the performance verification of the proposed network attack detection method [34]; the specific dataset we used is “the multi-class of dataset 1: Power System Datasets”. The physical grid topology is a two-machine three-bus transmission system, and the specific topology is shown in Figure 7. The physical grid contains the devices as follows: P1 and P2 are two three-phase generators, and R1–R4 are four pieces of electronic equipment, respectively, which control on and off circuit breaker BR1–BR4 separately.
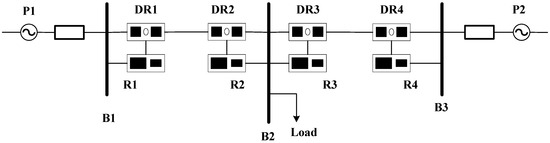
Figure 7.
The topology of a three-bus two-line transmission system.
The data include five types of scenarios, which are described as follows:
- (1)
- The power system operates or maintains normally, and there is no network attack or failure state.
- (2)
- Fault: a small current ground fault occurs in the power system.
- (3)
- False data injection attack: the attacker tampered with the amount of data and bypassed the residual detection mechanism, which caused the dispatcher to lose normal control of the power system.
- (4)
- Remote tripping command injection attack: the attacker tampered with the control signal of the circuit breaker, so that the circuit breaker could not normally turn on and off.
- (5)
- Attack on fragile device attack: the attacker tampered with the relay settings so that the relay cannot be disconnected when the power system fails.
The data have a total of 128 features, including data collected by 4 PMUs and snort logs. Each PMU measures 29 features, and the remaining 12 features are log information of the control panel. Table 1 describes the names and the physical meanings of the data features. Since the data acquisition device is four PMUs, each PMU measures the same index name, so only the data features collected by the first PMU are listed. The “#” in “R#-” represents the index of the PMU code, for example, “R1-PM1” represents the voltage amplitude measured by PMU R1.

Table 1.
Characteristic description.
3.2. Performance Verification of Large Samples
3.2.1. Analysis of the Oversampling Effect
Assuming that the 15 subsets of data are continuous in time, that is, on the premise of satisfying the characteristics of time series, we conducted longitudinal splicing of 15 subdatasets to obtain large sample datasets. According to the statistics of the sample numbers, there is still a serious imbalance in large sample datasets. After data balancing, the number of samples in each category is shown in Figure 8.
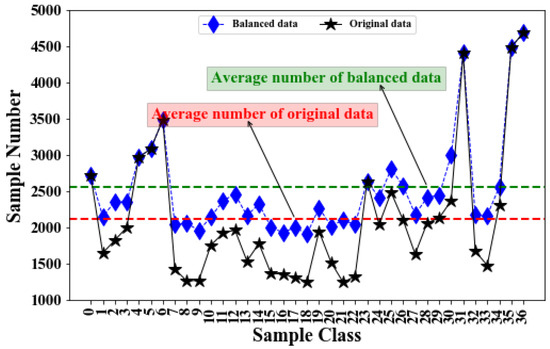
Figure 8.
Sample statistics before and after sampling.
In Figure 8, the black polyline represents the data before oversampling, and the red dashed line represents the mean of the samples before oversampling. The blue polyline represents the data after oversampling, and the green dashed line represents the mean of the samples after oversampling. Before sampling, the number of data samples is more scattered from the mean level, and the data are less balanced. After the pseudo samples are incorporated, the number of various samples gradually approaches the average level line. This indicates that the number of samples of each category is approaching the same order of magnitude, indicating that the data are becoming more balanced.
3.2.2. Analysis of Network Attack and Fault Detection Performance
We mainly use accuracy, precision, recall, and F1 score as performance indicators to measure network attack and fault detection methods. Accuracy is to measure the proportion of all correctly classified samples in the test set and to measure the overall recognition performance of the model for various samples. Precision is a measure of the proportion of all positive samples identified as positive samples and is an important reference to measure the accuracy of network attack identification. Recall is a measure of the proportion of true samples among all correctly classified samples, and is an important reference to measure the degree of false positives in network attack identification. The F1 score comprehensively considers the factors of precision and recall and is an important reference to measure the performance stability of the network attack recognition model. The F1 score is calculated as shown in Equation (5):
The global performance of the CIKS–MFS–FLGB method under large sample conditions is shown in Table 2.
Table 2.
Overall performance comparison.
Compared with the traditional LightGBM classifier, the accuracy of the CIKS–MFS–FLGB method is increased by 14.67%, the precision is increased by 15.67%, the recall rate is increased by 18.46%, and the F1 score is increased by 16.63%. The average prediction time for each sample is 3.5194 milliseconds, and the response speed to network attack detection is very fast. In each optimization stage of the LightGBM algorithm, the accuracy, precision, recall, and F1 score show a steady growth trend. On the whole, the CIKS–MFS–FLGB model greatly improves the detection precision of network attacks and maintains the stability of the power system. To show the local performance of the model in detail, the classification report of the model is shown in Figure 9:
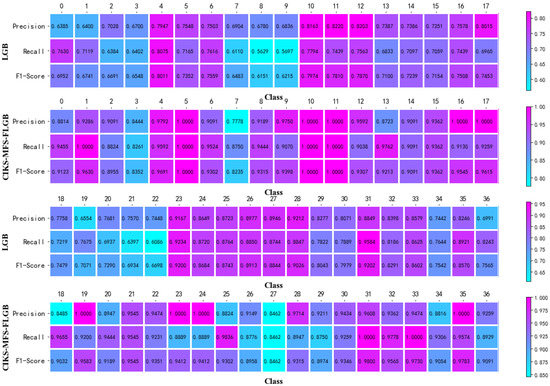
Figure 9.
Large sample classification report.
In order to better reflect the advantages of the model, Figure 9 shows the traditional LightGBM algorithm as a comparison. On the one hand, it can be seen from Figure 9 that the CIKS–MFS–FLGB model can significantly improve the detection precision of network attacks. This advantage is specifically reflected in the improvement of the precision, recall, accuracy, and F1 score of 37 types of data. The precision of the CIKS–MFS–FLGB method is improved by 20.1%. The recall of the CIKS–MFS–FLGB method is improved by 22.81%. The F1 score is also improved by 15.36%. On the other hand, the addition of false samples does not affect the sample precision of each class. Therefore, the noise content of the false samples obtained by the CIKS algorithm is very low, which has little negative impact on the prediction results. The generated samples can better fit the characteristics of the power data.
3.2.3. Analysis of Network Attack Detection Performance
Under the condition of large samples, the comparison of the CIKS–MFS–FLGB method and the classic LightGBM algorithm for network attack detection performance is shown in Table 3. Among them, compared with the traditional LightGBM algorithm, the CIKS–MFS–FLGB method has a detection precision of 93.85% for network attacks, the detection precision of 94.66% for a remote tripping command injection attack, and a detection precision of attacks on relay delay setting changes of 82.86%. The precision of these three types of attack detection is improved by 18.67%, 19.93%, and 11.90%, respectively. The F1 score is also improved by 22.92%, 20.62%, and 11.10%, respectively. In summary, the CIKS–MFS–FLGB method not only greatly improves the detection precision of network attacks, but also reduces the influence of false alarm rate on the stability of the model. It makes the model’s detection performance of network attacks more reliable. That is, when the data samples are enough, the CIKS–MFS–FLGB method can effectively detect various network attacks and improve the stability of the power system.
Table 3.
Large sample network attack detection performance.
3.2.4. Analysis of Fault Detection Performance
With the influence of network attacks, the fault detection results of the CIKS–MFS–FLGB method are shown in Table 4. The average detection precision of the CIKS–MFS–FLGB method for faults is 93.62%, and the average F1 score is 93.41%. The CIKS–MFS–FLGB method not only distinguishes the causes of various faults but also realizes the fuzzy localization of fault points. This makes it easier for operators to remove faulty devices in time after network attacks, avoiding or mitigating losses caused by transient processes. In addition, it achieves the stable and efficient operation of the power system.
Table 4.
Analysis of fault detection performance.
3.3. Performance Comparison of Different Algorithms
Under the condition of a large sample, different algorithms are compared on the overall precision rate, F1 score, attack detection rate, and fault detection rate. The attack detection rate is mathematically equal to the average F1 score of different types of network attacks, and the fault detection rate is mathematically equal to the average F1 score of different points of faults caused by different types of network attacks. The comparison results are shown in Figure 10. The comparison algorithms include K-nearest neighbors (KNN), decision tree (DT), voting classifier (VC), eXtreme Gradient Boosting (Xgboost), GBDT algorithm, random forest (RF), adaptive boosting (Adaboost), and extreme forest algorithm (EF). Excepting the decision tree and voting classifier algorithms, the parameter of KNN and the number of base classifiers of other algorithms are obtained by the grid search algorithm.
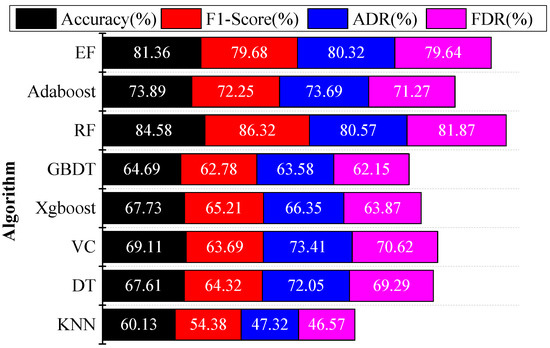
Figure 10.
Performance comparison of different algorithms.
The average detection precision of the CIKS–MFS–FLGB method for attack detection is 94.09% and the average F1 score is 93.61%. In general, the four indexes of the CIKS–MFS–FLGB are higher than the above eight algorithms. Among them, the accuracy increased by 21.75% on average, the F1 score increased by 24.87% on average, the attack detection rate increased by 23.96%, and the fault detection rate increased by 25.25%. After data balance processing, the CIKS–MFS–FLGB reduces the false alarm rate of the power CPS network attack identification model. Through comparative analysis, the CIKS–MFS–FLGB method realizes the detection of the CPPS network attacks with higher precision and improves the stability of the power system operation.
3.4. Reliability Analysis of Network Attack Detection Model
According to the actual structure of the CPPS, the abstract topology of the micro cyber-physical fusion system is drawn as shown in Figure 11. This experiment adopts the following assumptions: (1) There is only physical flow interaction between physical nodes, so there is no vulnerability to network attacks, so the interaction risk is 0%; (2) Information nodes will not be attacked by the network when there is collaborative analysis.
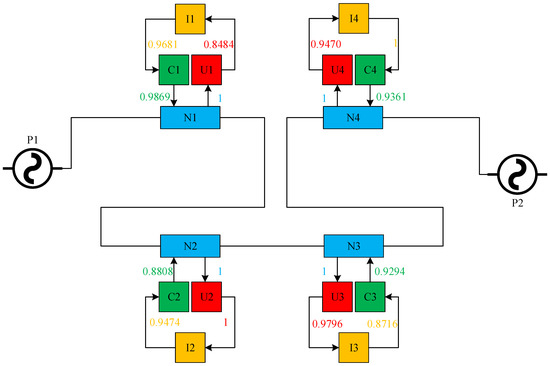
Figure 11.
Complex network topology of a CPPS.
In the figure, stands for four physical nodes, stands for two generators, stands for four data acquisition devices, stands for information nodes, stands for controllers, the direction of the arrow stands for the direction of data flow transmission, and the weight of the edge stands for the safety factor in the process of data transmission. The figure contains four closed data circulation loops, representing the closed-loop control of the four physical nodes from the measurement data acquisition to the control signal transmission. The process is as follows: , , , . Based on the arithmetic average method, the safety factors of the four roads are 0.9509, 0.9571, 0.9452, and 0.9708. Further calculation shows that the safety factor of the whole cyber-physical system is 0.956, that is, the reliability of the network attack detection model is 95.6%. It can help to protect the CPPS from network attacks to a certain extent.
4. Shortcomings
This paper provides an intelligent method for the network attack aiming at CPPS; at the same time, the faults caused by the attack can be detected effectively. However, there are some shortcomings in this paper.
At first, this method was validated only on a single CPS dataset; the next work will expand on the dataset. Furthermore, the model may be vulnerable to adversarial attacks. The defense system against adversarial attacks needs to be further strengthened. Biggio et al. [35], after almost a decade of research on adversarial machine learning, conclude that machine learning models are susceptible to adversarial perturbations. Apruzzese et al. [36] indicate that adversarial attacks represent a threat affecting the reliability of any cyber defense relying on artificial intelligence. Adversarial attacks will make the system miss or cause a misjudgment. Apruzzese et al. [37] address this problem by presenting AppCon, an approach to harden intrusion detectors against adversarial evasion attacks. The proposal leverages the integration of ensemble learning into realistic network environments, improving the detection rate against evasion attacks.
In future work, we would look for more open-source datasets or generate data through simulation, which would get more general conclusions. As for the problem of adversarial attacks in network attack detection, it is necessary to design a threat model that is more representative of the real defense environment to improve the detection rate for evasive attacks.
5. Conclusions
This paper proposes a CPPS network attack detection method based on ensemble learning, which greatly improves the stability of the power system operation under the influence of network attacks. First, an oversampling algorithm is proposed to achieve data balance, which improves the detection precision when facing an imbalanced dataset. The MRMR algorithm is used to reduce the dimension of the dataset, to reduce the risk of overfitting the classifier. Then, the focal loss is introduced to improve the LightGBM algorithm. In the iteration, the detection precision of the misclassified sample is improved. The attack detection rate is improved by 16.73% and the precision is improved by 15.67% using the CIKS–MFS–FLGB model. Finally, an evaluation method of the network attack detection model is proposed. Based on the network attack detection results and cyber-physical topology, the vulnerability of data flow transmission between cyber-physical nodes is abstracted. Based on the arithmetic average method, the reliability of the network attack identification model is obtained. This network attack detection method not only detects potential network attacks on CPPS but also predicts the fault location of the physical side under the influence of network attacks. It provides a reference for the operator to remove the fault in time. Therefore, it greatly improves the stability of the power system and provides a solution for the safe and stable operation of the cyber-physical system under the influence of network attacks.
Author Contributions
Conceptualization, J.C. and D.W.; methodology, J.C.; software, D.W.; validation, K.W. and Q.-M.W.; formal analysis, Q.-M.W.; investigation, X.-L.Y.; resources, Q.-M.W.; data curation, and X.-L.Y.; writing—original draft, D.W.; writing—review and editing, J.C.; visualization, X.-L.Y.; supervision, C.-L.C.; project administration, C.-L.C.; funding acquisition, K.W. All authors have read and agreed to the published version of the manuscript.
Funding
This work was supported by the Science and Technology Planning projects of Jilin Province, No. 20210201134GX.
Institutional Review Board Statement
Not applicable.
Informed Consent Statement
Not applicable.
Data Availability Statement
The data used to support the findings of this study are available from the corresponding author upon request.
Conflicts of Interest
The authors declare no conflict of interest.
References
- Kim, S.H.; Park, S. CPS(Cyber-Physical System) based Manufacturing System Optimization. Procedia Comput. Sci. 2017, 122, 518–524. [Google Scholar] [CrossRef]
- Ran, W.; Kelly, T.P.; Hawkins, R.; Armengaud, E. DEIS: Dependability Engineering Innovation for Cyber-Physical Systems; Springer: Cham, Switzerland, 2017. [Google Scholar]
- Irmak, E.; Erkek, I. An overview of cyber-attack vectors on SCADA systems. In Proceedings of the 2018 6th International Symposium on Digital Forensic and Security (ISDFS), Antalya, Turkey, 22–25 March 2018. [Google Scholar]
- Che, L.; Liu, X.; Shuai, Z.; Li, Z.; Wen, Y. Cyber Cascades Screening Considering the Impacts of False Data Injection Attacks. IEEE Trans. Power Syst. 2018, 33, 6545–6556. [Google Scholar] [CrossRef]
- Giraldo, J.; Urbina, D.; Cardenas, A.; Valente, J.; Faisal, M.; Ruths, J.; Tippenhauer, N.O.; Sandberg, H.; Candell, R. A Survey of Physics-Based Attack Detection in Cyber-Physical Systems. ACM Comput. Surv. 2019, 51, 1–36. [Google Scholar] [CrossRef] [PubMed]
- Nateghi, S.; Shtessel, Y.; Edwards, C. Resilient control of cyber-physical systems under sensor and actuator attacks driven by adaptive sliding mode observer. Int. J. Robust Nonlinear Control 2021, 31, 7425–7443. [Google Scholar] [CrossRef]
- Shi, L.; Jian, Z. Vulnerability Assessment of Cyber Physical Power System Based on Dynamic Attack-defense Game Model. Autom. Electr. Power Syst. 2016, 40, 99–105. [Google Scholar]
- Jiang, Y.; Xu, A.; Zhang, Y.; Hong, C.; Cai, X. Anticipate Fault Sets Generation Methods for Cyber Physical Power System Considering Cyber-Attacks. In Proceedings of the 2020 12th IEEE PES Asia-Pacific Power and Energy Engineering Conference (APPEEC), Nanjing, China, 20–23 September 2020; IEEE: Piscataway, NJ, USA, 2020. [Google Scholar]
- Cao, J.; Wang, D.; Qu, Z.; Cui, M.; Xu, P.; Xue, K.; Hu, K. A Novel False Data Injection Attack Detection Model of the Cyber-Physical Power System. IEEE Access 2020, 8, 95109–95125. [Google Scholar] [CrossRef]
- Wehenkel, L. Machine learning approaches to power-system security assessment. IEEE Expert 1997, 12, 60–72. [Google Scholar] [CrossRef] [Green Version]
- Hink, R.; Beaver, J.M.; Buckner, M.A.; Morris, T.; Adhikari, U.; Pan, S. Machine Learning for Power System Disturbance and Cyber-attack Discrimination. In Proceedings of the 7th International Symposium on Resilient Control Systems (ISRCS), Denver, CO, USA, 19–21 August 2014; IEEE: Piscataway, NJ, USA, 2014. [Google Scholar]
- Singh, N.K.; Mahajan, V. Analysis and Evaluation of Cyber-attack Impact on Critical Power System Infrastructure. Smart Sci. 2020, 9, 1–13. [Google Scholar] [CrossRef]
- Wang, D.; Wang, X.; Zhang, Y.; Jin, L. Detection of power grid disturbances and cyber-attacks based on machine learning. J. Inf. Secur. Appl. 2019, 46, 42–52. [Google Scholar] [CrossRef]
- Svetnik, V.; Wang, T.; Tong, C.; Liaw, A.; Sheridan, R.P.; Song, Q. Boosting: An ensemble learning tool for compound classification and QSAR modeling. J. Chem. Inf. Model. 2005, 45, 786. [Google Scholar] [CrossRef]
- Ganjkhani, M.; Fallah, S.N.; Badakhshan, S.; Shamshirband, S.; Chau, K.-W. A Novel Detection Algorithm to Identify False Data Injection Attacks on Power System State Estimation. Energies 2019, 12, 2209. [Google Scholar] [CrossRef] [Green Version]
- Xu, R.; Wang, R.; Guan, Z.; Wu, L.; Wu, J.; Du, X. Achieving Efficient Detection Against False Data Injection Attacks in Smart Grid. IEEE Access 2017, 5, 13787–13798. [Google Scholar] [CrossRef]
- Zhao, J.; Zhang, G.; La Scala, M.; Dong, Z.Y.; Chen, C.; Wang, J. Short-Term State Forecasting-Aided Method for Detection of Smart Grid General False Data Injection Attacks. IEEE Trans. Smart Grid 2015, 8, 1580–1590. [Google Scholar] [CrossRef]
- Hu, Z.; Yong, W.; Tian, X.; Yang, X.; Meng, D.; Fan, R. False data injection attacks identification for smart grids. In Proceedings of the 2015 Third International Conference on Technological Advances in Electrical, Electronics and Computer Engineering(TAEECE), Beirut, Lebanon, 29 April–1 May 2015; IEEE: Piscataway, NJ, USA, 2015. [Google Scholar]
- Chaojun, G.; Jirutitijaroen, P.; Motani, M. Detecting False Data Injection Attacks in AC State Estimation. IEEE Trans. Smart Grid 2015, 6, 2476–2483. [Google Scholar] [CrossRef]
- Manandhar, K.; Cao, X.; Hu, F.; Liu, Y. Detection of Faults and Attacks Including False Data Injection Attack in Smart Grid Using Kalman Filter. IEEE Trans. Control Netw. Syst. 2014, 1, 370–379. [Google Scholar] [CrossRef]
- Ahmed, S.; Lee, Y.; Hyun, S.-H.; Koo, I. Feature Selection–Based Detection of Covert Cyber Deception Assaults in Smart Grid Communications Networks Using Machine Learning. IEEE Access 2018, 6, 27518–27529. [Google Scholar] [CrossRef]
- Mohammadpourfard, M.; Sami, A.; Seifi, A.R. A statistical unsupervised method against false data injection attacks: A visualization-based approach. Expert Syst. Appl. 2017, 84, 242–261. [Google Scholar] [CrossRef]
- Xue, D.; Jing, X.; Liu, H. Detection of False Data Injection Attacks in Smart Grid Utilizing ELM-Based OCON Framework. IEEE Access 2019, 7, 31762–31773. [Google Scholar] [CrossRef]
- James, J.Q.; Hou, Y.; Li, V.O.K. Online false data injection attack detection with wavelet transform and deep neural networks. IEEE Trans. Ind. Inform. 2018, 14, 3271–3280. [Google Scholar]
- Wang, T.; Yang, T.; Pan, X.; Meng, Y.; Li, H.; Chang, P. Network attack risk assessment of power grid CPS System based on attacker’s perspective. IOP Conf. Ser. Earth Environ. Sci. 2021, 675, 012161. [Google Scholar] [CrossRef]
- Wu, Y.; Weng, J.; Qiu, B.; Wei, Z.; Qian, F.; Deng, R.H. Random Delay Attack and Its Applications on Load Frequency Control of Power Systems. In Proceedings of the 2019 IEEE Conference on Dependable and Secure Computing (DSC), Hangzhou, China, 18–20 November 2019; IEEE: Piscataway, NJ, USA, 2019. [Google Scholar]
- Mohsenian-Rad, A.-H.; Wong, V.W.S.; Jatskevich, J.; Schober, R.; Leon-Garcia, A. Autonomous Demand-Side Management Based on Game-Theoretic Energy Consumption Scheduling for the Future Smart Grid. IEEE Trans. Smart Grid 2010, 1, 320–331. [Google Scholar] [CrossRef] [Green Version]
- Li, J.; Yang, Y.; Sun, J.S.; Tomsovic, K.; Qi, H. ConAML: Constrained Adversarial Machine Learning for Cyber-Physical Systems. In Proceedings of the 2021 ACM Asia Conference on Computer and Communications Security, Hong Kong, China, 7–11 June 2021. [Google Scholar]
- Li, B.; Wu, Y.; Song, J.; Lu, R.; Li, T.; Zhao, L. DeepFed: Federated Deep Learning for Intrusion Detection in Industrial Cyber-Physical Systems. IEEE Trans. Ind. Inform. 2020, 17, 5615–5624. [Google Scholar] [CrossRef]
- Vuttipittayamongkol, P.; Elyan, E. Neighbourhood-based undersampling approach for handling imbalanced and overlapped data. Inf. Sci. 2019, 509, 47–70. [Google Scholar] [CrossRef]
- Last, F.; Douzas, G.; Bacao, F. Oversampling for imbalanced learning based on k-means and smote. arXiv 2017, arXiv:1711.00837. [Google Scholar]
- Wang, D.; Zhang, Y.; Zhao, Y. Lightgbm: An Effective miRNA Classification Method in Breast Cancer Patients. In Proceedings of the 2017 International Conference on Computational Biology and Bioinformatics, Newark, NJ, USA, 18–20 October 2017. [Google Scholar]
- Lin, T.Y.; Goyal, P.; Girshick, R.; He, K.; Dollar, P. Focal Loss for Dense Object Detection. IEEE Trans. Pattern Anal. Mach. Intell. 2017, 99, 2999–3007. [Google Scholar]
- Datasets. Available online: https://sites.google.com/a/uah.edu/tommy-morris-uah/ics-data-sets (accessed on 15 April 2014).
- Biggio, B.; Roli, F. Wild Patterns: Ten Years After the Rise of Adversarial Machine Learning. In Proceedings of the 2018 ACM SIGSAC Conference, New York, NY, USA, 16–29 July 2018; ACM: New York, NY, USA, 2018. [Google Scholar]
- Apruzzese, G.; Andreolini, M.; Ferretti, L.; Marchetti, M.; Colajanni, M. Modeling Realistic Adversarial Attacks against Network Intrusion Detection Systems. ACM Digit. Threat. Res. Pract. 2021. [Google Scholar] [CrossRef]
- Apruzzese, G.; Andreolini, M.; Marchetti, M.; Colacino, V.G.; Russo, G. AppCon: Mitigating Evasion Attacks to ML Cyber Detectors. Symmetry 2020, 12, 653. [Google Scholar] [CrossRef] [Green Version]
Publisher’s Note: MDPI stays neutral with regard to jurisdictional claims in published maps and institutional affiliations. |
© 2022 by the authors. Licensee MDPI, Basel, Switzerland. This article is an open access article distributed under the terms and conditions of the Creative Commons Attribution (CC BY) license (https://creativecommons.org/licenses/by/4.0/).