Article

A Novel Wavelet Selection Method for Seismic Signal Intelligent Processing

School of Resources and Safety Engineering, Central South University, Changsha 410083, China
*
Author to whom correspondence should be addressed.
Appl. Sci. 2022, 12(13), 6470; https://doi.org/10.3390/app12136470
Submission received: 11 June 2022 / Revised: 21 June 2022 / Accepted: 23 June 2022 / Published: 25 June 2022

Abstract

:
Wavelet transform is a widespread and effective method in seismic waveform analysis and processing. Choosing a suitable wavelet has also aroused many scholars’ research interest and produced many effective strategies. However, with the convenience of seismic data acquisition, the existing wavelet selection methods are unsuitable for the big dataset. Therefore, we proposed a novel wavelet selection method considering the big dataset for seismic signal intelligent processing. The relevance r is calculated using the seismic waveform’s correlation coefficient and variance contribution rate. Then values of r are calculated from all seismic signals in the dataset to form a set. Furthermore, with a mean value μ and variance value σ2 of that set, we define the decomposition stability w as μ/σ2. Then, the wavelet that maximizes w for this dataset is considered to be the optimal wavelet. We applied this method in automatic mining-induced seismic signal classification and automatic seismic P arrival picking. In classification experiments, the mean accuracy is 93.13% using the selected wavelet, 2.22% more accurate than other wavelets generated. Additionally, in the picking experiments, the mean picking error is 0.59 s using the selected wavelet, but is 0.71 s using others. Moreover, the wavelet packet decomposition level does not affect the selection of wavelets. These results indicate that our method can really enhance the intelligent processing of seismic signals.

1. Introduction

Seismic signals are the most important data source for humans to be able to understand seismic activity. However, the seismic signal is a non-linear, non-stationary, and noisy signal. If seismologists want to obtain more information from the seismic signal, they must process it, such as through event detection, phase picking, and noise filtering [1]. The proposal of wavelet transform (or a more nuanced approach called wavelet packet transform) gives a better solution and is extensively applied in seismic signal processing [2,3]. Nevertheless, the selection of wavelets has become a new research problem.
In the past few decades, wavelets have already been a powerful tool used for many applications [4]. In their application for the processing of data, wavelets can be used for signal processing, data compression, and data smoothing and denoising. Zhao et al. [5] proposed the improved empirical wavelet transform (EWT) to process vibration signals and to realize fault diagnosis in motor bearings. Álvarez-Cortés et al. [6] proposed a near-lossless compression method for remote sensing data utilizing regression wavelet analysis (RWA). Feng et al. [7] combined a wavelet with deep learning to reconstruct and denoise remote sensing images. In bioinformatic analysis, wavelets are widely used in fingerprint verification, biology for cell membrane recognition, protein analysis, electrocardiogram analysis, and so on. F.W. Onifade et al. [8] developed an algorithm using a circular Gabor wavelet to enhance fingerprint verification. Gao et al. [9] realized subcellular localization classification based on wavelet decomposition. Tian et al. [10] predicted protein–protein interactions using the wavelet denoising approach. Rajani Kumari et al. [11] utilized the pattern-adapted wavelet technique for R-peak identification in electrocardiogram signal analysis. It seems that wavelet has nothing to do with finance, but in the financial field, wavelet has also been widely used. For example, Choi [12] used wavelet correlation analysis to study the relationship between coronavirus (COVID-19) and economic uncertainty. Wavelets are also widely used in computer science, such as for Internet traffic description, speech recognition, computer graphic and multifractal analysis, etc. Liang et al. [13] combined wavelet transform and a convolutional neural network for content recognition of Internet traffic. Wavelet is also used to denoise speech during speech recognition [14]. Wavelets and multifractal systems have also been widely used in recent years. For example, Palanivel et al. [15] applied them in retinal vessel segmentation, Wirsing et al. [16] applied them in geomagnetically induced currents, and Pourgholam et al. [17] applied them in the detection of geochemical anomalies. There are many similar applications of wavelets in various fields.
Wavelet transform and wavelet packet transform have been extensively applied in various fields [18,19,20,21,22]. Researchers have proposed many wavelet selection strategies in the wavelet transform process [23]. R. Yan [24] proposed a measurement method using the statistical theory: energy–Shannon entropy ratio. Li et al. [25] presented a scale-dependent wavelet selection strategy based on the energy of the signal. This approach generated minor waveform distortion and denoised the partial discharge signal magnitude errors. Chompusri et al. [26] selected the appropriate wavelet to process the electrocardiogram by comparing the efficiency of the compression algorithm using different wavelets. S. Z. Mohd Tumari [27] made the final selection by calculating the minimum mean square error (MSE) between the original and constructed signals. Adamo et al. [28] utilized two quantitative indicators: the classic peak signal-to-noise ratio and the edge preservation of the filtered image to evaluate each wavelet, and they used this method to process real high-quality ultrasound images to verify reliability. J. Saraswathy et al. [29] used three criteria to find the optimal wavelet: the degree of similarity, regularity, and accuracy of correct recognition during classification processes. N.K. Al-Qazzaz [30,31] applied four evaluation criteria, signal-to-noise ratio (SNR), peak signal-to-noise ratio (PSNR), MSE, and the cross-correlation method for wavelet selection. U. Seljuq et al. [32] proposed a wavelet selection scheme by evaluating MSE, SNR, and correlation. Caio F.F.C. Cunha et al. [33] proposed a selection method for the wavelet and scale using digital signal energy spectral density. Considering the decomposition ability of a wavelet and the similarity of decomposition coefficients and analysis signals in information, the Ecom criterion proposed by H. He et al. [34] integrates parameters such as entropy, energy, mutual information, joint entropy, relative entropy, and conditional entropy. D.R. Wijaya et al. [35] proposed the Information Quality Ratio (IQR) as a new metric for wavelet selection in beef quality. IQR has a better capability to quantify the modifications of signal structure than MSE and correlation coefficients. Z.A.A. Alyasseri et al. [36] proposed the selected wavelet evaluation utilizing five metrics: SNR, SNR improvement, MSE, root mean square error (RMSE), and percentage root mean square difference (PRD). N. Ji et al. [37] found that time-error minimization and F1-score maximization can offer the relevant wavelet selection for gait event detection. R. Atangana et al. [38] proposed the selection metrics based on the percentage root mean square difference (PRD), the SNR, and the simulated frequencies to find the best and suitable wavelet for assessing normal, seizure-free, and EEG signals showing seizures.
The abovementioned researches provide many methods and strategies for wavelet selection. These wavelet selection methods can extract representative features for specific signal types, laying a foundation for further analysis. However, these methods are proposed for particular types and ranges of signals and are often unsuitable for large amounts of seismic waveforms. On the other hand, with the development of data acquisition, especially in earthquakes, the amount of data is becoming larger and larger. Therefore, the intelligent processing method of seismic data based on deep learning technology has also been commonly studied. In these intelligent data processing methods, the requirements for the prominent role of the signal after wavelet transformation are reduced because the deep learning methods can mine the deep features of the data. Based on the above changes, the demand for wavelet selection is more to stably characterize a particular type of signal after wavelet transformation. Therefore, we propose a novel wavelet selection method, mainly used in seismic data intelligent processing, to perform stable wavelet transform on big seismic data to improve intelligent processing.

2. Materials and Methods
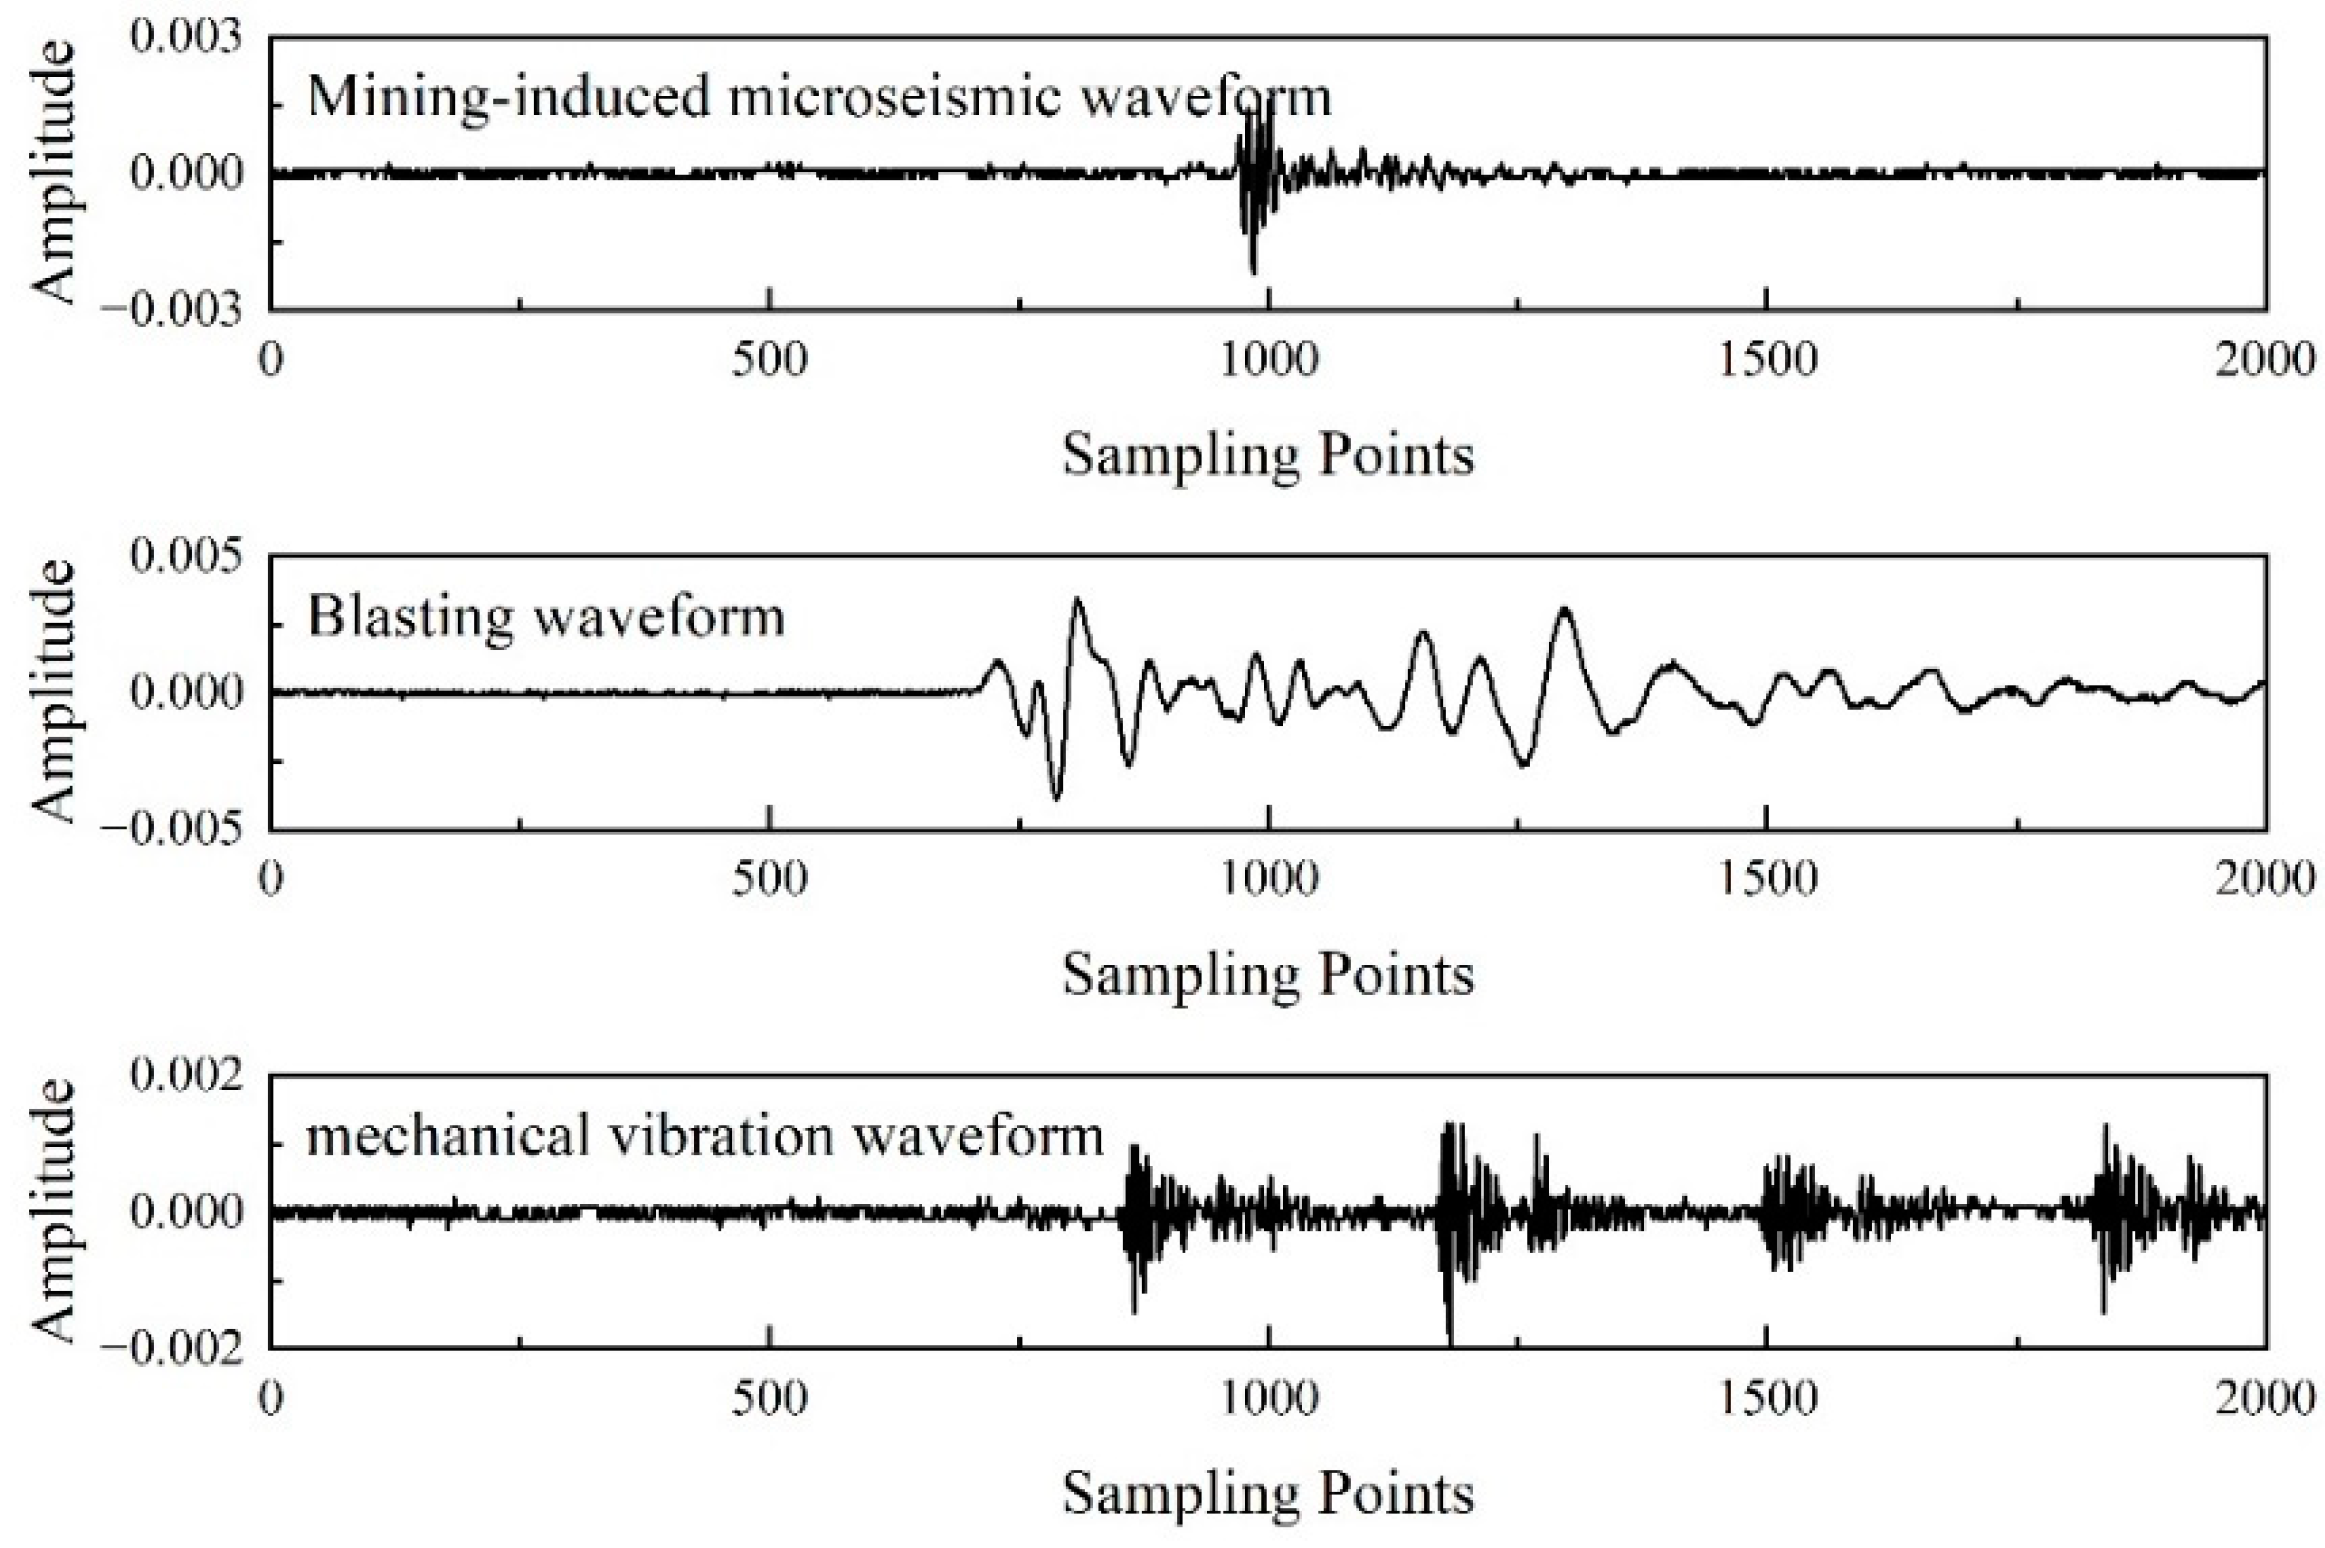
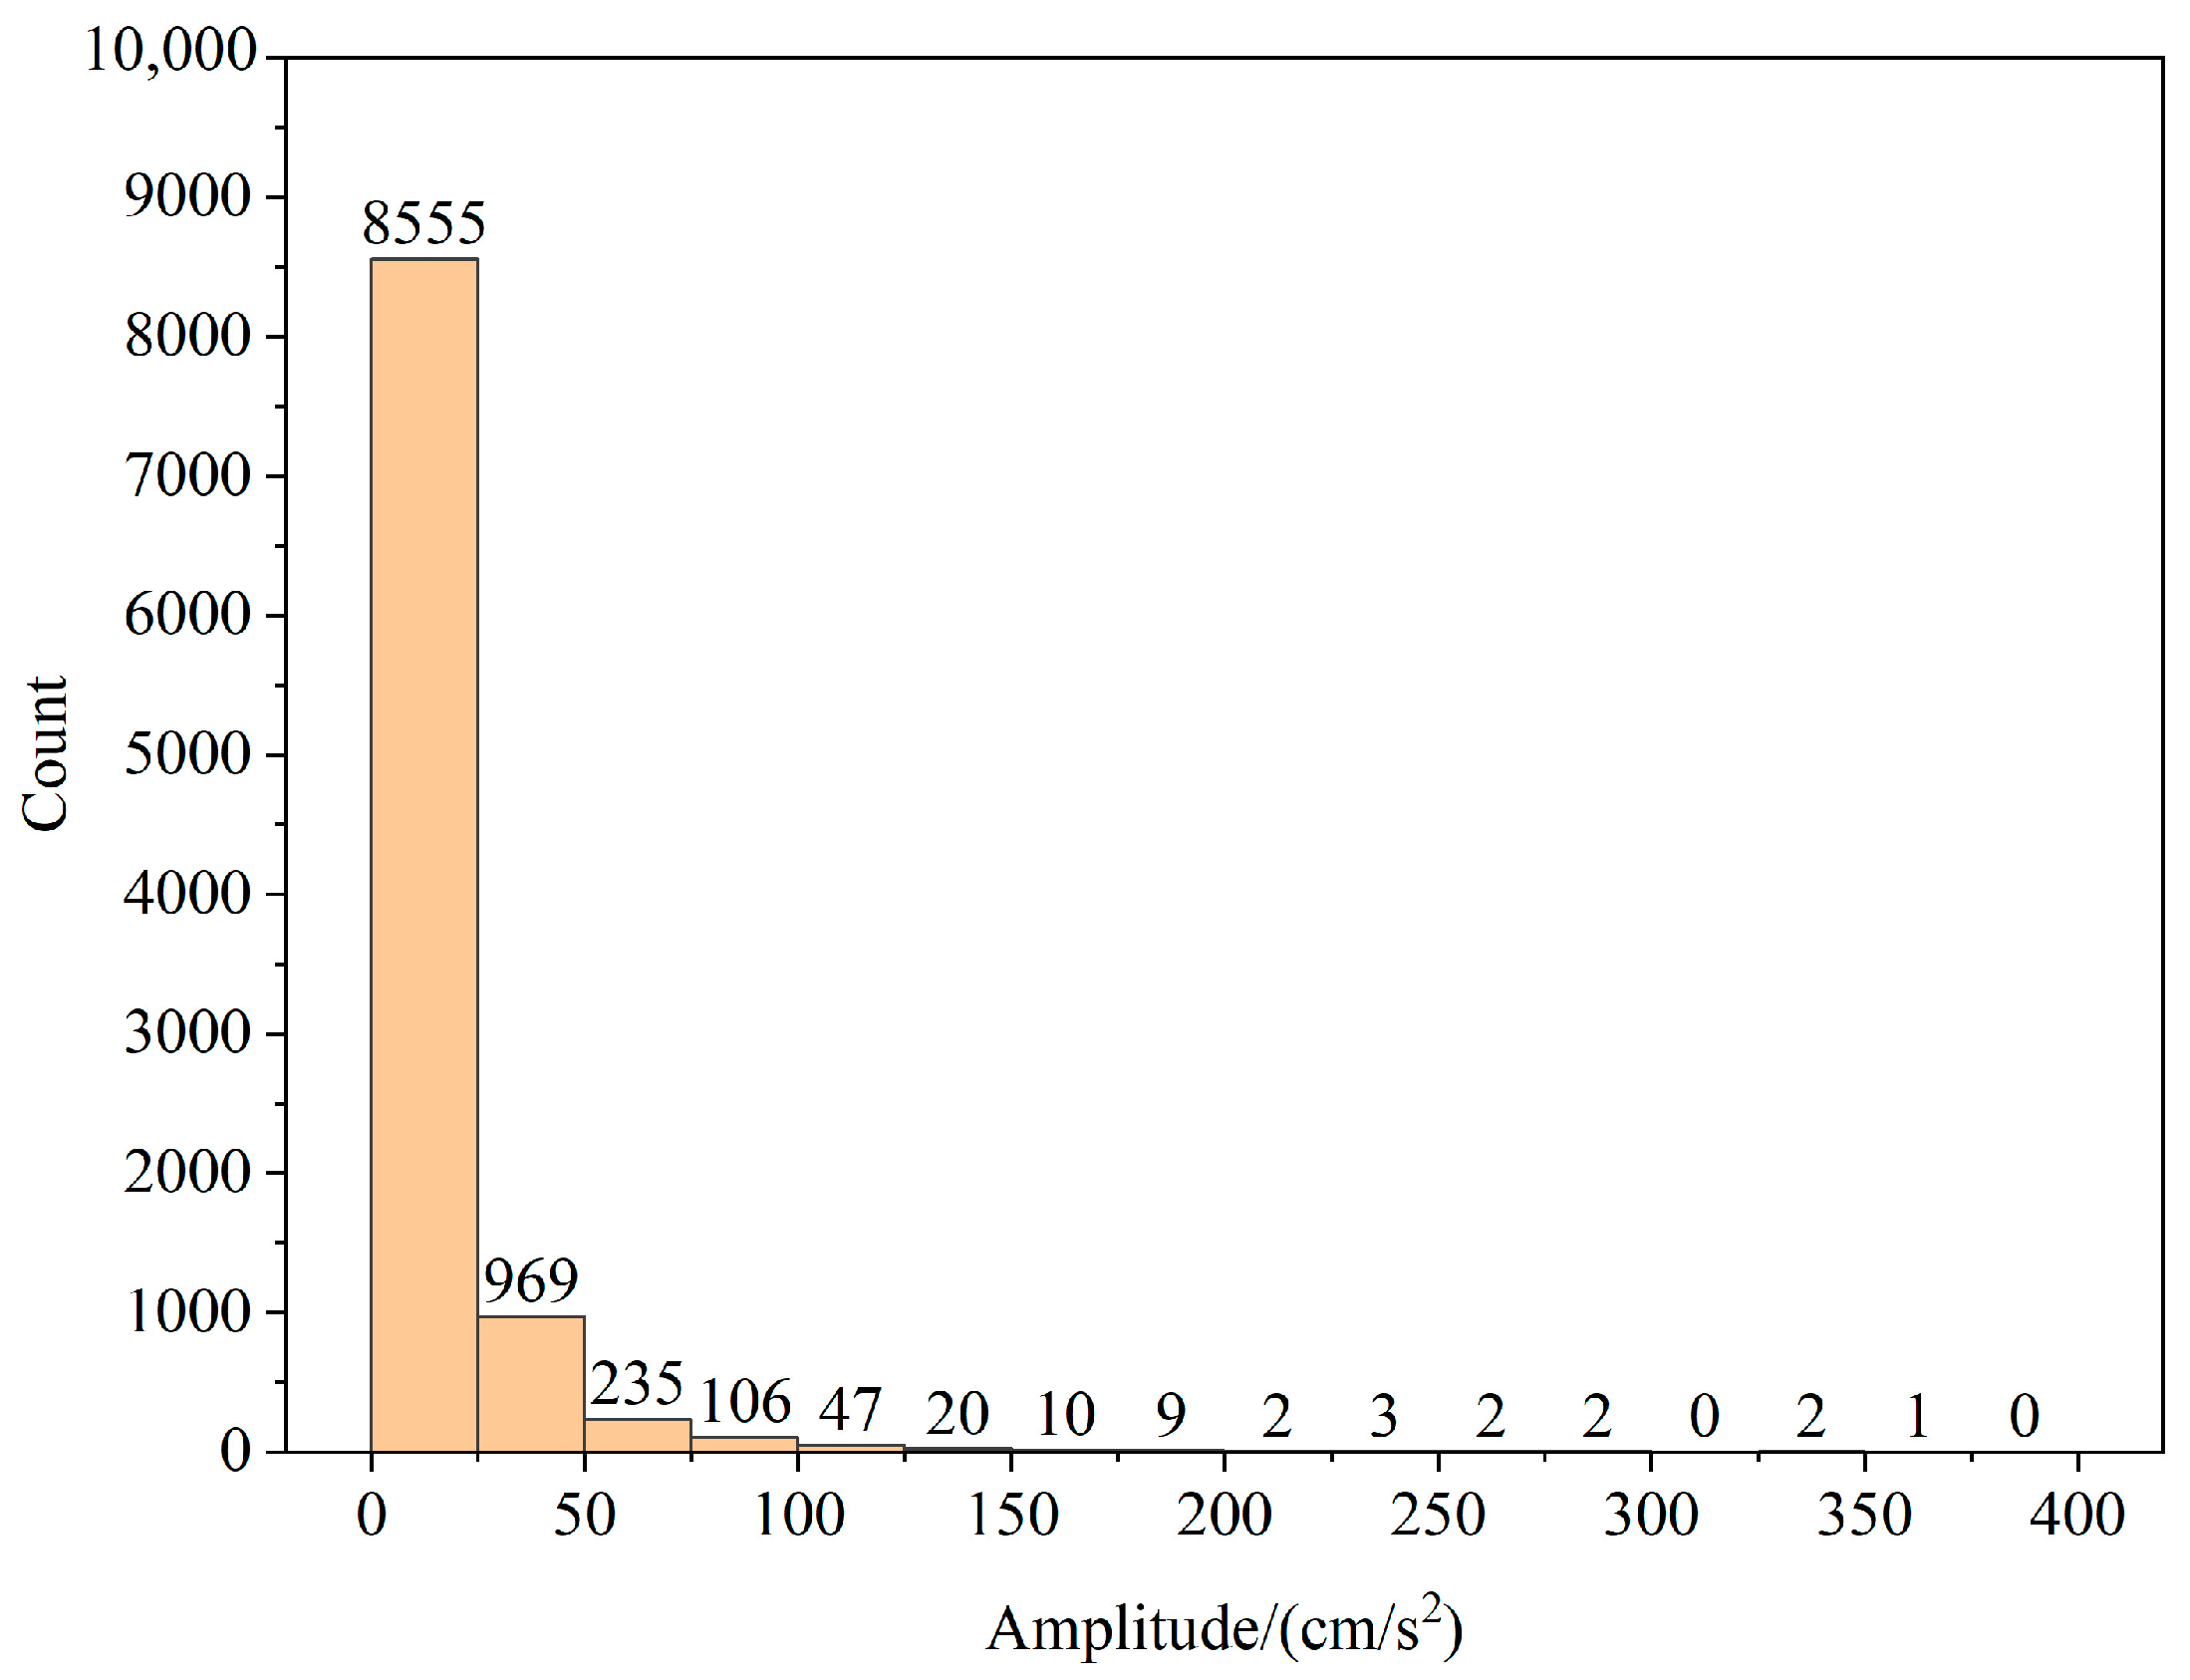
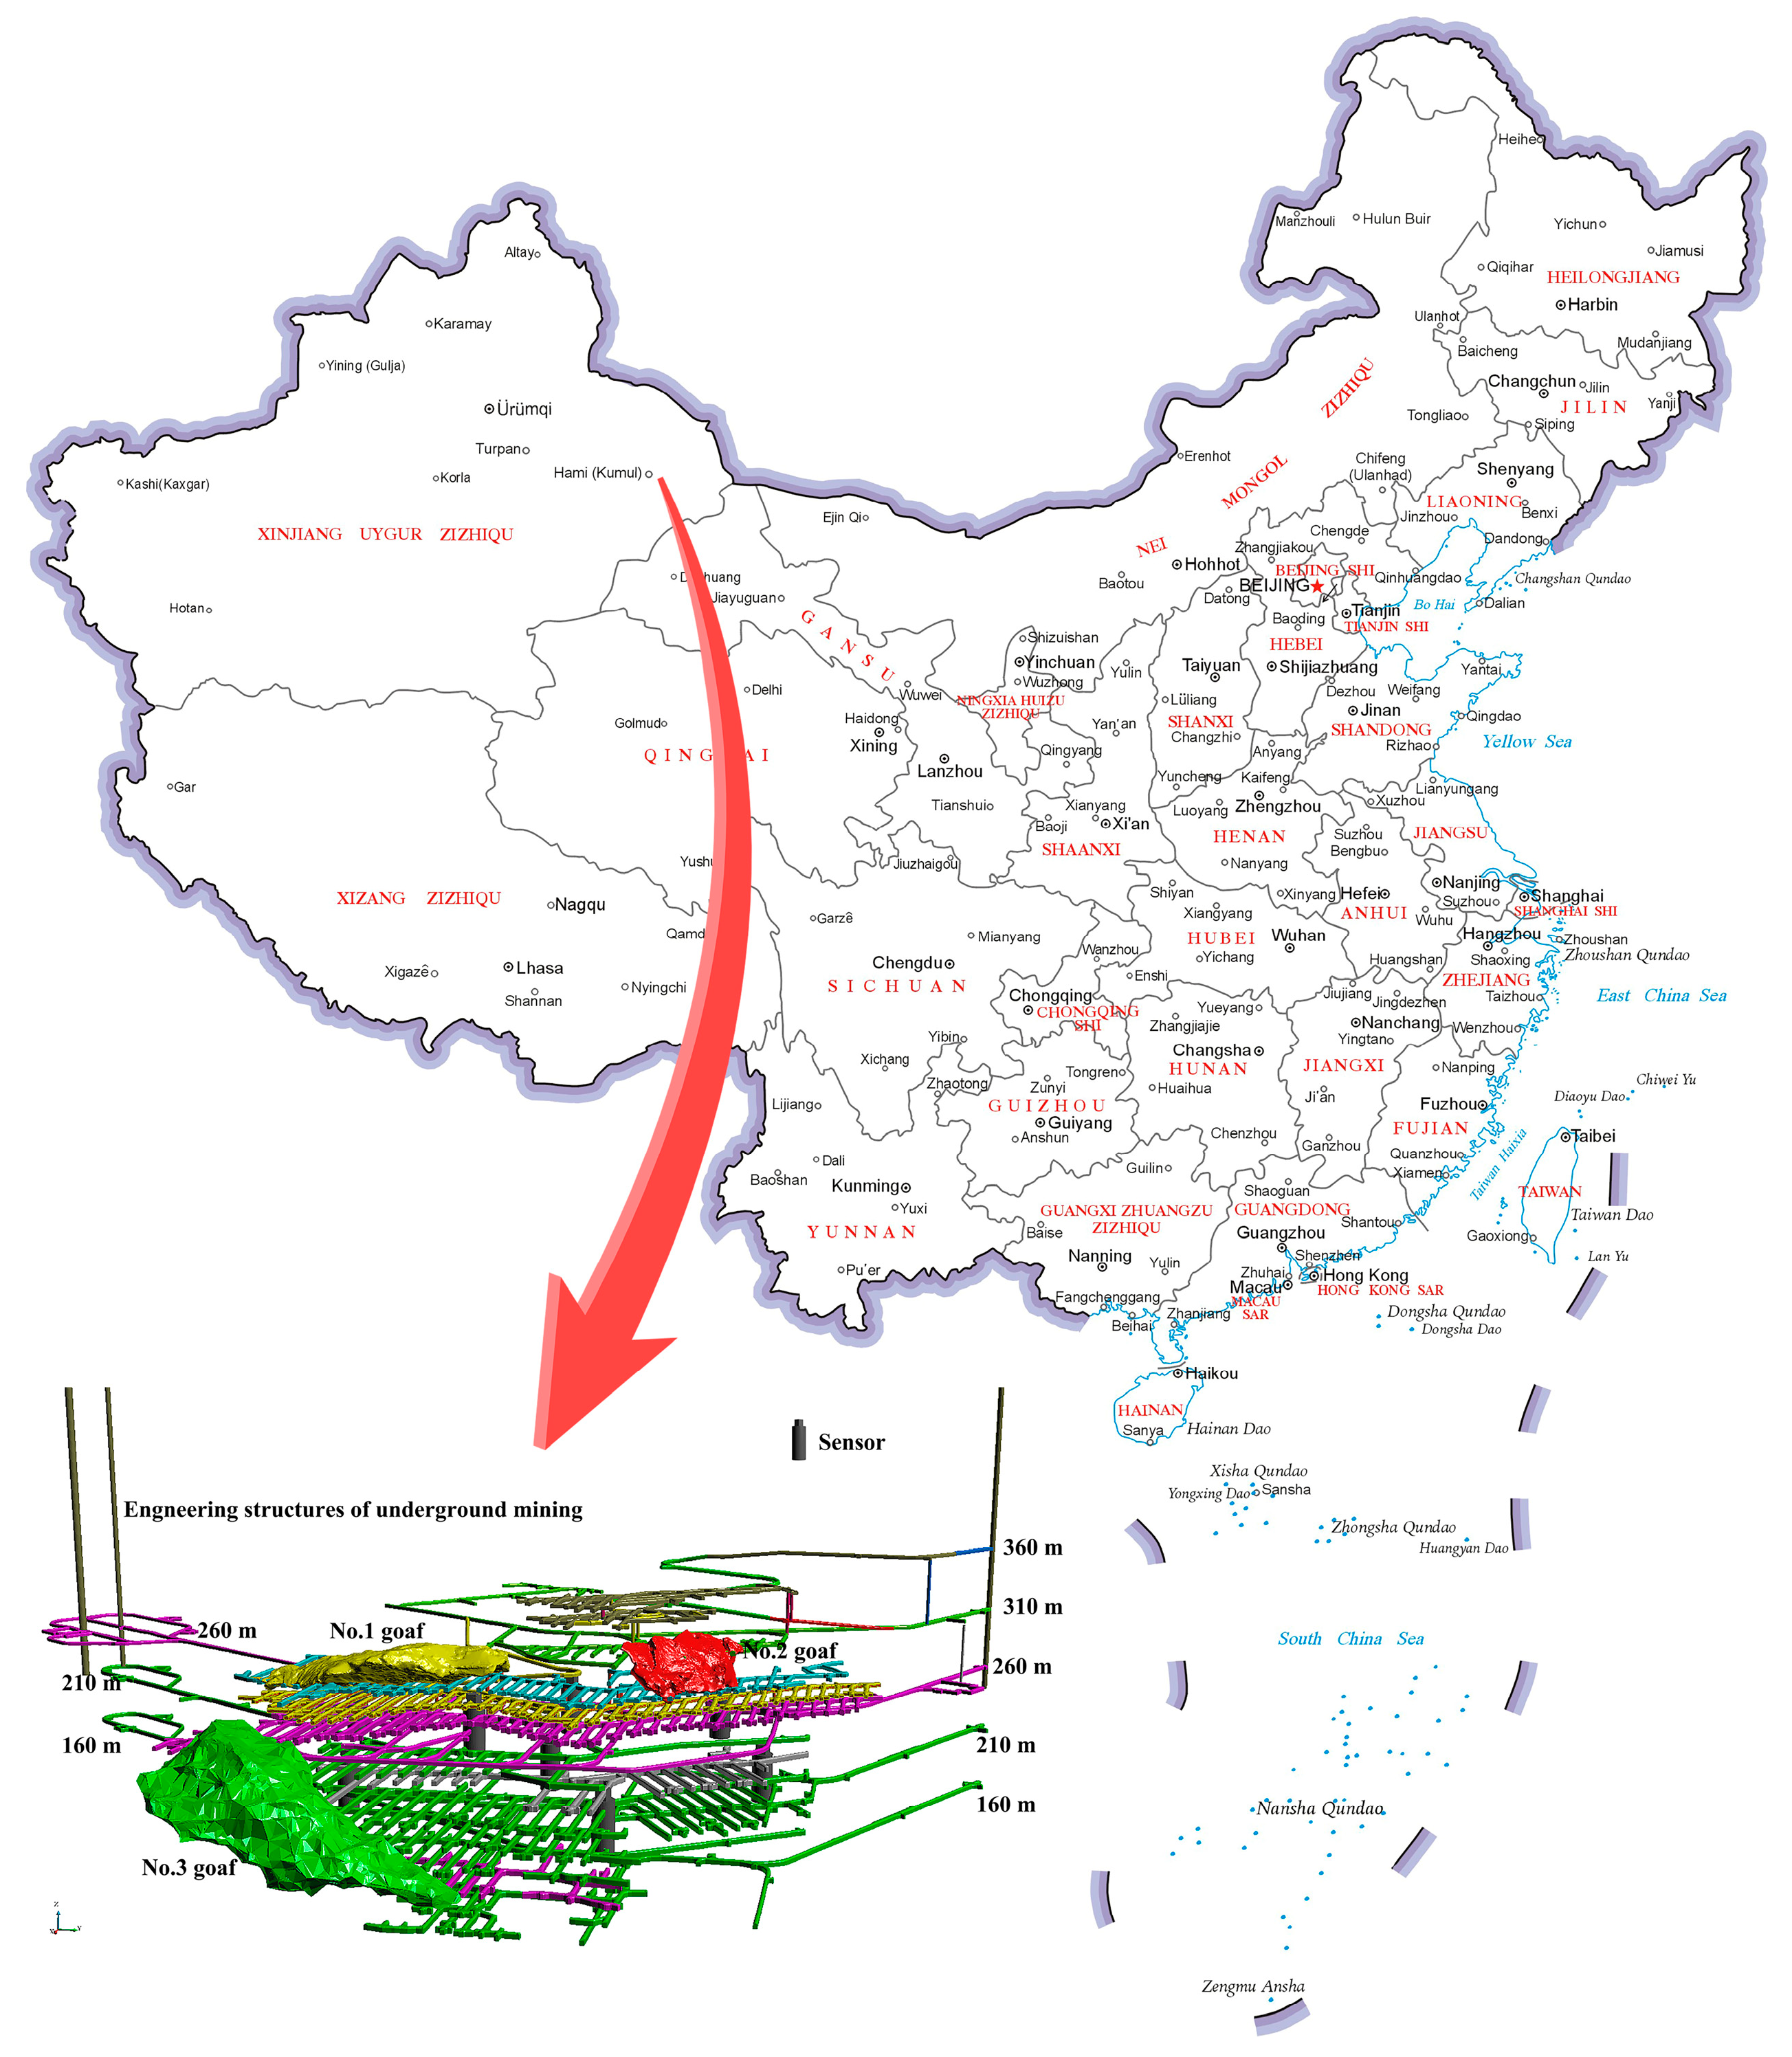
2.1. Dataset

We used mining-induced microseismic data and seismic data to verify our proposed method. Our mining-induced microseismic data came from the Huangtupo Copper and Zinc Mine, located in Hami City, China. For the specific conditions of this mine refer to the existing literature [39,40,41]. A mining-induced microseismic monitoring system was installed to monitor the safety of goaves in the mine. The system and goaves are described in Figure 1. Because natural seismic events and mining-induced microseismic events have apparent differences in frequency band and magnitude, the existing microseismic monitoring system only collects mining-induced microseismic events. However, as shown in Figure 2, due to the similarity between non-seismic vibration signals (such as blasting and mechanical vibration signals) and microseismic signals, some automatic methods must be used to distinguish them. We collected a dataset including 5400 mining-induced microseismic signals, 5400 blasting signals, and 5400 mechanical vibration signals.
The seismic dataset contains 9963 seismic records, and these records came from seismic activity around the world. The seismic data came from the Center for Engineering Strong Motion Data (CESMD) and the Northern California Earthquake Data Center (NCEDC). Each seismic record has 1500 sampling points, and the sampling rate is 200 Hz. Figure 3 shows the amplitude distribution of all used seismic records.

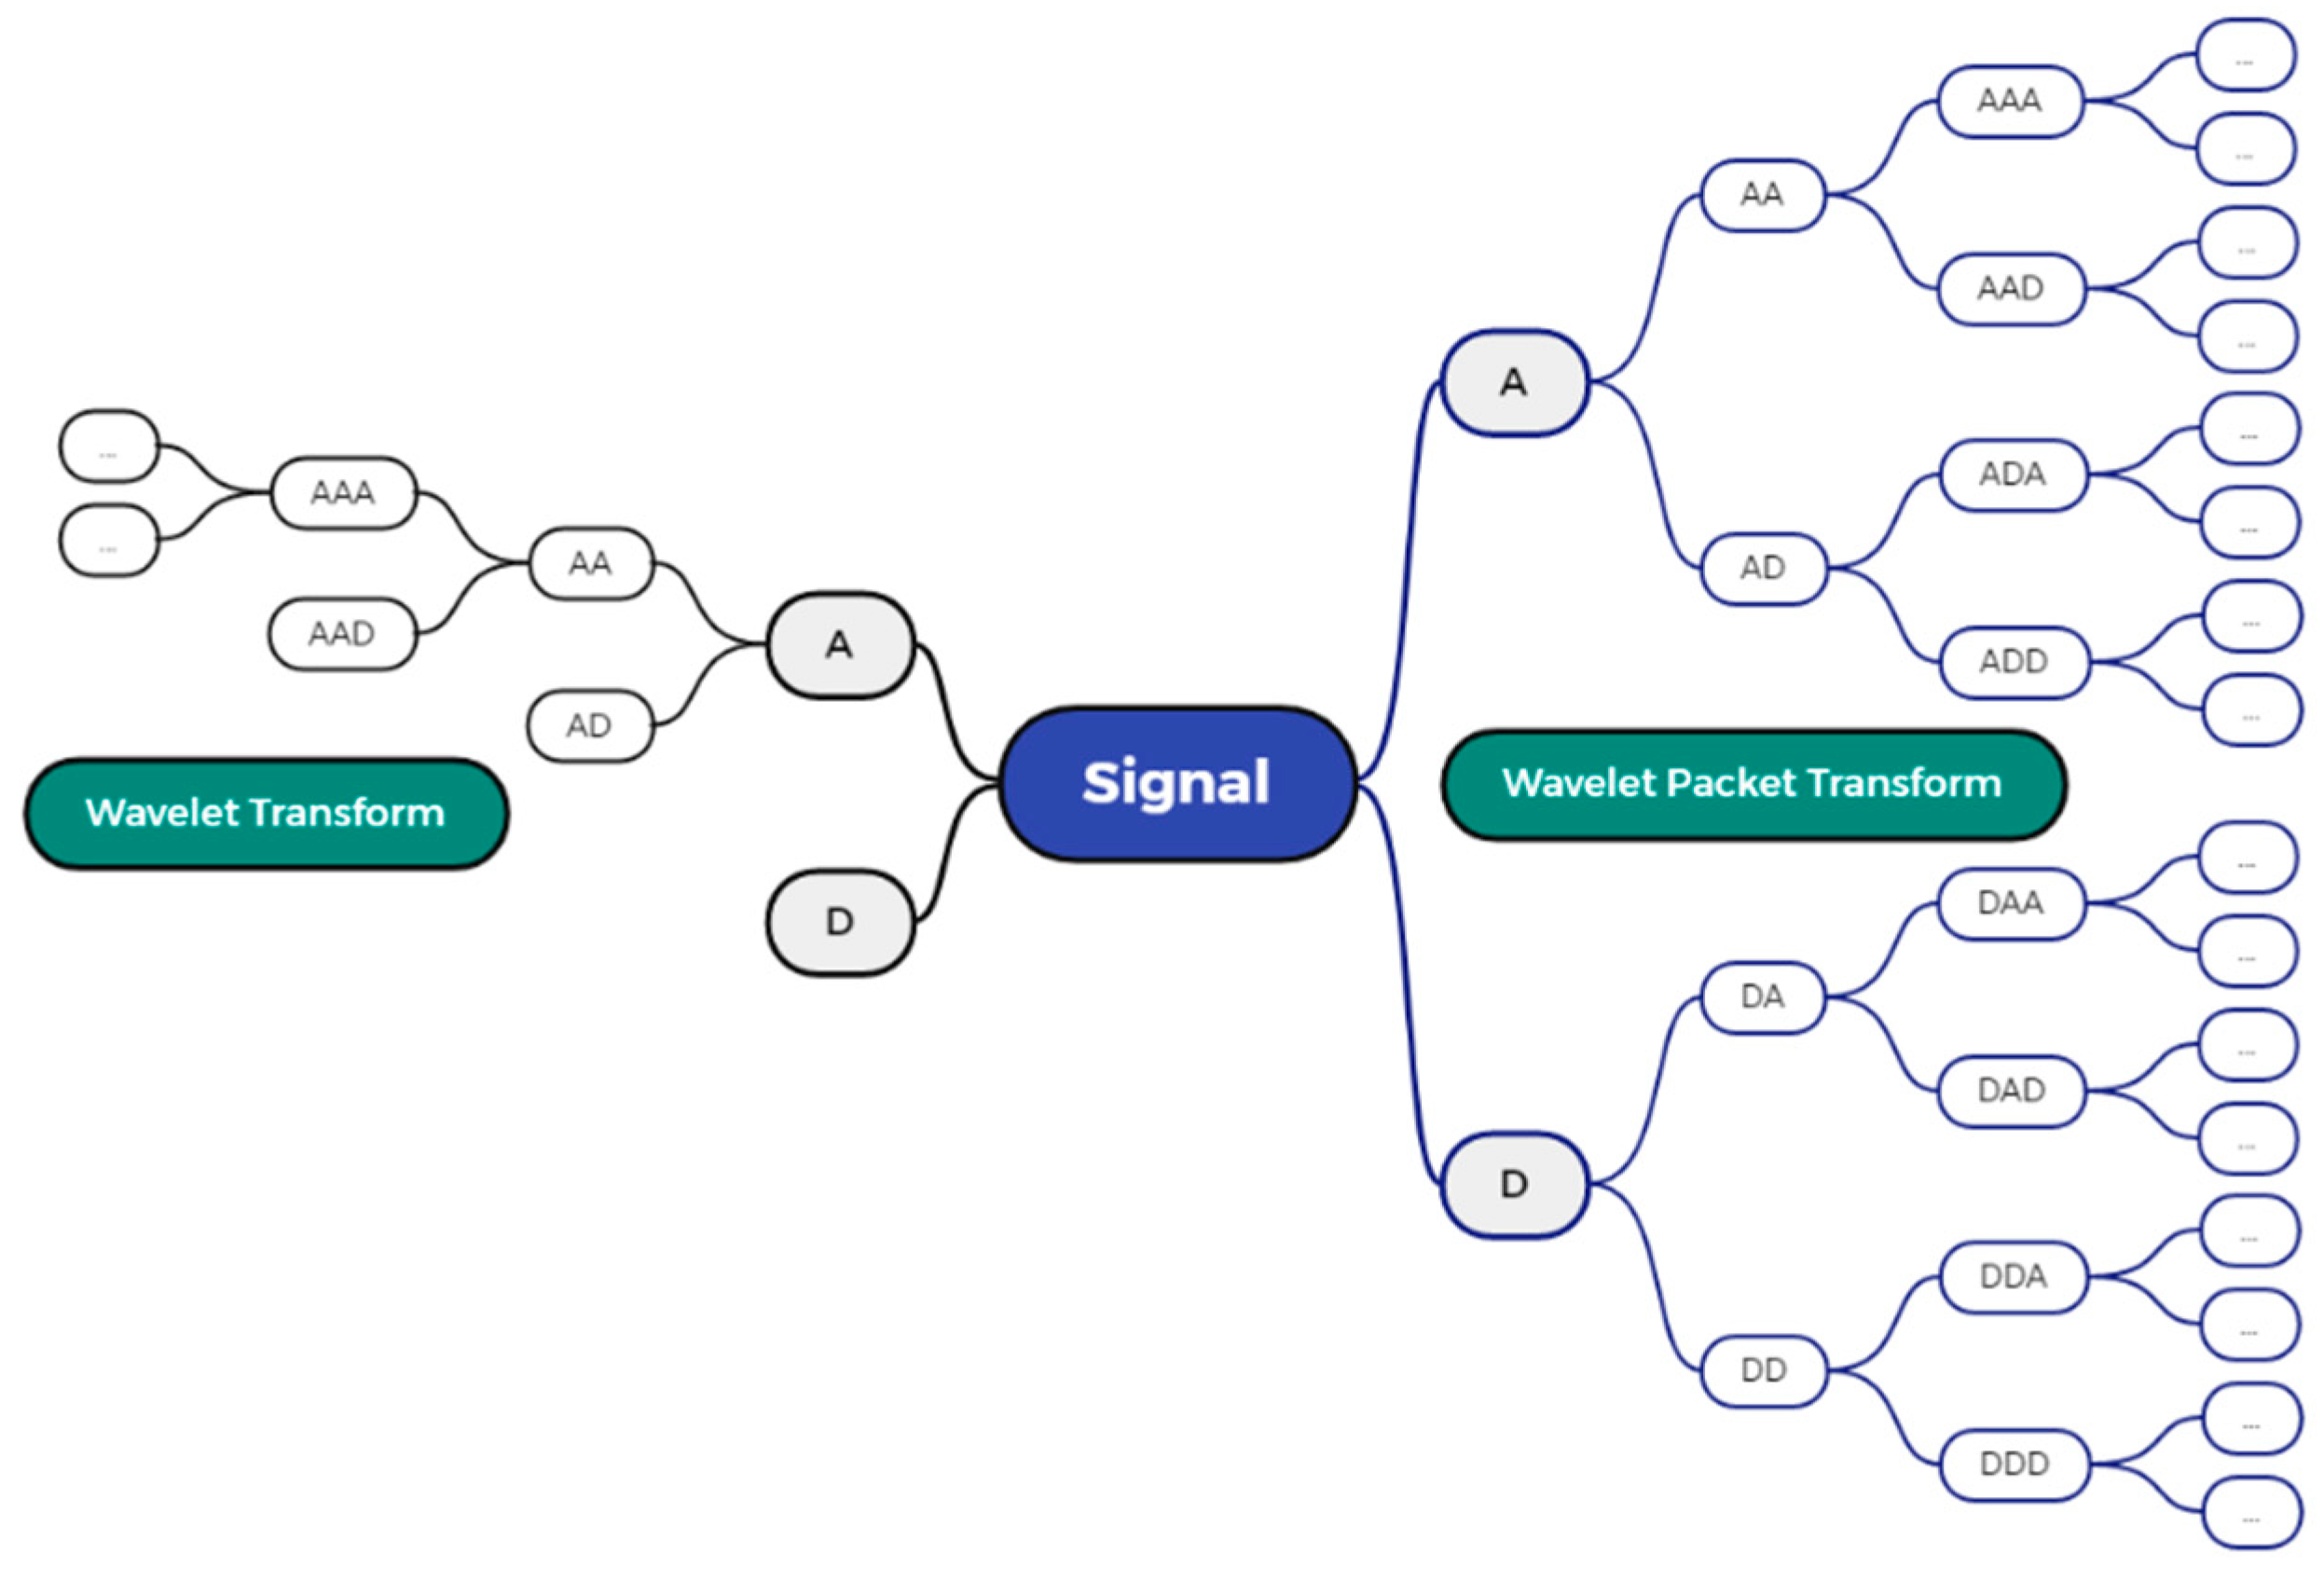
2.2. Wavelet Packet Transform

J. Morlet first proposed wavelet transform in 1974. However, it was not until 1986 that the first wavelet basis was inadvertently constructed by Y. Meyer [42]. Compared with traditional signal analysis methods, wavelet transform has the ability of a digital microscope, which can effectively perform detailed time–frequency analysis of signals and extract more characteristic information [43,44].
The time–frequency analysis procedure using wavelet transform is comparable to the description of the windowed Fourier transform, but the two are essentially different. First, the expression of wavelet transform is as follows
T f w a v ( a , b ) = < f , ψ a , b > = | a | 1 / 2 + f ( t ) ψ ( t b a ) d t ,
where <, > represents the inner product in L2, ψ a , b ( t ) = | a | 1 / 2 ψ ( t b a ) , ψ a , b ( t ) is called wavelet, and ψ is called mother wavelet.
The mother wavelet needs to meet the following conditions:
  • Absolutely integrable and squarely integrable, as ψ L 1 ( R ) L 2 ( R ) ;
  • Offset between positives and negatives, as + ψ ( x ) d x = 0 and ψ ^ ( 0 ) = 0 , where ψ ^ is the Fourier transform of ψ ;
  • Meet the allowable conditions: + | ψ ^ ( w ) | 2 w d w < .
The principle of wavelet transform can be understood as a continuous translation of the mother wavelet. It can also enlarge and shrink the mother wavelet and adapt to various frequency bands by changing its scale. When the parameters a and b in Formula (1) are continuous values, it is called continuous wavelet transform (CWT). It is often necessary to discretize the expansion factor a and translation factor b, that is, a = a 0 m , and b = n b 0 a 0 m , where m and n are integers, a0 is a constant greater than 1, and b0 is a constant greater than 0. The corresponding discrete wavelet function is expressed as
ψ m , n ( t ) = | a 0 m | 1 / 2 ψ ( t n b 0 a 0 m a 0 m ) = | a 0 m | 1 / 2 ψ ( a 0 m t n b 0 ) .
As a result, the discrete wavelet transform (DWT) is
T m , n w a v ( f ) = a 0 m / 2 d t f ( t ) ψ ( a 0 m t n b 0 ) .
Wavelet transform is used to analyze seismic signals, which can effectively separate high-frequency and low-frequency signals, and further analyze and process the low-frequency signals. In the actual analysis, the high-frequency signal in seismic events is also a crucial component. Therefore, wavelet transform will lose more detailed information. The wavelet packet transform can simultaneously decompose the signal into different frequency bands so that both the high-frequency and low-frequency parts of the signal are analyzed, analyzing the signal more precisely [45]. The wavelet packet transform can also select the frequency band most consistent with the signal characteristics.
Suppose { H n } and { L n } are orthogonal high and low pass filters corresponding to orthogonal wavelet function α ( t ) and orthogonal scaling function β ( t ) , respectively, then
β ( t ) = 2 k L k β ( 2 t k ) , α ( t ) = 2 k H k β ( 2 t k ) .
We use ξ 0 ( t ) to represent β ( t ) and ξ 1 ( t ) to represent α ( t ) , and Formula (4) is transformed into
ξ 0 ( t ) = 2 k L k ξ 0 ( 2 t k ) , ξ 1 ( t ) = 2 k H k ξ 0 ( 2 t k ) .
Therefore, the function ξ n can be obtained by iteration
ξ 2 n ( t ) = 2 k L k ξ n ( 2 t k ) , ξ 2 n + 1 ( t ) = 2 k H k ξ n ( 2 t k ) .
The function ξ n ( t ) obtained by iteration is the wavelet packet determined by β ( t ) . As shown in Figure 4, the difference between wavelet transform and wavelet packet transform lies in the process of high-frequency components of the signal.

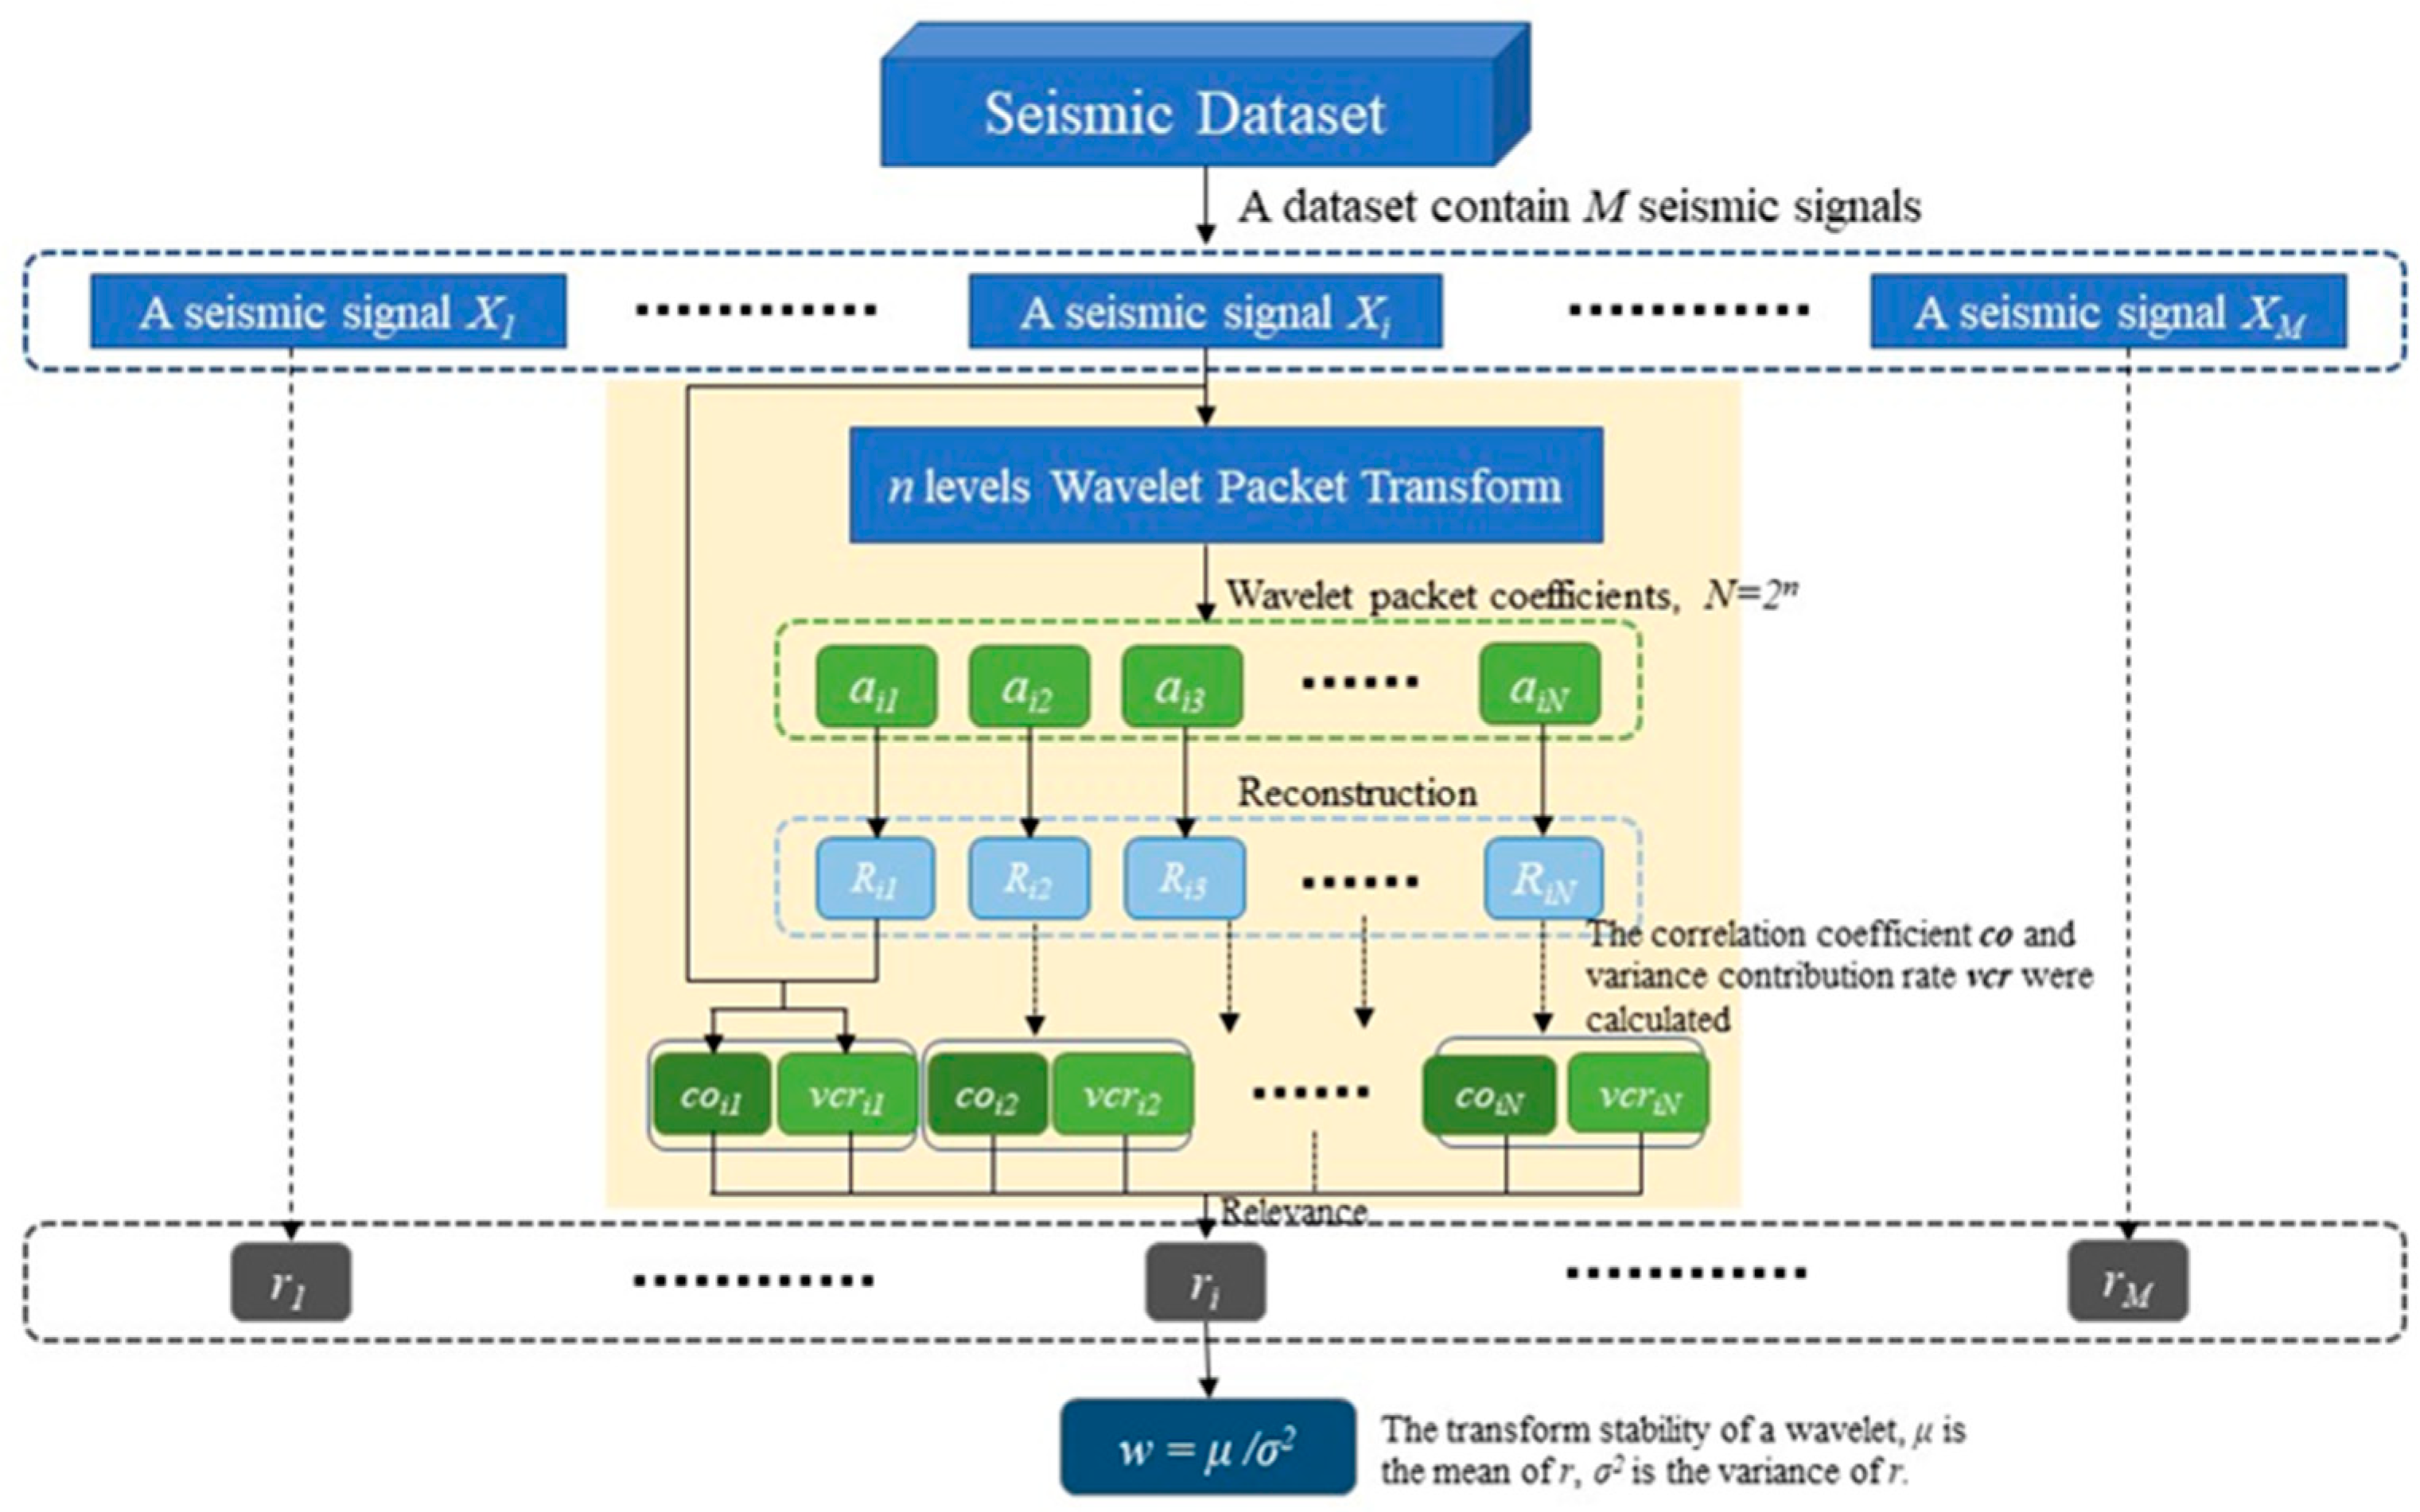
2.3. Wavelet Selection Method

Wavelet packet transform provides good tools for seismic signal analysis. However, the use of wavelet packet transform involves the selection of wavelets. Some commonly used wavelets and their characteristics are listed in Table 1. Therefore, we propose a novel wavelet selection method that considers the stability of wavelet transform or wavelet base transform. This method is suitable for wavelet selection in the intelligent processing of seismic data. Figure 5 shows the specific implementation process of our method.
In recent years, intelligent processing methods driven by seismic data have been widely used. Such methods are often based on a sizeable seismic dataset. Intelligent processing techniques, such as deep learning, no longer require us to extract features accurately. In contrast, deep neural networks require that our input data are stable and can reliably represent that type of signal. Therefore, our method is to calculate the decomposition stability of each wavelet on the dataset and select the wavelet with the highest decomposition stability as the best wavelet. Suppose the dataset contains I seismic signals, Xi is a signal in this dataset, i = 1, 2, …, I. For a wavelet, its decomposition stability is calculated according to the following steps.
  • Based on this wavelet performing n levels wavelet packet decomposition of signal Xi, 2n wavelet packet coefficients { a i k | k [ 1 , 2 n ] , i [ 1 , I ] } are obtained.
  • Each wavelet packet coefficient is reconstructed separately to obtain 2n reconstructed signals { R i k | k [ 1 , 2 n ] , i [ 1 , I ] } , and the correlation coefficients and variance contribution rates are calculated for each of the reconstructed signals and the original seismic signals, respectively. The formula for calculating the correlation coefficient
    c o i ( k ) = s = 1 S ( X i ( s ) X i ¯ ) ( R i k ( s ) R i k ¯ ) s = 1 S ( X i ( s ) X i ¯ ) 2 s = 1 S ( R i k ( s ) R i k ¯ ) 2 ,
    where c o i ( k ) represents the correlation coefficient between X i and R i k , S represents the total number of signal sampling points. The formula for calculating the variance contribution rate
    v c r i ( k ) = 1 N S n s = 1 N S a i k ( n s ) 2 ( 1 N S n s = 1 N S a i k ( n s ) ) 2 k = 1 2 n [ 1 N S n s = 1 N S a i k ( n s ) 2 ( 1 N S n s = 1 N S a i k ( n s ) ) 2 ] ,
    where v c r i ( k ) is the variance contribution rate of a i k , NS is the total number of a i k sampling points.
  • Calculation of relevance { r i | i [ 1 , I ] } from correlation coefficient and variance contribution rate
    r i = k = 1 2 n ( c o i ( k ) c o i j ¯ ) ( v c r i ( k ) v c r i ¯ ) k = 1 2 n ( c o i ( k ) c o i ¯ ) 2 k = 1 2 n ( v c r i ( k ) v c r i ¯ ) 2 ,
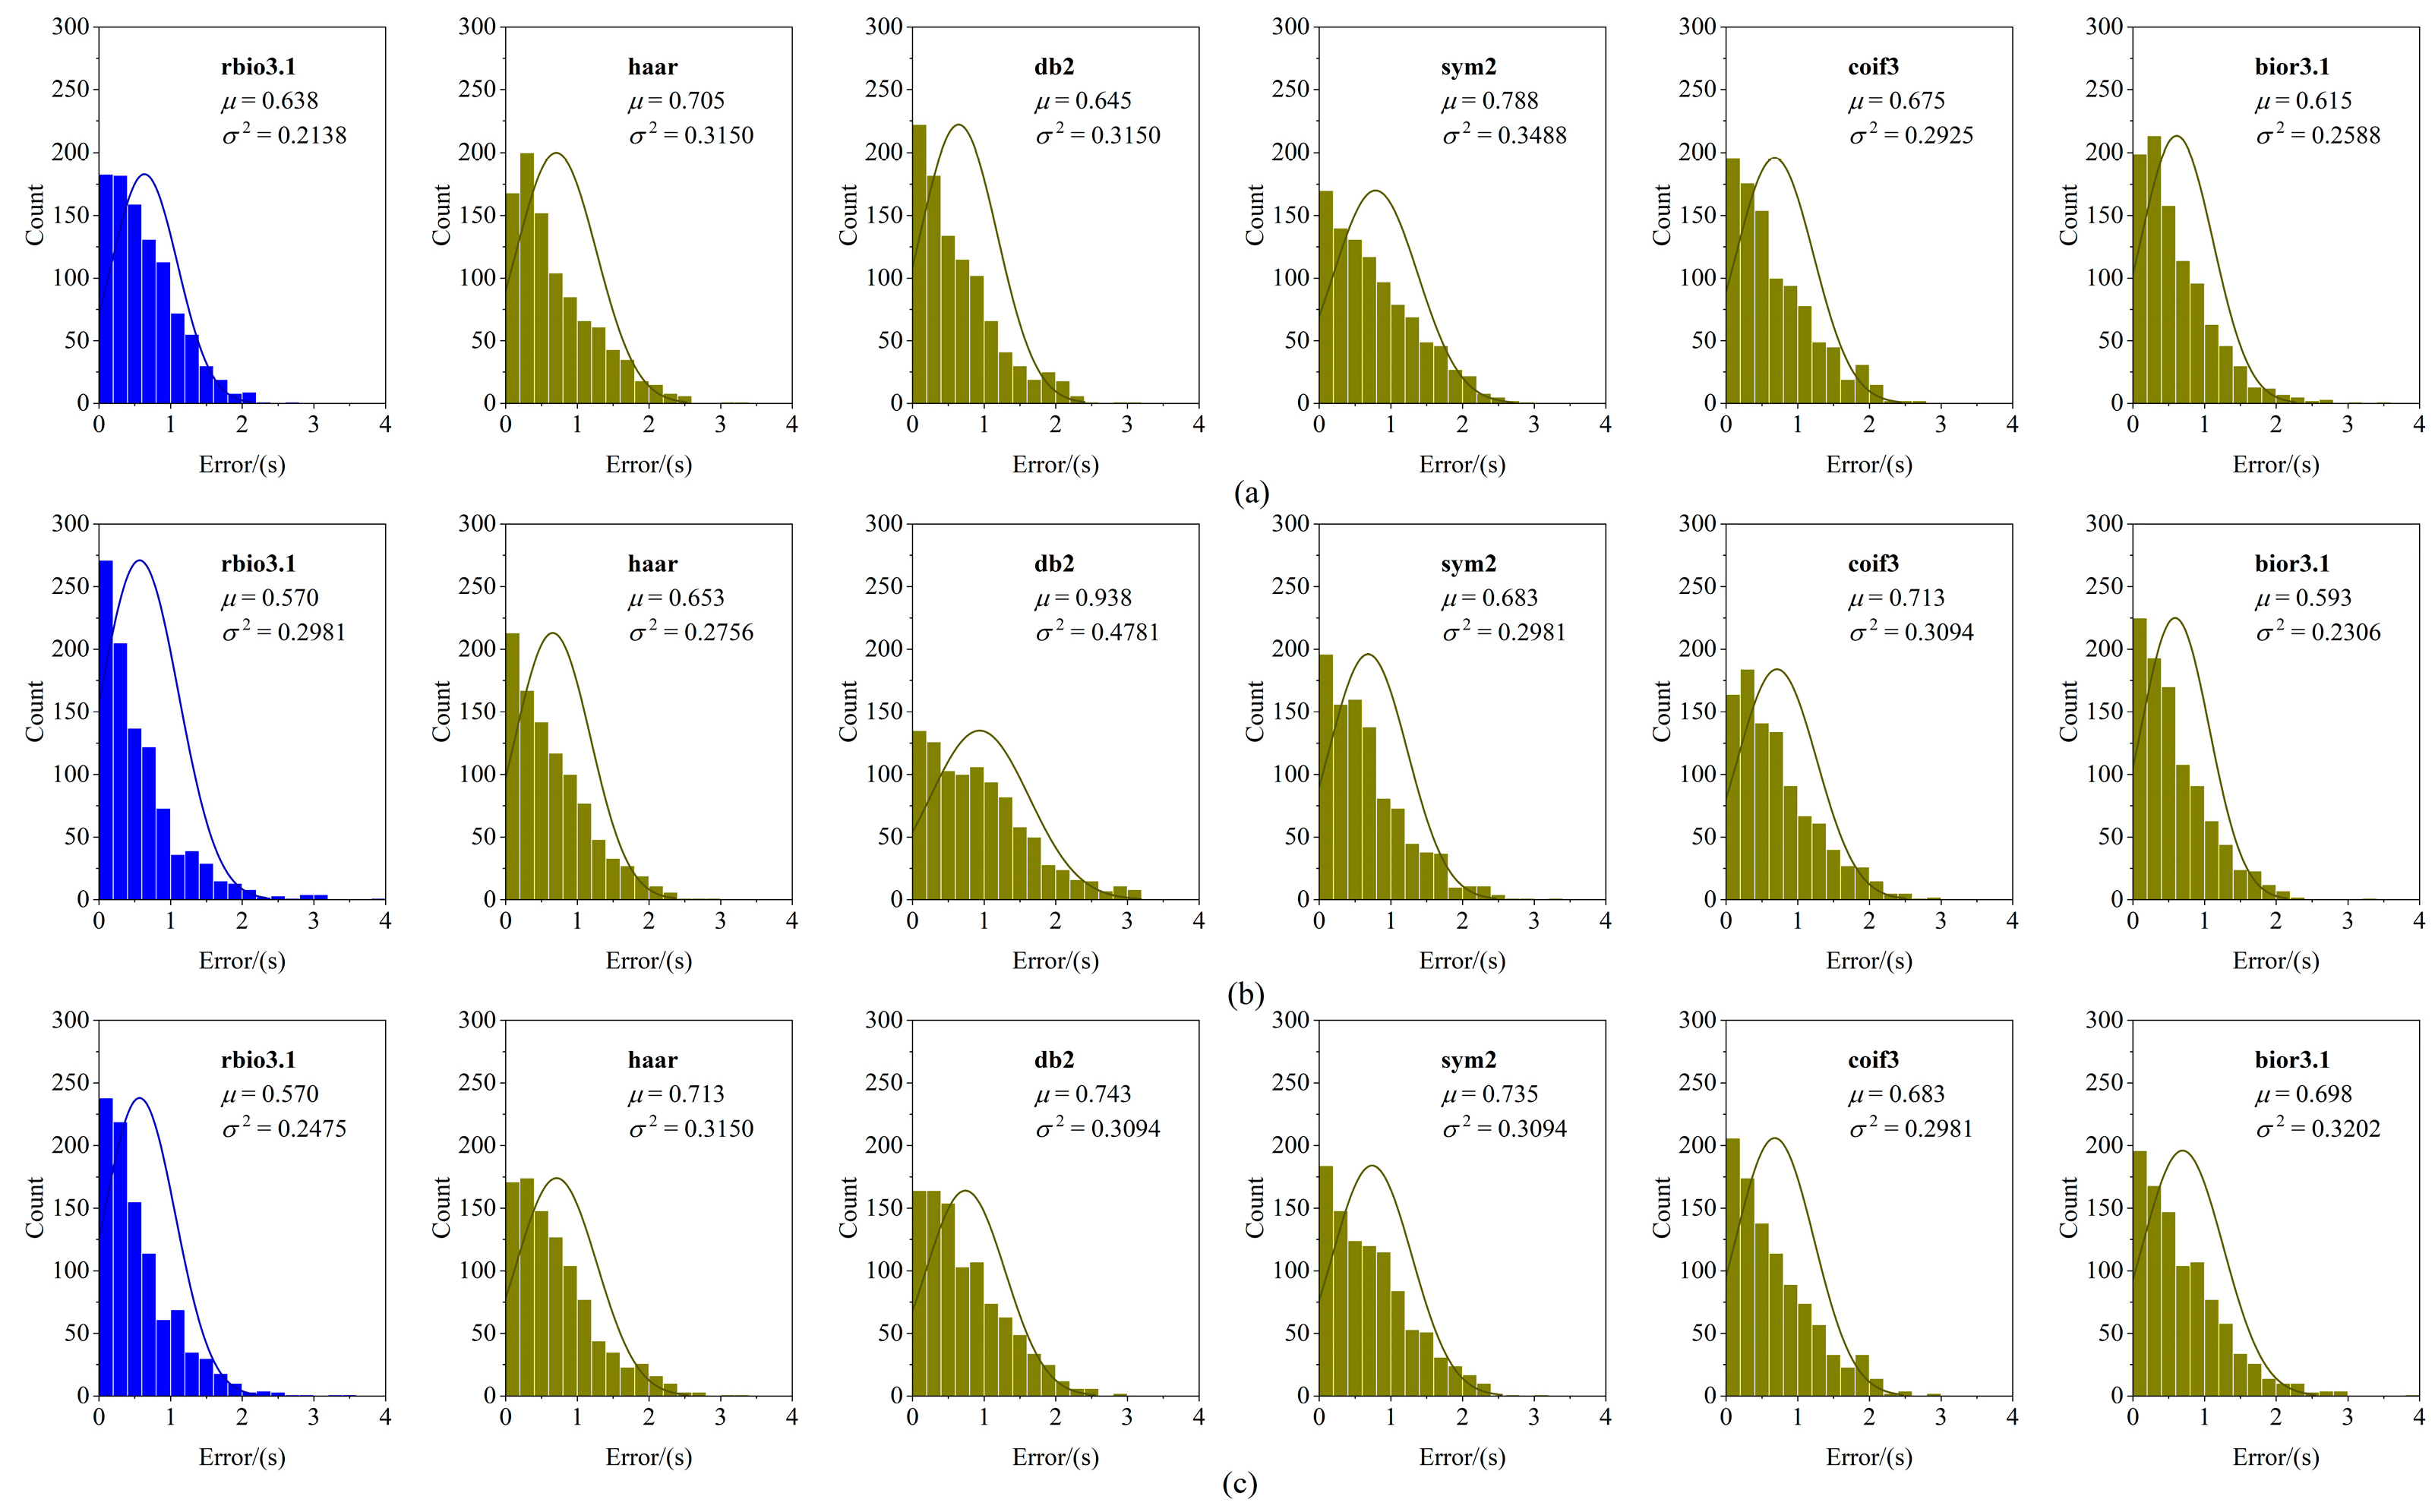
  • Calculate the decomposition stability of this wavelet by the mean μ and variance σ 2 of { r i | i [ 1 , I ] }
    w = μ / σ 2
Finally, the above operation is performed on all wavelets to be selected, and the decomposition stability w of each wavelet is obtained separately, and the wavelet that makes w maximum under this dataset is selected as the optimal wavelet.

3. Results

To verify the feasibility of our method, we used it in an automated classification study of mining-induced microseismic data and a P arrival picking research of seismic data.

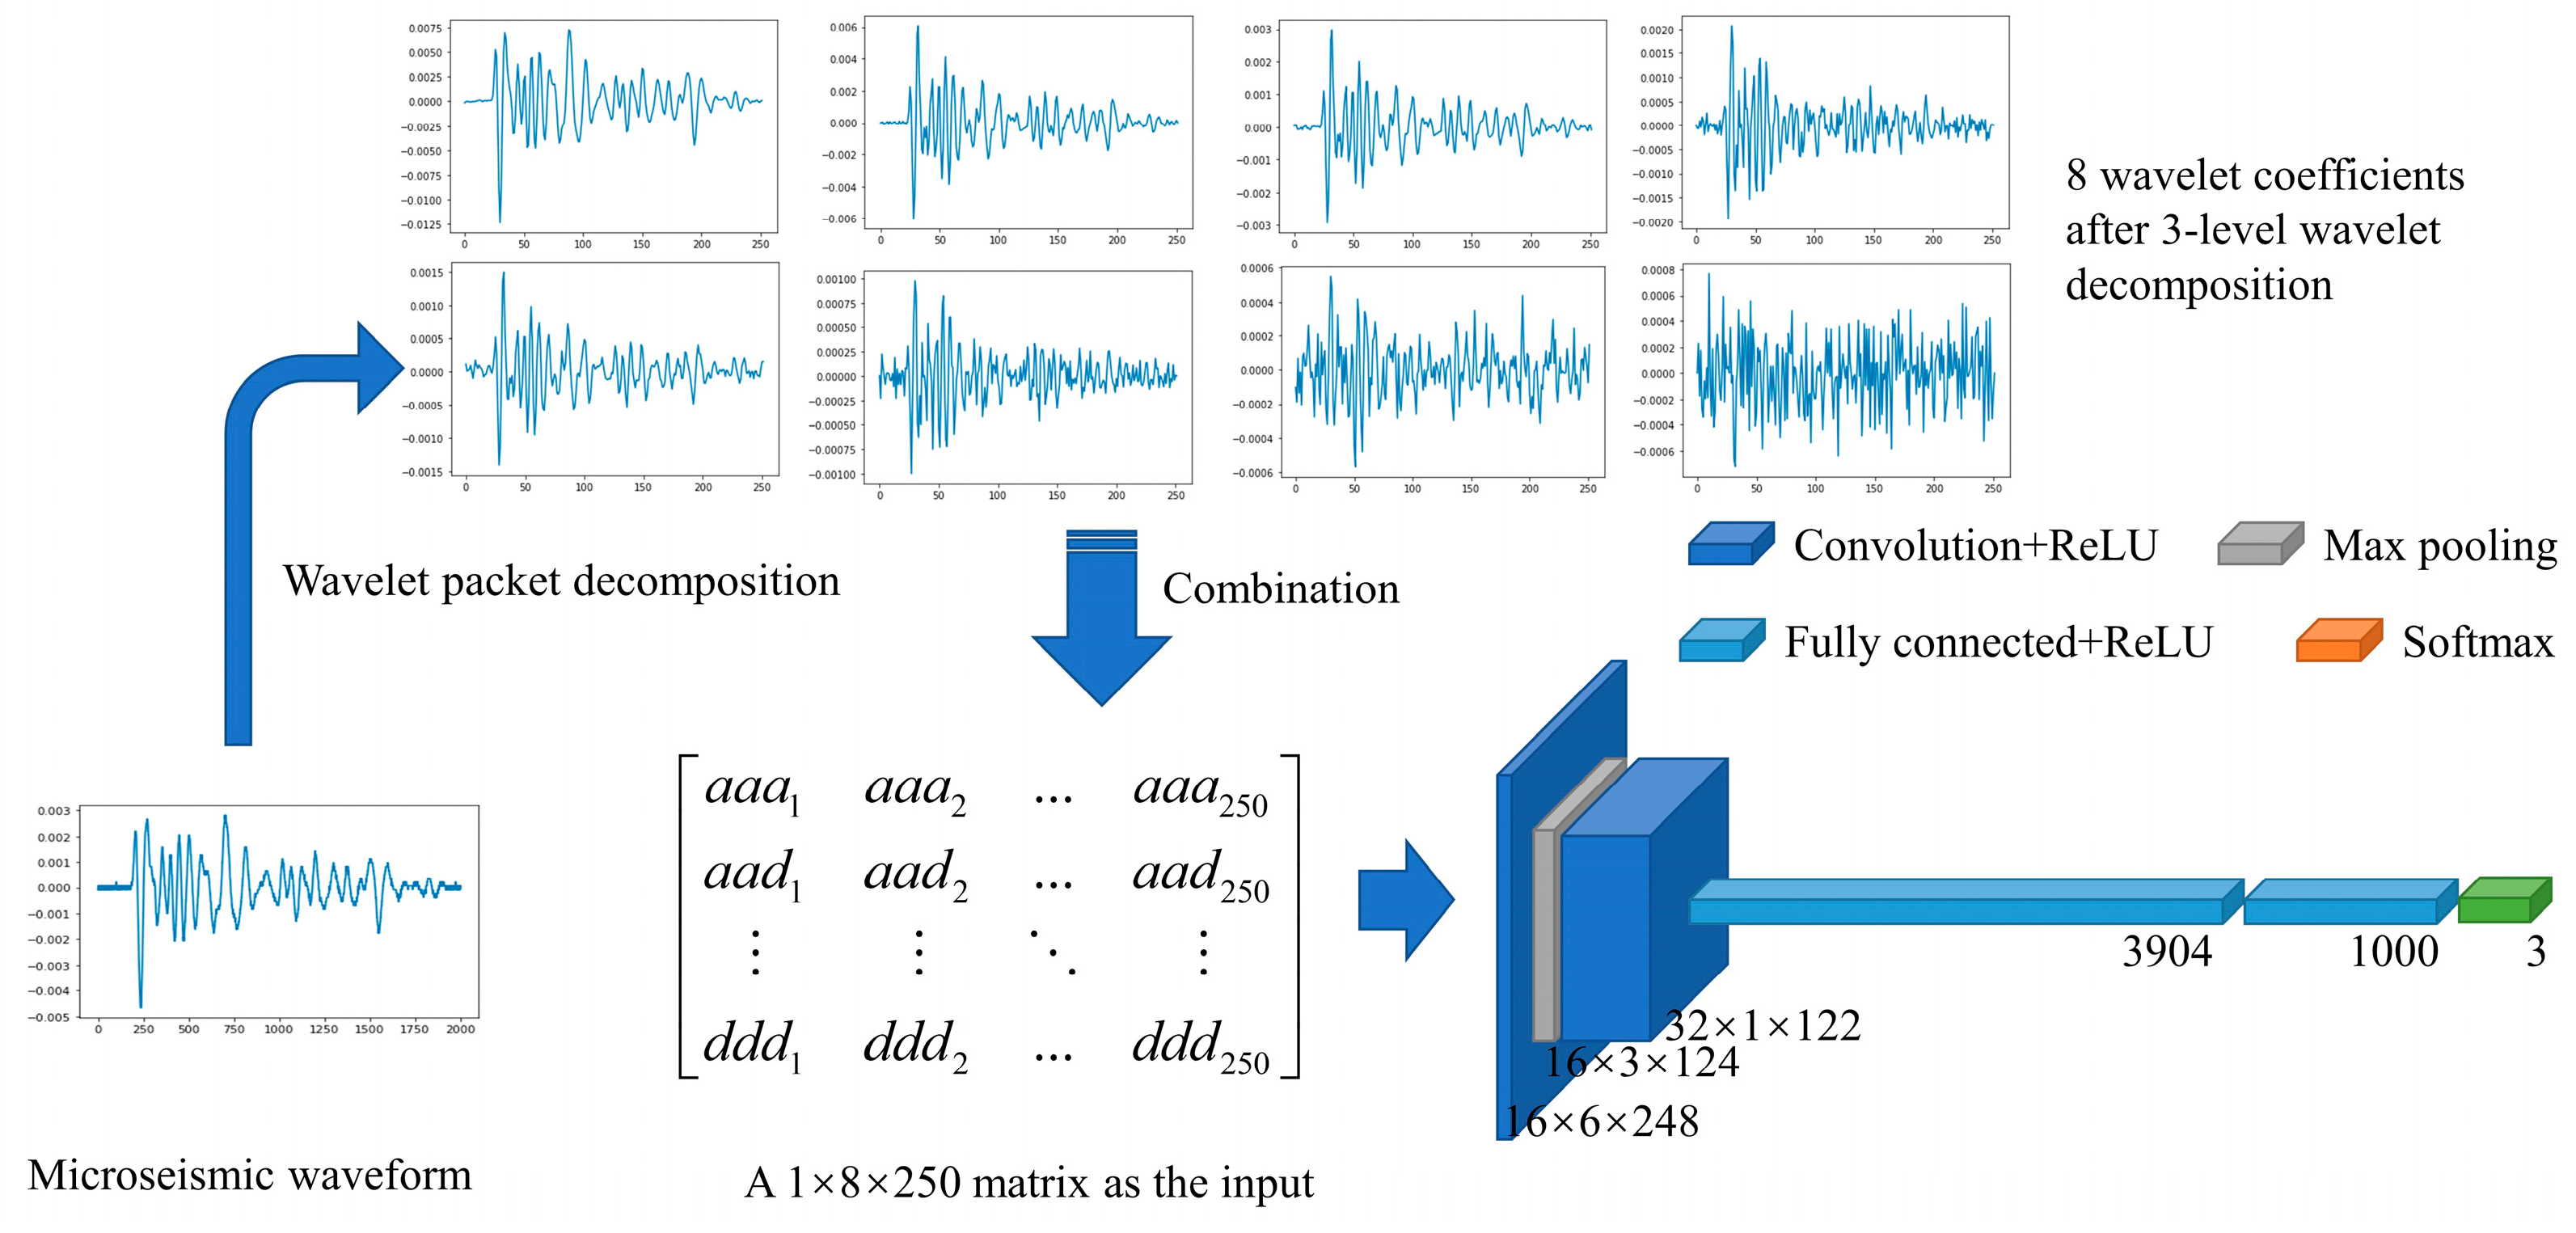
3.1. Application in Automated Mining-Induced Microseismic Events Classification

Mining-induced microseismic events’ monitoring is crucial for predicting rock mass hazards [46,47]. Mining-induced microseismic events tend to be small in magnitude and require sensitive sensors to acquire. However, in addition to collecting microseismic signals, sensitive sensors will also collect all kinds of interference signals, such as blasting signals, mechanical vibration signals, etc. Picking out accurate microseismic signals is necessary to process mining-induced microseismic events further. At the same time, the mining-induced microseismic data collected in a day are enormous, so the monitoring effect must be improved by using intelligent processing methods [48]. Based on this engineering background, we designed an experiment to verify the reliability of our wavelet selection method.
This method was employed to train a convolutional neural network fora dataset that includes 5400 mining-induced microseismic signals, 5400 blasting signals, and 5400 mechanical vibration signals. According to the method proposed in this paper, we combined these data into one large dataset, denoted as M1. Based on the commonly used wavelets listed in Table 1 and Table 2, the decomposition stability w of each wavelet concerning M1 was calculated separately, and the calculation results are recorded in Table 2. As shown in Table 2, for dataset M1, the wavelet is rbio3.1, which maximizes the decomposition stability w.
As shown in Figure 6, to verify the suitability of using our method, we used the selected wavelet rbio3.1 for the automatic classification of microseismic signals. Moreover, we also randomly selected five wavelets for comparison experiments, including haar, db2, sym2, coif3, and bior3.1. Then, the original microseismic signal contains 2000 sampling points, which are decomposed into three levels of wavelet packet decomposition to obtain eight wavelet packet coefficients of the signal, each containing 250 sampling points (in fact, there may be more than 250 sampling points, but these are uniformly cropped to just 250 sampling points for the convenience of calculation). Eight wavelet packet coefficients composed of a matrix are used as the feature matrix for deep learning. The deep learning model used in this paper contains two convolutional layers with a 3 × 3 convolutional kernel, a max-pooling layer, and two fully connected layers. It is necessary to state that we used a simple deep learning model here, whose purpose is to highlight the effectiveness of wavelet selection methods. Therefore, a simple deep learning model can downplay the impact of the model on the experimental results. After all, it is not the accuracy of the classification problem that is pursued in this paper.
We divided the dataset M1 into a training set and a test set. The training set was used to train the deep learning model in Figure 6 to classify signals. The training set contains 5000 mining-induced microseismic signals, 5000 blasting signals, and 5000 mechanical vibration signals, and the test set contains 400 mining-induced microseismic signals, 400 blasting signals, and 400 mechanical vibration signals. We conducted three sets of comparison experiments for different wavelet-generated datasets, and for each dataset, the deep learning model was trained with 50 epochs. After the model was trained, it was tested using the test set, and the experimental results are shown in Table 3. The classification accuracies of the wavelet rbio3.1 are 93.55%, 92.75%, and 93.08%, with an average accuracy of 93.13%. However, the average classification accuracy of the other wavelets can only reach 90.89%, 89.81%, 91.53%, 90.86%, and 91.44%. The comparison reveals that feature extraction using wavelets selected by our method is beneficial for the subsequent analysis. Therefore, it can be considered that our method is effective.

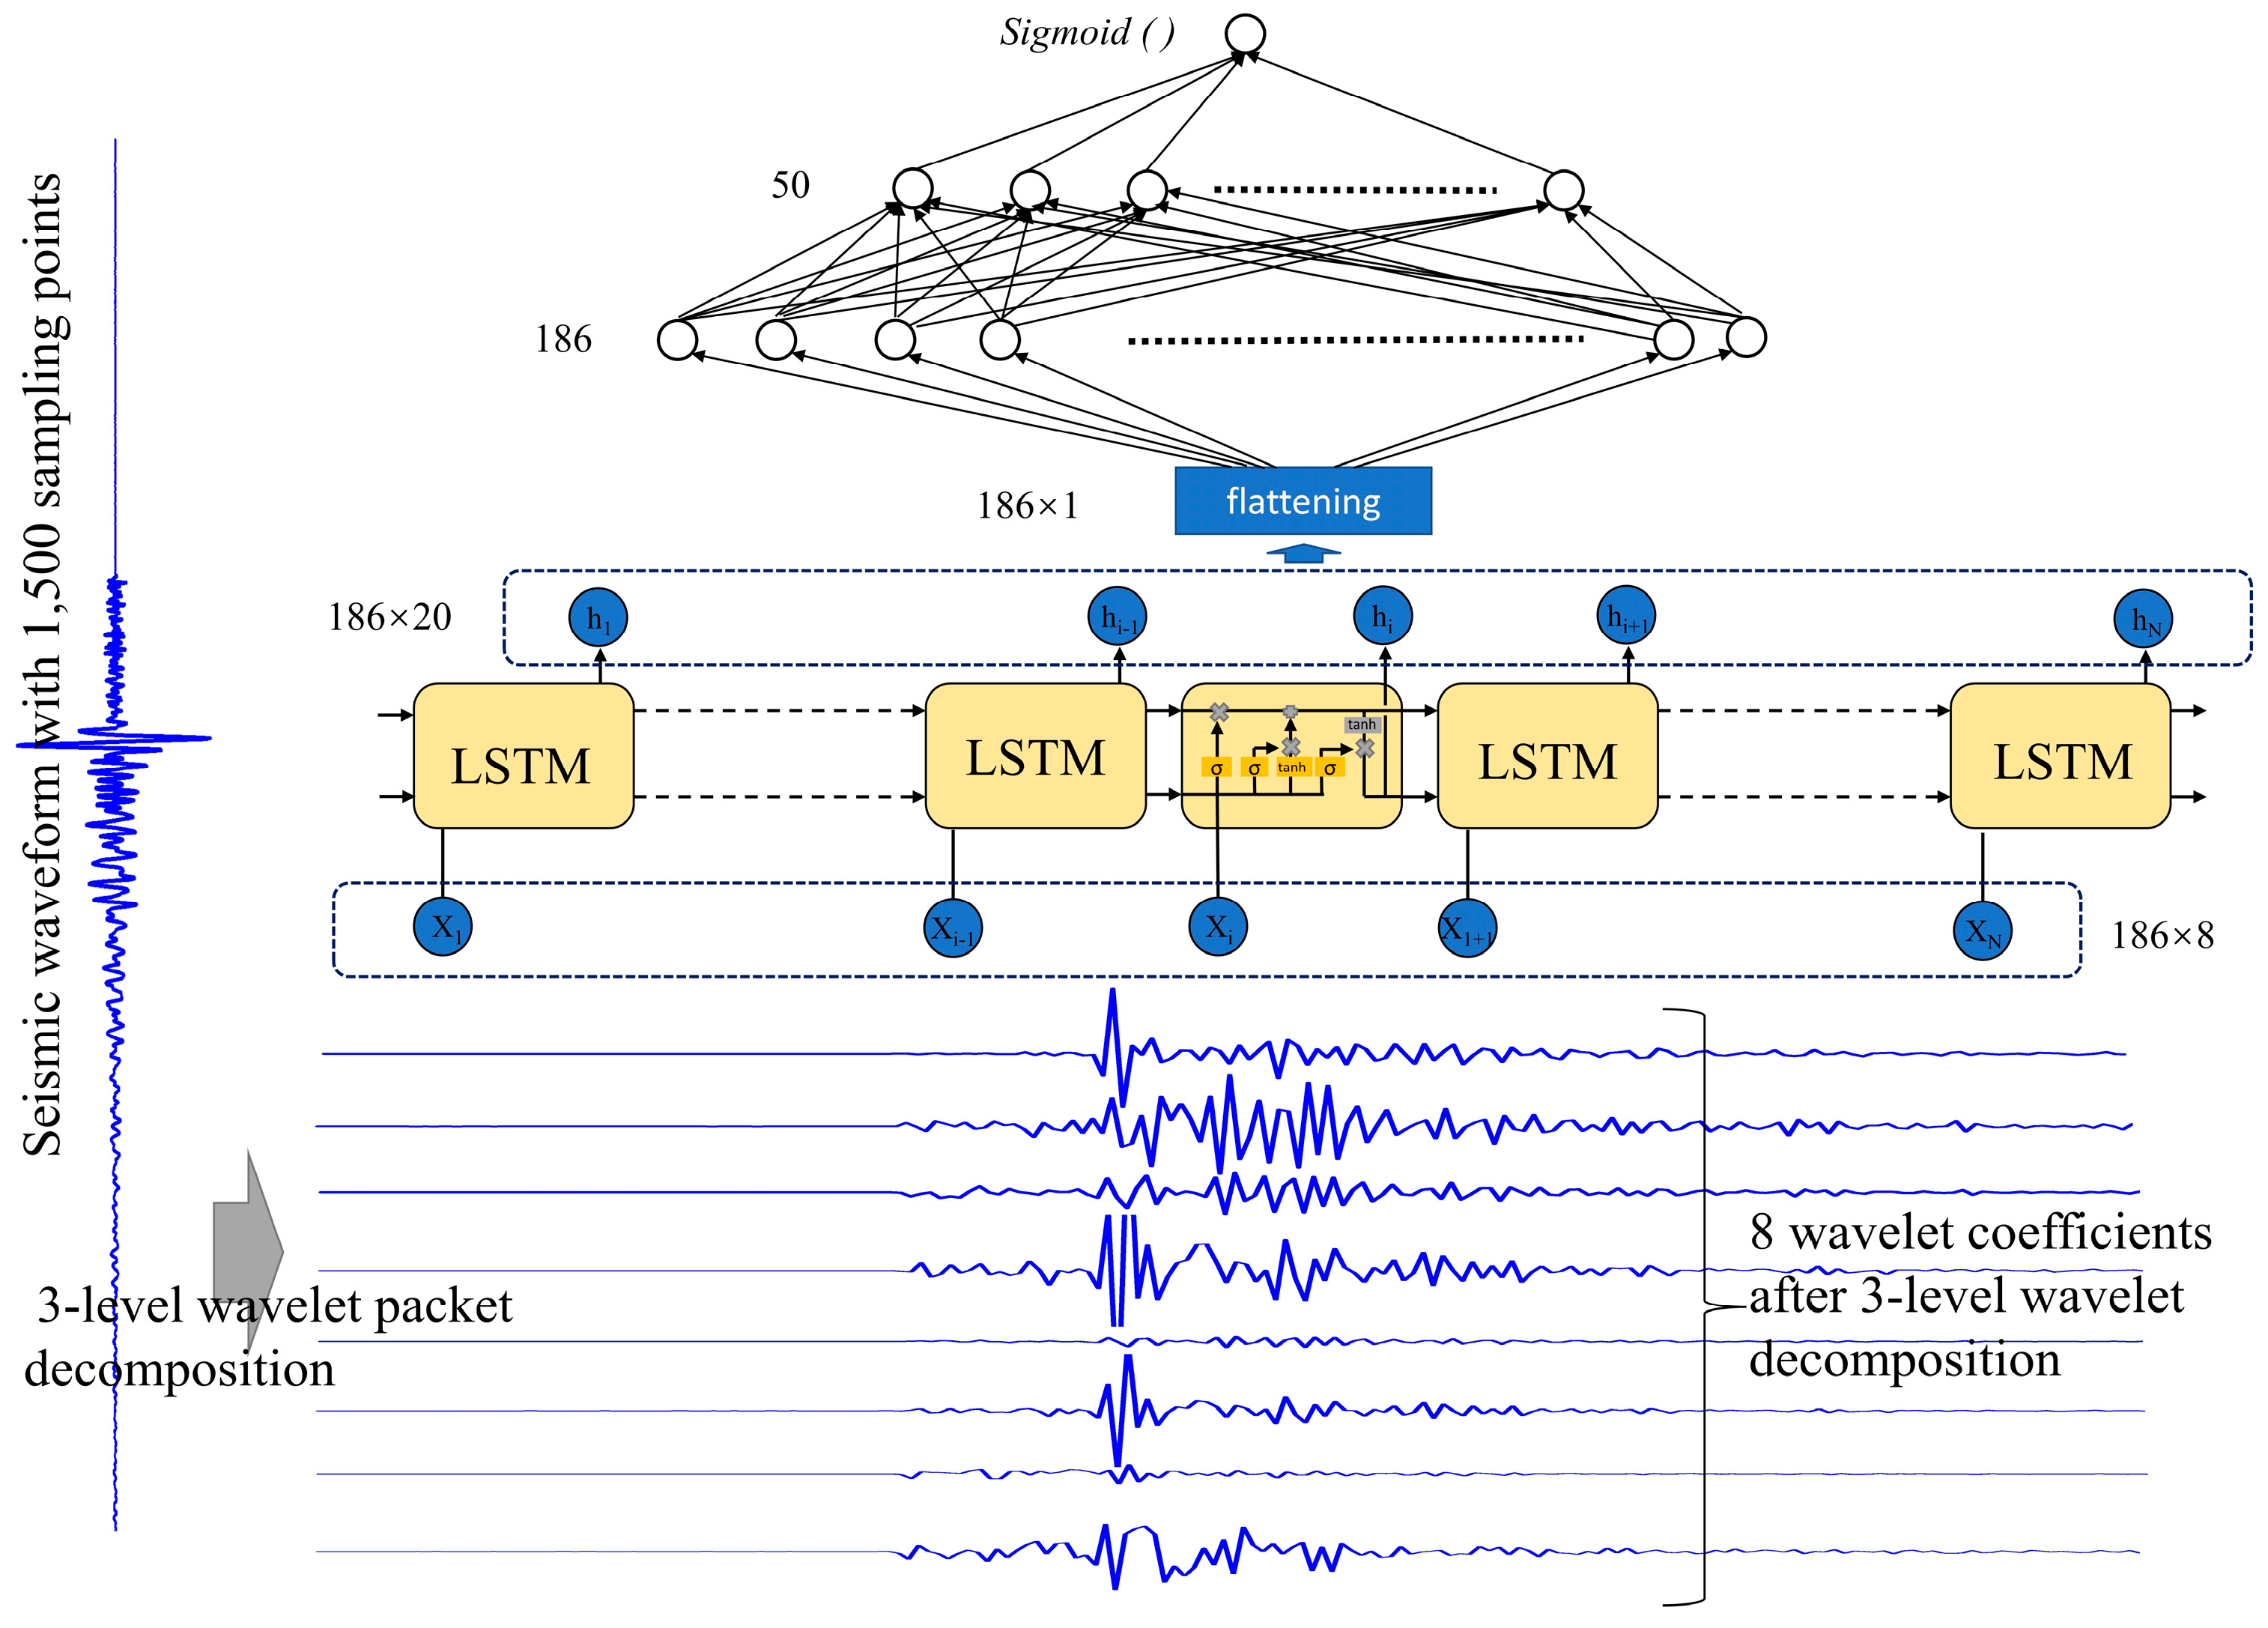
3.2. Application in Automated P Arrival Picking

Seismic P arrival picking is essential for calculating seismic source parameters [49,50,51]. Effective and fast P arrival picking is an important study in seismology. Therefore, scholars have proposed many P arrival picking methods, such as STA/LTA (short- and long-time average ratio) [52], AIC (Akaike information criterion) [53], and so on. Moreover, deep learning has become a practical approach in many research fields with computer science development. Furthermore, some intelligent automatic P arrival picking methods based on deep learning have been proposed recently [54]. These methods can combine with wavelet transform, so a wavelet selection approach should be used. Therefore, we can test our wavelet selection approach in automatic P arrival picking.
A seismic dataset, denoted as M2, containing 9963 seismic records, was collected from the Center for Engineering Strong Motion Data (CESMD). Each seismic record has 1500 sampling points, and the sampling rate is 200 Hz. We used this dataset to train and test an LSTM (long short-term memory) network for P arrival picking, and the wavelet transform was used for input data preparation. Firstly, the decomposition stability w was calculated for each wavelet listed in Table 1, Table 2 and Table 4 based on our seismic dataset M2. The results of the w calculation are listed in Table 4, and rbio3.1 is the wavelet that makes the maximum w. Therefore, for M2, rbio3.1 is the best wavelet for data processing. Secondly, we used the rbio3.1 wavelet and randomly selected five wavelets (including haar, db2, sym2, coif3, and bior3.1) to perform a three-level wavelet packet decomposition, and the wavelet packet coefficients obtained after decomposing each seismic signal were adopted as the input of the LSTM network. Finally, we trained and tested the LSTM network for each selected wavelet and compared their picking accuracy. Thus, the reliability of our method was validated and analyzed.
As shown in Figure 7, we built a simple LSTM network containing an LSTM module and two fully connected layers. Similarly, the network was simple enough to ensure that the differences in the experimental results were due to different wavelets and to reduce the interference of the deep learning model. The dataset M2 was divided into the training set (containing 9000 seismic records) and the test set (containing 963 seismic records). The LSTM network for each wavelet was trained 50 times for each comparison experiment. In total, three comparison experiments were conducted. Moreover, to numerically assess the performance, we adopted the arrival picking error metric, which is described as [55]
E r r o r = | T p T t | ,
where Tp is the arrival picking and Tt is the ground truth.
After the model was trained, it was tested using the test set, and the experimental results are shown in Figure 8. Figure 8a shows the results of the first round of comparison experiments. In Figure 8a, the total picking error using selected wavelet rbio3.1 is 612.62 s, and the errors for the other five wavelets are 680.53 s, 621.57 s, 758.52 s, 653.21 s, and 589.80 s, respectively, and the mean of the picking error using rbio3.1 is 0.683 s, and the errors for the other five wavelets are 0.705 s, 0.645 s, 0.788 s, 0.675 s, and 0.615 s, respectively. In Figure 8b, the total picking error using selected wavelet rbio3.1 is 547.63 s, and the errors for the other five wavelets are 633.24 s, 903.34 s, 657.66 s, 684.88 s, and 568.23 s, respectively, and the mean of the picking error using rbio3.1 is 0.570 s, and the means for the other five wavelets are 0.653 s, 0.938 s, 0.683 s, 0.713 s, and 0.593 s, respectively. In Figure 8c, the total picking error using selected wavelet rbio3.1 is 546.85 s, and the errors for the other five wavelets are 685.13 s, 712.30 s, 710.35 s, 654.67 s, and 669.47 s, respectively, and the mean of the picking error using rbio3.1 is 0.570 s, and the errors for the other five wavelets are 0.713 s, 0.743 s, 0.735 s, 0.683 s, and 0.698 s, respectively. Therefore, the wavelet selected using our method make the automatic P arrival picking better than the other randomly selected wavelets. Moreover, in the three-round experiments, the variances of the picking error using rbio3.1 are 0.2138, 0.2981, and 0.2475, respectively. As shown in Figure 8, the variance of the picking error using rbio3.1 is the smallest, i.e., the results of picking using rbio3.1 are the most stable. In summary, the wavelet selected using our method can make the seismic P arrival picking both accurate and stable, proving that our wavelet selection method is indeed effective.

4. Discussion

This paper proposes a novel wavelet selection method for the big seismic dataset based on decomposition stability w. We tested our method in two field application experiments and achieved some valuable and positive results.
These results show that the effect can be different by using different wavelets for the intelligent processing of automatic classification and P arrival picking of the seismic waveform. Moreover, the wavelets selected by our method can optimize the results when other influencing factors are excluded. In contrast to existing wavelet selection methods, our approach focuses for the first time on the selection criteria that optimize feature extraction for the entire big dataset. This provides a state-of-the-art quantitative wavelet selection method for many new techniques based on data-driven intelligent signal processing and analysis.
Furthermore, by analyzing and comparing the results between the classification and P arrival picking, we find that the selected wavelets are both rbio3.1. There are three main reasons for this result. Firstly, although mining-induced microseismic and natural seismic events are different, they generally belong to the same broad class of signals. Secondly, in our experiment, the time length is ignored when the waveform is used as input, and the sampling point length is adopted, which makes the waveform of the two similar in time sequence. Finally, the amplitude units used by the two signals are different, so the amplitude differences between the two signals with significant magnitude differences are minor. However, although the selected wavelets are all rbio3.1, the w obtained by calculation has an enormous difference, indicating that this method is differentiated. Additionally, we briefly discuss the effect of the number of wavelet packet decomposition levels on the results of wavelet selection. As shown in Figure 9, as the number of decomposition levels changes, the value of w changes, but the distribution of the results is still similar for each layer and does not affect the wavelet selection. Therefore, it can be assumed that the number of levels of wavelet packet decomposition has no effect on our method, and it can be disregarded while being used. In addition, this paper only tested the application of this method in seismology, and no experiments were conducted for other fields.

5. Conclusions

The selection of wavelet quantization has always been a subject to be studied. Therefore, we proposed a wavelet selection method based on decomposition stability for the actual needs of seismic data processing. For a specific wavelet, we performed wavelet packet decomposition based on the wavelet, reconstructed the signal with each wavelet packet coefficient separately, calculated the correlation coefficient with the original waveform, and calculated the variance contribution rate between the wavelet packet coefficients. The relevance was calculated by a signal’s correlation coefficient and variance contribution rate. Finally, the mean and variance of relevance were calculated on a dataset, and then the decomposition stability w was calculated according to Formula (10). Among the wavelets to be selected, the wavelet that maximizes the decomposition stability w of the dataset is the optimal wavelet.
To verify the feasibility of our method, we conducted experiments on automatic mining-induced microseismic events’ classification and automatic P arrival picking. In both types of experiments, we used the wavelet packet coefficients obtained after wavelet packet transformation as the input of the deep learning network. The wavelet rbio3.1 selected by our method was compared with other randomly selected wavelets in these experiments. The experimental results show that the selection of wavelets can affect the results’ accuracy, and rbio3.1 makes the optimal accuracy. In the classification experiments, the mean accuracy is 93.13% using rbio3.1, 2.22% more accurate than other wavelets generated, and in the picking experiments, the mean picking error is 0.59 s using rbio3.1, but this is 0.71 s using others. In addition, we also analyzed the effect of the wavelet packet decomposition level on the results, showing that the level does not affect the selection of wavelets. In general, for the current development status of seismology, we propose a wavelet selection method suitable for intelligent seismic data processing, and we have proved our method’s effectiveness through experiments.

Author Contributions

Conceptualization, Z.H. and S.M.; methodology, Z.H. and S.M.; validation, S.M., L.W., and P.P.; writing—original draft preparation, Z.H.; writing—review and editing, S.M.; supervision, L.W.; project administration, L.W.; funding acquisition, P.P. All authors have read and agreed to the published version of the manuscript.

Funding

This work was supported by the National Natural Science Foundation of China (Grant No 52104170), the National Key Research and Development Program of China under grant 2019YFC0605304, the Postgraduate Scientific Research Innovation Project of Hunan Province under grant CX20200113, and the Fundamental Research Funds for the Central Universities of Central South University under grant 2020zzts192.

Institutional Review Board Statement

Not applicable.

Informed Consent Statement

Not applicable.

Data Availability Statement

All seismic data used in this study are uploaded in Figshare, the DOI is 10.6084/m9.figshare.19426145.

Acknowledgments

We are grateful for the technical support from the High Performance Computing Center of Central South University.

Conflicts of Interest

The authors declare no conflict of interest.

References

  1. Zhu, M.; Cheng, J.; Zhang, Z. Quality Control of Microseismic P-Phase Arrival Picks in Coal Mine Based on Machine Learning. Comput. Geosci. 2021, 156, 104862. [Google Scholar] [CrossRef]
  2. Yazdanpanah, O.; Mohebi, B.; Yakhchalian, M. Selection of Optimal Wavelet-Based Damage-Sensitive Feature for Seismic Damage Diagnosis. Measurement 2020, 154, 107447. [Google Scholar] [CrossRef]
  3. Li, F.; Wu, B.; Liu, N.; Hu, Y.; Wu, H. Seismic Time–Frequency Analysis via Adaptive Mode Separation-Based Wavelet Transform. IEEE Geosci. Remote Sens. Lett. 2020, 17, 696–700. [Google Scholar] [CrossRef]
  4. Sifuzzaman, M.; Islam, M.R.; Ali, M.Z. Application of Wavelet Transform and Its Advantages Compared to Fourier Transform. J. Phys. Sci. 2009, 13, 121–134. [Google Scholar]
  5. Zhao, H.; Zuo, S.; Hou, M.; Liu, W.; Yu, L.; Yang, X.; Deng, W. A Novel Adaptive Signal Processing Method Based on Enhanced Empirical Wavelet Transform Technology. Sensors 2018, 18, 3323. [Google Scholar] [CrossRef] [PubMed] [Green Version]
  6. Álvarez-Cortés, S.; Serra-Sagristà, J.; Bartrina-Rapesta, J.; Marcellin, M.W. Regression Wavelet Analysis for Near-Lossless Remote Sensing Data Compression. IEEE Trans. Geosci. Remote Sens. 2020, 58, 790–798. [Google Scholar] [CrossRef]
  7. Feng, X.; Zhang, W.; Su, X.; Xu, Z. Optical Remote Sensing Image Denoising and Super-Resolution Reconstructing Using Optimized Generative Network in Wavelet Transform Domain. Remote Sens. 2021, 13, 1858. [Google Scholar] [CrossRef]
  8. Onifade, O.F.; Akinde, P.; Olubusola Isinkaye, F. Circular Gabor Wavelet Algorithm for Fingerprint Liveness Detection. JACST 2020, 9, 1. [Google Scholar] [CrossRef]
  9. Gao, C.; Shen, W.; Zhang, Y. A Dynamic-Time Distance Based on Wavelet Decomposition for Subcellular Localization Classification. IEEE Access 2020, 8, 220293–220301. [Google Scholar] [CrossRef]
  10. Tian, B.; Wu, X.; Chen, C.; Qiu, W.; Ma, Q.; Yu, B. Predicting Protein–Protein Interactions by Fusing Various Chou’s Pseudo Components and Using Wavelet Denoising Approach. J. Theor. Biol. 2019, 462, 329–346. [Google Scholar] [CrossRef]
  11. Rajani Kumari, L.V.; Padma Sai, Y.; Balaji, N. R-Peak Identification in ECG Signals Using Pattern-Adapted Wavelet Technique. IETE J. Res. 2021, 1–10. [Google Scholar] [CrossRef]
  12. Choi, S.-Y. Industry Volatility and Economic Uncertainty Due to the COVID-19 Pandemic: Evidence from Wavelet Coherence Analysis. Financ. Res. Lett. 2020, 37, 101783. [Google Scholar] [CrossRef] [PubMed]
  13. Liang, Y.; Xie, Y.; Fei, X.; Tan, X.; Ma, H. Content Recognition of Network Traffic Using Wavelet Transform and CNN. In Proceedings of the Machine Learning for Cyber Security, Xi’an, China, 19–21 September 2019; Chen, X., Huang, X., Zhang, J., Eds.; Springer International Publishing: Cham, Switzerland, 2019; pp. 224–238. [Google Scholar]
  14. Zhong, X.; Dai, Y.; Dai, Y.; Jin, T. Study on Processing of Wavelet Speech Denoising in Speech Recognition System. Int. J. Speech Technol. 2018, 21, 563–569. [Google Scholar] [CrossRef]
  15. Palanivel, D.A.; Natarajan, S.; Gopalakrishnan, S. Retinal Vessel Segmentation Using Multifractal Characterization. Appl. Soft Comput. 2020, 94, 106439. [Google Scholar] [CrossRef]
  16. Wirsing, K.; Mili, L. Multifractal Analysis of Geomagnetically Induced Currents Using Wavelet Leaders. J. Appl. Geophys. 2020, 173, 103920. [Google Scholar] [CrossRef]
  17. Pourgholam, M.M.; Afzal, P.; Yasrebi, A.B.; Gholinejad, M.; Wetherelt, A. Detection of Geochemical Anomalies Using a Fractal-Wavelet Model in Ipack Area, Central Iran. J. Geochem. Explor. 2021, 220, 106675. [Google Scholar] [CrossRef]
  18. Liu, J.; Siew, W.H.; Soraghan, J.J.; Morris, E.A. A Novel Wavelet Selection Scheme for Partial Discharge Signal Detection under Low SNR Condition. In Proceedings of the 2018 IEEE Conference on Electrical Insulation and Dielectric Phenomena (CEIDP), Cancun, Mexico, 21–24 October 2018; pp. 498–501. [Google Scholar]
  19. Wu, C.; Chen, T.; Jiang, R.; Ning, L.; Jiang, Z. A Novel Approach to Wavelet Selection and Tree Kernel Construction for Diagnosis of Rolling Element Bearing Fault. J. Intell. Manuf. 2017, 28, 1847–1858. [Google Scholar] [CrossRef]
  20. Rodrigues, A.P.; D’Mello, G.; Srinivasa Pai, P. Selection of Mother Wavelet for Wavelet Analysis of Vibration Signals in Machining. J. Mech. Eng. Autom. 2016, 6, 81–85. [Google Scholar] [CrossRef]
  21. Chen, D.; Wan, S.; Bao, F.S. EEG-Based Seizure Detection Using Discrete Wavelet Transform through Full-Level Decomposition. In Proceedings of the 2015 IEEE International Conference on Bioinformatics and Biomedicine (BIBM), Washington, DC, USA, 9–12 November 2015; pp. 1596–1602. [Google Scholar]
  22. Shoaib, M.; Shamseldin, A.Y.; Melville, B.W. Comparative Study of Different Wavelet Based Neural Network Models for Rainfall–Runoff Modeling. J. Hydrol. 2014, 515, 47–58. [Google Scholar] [CrossRef]
  23. Ngui, W.K.; Leong, M.S.; Hee, L.M.; Abdelrhman, A.M. Wavelet Analysis: Mother Wavelet Selection Methods. AMM 2013, 393, 953–958. [Google Scholar]
  24. Yan, R.; Gao, R.X. Base Wavelet Selection for Bearing Vibration Signal Analysis. Int. J. Wavelets Multiresolut Inf. Process. 2009, 7, 411–426. [Google Scholar] [CrossRef]
  25. Li, J.; Jiang, T.; Grzybowski, S.; Cheng, C. Scale Dependent Wavelet Selection for De-Noising of Partial Discharge Detection. IEEE Trans. Dielect. Electr. Insul. 2010, 17, 1705–1714. [Google Scholar] [CrossRef]
  26. Chompusri, Y.; Dejhan, K.; Yimman, S. Mother Wavelet Selecting Method for Selective Mapping Technique ECG Compression. In Proceedings of the 2012 9th International Conference on Electrical Engineering/Electronics, Computer, Telecommunications and Information Technology, Phetchaburi, Thailand, 16–18 May 2012; pp. 1–4. [Google Scholar]
  27. Tumari, S.Z.M.; Sudirman, R.; Ahmad, A.H. Selection of a Suitable Wavelet for Cognitive Memory Using Electroencephalograph Signal. ENG 2013, 5, 15–19. [Google Scholar] [CrossRef] [Green Version]
  28. Adamo, F.; Andria, G.; Attivissimo, F.; Lanzolla, A.M.L.; Spadavecchia, M. A Comparative Study on Mother Wavelet Selection in Ultrasound Image Denoising. Measurement 2013, 46, 2447–2456. [Google Scholar] [CrossRef]
  29. Saraswathy, J.; Hariharan, M.; Nadarajaw, T.; Khairunizam, W.; Yaacob, S. Optimal Selection of Mother Wavelet for Accurate Infant Cry Classification. Australas Phys. Eng. Sci. Med. 2014, 37, 439–456. [Google Scholar] [CrossRef]
  30. Al-Qazzaz, N.K.; Ali, S.; Ahmad, S.A.; Islam, M.S.; Ariff, M.I. Selection of Mother Wavelets Thresholding Methods in Denoising Multi-Channel EEG Signals during Working Memory Task. In Proceedings of the 2014 IEEE Conference on Biomedical Engineering and Sciences (IECBES), Miri, Malaysia, 8–10 December 2014; pp. 214–219. [Google Scholar]
  31. Al-Qazzaz, N.; Hamid Bin Mohd Ali, S.; Ahmad, S.; Islam, M.; Escudero, J. Selection of Mother Wavelet Functions for Multi-Channel EEG Signal Analysis during a Working Memory Task. Sensors 2015, 15, 29015–29035. [Google Scholar] [CrossRef] [Green Version]
  32. Seljuq, U.; Himayun, F.; Rasheed, H. Selection of an Optimal Mother Wavelet Basis Function for ECG Signal Denoising. In Proceedings of the 17th IEEE International Multi Topic Conference 2014, Karachi, Pakistan, 8–10 December 2014; pp. 26–30. [Google Scholar]
  33. Cunha, C.F.F.C.; Carvalho, A.T.; Petraglia, M.R.; Lima, A.C.S. A New Wavelet Selection Method for Partial Discharge Denoising. Electr. Power Syst. Res. 2015, 125, 184–195. [Google Scholar] [CrossRef]
  34. He, H.; Tan, Y.; Wang, Y. Optimal Base Wavelet Selection for ECG Noise Reduction Using a Comprehensive Entropy Criterion. Entropy 2015, 17, 6093–6109. [Google Scholar] [CrossRef] [Green Version]
  35. Wijaya, D.R.; Sarno, R.; Zulaika, E. Information Quality Ratio as a Novel Metric for Mother Wavelet Selection. Chemom. Intell. Lab. Syst. 2017, 160, 59–71. [Google Scholar] [CrossRef]
  36. Alyasseri, Z.A.A.; Khader, A.T.; Al-Betar, M.A. Electroencephalogram Signals Denoising Using Various Mother Wavelet Functions: A Comparative Analysis. In Proceedings of the International Conference on Imaging, Signal Processing and Communication, Shenzhen, China, 17–19 November 2017; Association for Computing Machinery: New York, NY, USA, 2017; pp. 100–105. [Google Scholar]
  37. Ji, N.; Zhou, H.; Guo, K.; Samuel, O.W.; Huang, Z.; Xu, L.; Li, G. Appropriate Mother Wavelets for Continuous Gait Event Detection Based on Time-Frequency Analysis for Hemiplegic and Healthy Individuals. Sensors 2019, 19, 3462. [Google Scholar] [CrossRef] [Green Version]
  38. Atangana, R.; Tchiotsop, D.; Kenne, G.; Djoufack Nkengfack, L.C. Suitable Mother Wavelet Selection for EEG Signals Analysis: Frequency Bands Decomposition and Discriminative Feature Selection. SIPIJ 2020, 11, 33–49. [Google Scholar] [CrossRef]
  39. Peng, P.; He, Z.; Wang, L.; Jiang, Y. Automatic Classification of Microseismic Records in Underground Mining: A Deep Learning Approach. IEEE Access 2020, 8, 17863–17876. [Google Scholar] [CrossRef]
  40. Peng, P.; He, Z.; Wang, L.; Jiang, Y. Microseismic Records Classification Using Capsule Network with Limited Training Samples in Underground Mining. Sci. Rep. 2020, 10, 13925. [Google Scholar] [CrossRef]
  41. He, Z.; Peng, P.; Wang, L.; Jiang, Y. PickCapsNet: Capsule Network for Automatic P-Wave Arrival Picking. IEEE Geosci. Remote Sens. Lett. 2021, 18, 617–621. [Google Scholar] [CrossRef]
  42. Lilly, J.M.; Olhede, S.C. On the Analytic Wavelet Transform. IEEE Trans. Inf. Theory 2010, 56, 4135–4156. [Google Scholar] [CrossRef] [Green Version]
  43. Huang, L.; Hao, H.; Li, X.; Li, J. Source Identification of Microseismic Events in Underground Mines with Interferometric Imaging and Cross Wavelet Transform. Tunn. Undergr. Space Technol. 2018, 71, 318–328. [Google Scholar] [CrossRef]
  44. Huang, L.; Hao, H.; Li, X.; Li, J. Micro-Seismic Monitoring in Mines Based on Cross Wavelet Transform. Earthq. Struct. 2016, 11, 1143–1164. [Google Scholar] [CrossRef]
  45. Sun, Z.; Chang, C.C. Structural Damage Assessment Based on Wavelet Packet Transform. J. Struct. Eng. 2002, 128, 1354–1361. [Google Scholar] [CrossRef]
  46. Wang, S.; Tang, Y.; Cao, R.; Zhou, Z.; Cai, X. Regressive and Big-Data-Based Analyses of Rock Drillability Based on Drilling Process Monitoring (DPM) Parameters. Mathematics 2022, 10, 628. [Google Scholar] [CrossRef]
  47. Wang, S.; Sun, L.; Li, X.; Zhou, J.; Du, K.; Wang, S.; Khandelwal, M. Experimental Investigation and Theoretical Analysis of Indentations on Cuboid Hard Rock Using a Conical Pick under Uniaxial Lateral Stress. Geomech. Geophys. Geo-Energ. Geo-Resour. 2022, 8, 34. [Google Scholar] [CrossRef]
  48. Huang, L.; Li, J.; Hao, H.; Li, X. Micro-Seismic Event Detection and Location in Underground Mines by Using Convolutional Neural Networks (CNN) and Deep Learning. Tunn. Undergr. Space Technol. 2018, 81, 265–276. [Google Scholar] [CrossRef]
  49. Mousa, W.A.; Al-Shuhail, A.A.; Al-Lehyani, A. A New Technique for First-Arrival Picking of Refracted Seismic Data Based on Digital Image Segmentation. GEOPHYSICS 2011, 76, V79–V89. [Google Scholar] [CrossRef]
  50. Rawles, C.; Thurber, C. A Non-Parametric Method for Automatic Determination of P-Wave and S-Wave Arrival Times: Application to Local Micro Earthquakes. Geophys. J. Int. 2015, 202, 1164–1179. [Google Scholar] [CrossRef] [Green Version]
  51. Akram, J.; Eaton, D.W. A Review and Appraisal of Arrival-Time Picking Methods for Downhole Microseismic Data. GEOPHYSICS 2016, 81, KS71–KS91. [Google Scholar] [CrossRef]
  52. Zhang, J.; Tang, Y.; Li, H. STA/LTA Fractal Dimension Algorithm of Detecting the P-Wave Arrival. Bull. Seismol. Soc. Am. 2018, 108, 230–237. [Google Scholar] [CrossRef]
  53. Zhu, M.; Wang, L.; Liu, X.; Zhao, J.; Peng, P. Accurate Identification of Microseismic P- and S-Phase Arrivals Using the Multi-Step AIC Algorithm. J. Appl. Geophys. 2018, 150, 284–293. [Google Scholar] [CrossRef]
  54. Guo, C.; Zhu, T.; Gao, Y.; Wu, S.; Sun, J. AEnet: Automatic Picking of P-Wave First Arrivals Using Deep Learning. IEEE Trans. Geosci. Remote Sens. 2021, 59, 5293–5303. [Google Scholar] [CrossRef]
  55. He, Z.; Peng, P.; Wang, L.; Jiang, Y. Enhancing Seismic P-Wave Arrival Picking by Target-Oriented Detection of the Local Windows Using Faster-RCNN. IEEE Access 2020, 8, 141733–141747. [Google Scholar] [CrossRef]
Figure 1. A mining-induced microseismic monitoring system was installed to monitor the safety of goaves in the Huangtupo Copper and Zinc Mine.
Applsci 12 06470 g001
Figure 2. Records collected by mining-induced microseismic monitoring system in Huangtupo Copper and Zinc Mine.
Applsci 12 06470 g002
Figure 3. The amplitude distribution of all used seismic records.
Applsci 12 06470 g003
Figure 4. The difference between wavelet transform and wavelet packet transform. A means the wavelet coefficient of the low-frequency component in the signal. D means the wavelet coefficient of the high-frequency component in the signal.
Applsci 12 06470 g004
Figure 5. The calculation approach of the stability w of wavelet packet transform. For a wavelet, perform wavelet packet decomposition on each signal in the dataset, and then use each wavelet packet coefficient to reconstruct the signal. Correlation coefficients co and variance contribution rates vcr were calculated between the reconstructed and original signals. The co and vcr can calculate the relevance between a wavelet and a signal. Therefore, the stability obtained from the mean and variance calculations of the variance can be used for wavelet selection, and the wavelet with the highest stability is the most appropriate.
Applsci 12 06470 g005
Figure 6. Automatic classification of microseismic signals using wavelet packet decomposition and deep learning. After performing a 3-level wavelet packet decomposition, the eight wavelet coefficients can be obtained from the mining-induced microseismic waveform. These wavelet coefficients are formed into a feature matrix adopted as input for training the convolutional neural network.
Applsci 12 06470 g006
Figure 7. Automatic seismic P arrival picking using wavelet packet decomposition and deep learning. After performing a 3-level wavelet packet decomposition, the eight wavelet coefficients can be obtained from the seismic waveform. These wavelet coefficients are adopted as input for the training of the LSTM network.
Applsci 12 06470 g007
Figure 8. The automatic seismic P arrival picking results using wavelet packet decomposition and deep learning. (a) The first round of comparison experiments. (b) The second round of comparison experiments. (c) The third round of comparison experiments. Each round of comparison experiments contains the rbio3.1 wavelet selected by our method (blue) and five randomly selected wavelets (yellow).
Applsci 12 06470 g008
Figure 9. When calculating w, the influence of different wavelet packet decomposition levels.
Applsci 12 06470 g009
Table 1. Some commonly used wavelets and their characteristics.
WaveletRepresentationOrthogonalityBiorthogonalitySupport LengthSymmetryGlobal Moment
HaarHaaryesyes1symmetry1
Daubechiesdb Nyesyes2N − 1approximateN
Symletssym Nyesyes2N − 1approximateN
Coifletscoif Nyesyes6N − 1approximate2N
BiorSplinesbior Nr.Ndnoyesreconstruction: 2Nr + 1
decomposition: 2Nd + 1
asymmetryNr − 1
ReverseBiorrbio Nr.Ndnoyesreconstruction: 2Nr + 1
decomposition: 2Nd + 1
symmetryNr − 1
Table 2. The decomposition stability w of each wavelet concerning M1.
WaveletwWaveletwWaveletwWaveletwwaveletW
haar−4.78db10−5.56coif5−5.51bior3.5−9.72rbio2.8−2.25
db1−4.78sym2−5.19bior1.1−4.77bior3.7−9.22rbio3.1−0.03
db2−5.19sym3−5.38bior1.3−4.83bior3.9−9.16rbio3.3−0.86
db3−5.38sym4−5.40bior1.5−4.87bior4.4−6.50rbio3.5−0.98
db4−5.39sym5−5.41bior2.2−9.64bior5.5−3.51rbio3.7−1.04
db5−5.44sym6−5.40bior2.4−8.47bior6.8−6.54rbio3.9−1.09
db6−5.52sym7−5.62bior2.6−8.19rbio1.5−5.65rbio4.4−4.31
db7−5.46sym8−5.46bior2.8−8.20rbio2.2−1.70rbio5.5−6.66
db8−5.48coif3−5.43bior3.1−33.48rbio2.4−2.06rbio6.8−4.47
db9−5.61coif4−5.48bior3.3−11.46rbio2.6−2.18
Table 3. Experimental results of signal classification under the use of different wavelets.
Waveletrbio3.1haardb2sym2coif3bior3.1
Test accuracy93.55%90.92%91.33%91.83%89.75%91.42%
Test accuracy92.75%91.25%90.67%91.83%90.58%91.33%
Test accuracy93.08%90.50%87.42%90.92%92.25%91.58%
Table 4. The decomposition stability w of each wavelet concerning M2.
WaveletwWaveletwWaveletwWaveletwWaveletw
haar−1.207db10−1.536coif5−1.533bior3.5−5.547rbio2.80.213
db1−1.207sym2−1.411bior1.1−1.207bior3.7−5.010rbio3.110.422
db2−1.411sym3−1.480bior1.3−1.139bior3.9−4.912rbio3.32.776
db3−1.480sym4−1.486bior1.5−1.144bior4.4−2.080rbio3.51.858
db4−1.496sym5−1.505bior2.2−4.874bior5.5−0.337rbio3.71.497
db5−1.497sym6−1.515bior2.4−3.961bior6.8−2.152rbio3.91.323
db6−1.519sym7−1.511bior2.6−3.752rbio1.5−1.648rbio4.4−0.982
db7−1.515sym8−1.543bior2.8−3.622rbio2.20.824rbio5.5−2.652
db8−1.528coif3−1.517bior3.1−25.742rbio2.40.388rbio6.8−0.965
db9−1.520coif4−1.541bior3.3−7.114rbio2.60.269
Publisher’s Note: MDPI stays neutral with regard to jurisdictional claims in published maps and institutional affiliations.

