Abstract
To investigate the mechanical characteristics of shield tunnels when openings are made for the construction of cross passages, a series of centrifugal model tests were conducted. The segmental features of the shield tunnel were simulated in the tests, and the influence of different types of openings, namely, rectangular opening, small circular opening, and big circular opening was compared. External earth pressures, structural deformations, dislocations, and structural stresses were monitored during the tests, while the influence of different buried depths was also investigated. The results show that (1) soil arching effect occurred in the overlying soil due to the deformation of the tunnel, and the earth pressure reduction coefficients can guide the tunnel structural design; (2) vertical deformations of the main tunnel and the dislocations between adjacent rings increased with the opening sizes significantly; (3) significant stress concentration occurred close to the openings, and the compressive stress at the inner surface may even exceed the limit strength of the concrete. In summary, the adverse responses of the tunnel increased with the increase of the buried depth and the opening size. Targeted measures should be taken, such as temporary support, longitudinal connections, and high-strength materials near the openings.
1. Introduction
Cross passages, as the important auxiliary structures linking the double-line tunnels, play a vital role in the accident evacuation, fire rescue, operating ventilation, and other functions in tunnels [1,2,3,4,5]. However, when lateral openings are broken out on shield tunnels to construct cross passages, the stress and deformation characteristics of the structure will become complicated, due to the flexible features of shield tunnels. The shapes of the openings may be different, such as rectangle [6,7,8,9] or circle [10,11,12]. The sizes of the rectangular openings mentioned are 1.2 m (width) [6], 2.3 m × 2.3 m (width × height) [7], 1.2 m–6 m × 1.9 m (width × height) [8], and 2.1 m × 2.1 m (width × height) [9], respectively. The diameters of the circular openings mentioned are 6.2 m [10], 3.6 m [11], and 3.3 m [12], respectively. Due to the different sizes of the openings, the number of the lining rings involved by the openings varied from two to five rings in the corresponding projects. However, there are few systematic studies on the influence of different types of openings on the shield tunnels.
The research methods to investigate the mechanical characteristics, e.g., stress state, deformation pattern of shield tunnels include theoretical analysis [13,14,15], numerical simulations [1,2,16,17], field monitoring [2,3,4,5], and model tests [18,19,20,21]. The combination of the cross passages and main tunnels is a complex three-dimensional structure, which is unrealistic to utilize classical theoretical methods such as beam-spring models or homogeneous ring models to perform analysis.
Numerical methods will play a significant role in investigating this issue. Spyridis and Bergmeister (2015) [16] investigated the structural response of a tunnel when a lateral opening is formed on it, using two-dimensional and three-dimensional finite element analysis. Three-dimensional models were established to investigate the structural behavior of the tunnel openings, and the results showed that a lintel effectively transfers the load above the opening to the adjacent lining rings [8]. Tan et al. (2020) [17] established three-dimensional discontinuous contact numerical tunnel models, including segments, joints, and bolts, to investigate the mechanical characteristics of the mainline tunnel at the opening. However, it is still challenging to accurately simulate the details of the segmental joints such as bolts and bolt holes, mortises and tenons, and sealing liners for problems involving tunnels of a larger scale.
Numerical results need to be verified by in situ monitoring data or model tests. Frost heave pressure on the shield tunnel during the construction of the cross passages were monitored using anti-freezing pad-type earth pressure gauges [7]. The maximum measured increment of earth pressures was about 0.2 MPa, smaller than the anticipated value. Tan et al. (2020) [17] conducted field tests of earth pressures, stresses of steel bars and concrete, and the internal forces of bolts on the segmental linings around the opening for the cross passages. The stress characteristics and dangerous sections were identified according to the results of the field tests.
Model tests are an effective method to investigate the mechanical characteristics of tunnels. Because shield tunnels are discontinuous segmental structures, it is significant to simulate the segmental features in the model test. Some modeling methods have been proposed to simulate assembled shield tunnels, which can provide a reference for this paper. Zheng et al. (2017) [18] employed polypropylene to manufacture model segments, aluminum wires as the circumferential and longitudinal joints, and 1 g scaled model tests were carried out to investigate the progressive structural collapse of the segmental linings. Li et al. (2019) [19] used plexiglass to simulate the segmental linings, polycarbonate to simulate the longitudinal bolts, and the groove method to simulate circumferential joints. Wang et al. (2020) [20] utilized special gypsum and steel wires to manufacture the reinforced concrete segmental lining rings in 1 g model tests. Inner and outer dividing grooves were fabricated to simulate the circumferential joints. A 1 g shaking table test with the model tunnel assembled by organic glass segments, 5 mm thick rubber strips, and M5 steel bolts was conducted by Yang et al. (2021) [21]. All the above tests are small-scale model tests conducted in 1 g condition, whose simulation laws are different from n g centrifugal model tests. Still, the above ideas of designing the joints of model shield tunnels can be adopted.
From the overview above, no centrifugal model tests investigate the mechanical characteristics, e.g., stress state, deformation pattern of shield tunnels influenced by openings. The influence of different opening types, such as different sizes or shapes, remains unclear. Therefore, this paper performed centrifugal model tests to explore the mechanical response of the shield tunnels with three different types of openings under different buried depths. The findings can guide the design of the cross passages in shield tunnels.
2. Test Design
2.1. Centrifugal Model Test Platform and Container
The centrifugal model tests were performed on the TK-C500 Centrifuge of Tianjin Water Transport Engineering Research Institute in Tianjin, China, whose effective capacity is 500 g·t (mass multiplied by centrifugal acceleration), the largest in China, as shown in Figure 1. The length, width, and height of the soil box used in the test are 1.2 m, 1.0 m, and 1.2 m, respectively, which is the largest box that can be placed in the centrifuge basket.
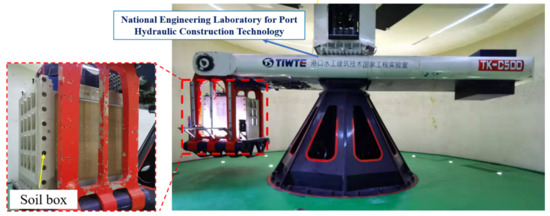
Figure 1.
TK-C500 centrifuge.
2.2. Design of the Model Segmental Lining
2.2.1. Geometric Dimension of the Model Lining Ring
The engineering background of the test is the shield tunnel project of the Beijing East Sixth Ring Road reconstruction project, whose external diameter, lining thickness, and average width are 15.5 m, 0.65 m, and 2 m, respectively, as shown in Figure 2.
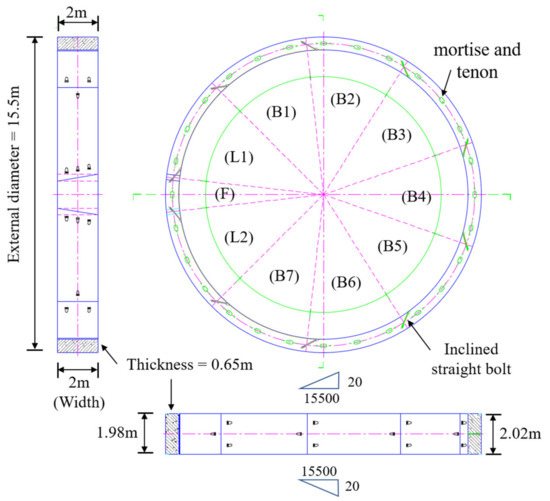
Figure 2.
Segment layout and dimensions.
The tests aim to investigate the mechanical characteristics of the mainline tunnel when lateral openings of different types, i.e., small circle, large circle, and rectangle, were made to construct cross passages. In general, the larger the dimension of the model tunnel, the easier to machine the detailed parts, such as joints of the model lining. Due to the limitation of the soil box and the requirements of the tunnel boundary conditions, considering the symmetry of the investigating issues, only one mainline tunnel was set in the model box. The primary geometric similarity ratio of the centrifugal tests is 1:50, namely that the external diameter (D) and the ring width of the model lining are 310 mm and 40 mm, respectively. The general similarity laws of the centrifuge model tests can be deduced according to the similarity theory, as shown in Table 1.

Table 1.
Similarity law of the centrifugal model tests.
The lining thickness was determined considering the similarity of the bending stiffness (E.I.). In the tests, Mg–Al alloy (AZ31B) is employed as the material of the model lining, with the advantages of high strength and good machinability. In addition, the elastic modulus of the selected material is 44.8 GPa, close to that of the prototype lining material, C60 concrete with an elastic modulus of 36.5 GPa, making the thickness similarity ratio close to the primary geometric similarity ratio.
According to the similarity principle of the model test, the thickness of the model lining can be calculated by
where tm(tp) is the model (prototype) lining thickness; Em(Ep) is the elastic modulus of model (prototype) material; n is the primary geometric similarity ratio. The lining thickness in the tests is 12.5 mm.
2.2.2. Simulation of the Longitudinal Joints
To simulate the weakening of the bending stiffness at the longitudinal joints (the joints between segments of the same ring), inner and outer grooves are cut on the lining rings. According to previous studies [22,23], the reduction ratio (m) of the bending stiffness at the longitudinal joints compared to the normal section was set to 0.2. Hence, the remaining lining thickness at the cutting grooves can be calculated by
where trem refers to the remaining lining thickness. The inner and outer cutting groove depths are the same, so the groove depth on each side is
The cutting groove depth calculated is 2.5 mm. The cutting groove width is mainly determined, considering not to affect the structural safety and avoid the soil from filling the cutting grooves. The groove width was set to 1.2 mm. The positions of the cutting grooves are designed based on the practical segmentation of the shield tunnel. Namely, the segment ring is divided into 10 blocks, and the central angle of the capping block is 12°51′25.71″, while the center angle of the other nine pieces is 38°34′17.14″.
2.2.3. Simulation of the Circumferential Joints
In practical engineering, there are 28 evenly distributed mortises and tenons at the circumferential joints (between adjacent rings) to resist the staggering deformation and provide shear stiffness. Two inclined bolts are arranged at both sides of one couple of mortises and tenons along the circumferential direction to provide longitudinal connection and preload. Previous studies [24,25] have demonstrated that the shear stiffness between adjacent rings is firstly provided by the friction of the segments, and when the mortise and tenon contact, the tenon-mortise structure will play a significant role.
The area of a single tenon is Ap = (150 × 120 + 3.14 × 1502/4) mm2 = 3.56 × 104 mm2. The elastic modulus, Poisson’s ratio, and the shear modulus of C60 concrete are 36.5 GPa, 0.167, and 15.6 GPa, respectively. Thus, the shear stiffness of a single tenon can be calculated as GpAp = 15.6 GPa × 3.56 × 104 mm2 = 5.55 × 10⁸ N. The average shear length of the long and short axes is 210 mm, so the shear stiffness coefficient of a single tenon is ksp = GA′/L′ = 5.55 × 10⁸ N/(210 mm) = 2.64 × 10⁹ N/m.
In the tests, 28 straight bolts were chosen to simulate the shear stiffness of the practical tenons. The model bolt positions are determined according to the positions of the evenly distributed tenons and the segmentation of the lining ring. The lining ring was machined of counterbores and through holes on one side, and thread holes on the other side, to realize the ring-by-ring assembly of the model lining. According to the similarity principle, the stiffness of a single model bolt should be ksm = ksp/n = (2.64 × 10⁹/50) N/m = 5.28 × 10⁷ N/m. The size of the model bolts and bolt holes should not be too large to affect the mechanical characteristics of the lining ring, nor too small to make it hard to machine and assembly. Thus, Al alloy bolts (No. 6063) were used in the tests, whose elastic modulus and Poisson’s ratio are 70 GPa and 0.33, respectively. The bolt diameter calculated is 2.55 mm, so Al alloy bolts with a diameter of 2.5 mm were employed as the circumferential joints. Specifically, the diameter of threaded holes, through holes, and counterbores are 2.5 mm, 2.8 mm, and 5 mm, respectively. When assembling the model lining, the pre-tightening force of a single bolt is about 440 N, so the compressive stress of the contact surface between adjacent rings is about 1.06 MPa. The overall photo and the local details of the joints are shown in Figure 3.
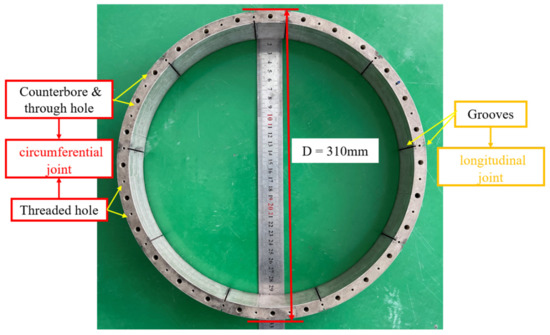
Figure 3.
Model lining ring.
2.2.4. Stiffness Characteristics of Model Segmental Lining Ring
To investigate the influence of grooving and drilling on the stiffness of the lining ring, the radial loading tests were performed for four different structural types, with the material, external diameter, width, and thickness being the same, whereas the difference is whether to groove or drill.
A digital display electronic pressure testing machine was used, with a maximum axial force of 1000 N. The stiffness of lining rings is compared according to the convergence deformation induced by the radial loading. The loading speed was set to 1 mm/min, and the maximum loading force was set to 500 N. The stiffness test devices and results are shown in Figure 4.
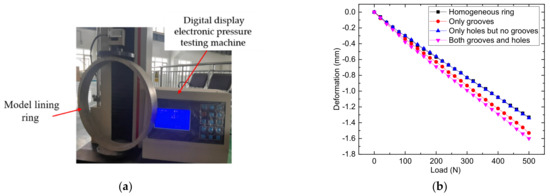
Figure 4.
Stiffness tests of different types of lining rings: (a) testing process; (b) comparisons of the stiffness of different types of the lining rings.
As shown in Figure 4b, the radial deformations of the four types of rings all vary linearly with the loading force. The reduction factors of the stiffness of the lining ring with only grooves, only holes, and both grooves and holes compared to a homogeneous ring are 0.88, 0.99, and 0.84, respectively. The results show that the influence of only drilling holes on the structural stiffness is negligible, and the reduction factor of the ring with both grooves and holes, which is finally used in the tests, is within the range of previous research results of 0.2 to 0.9 [26], demonstrating the reasonability of the joint simulation method.
2.3. Model Soil
The prototype soil of the project is primarily dense fine sand, which is simulated by standard fine sand in the tests. The particle size of the sand used in the centrifugal tests needs to meet the requirement that the ratio of model tunnel diameter to the sand particle size d50 should be more than 45 [27]. Thus, the particle amplification effect caused by the increase of centrifugal acceleration can be ignored in the tests.
The physical parameters of the model soil are shown in Table 2. The parameter d50 of the model sand is 0.17 mm, while the diameter of the model tunnel is 310 mm, which meets the above requirement. The sand rain method was used to prepare the ground for the tests. The falling distance is 0.5 m, and the mass of sand flowing from the end of pipe per unit time is about 5 kg/min. The density of the sand employed in the tests is about 1610 kg/m3. Generally, under the centrifugal conditions, the commonly used waterproof methods are to apply glue or wrap the rubber film. However, there are so many joints in the model tunnel that the waterproofing of the tunnel is hard to fully guarantee under 50 g centrifugal acceleration conditions. Hence, dry sand was chosen to conduct the tests, ignoring the existence of water for the safety and reliability of the tests.
Table 2.
Physical parameters of standard sand.
Three different buried depths above the tunnel were considered in the tests, namely, 1.0 D, 1.5 D, and 2.0 D, respectively.
2.4. Types of the Openings
When constructing cross passages on shield tunnels, due to different functions such as for pedestrians or vehicles, and different construction methods such as traditional mining method or mechanical method, the types of the openings may be different. In the tests, three different types of openings were investigated, namely, rectangle (width = 46 mm, height = 56 mm), small circle (diameter = 86 mm), and big circle (diameter = 120 mm). The rectangular opening corresponds to the cross passage for pedestrians constructed by the traditional mining method; the small circular opening corresponds to the cross passage for pedestrians constructed by the mechanical method; the big circular opening corresponds to the cross passage for vehicles. To facilitate narration, the rectangular opening, small circular opening, and big circular opening are denoted as Rec-Op, SC-Op, and BC-Op, respectively. The positions of the three openings on the mainline tunnel can be seen in Figure 5. The openings, Rec-Op, SC-Op, and BC-Op are located at the 4th–5th, 11th–13th, and 21st–24th rings of the mainline tunnel. Model cross passages with a size slightly smaller than the opening size (length, width, or diameter smaller by 1 mm) are installed at each opening, which are mainly used to simulate the boundary conditions of the mainline tunnel during the operation period after the completion of the construction of the cross passages.
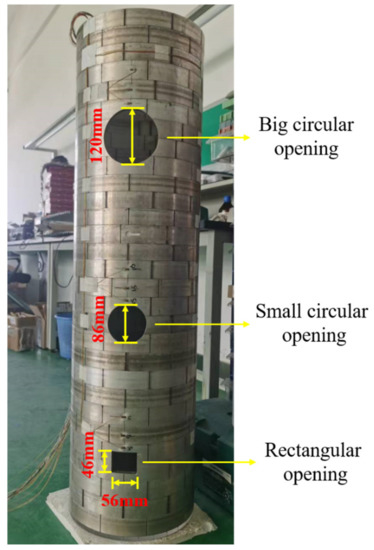
Figure 5.
Three openings on the model tunnel.
2.5. Monitoring Scheme
The tests aim to investigate the influence of different types of openings on the mainline shield tunnel. In the tests, the deformations of the main tunnel, dislocations between adjacent rings, stress states around the openings, and the external earth pressures on the main tunnel were monitored for different opening types and different overlying soil depths. Detailed monitoring schemes are as follows, and the overall monitoring scheme is shown in Figure 6.
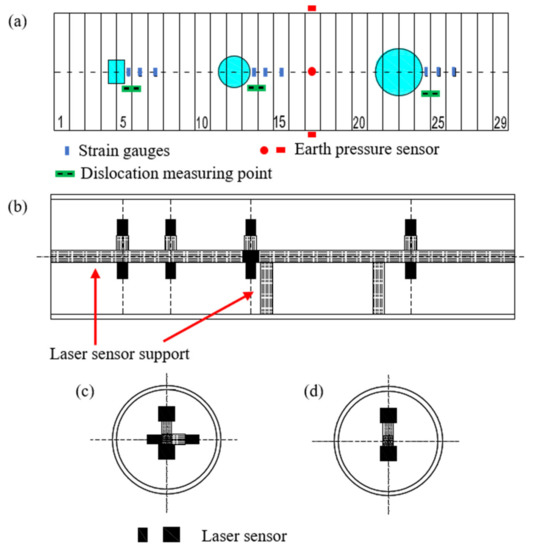
Figure 6.
Schematic diagram of monitoring scheme: (a) layout of the openings, strain gauges, and earth pressure sensors; (b) layout of the laser sensors and support in the front view; (c) layout of the laser sensors and support in the side view for SC-Op; (d) layout of the laser sensors and support in the side view for other sections.
(1) Earth pressure. To investigate the external load on the mainline tunnel from the surrounding soil, three earth pressure sensors were arranged on the outer surface of the tunnel to monitor the vertical pressures at the vault and the invert, and the lateral earth pressure at the hance of the tunnel lining. The results of earth pressure can reflect the effect of soil arching and guide structural mechanics analysis. The monitoring section is set far away from the openings, as shown in Figure 6a, considered not to be affected by the openings.
(2) Structural deformation. Laser displacement sensors are arranged inside the model tunnel. The vertical deformation of the tunnel can be obtained by monitoring the vertical displacement of the vault and the invert, while the horizontal deformation can be obtained by monitoring the horizontal displacement of the tunnel hances. Due to the limitation of the internal space of the model tunnel, the number of laser displacement sensors, and the monitoring channels, the vertical and horizontal deformations are monitored close to the small circular opening, whereas only the vertical deformation is monitored for the other three sections.
Panasonic HG-1050 and HG-1100 laser sensors are employed. The HG-1050 laser sensor has a measuring range of 30 mm, a monitoring distance of 35–65 mm, and an accuracy of 30 μm; the HG-1100 laser sensor has a measuring range of 70 mm, a monitoring distance of 65–135 mm, and accuracy of 70 μm, meeting the requirements of test accuracy. The laser sensors need to be fixed inside the tunnel structure through combined alloy support. The layout of the laser sensors is shown in Figure 6b–d.
(3) Dislocations between rings. Openings on the shield tunnel for cross passages will weaken the lining stiffness at the opening position, and then induce uneven deformation between adjacent rings, causing dislocations. Up to now, there are few published appropriate approaches to monitor the dislocation between segments in the previous scaled shield tunnel model tests. In the tests, an indirect method was used to measure dislocations between adjacent rings. As shown in Figure 7, an aluminum sheet is arranged across the seam between two adjacent rings, as the two ends of the aluminum sheet are pasted on the adjacent segments, while the middle of the aluminum sheet can deform freely. When a dislocation occurs, the strain sensors attached to the aluminum sheet can monitor the length changes, so the corresponding dislocation amount can be calculated based on the geometric relationship. The tests monitored the dislocations close to the three openings, with the specific locations shown in Figure 6a.
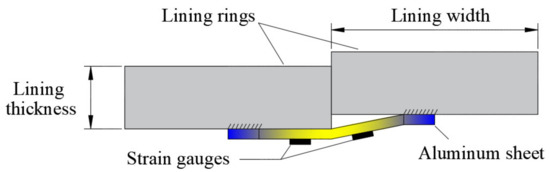
Figure 7.
Schematic diagram of the dislocation measuring point.
(4) Structural stress. Previous studies have demonstrated that the influence of the opening on the mainline tunnel stress is concentrated at the opening position and 1–2 rings nearby [12,17]. Considering the symmetry, for each opening, three couples of strain gauges (one inside and one outside) are arranged longitudinally along the tunnel, to analyze the stress concentration degree and influence range, as shown in Figure 6a.
2.6. Test Procedure
Three cross passages are set on one mainline tunnel. The influence of the different types of openings on the mainline tunnel was investigated under three different buried depths. The main test procedure is as follows:
(1) Fabricate lining rings, openings, and model cross passages, as well as end plates, and prepare connecting bolts and sensors. (2) Assemble the lining ring by ring and install the sensors at the designed positions. (3) Assemble the model cross passages at the corresponding openings, and fill the gap with epoxy resin cement. (4) After the soil beneath the tunnel with a thickness of 100 mm is paved on the bottom of the soil box, place the tunnel onto the bottom soil, and then continue to sprinkle sand to the design position that the thickness of soil covering the main tunnel is 1.0 D. (5) Lift the soil box onto the centrifuge basket, connect the sensors to the centrifuge data acquisition system, clean and inspect the centrifuge room, and close the hatch, preparing for the test. (6) Accelerate the centrifuge level by level, with 10 g for each level. After the sensor data of this level is stable, continue to accelerate to the next grade, finally reaching 60 g, and save the test data of the whole process. (7) Decelerate and shut down the centrifuge. When the centrifuge completely stops, open the hatch, and prepare for the next test. (8) Sprinkle sand onto the ground surface of the last test until the buried depth above the main tunnel is 1.5 D. (9) Repeat the above 5–7 steps. (10) Sprinkle sand onto the ground surface of the last test until the buried depth reaches 2.0 D. (11) Repeat the above 5–6 steps. (12) Decelerate and shut down the centrifuge. When the centrifuge completely stops, open the hatch, disconnect the sensors from the centrifuge, and dig out the tunnel and the soil for the next test. The photos taken during the preparation of the model tests are shown in Figure 8.
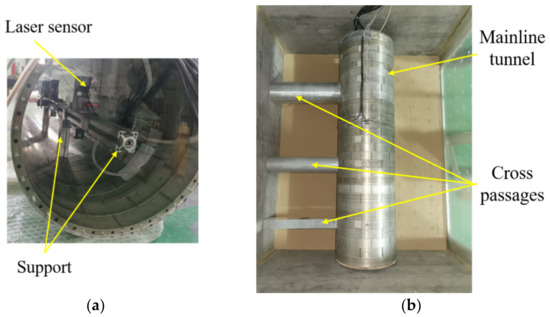
Figure 8.
Photos of the model tunnel: (a) laser sensors and support; (b) model tunnel in soil box.
3. Test Results
3.1. External Earth Pressures
External earth pressures at the vault, invert, and hance of the main tunnel were monitored. The monitoring section was far away enough from the openings, considered not to be affected by the openings. The external earth pressure results can provide a reference for external loads on the tunnel in the process of structural design or theoretical analysis.
Variations of the earth pressures versus time at three different positions under three different buried depths are plotted in Figure 9.
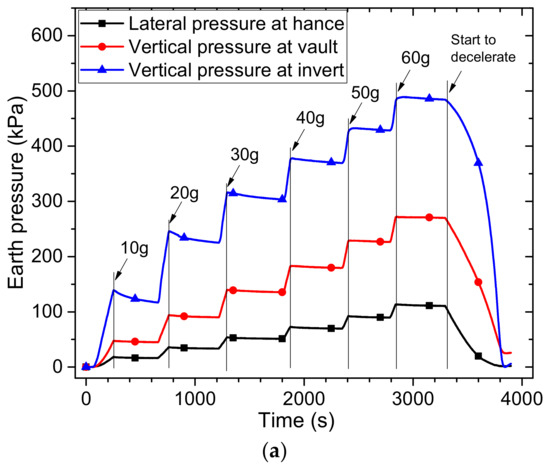
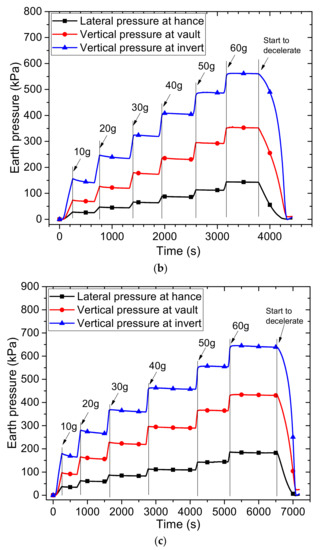
Figure 9.
Variations of earth pressures versus test time: (a) 1.0 D, (b) 1.5 D, (c) 2.0 D.
As the centrifuge accelerated level by level, the earth pressures increased and showed obvious step variations versus test time. When the acceleration reached the design value for each level, the earth pressure would gradually tend to be stable and the values after stabilization for each acceleration level are extracted. In addition, it can be found that the greater the buried depth, the longer the time required for the stability of the earth pressure results.
The vertical earth pressures at the tunnel vault under 50 g acceleration of the three buried depths, namely, 1.0 D, 1.5 D, and 2.0 D, are 226.4 kPa, 292.1 kPa, and 364.3 kPa, respectively, while the theoretical values of earth pressures considering the whole soil column are 244.6 kPa, 366.8 kPa, and 489.1 kPa. It shows that the vertical earth pressures at the vault are smaller than the theoretical values, and the reduction coefficients are 0.926, 0.796, and 0.74, respectively, indicating that a certain soil arching effect has occurred in the soil above the tunnel. Moreover, the reduction coefficient of the vertical earth pressure at the tunnel vault gradually decreases with the increase of buried depth. The reason can be speculated that, with the increase of buried depth, the load on the tunnel increases, and the elliptical deformation trend is amplified, resulting in a more significant arch effect of the overlying soil.
The lateral earth pressures at the tunnel hance under 50 g acceleration of the three buried depths, namely, 1.0 D, 1.5 D, and 2.0 D, are 89.7 kPa, 112.1 kPa, and 143.8 kPa, respectively. Thus, the lateral pressure coefficients corresponding to the vertical earth pressure of the whole soil column are 0.245, 0.229, and 0.235, respectively. In practical engineering, as the elliptical deformation trend will be amplified due to the increase of the buried depth, the soil close to the tunnel hance will be squeezed to a certain extent, resulting in passive earth pressure, and the lateral earth pressure coefficient may increase to a certain extent. However, in the tests, the three lateral pressure coefficients were consistent. This is because, in the scaled model tests, the lateral expansion displacement of the tunnel was limited, and the passive earth pressures caused were relatively small, so the monitored lateral pressure coefficients were consistent.
3.2. Structural Deformation
As the structural deformation monitoring scheme has been described in Section 2.5, there are four tunnel structural deformation monitoring sections. Vertical and horizontal deformations were both monitored for the small circular opening, while only vertical deformations were monitored for the other three monitoring sections. The variations of the deformations versus time under different buried depths are shown in Figure 10.
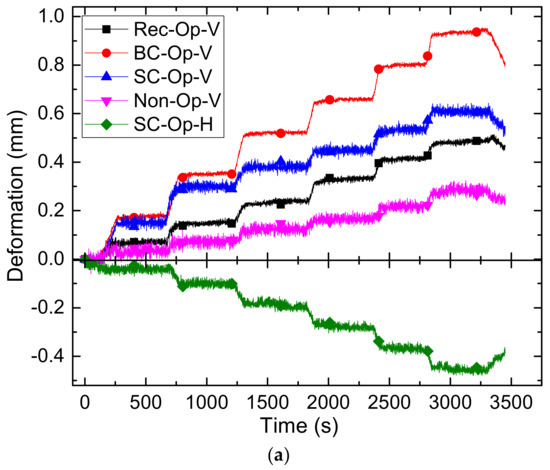
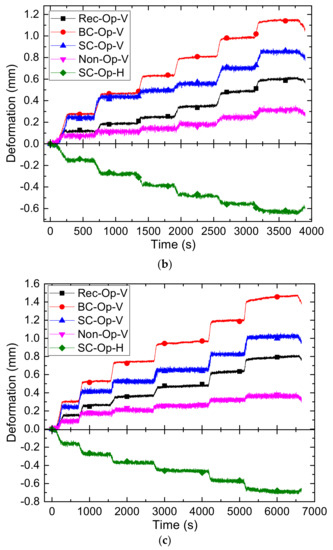
Figure 10.
Variations of deformations versus test time: (a) 1.0 D, (b) 1.5 D, (c) 2.0 D.
It can be found that the results of the deformations also showed obvious step variations versus test time, similar to the earth pressures, but stabilized faster. In addition, the fluctuations at the stable stages are greater, which may be induced by the sensor accuracy and the vibration of equipment during centrifuge operation. The average values of the displacements at each stable stage were calculated for analysis. The ratios of deformation to diameter versus the buried depth are plotted in Figure 11.
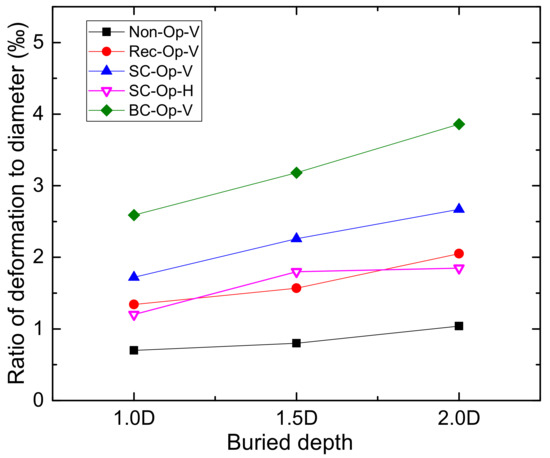
Figure 11.
Variations of the ratio of deformation to diameter versus buried depth.
It can be seen from Figure 11 that, the vertical deformations of the four sections increased approximately linearly with the increase of buried depth. The four sections, in descending order of the vertical deformations, are big circular opening, small circular opening, rectangular opening, and non-opening. Thus, the larger the opening size, the greater the vertical deformation of the tunnel. For the big circular opening, the vertical deformation ratio to the diameter reached 3.86‰ under the buried depth of 2.0 D, which almost reached the limit of 4‰, specified in Code for construction and acceptance of shield tunnelling method [28]. Therefore, when considering making a large opening in a shield tunnel, it is necessary to check the structural deformation and take necessary control measures to avoid exceeding the limit.
For the horizontal deformation of the small circular opening, it increased as the buried depth increased from 1.0 D to 1.5 D, but when the buried depth continued to increase from 1.5 D to 2.0 D, the increase was insignificant. The reason may be that as the laser sensor support is fixed on the invert of the tunnel when the elliptical deformation occurs, the horizontal displacement measuring point may not be located on the diameter line of the lining ring, resulting in the errors.
3.3. Dislocations between Rings
The results of the dislocations between rings close to the openings under 50 g acceleration of the three buried depths are summarized in Table 3. Noted that the listed results have been converted into the corresponding prototype dislocations through the similarity relationship. The dislocations versus the buried depth are plotted in Figure 12.
Table 3.
Dislocations between adjacent rings.
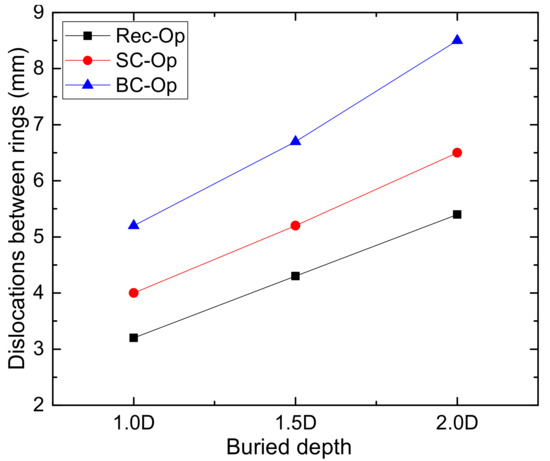
Figure 12.
Variations of the dislocations versus buried depth.
It can be found that the dislocations between rings of the three openings increased approximately linearly with the increase of buried depth. The dislocation close to the big circular opening was the greatest, followed by the small circular opening and rectangular opening. When the buried depth reached 2.0 D, the dislocations close to the three openings all exceeded 5 mm. In practical engineering, excessive locations between segments may cause waterproof failure, and may even lead to the inrush of soil and water, thus inducing structural instability. Therefore, attention should be paid to the dislocations during the construction of the cross passages, and reinforcement measures should be taken if necessary.
3.4. Structural Stress
There are three couples of strain gauges close to each opening, to investigate the stress state and influence range under different buried depths. As shown in Figure 7, the three couples of strain gauges were located at the hance of the semi-split ring, the first adjacent ring, and the second adjacent ring, denoted as R0, R1, and R2, respectively. For instance, the semi-split ring and the second adjacent ring of the small circular opening are denoted as SC-Op-R0 and SC-Op-R2.
The results of the inner and outer stress are plotted in Figure 13, where the positive stress values represent tensile stress and the negative values represent compressive stresses.
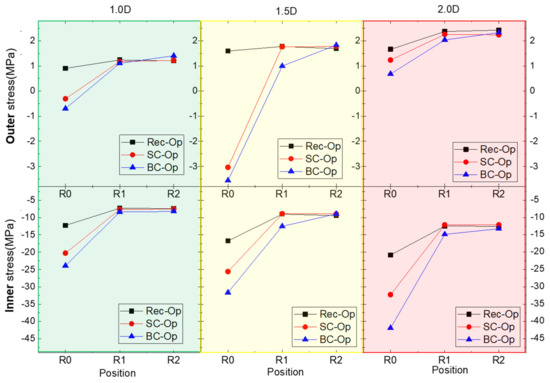
Figure 13.
Variations of the structural stress.
It can be found that the stresses at the inner surface are compressive, and increase with the buried depth. The inner stresses at the semi-split rings (R0) are much greater than those at the adjacent rings (R1, R2), which demonstrates that significant stress concentrations occurred at the semi-split rings. The inner compressive stresses at the semi-split ring of the big circular opening are 31.7 MPa and 41.9 MPa under the buried depths of 1.5 D and 2.0 D, respectively, which exceed the design compressive stress of C60 concrete of 27.5 MPa, meaning that the concrete segment may collapse. The inner compressive stress at the semi-split ring of the small circular opening is 32.3 MPa, also exceeding the limit strength. Thus, in practical engineering, higher-strength materials or other reinforcement measures should be adopted for segments around the openings to avoid the risk of structural damage or even instability due to stress concentration.
For the stresses of the outer surface, the variations are complex. For the adjacent rings (R1, R2) of the three openings, the stresses at the outer surface are positive, demonstrating the tensile state, and the tensile stresses increased slightly with the increase of the buried depth. For the semi-split rings (R0), on one hand, the tensile stresses may increase due to the increase of the buried depth; on the other hand, the concentration due to the opening may increase the compressive stresses, so the outer stresses do not vary linearly with the buried depth. However, it should be noted that the absolute values of the outer stress are much smaller than the inner stresses, so more attention should be paid to the inner stress.
4. Conclusions
Three centrifugal model tests have been conducted to investigate the mechanical characteristics of the mainline tunnel influenced by different types of lateral openings under different buried depths. There are three types of the opening, namely, rectangular opening, small circular opening, and big circular opening. External earth pressures, structural deformations, dislocations, and structural stresses were monitored during the tests. The main conclusions are as follows.
- (1)
- The vertical earth pressures on the tunnel vault demonstrated that the soil arching effect occurred in the overlying soil. The reduction coefficients of the actual pressure to the theoretical pressure were obtained for different buried depths, namely, 0.926, 0.796, and 0.74 for 1.0 D, 1.5 D, and 2.0 D, respectively, which can provide a reference for the structural design or theoretical analysis. The lateral pressure coefficients changed barely with the buried depth, which is because in the scaled model test, the lateral expansion displacement of the tunnel is limited, and the increase of the lateral passive earth pressures can be neglected.
- (2)
- The vertical deformation of the mainline tunnel increased with the size of the opening. For the big circular opening, the vertical deformation ratio to the diameter reached 3.86‰ under the buried depth of 2.0 D and 50 g acceleration, and may even exceed the limit (4‰) specified in the specification. Thus, temporary support methods should be adopted during the construction of the cross passages.
- (3)
- The dislocations between the semi-split ring and the adjacent rings also increased with the opening size. The dislocations close to the three openings all exceeded 5 mm when the buried depth reached 2.0 D. As excessive locations between segments may cause waterproof failure, the longitudinal connections should be enhanced in practical engineering to resist the trend of dislocations.
- (4)
- Significant stress concentration occurred close to the opening and was approximately limited in the opening rings. The larger the opening size, the more severe the stress concentration, and the greater the compressive stress at the inner surface. The inner compressive stresses at BC-Op-R0 are 31.7 MPa and 41.9 MPa under the buried depths of 1.5 D and 2.0 D, while 32.3 MPa at SC-Op-R0 under the buried depth of 2.0 D, which may exceed the limited strength of C60 concrete (27.5 MPa). Thus, higher-strength materials or other reinforcement measures should be adopted for segments around the openings.
In summary, the lateral openings on the shield tunnel will increase the stresses and deformations of the structure, and the larger the opening, the more unfavorable is the influence. Therefore, targeted measures should be taken, such as temporary support, longitudinal connections, and high-strength materials near the openings.
Author Contributions
Conceptualization, P.L. and D.Y.; methodology, P.L.; software, P.L.; validation, W.L. and D.J.; formal analysis, P.L.; investigation, P.L. and W.L.; resources, M.L.; data curation, P.L.; writing—original draft preparation, P.L.; writing—review and editing, W.L.; visualization, D.J.; supervision, D.Y.; project administration, M.L.; funding acquisition, D.Y. All authors have read and agreed to the published version of the manuscript.
Funding
This study was supported by the Key Project of High-speed Rail Joint Fund of National Natural Science Foundation of China under Grant No. U1834208.
Institutional Review Board Statement
Not applicable.
Informed Consent Statement
Not applicable.
Data Availability Statement
The data presented in this study are available from the corresponding author upon request.
Acknowledgments
The authors gratefully acknowledge financial support from the Key Project of High-speed Rail Joint Fund of National Natural Science Foundation of China under Grant No. U1834208.
Conflicts of Interest
The authors declare no conflict of interest.
References
- Yan, Q.X.; Chen, H.; Chen, W.Y.; Zhang, J.C.; Ma, S.Q.; Huang, X. Dynamic Characteristic and Fatigue Accumulative Damage of a Cross Shield Tunnel Structure under Vibration Load. Shock Vib. 2018, 2018, 9525680. [Google Scholar] [CrossRef] [Green Version]
- Sun, J.C.; Zhang, H.; Peng, T.; Xiao, C.L. Research on Construction Mechanical Behaviour of Connecting Aisle in Shield Tunnel. IOP Conf. Ser. Earth Environ. Sci. 2018, 167, 012041. [Google Scholar] [CrossRef]
- Zhang, M.H.; Wan, H.; Yang, Y.J.; Mao, Y.F.; Li, W.; Shen, P.; Luo, Q.F. Construction technology of the freezing method for the connecting-passage in the subway. IOP Conf. Ser. Earth Environ. Sci. 2019, 384, 012090. [Google Scholar] [CrossRef]
- Chen, B.G. The numerical analysis of the cross passage of large diameter shield tunnel beneath the river. IOP Conf. Ser. Mater. Sci. Eng. 2020, 741, 012047. [Google Scholar] [CrossRef] [Green Version]
- Zhan, Z.X.; Cui, Z.D.; Yang, P.; Zhang, T. In situ monitoring of temperature and deformation fields of a tunnel cross passage in Changzhou Metro constructed by AGF. Arab. J. Geosci. 2020, 13, 310. [Google Scholar] [CrossRef]
- Mayer, P.M.; Frodl, S.; Friedeman, W.; Jouaux, R. Innovative solutions for driving cross passages in bored tunnels with segmental lining. Geomech. Tunn. 2010, 3, 295–307. [Google Scholar] [CrossRef]
- Han, L.; Ye, G.L.; Li, Y.H.; Xia, X.H.; Wang, J.H. In-situ monitoring of frost heave pressure during cross passage construction using ground freezing method. Can. Geotech. J. 2016, 53, 530–539. [Google Scholar] [CrossRef] [Green Version]
- Li, Z.L.; Soga, K.; Wright, P. Three-dimensional finite element analysis of the behaviour of cross passage between cast-iron tunnels. Can. Geotech. J. 2015, 53, 930–945. [Google Scholar] [CrossRef] [Green Version]
- Atzl, G.; Soranzo, E.; Mihaylov, V.; Hochgatterer, B. Special segments at the cross passages in the Filder Tunnel—Interpretation of the data from monitoring segments. Geomech. Tunn. 2017, 10, 160–176. [Google Scholar] [CrossRef]
- Strauss, A.; Papakonstantinou, S. Cross passages in soil—ground freezing, segment application, excavation and displacement monitoring for segmental lining. Geomech. Tunn. 2013, 6, 494–499. [Google Scholar] [CrossRef]
- Schwob, A.; Cagnat, E.; Chen, S.; Chan, A.W.Y.; Wai, C.N.C. Tuen mun—chek lap kok link: An outstanding sub-sea tunnel project in Hong Kong. Proc. Inst. Civ. Eng.-Civ. Eng. 2019, 173, 33–40. [Google Scholar] [CrossRef]
- Zhu, Y.H.; Gao, Y.M.; Dong, Z.B.; Liu, X. Field test on structural mechanism of T-connected shield tunnel: A case study of connecting passage on Ningbo Metro Line No. 3. Tunn. Constr. 2019, 39, 1759–1768. (In Chinese) [Google Scholar] [CrossRef]
- Liang, R.Z.; Xia, T.D.; Huang, M.S.; Lin, C.G. Simplified analytical method for evaluating the effects of adjacent excavation on shield tunnel considering the shearing effect. Comput. Geotech. 2017, 81, 167–187. [Google Scholar] [CrossRef]
- Lei, M.F.; Lin, D.Y.; Shi, C.H.; Yang, W.C. A structural calculation model of shield tunnel segment: Heterogeneous equivalent beam model. Adv. Civ. Eng. 2018, 2018, 9637838. [Google Scholar] [CrossRef] [Green Version]
- Liu, B.; Yu, Z.W.; Han, Y.H.; Wang, Z.L.; Zhang, R.H.; Wang, S.J. Analytical solution for the response of an existing tunnel induced by above-crossing shield tunneling. Comput. Geotech. 2020, 124, 103624. [Google Scholar] [CrossRef]
- Spyridis, P.; Bergmeister, K. Analysis of lateral openings in tunnel linings. Tunn. Undergr. Space Technol. 2015, 50, 376–395. [Google Scholar] [CrossRef]
- Tan, Z.S.; Li, Z.L.; Tang, W.; Chen, X.Y.; Duan, J.M. Research on stress characteristics of segment structure during the construction of the large-diameter shield tunnel and cross-passage. Symmetry 2020, 12, 1246. [Google Scholar] [CrossRef]
- Zheng, G.; Cui, T.; Cheng, X.S.; Diao, Y.; Zhang, T.Q.; Sun, J.B.; Ge, L.B. Study of the collapse mechanism of shield tunnels due to the failure of segments in sandy ground. Eng. Fail. Anal. 2017, 79, 464–490. [Google Scholar] [CrossRef]
- Li, X.J.; Zhou, X.Z.; Hong, B.C.; Zhu, H.H. Experimental and analytical study on longitudinal bending behavior of shield tunnel subjected to longitudinal axial forces. Tunn. Undergr. Space Technol. 2019, 86, 128–137. [Google Scholar] [CrossRef]
- Wang, S.M.; Wang, X.M.; Chen, B.; Fu, Y.B.; Jian, Y.Q.; Lu, X.X. Critical state analysis of instability of shield tunnel segment lining. Tunn. Undergr. Space Technol. 2020, 96, 103180. [Google Scholar] [CrossRef]
- Yang, Y.S.; Yu, H.T.; Yuan, Y.; Sun, J. 1 g Shaking table test of segmental tunnel in sand under near-fault motions. Tunn. Undergr. Space Technol. 2021, 115, 104080. [Google Scholar] [CrossRef]
- Do, N.A.; Dias, D.; Oreste, P.; Djeran-Maigre, I. 2d numerical investigation of segmental tunnel lining behavior. Tunn. Undergr. Space Technol. 2013, 37, 115–127. [Google Scholar] [CrossRef]
- Feng, K.; He, C.; Qiu, Y.; Zhang, L.; Wang, W.; Xie, H.M.; Zhang, Y.; Cao, S. Full-scale tests on bending behavior of segmental joints for large underwater shield tunnels. Tunn. Undergr. Space Technol. 2018, 75, 100–116. [Google Scholar] [CrossRef]
- Wang, Z.; Wang, L.Z.; Li, L.L.; Wang, J.C. Failure mechanism of tunnel lining joints and bolts with uneven longitudinal ground settlement. Tunn. Undergr. Space Technol. 2014, 40, 300–308. [Google Scholar] [CrossRef]
- Liu, X.; Feng, K.; He, C.; Zhao, L.X. Prototype test of the mechanical behavior and failure mechanism of segment structure with distributed mortises and tenons. Struct Concr. 2021, 1–15. (In Chinese) [Google Scholar] [CrossRef]
- Zhou, H.Y.; Li, L.X.; Chen, T.G. An approach to determine the stiffness reduction factor of tunnel lining. Adv. Mater. Res. 2011, 243–249, 3659–3662. [Google Scholar] [CrossRef]
- Garnier, J.; Gaudin, C.; Springman, S.M.; Culligan, P.J.; Goodings, D.; Konig, D.; Kutter, B.; Phillips, R.; Randolph, M.F.; Thorel, L. Catalogue of scaling laws and similitude questions in geotechnical centrifuge modelling. Int. J. Phys. Model. Geotech. 2007, 7, 01–23. [Google Scholar] [CrossRef]
- Ministry of Housing and Urban-Rural Construction of the People’s Republic of China. Code for Construction and Acceptance of Shield Tunnelling Method (GB 500446-2008); China Architecture & Building Press: Beijing, China, 2008. (In Chinese) [Google Scholar]
Publisher’s Note: MDPI stays neutral with regard to jurisdictional claims in published maps and institutional affiliations. |
© 2022 by the authors. Licensee MDPI, Basel, Switzerland. This article is an open access article distributed under the terms and conditions of the Creative Commons Attribution (CC BY) license (https://creativecommons.org/licenses/by/4.0/).