Abstract
The unwanted horse problem is the most serious issue confronting the equestrian industry. Thus, it is recommended that retired racehorses switch to become saddle horses for ‘the second life of a racing veteran’ because training and using retired Thoroughbred racehorses as saddle horses is the most cost-effective option. The current study aimed to analyze the effects of saddle horse conversion training on gaits of retired Thoroughbred racehorses. Our study included 12 retired Thoroughbred racehorses. These Thoroughbred racehorses performed the retraining 20–50 min a day, five times per week for three months. There are some critical findings in this study. The results show that the decreased stride length of each foot decreased the displacements of the center of mass and the center of the head. In addition, after retraining, there was a significant decrease in the head–neck angle and displacement between the center of the head and the center of the neck. These changes in the horse’s movements mean that the habitual movements for racing are gradually changed to optimal movements for a saddle horse.
1. Introduction
The Thoroughbred was developed in the 17th century as a result of the enthusiasm of the British aristocracy for racing and has been selectively developed for athletic traits that permit improved racecourse performance in particular types of races during the breed’s development over its 300-year history [1]. According to the 2017 Economic Impact of the United States Horse Industry report, approximately 1.2 million horses are involved in the racing industry, with Thoroughbred horses making up the highest number, with over 500,000 [2]. The Thoroughbred is the most valuable horse breed in the world and has historically been chosen for human domestication and use due to its agility, stamina, and speed [3]. However, thousands of Thoroughbred horses retire from racing due to musculoskeletal injuries, respiratory or cardiac conditions, and behavioral problems and move on to a second career that has nothing to do with racing [4,5]. In the case of Korean Thoroughbred horses, about 1500 racehorses are retired each year. Among them, 527 horses (35.6%) are culled due to disease; 526 horses (35.5%) are converted to saddle horses; 166 horses (11.2%) are used for breeding; 143 horses (9.75%) are put out to pasture, and 83 horses (2.6%) are converted for other purposes [6]. Therefore, it is recommended that Thoroughbred racehorses switch to saddle horses after retirement for ‘the second life of a racing veteran’ because the methods of training and using retired racehorses as saddle horses are the most sustainable in terms of cost and can respond to the demand for saddle horses in a short period [7]. In Korea, the BRT (Best Retired Thoroughbred) competition was started for the first time in 2017. The competition has been held continuously under the name of ‘Evaluation of Stability and Capability in Retired Racing Horse.’ The competition aims to convert racehorses trained for sprinting into saddle horses that ordinary people can safely use, and the stability of a saddle horse is evaluated [8].
There has been much research conducted on horse physiology and the impact of training on muscles, as well as the effects of training on the respiratory and cardiovascular systems and blood chemistry [9,10,11]. Despite the fact that one of the goals of training should be to improve biomechanical properties, there have been few studies on the effects of training on gait in horses, and there is still no universal and objective method for assessing the mechanical adaptation of gait in response to training [12]. Van Weeren at al. [13] studied the kinematics of the Standardbred trotter at various speeds before and after a 5-month prerace training period. It showed that the maximum elbow and fore fetlock flexion and the maximum carpal and hind fetlock extension were significantly changed after the training. Corley and Goodship [12] studied how an 8-week, high-intensity treadmill training affected some parameters of the Canter in Thoroughbred fillies. They discovered that the range of motion of the carpal and fetlock joints and the carpal angle increased, while the stance phase duration was shortened by 8–20 percent after eight weeks of training. Drevemo et al. [14] investigated the repeatability of specific gait characteristics in Standardbred trotters before and after three years of training; the stride length, the stride duration, and the swing phase all increased after racing training. These gait parameter changes appear in preparing to race for maximum speed. Likewise, retraining must tame the racehorse to convert it to a saddle horse. In particular, this is because the saddle horse needs to be ridden by people who have never received riding training, so the character of a racehorse must be eliminated, and retransformation through retraining must be confirmed.
Moreover, documentation of gait changes in horses in certain training may help to rate the horse’s performance potential against a valid timetable. However, there are no studies or data on the effect of retraining to become a saddle horse on the gait of retired racehorses to date. Therefore, the purpose of this study was to biomechanically examine the effects of 12-week saddle horse conversion training on Thoroughbred gait. The research questions were: (1) How would the saddle horse conversion training change the stride during Walk and Canter? (2) How would the saddle horse conversion training change the displacement and velocity of the center of mass during the Walk and Canter? (3) How would the saddle horse conversion training change the displacement between the center of the head and the center of the neck during the Walk and Canter? It was hypothesized that the saddle horse conversion training would affect the angular, temporal, and spatial parameters of the horse’s gait.
2. Methods
2.1. Subjects
The research subjects were selected from 18 retired racing Thoroughbreds. The reason for the retirement was that they did not achieve excellent results during racing, and all horses were retired within six months from the start of the first gait analysis. A veterinarian inspection was performed prior to the study. In addition, six horses that could not be ridden due to safety issues or did not implement accurate footwork due to injuries or lameness were excluded. Therefore, a study was conducted with a total of twelve horses. Twelve horses were calculated via an a priori power analysis to provide 95% power with an effect size of approximately 1 at α = 0.05 to detect differences. The data used for the estimates were the results of stride lengths reported in a study that was performed by Cano et al. on the influence of training in Trotting Andalusian horses [11]. The gender composition of the Thoroughbred racehorses is six geldings and six mares, the age is 3–5-years-old, the weight is 350–450 Kg, and the height is 165–168 cm. The management of veteran racehorse breeds is based on 3 ± 1 Kg/day of concentrated feed (2 feedings, one in the morning and one in the evening, 2~4 Kg) and 9 ± 3 Kg/day of hay (3 feedings, one in the morning, one at lunch, and one at dinner 6~12 Kg). The trainer could control this according to the condition of the horse.
2.2. The Saddle Horse Conversion Training
The most important part of a racehorse’s performance is speed, and for a saddle horse, stability and accurate gait implementation and changing the gait are the most critical parts. So, the retraining content focused on the desensitization of horses so that riders could ride safely because racehorses are mainly trained for gallops. However, saddle horses are trained to transition with various steps using Walk, Trot, and Canter. The saddle horse conversion program aimed to improve the welfare of racehorses and provide a safe basis for the supply of horses by developing and distributing a practical model for converting Thoroughbred riding horses to the private sector. The goals of the saddle horse conversion are as follows. First, the planar muscle, which is the upper head muscle, was trained so that it became 50:50 with the lower muscle, the sternocleidomastoid muscle. Second, the horse’s center of gravity was shifted to its hind legs so that it was trained as a horse capable of propulsion rhythmically within 2.5 m of one foot. The training program consisted of 20–50 min per day, five days per week, and 12 weeks. The detailed program for this was composed of three experts, including university professors with more than 15 years of riding and training experience. Table 1 shows the training completion goals for each week.

Table 1.
Training goals for each week.
2.3. Instrumentation
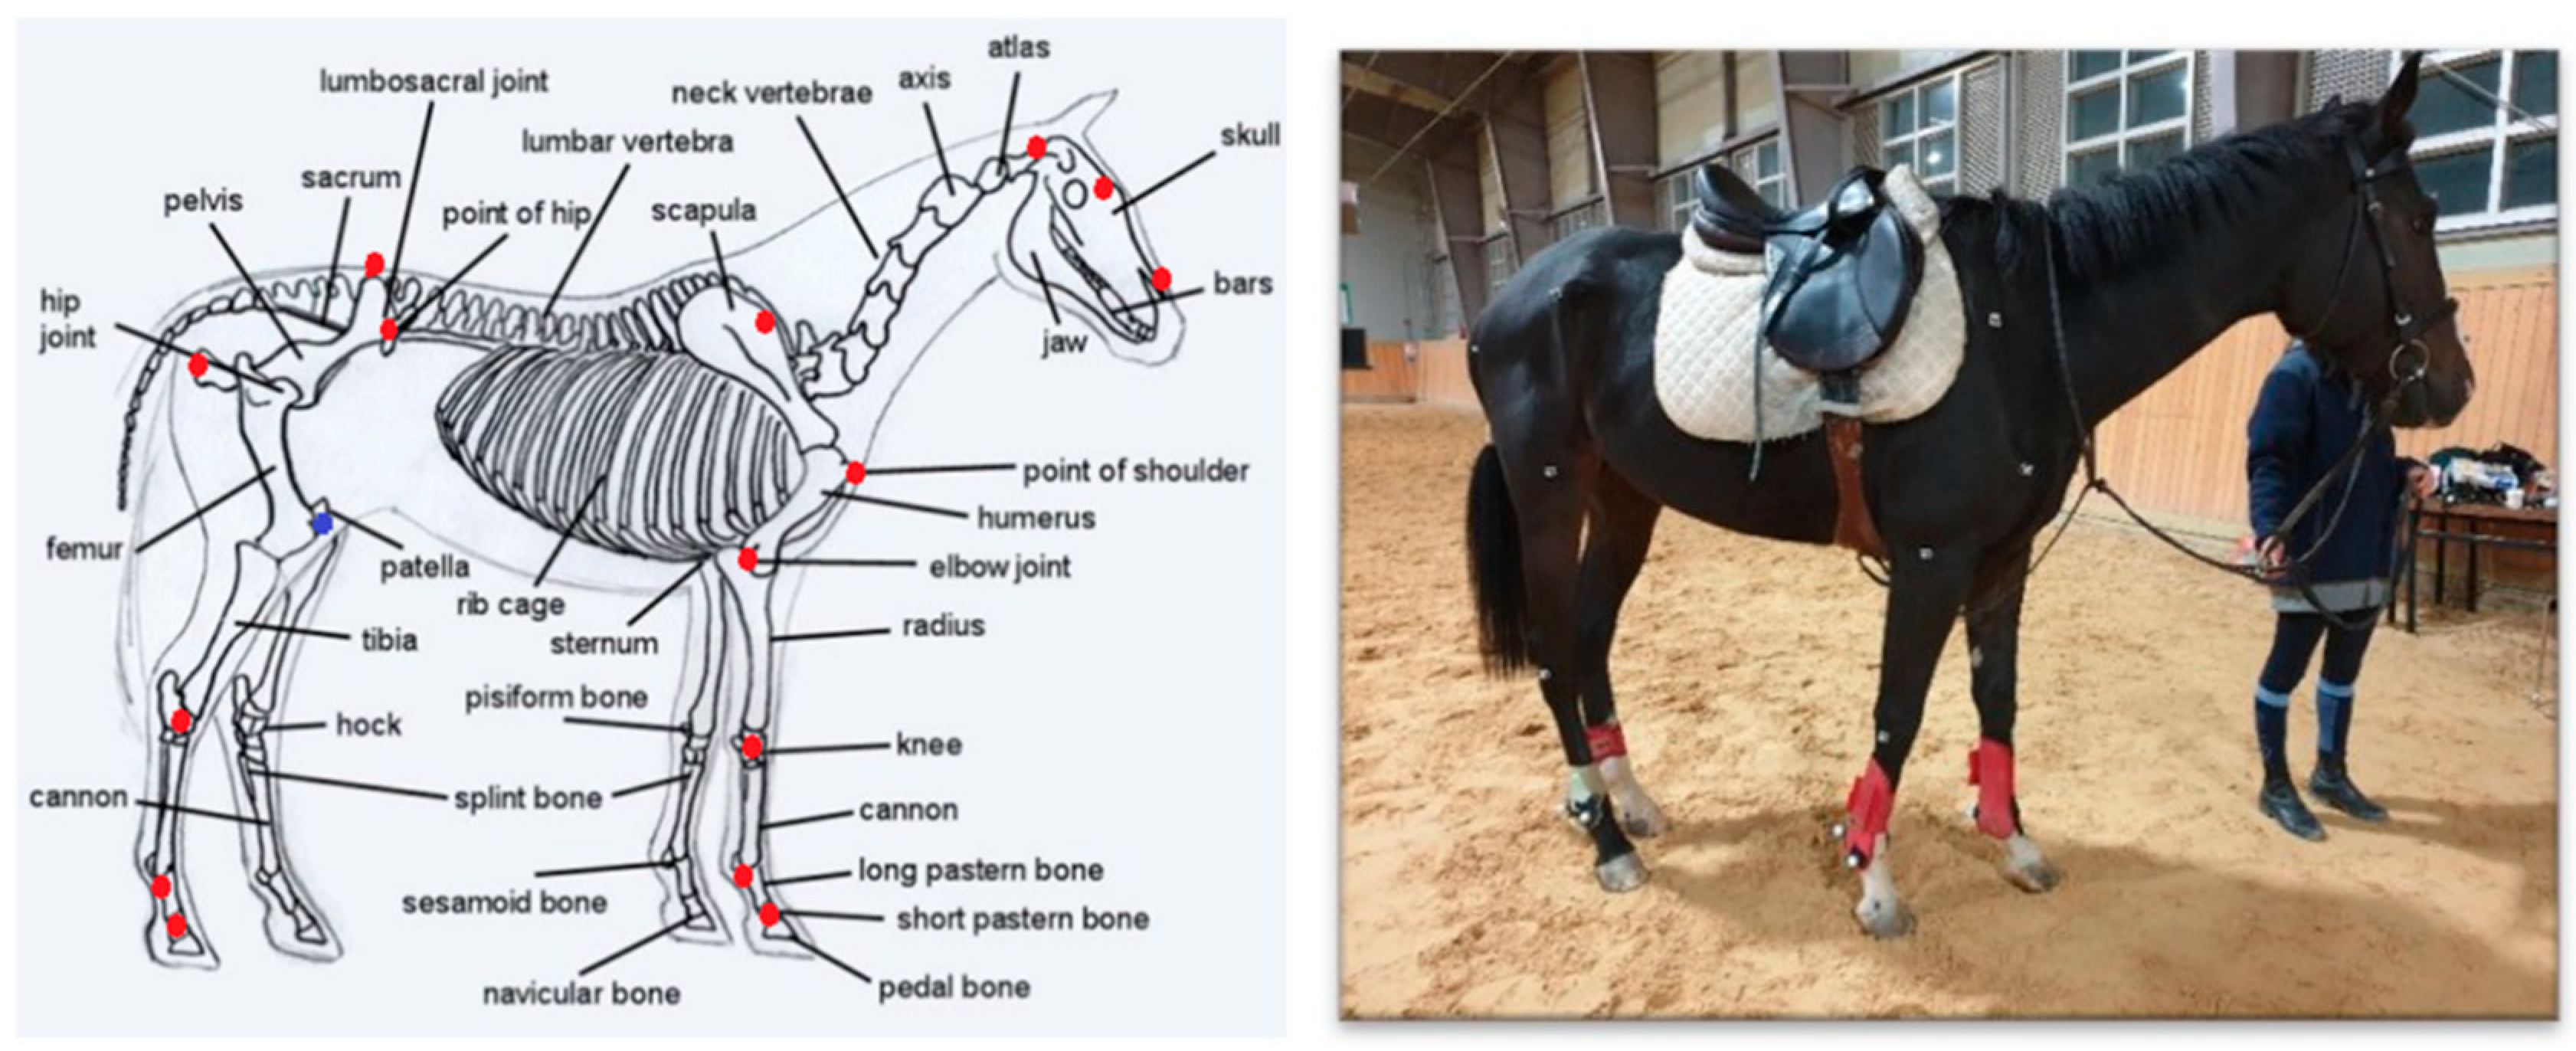
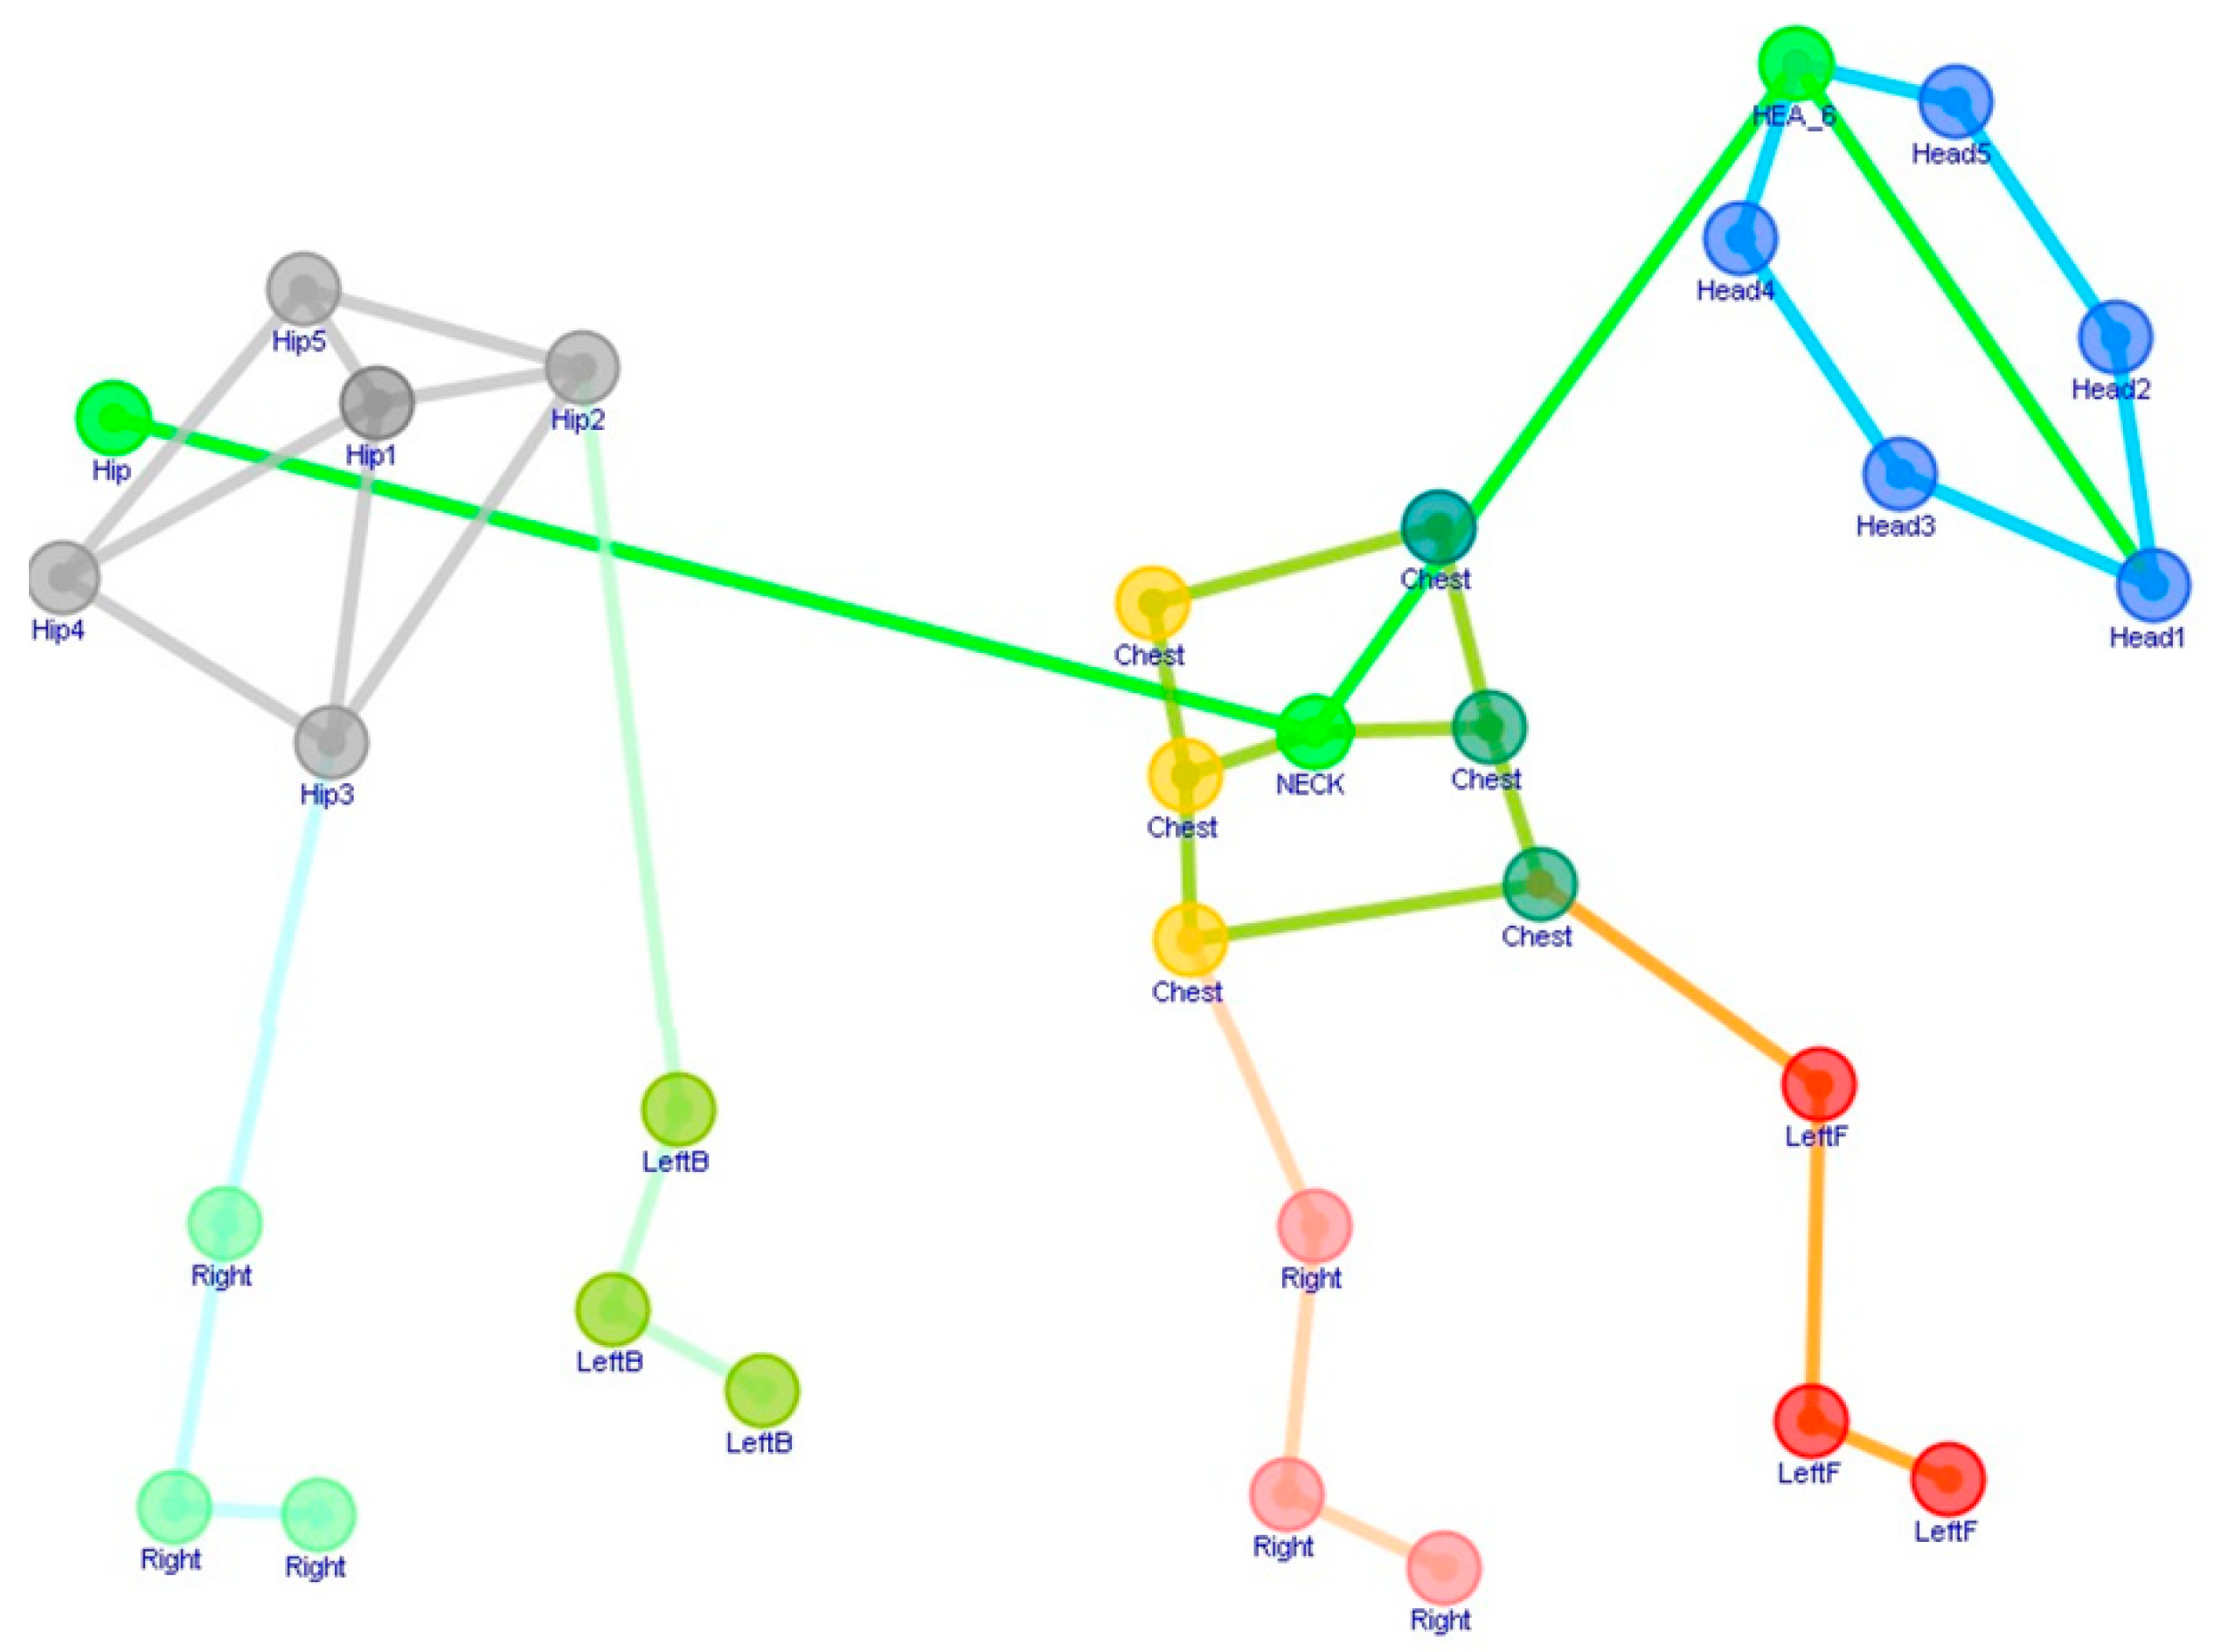
An MX-13 Vicon™ motion capture system (Vicon, Ltd., Oxford, UK), including twelve high-speed cameras (Sampling frequency: 200 Hz) and MX control interfaces, was used to record the locations of the reflective markers on the horses’ bodies. The 28 retro-reflective markers were placed at the following anatomical locations (Figure 1): the end part of nasal bone (Head1); left part between eyes (Head2); right part between eyes (Head3); right cranium (Head4); left cranium (Head5); middle of right scapula (Chest1); middle of left scapula (Chest2); head of left humerous (Chest3); head of right humerous (Chest4); right elbow joint (Chest5); left elbow joint (Chest6); top and intersection of R/L pelvis (Hip1); left point of hip (Hip2); right point of hip (Hip3); right side of right ischium (Hip4); left side of left ischium (Hip5); lateral of left carpus (LeftFrontFoot1); posterior of left and front sesamoid(fetlock) bone (LeftFrontFoot2); lateral and middle of left and front long pastern bone (LeftFrontFoot3); lateral of right carpus (RightFrontFoot1); posterior of right and front sesamoid(fetlock) bone (RightFrontFoot2); lateral and middle of right long pastern bone (RightFrontFoot3); lateral of left tarsus (LeftBackFoot1); posterior of left and hind sesamoid(fetlock) bone (LeftBackFoot2); lateral and middle of left long pastern bone (LeftBackFoot3); lateral of right tarsus (RightBackFoot1); posterior of right and hind sesamoid(fetlock) bone (RightBackFoot2); and lateral and middle of right long pastern bone (RightBackFoot3). In addition, three virtual markers calculated using retroreflective markers are as follows: middle of Head4 and Head5 (HEA_6); middle of Chest3 and Chest4 (NECK); and middle of Hip4 and Hip5 (Hip). The marker coordinates were used to model the body with a combination of several rigid segments connected by frictionless joints as shown in Figure 1.

Figure 1.
Reflective markers.
2.4. Experimental Procedure
The horse’s gaits, such as Walk and Canter, were motion-captured before and after the saddle horse conversion training. The rider only guided the horse to the route of motion capture, allowing the horse to Walk and Canter. Only one rider participated in the experiment because the gait could be changed depending on the rider’s ability to control the horse. For saddle fitment, a saddle fit expert, who is a professor of the equestrian department, fitted the saddles for all participating horses. Also, sufficient preparation time was provided to the riders before the start of motion capture, and the data collection was started based on the rider’s judgment that the horse was stable and it was easy to enter the route. Walk and Canter were performed twice each as shown in Figure 2, and the results were analyzed.
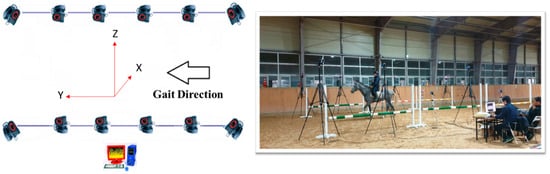
Figure 2.
Experimental setting and global coordinate system.
2.5. Data Reduction and Analysis
For the data analysis, the following meaningful events were defined for Walk and Canter: E1 (the moment the right hind foot contacts the ground), E2 (the moment the right front foot contacts the ground), E3 (the moment the left hind foot contacts the ground), E4 (the moment the left front foot contacts the ground), E5 (the moment the right hind foot contacts the ground), E6 (the moment the right front foot contacts the ground), E7 (the moment the left hind foot contacts the ground), and E8 (the moment the left front foot contacts the ground). In addition, seven phases were defined based on the events: P1 (E1–E2), P2 (E2–E3), P3 (E3–E4), P4 (E4–E5), P5 (E5–E6), and P7 (E7–E8).
Motion capture data were digitized to track reflective markers with the Kwon3D software. The three-dimensional coordinates of the reflective markers were generated via a DLT algorithm [15] and were smoothed using an 8 Hz low-pass fourth-order Butterworth filter. In this global coordinate system, the y-axis is the forward-moving direction of the horse; the x-axis is the left–right lateral direction, and the z-axis is the vertically upward direction. The kinematic variables were the duration of the phases of gaits, head–neck angles, and center of mass displacement. The duration of the phases of the gait variables was analyzed from the first event (E1) to each event and the total time. The duration of the phases of each gait variable was calculated using the following formula:
where t(i~f) = the time required, Ff = the frame number of each event ends, and Fi = the frame number of each event start. Additionally, the angular variable was the head–neck angle (A) and head–y-axis angle (B). The angle between two adjacent segments was obtained by using the dot product of the vector. That is, the angle θ between two vectors U (Xi, Yi, Zi) and V (Xj, Yj, Zj) was calculated using the following formula:
The head-neck angle is shown in Figure 3.
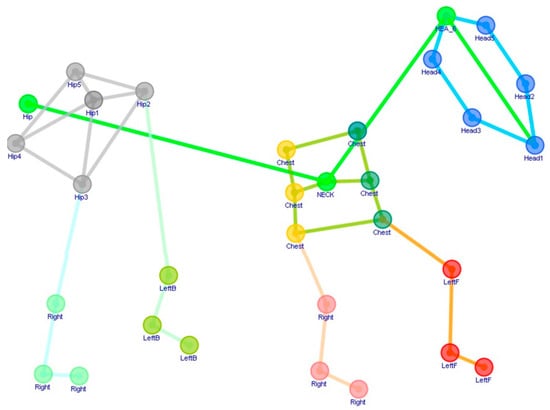
Figure 3.
Head–neck angle.
The linear velocity variable was the body center velocity and head center velocity. The velocity was first calculated for each of the X, Y, and Z components using the following equation, and the X, Y, and Z components were synthesized to obtain the resultant velocity:
where Xi−1: i − first X coordinates, Xi+1: i + first X coordinates, and Xi: ith X component velocity; and
where V: ith resultant velocity, : ith X component’s velocity, : ith Y component’s velocity, and : ith Z component’s velocity. The following formula calculated the center of mass coordinate (Ci) of Segment i :
where pi: the ratio of the center of mass displacement from the proximal end to the segment length, and Pi, Di: coordinates of segmental proximal and distal ends. The following formula calculated the location of the center of mass:
ci = (1 − pi)·Pi + pi·Di
mi: mass of the segment, and M: whole body mass
The video data collected by 12 cameras were labeled with each marker in the NEXUS program of VICON, and C3D files were extracted for each trial from the pipeline. After calculating raw data using C3D files in Kwon3D, values for each event, mean value, and standard deviation were calculated using Microsoft’s Excel program. Finally, the paired t-test was performed with the SPSS ver.18.0 program for statistical processing. A Shapiro–Wilk analysis of the data was completed for the normality test to determine if the assumption of normality had been met.
3. Results
3.1. The Stride Lengths
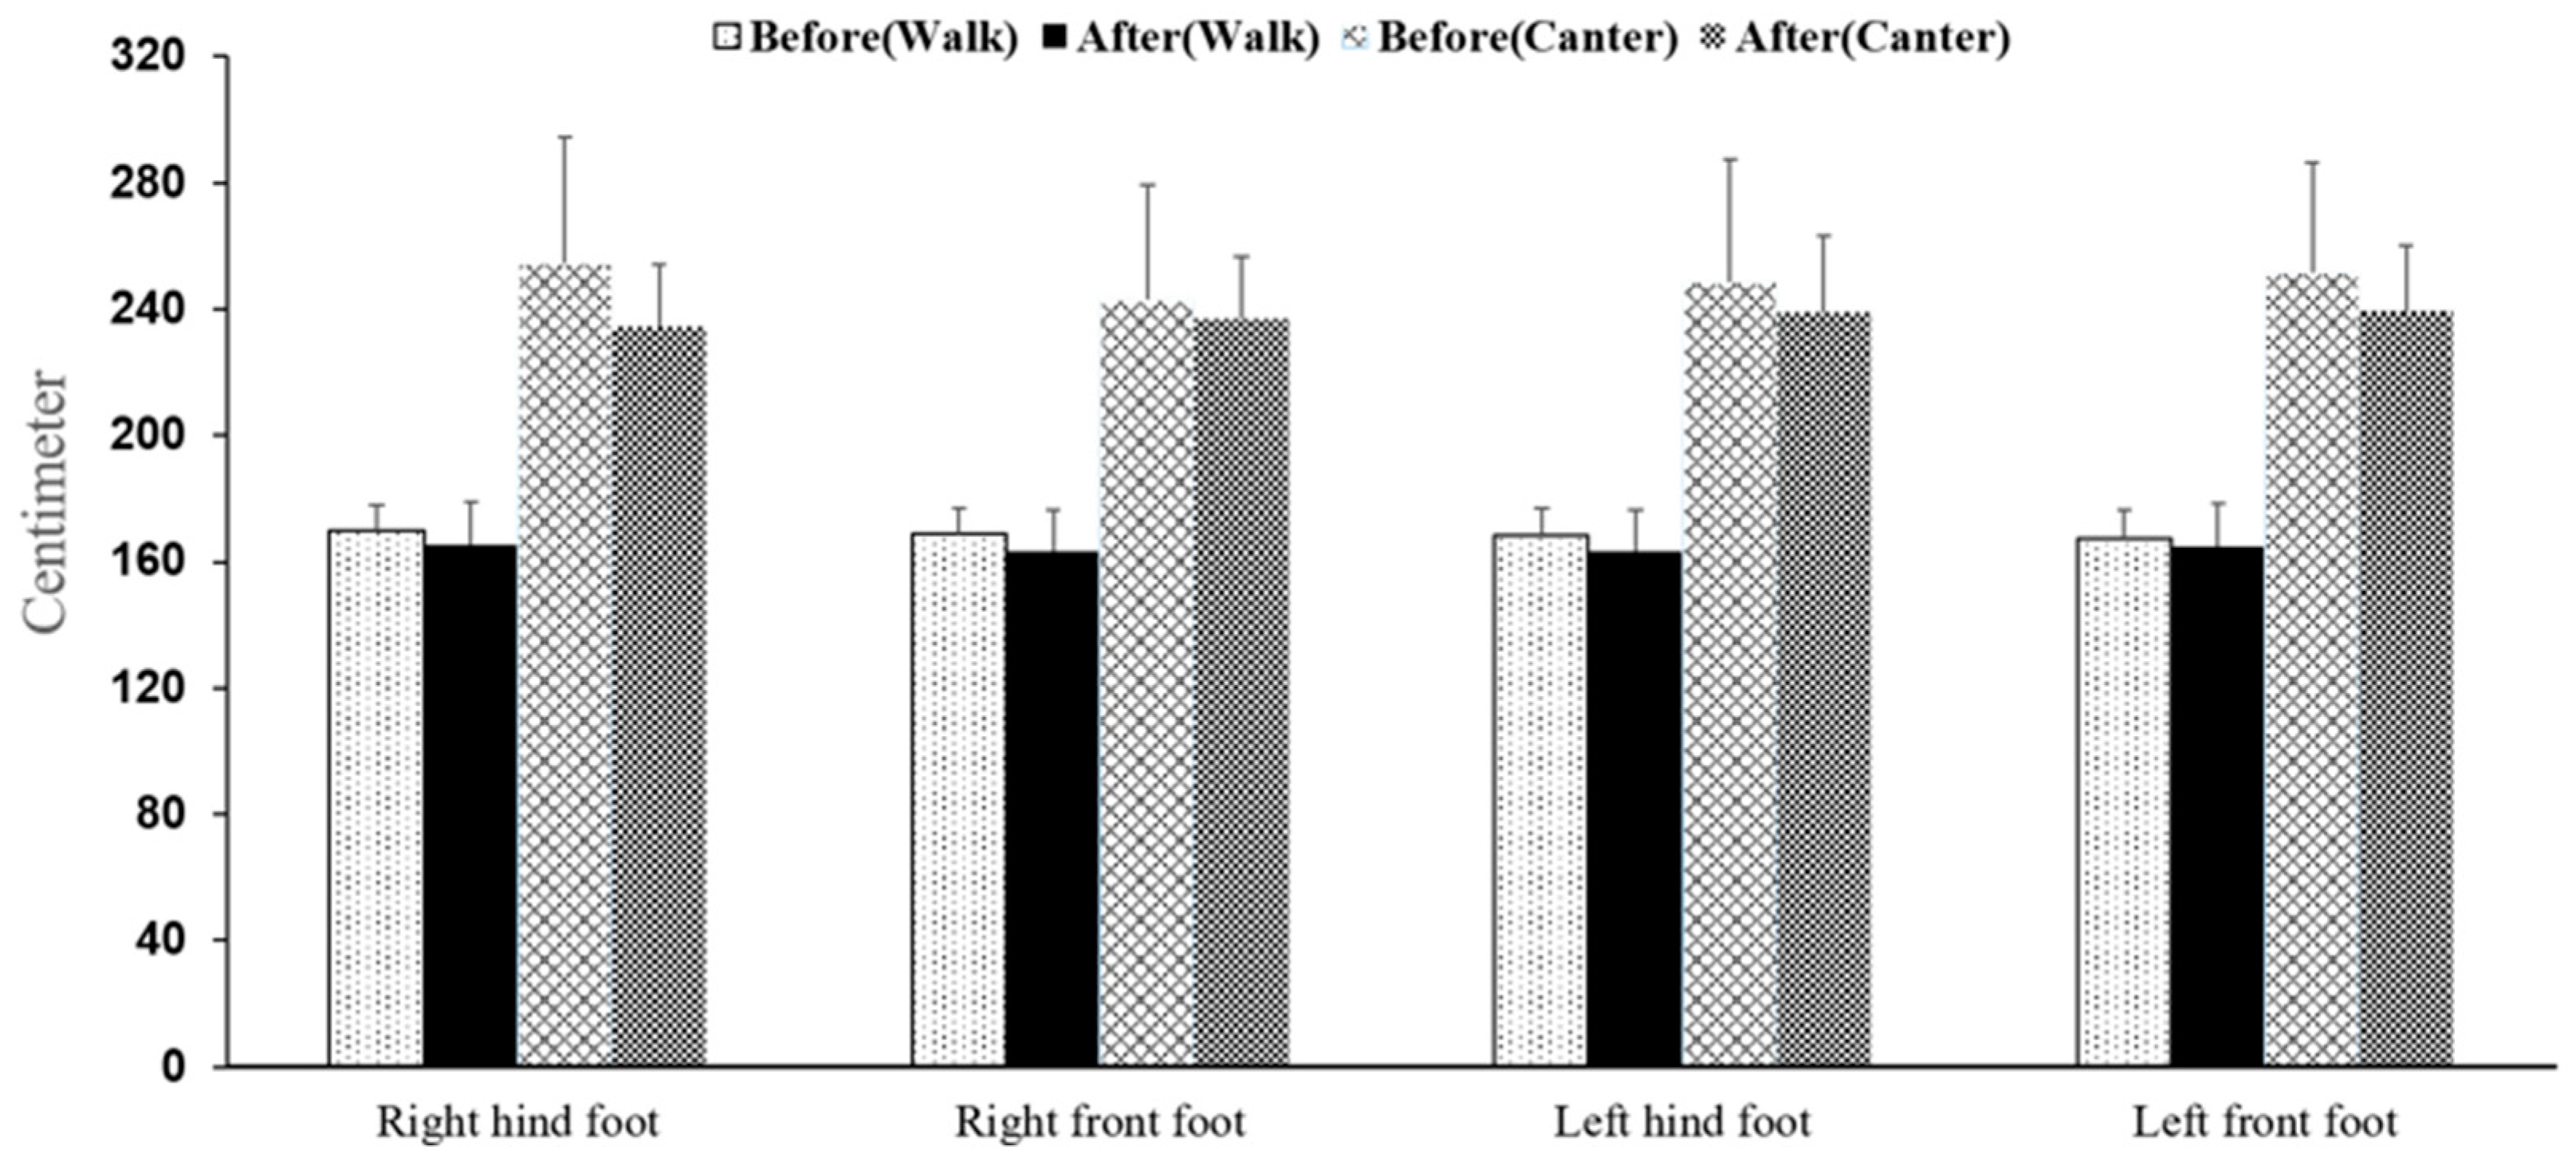
Figure 4 shows the stride lengths of each foot during Walk and Canter. All stride lengths of Walk and Canter decreased after the saddle horse conversion training. However, there were no statistical differences in stride lengths before and after the saddle horse conversion training.
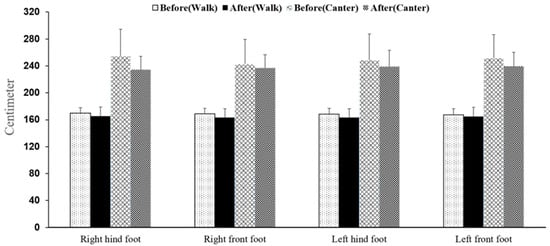
Figure 4.
Stride lengths.
3.2. Displacements of the Center of Mass and Center of the Head
To analyze the center of mass and center of head displacements, the displacements between the minimum and maximum values of the left and right (x-axis) of the center of mass and head, the displacements between the minimum and maximum values of the forward and backward (y-axis) of the center of mass and head, and the average values of the vertical displacements (z-axis) were obtained. There were statistically significant decreases in the lateral displacements (x-axis) of the center of mass between before and after in Walk (before: 0.33 ± 0.20 m, after: 0.23 ± 0.15 m, p = 0.016) and Canter (before: 0.22 ± 0.13 m, after: 0.12 ± 0.05 m, p = 0.023). There were also statistically significant reductions in the lateral displacements (x-axis) of the center of the head between before and after in Walk (before: 0.32 ± 0.14, after: 0.26 ± 0.16 m, p = 0.043) and Canter (before: 0.29 ± 0.19 m, after: 0.15 ± 0.08 m, p = 0.027) and in forward and backward (y-axis) of the center of the head between before and after in Canter (before: 3.74 ± 0.46 m, after: 3.48 ± 0.32 m, p = 0.008) as shown in Table 2.
Table 2.
Displacements of the center of mass and the center of the head. Unit: cm.
3.3. The Center of Mass and the Center of Head Velocities
As shown in Table 3, the center of mass and the center of head velocities were decreased in Walk and Canter after retraining, although there were no statistical differences.
Table 3.
The center of mass and the center of head velocities. Unit: m/s.
3.4. Head–Neck Angles
As shown in Table 4, there were statistically significant decreases in the head–neck angles between before and after the saddle horse conversion training in all events of Walk and in E2, E3, E5, and E6 of Canter. In Walk, the head–neck angle started at 75.54°, increased until E2, began to decrease until E3, and then increased in E4. In this way, it went up and down at every event until the last event. As a result, the average head–neck angle in Walk was 76.98 degrees. In addition, it was found that the head–neck angles decreased after retraining in all events of Walk and Canter. In Canter, the head–neck angle, which started at 66.65 degrees, gradually increased until E7, and Canter’s overall average head–neck angle was 68.65 degrees.
Table 4.
Head–neck angles. Unit: degrees.
3.5. The Displacement between the Center of the Head and the Center of the Neck
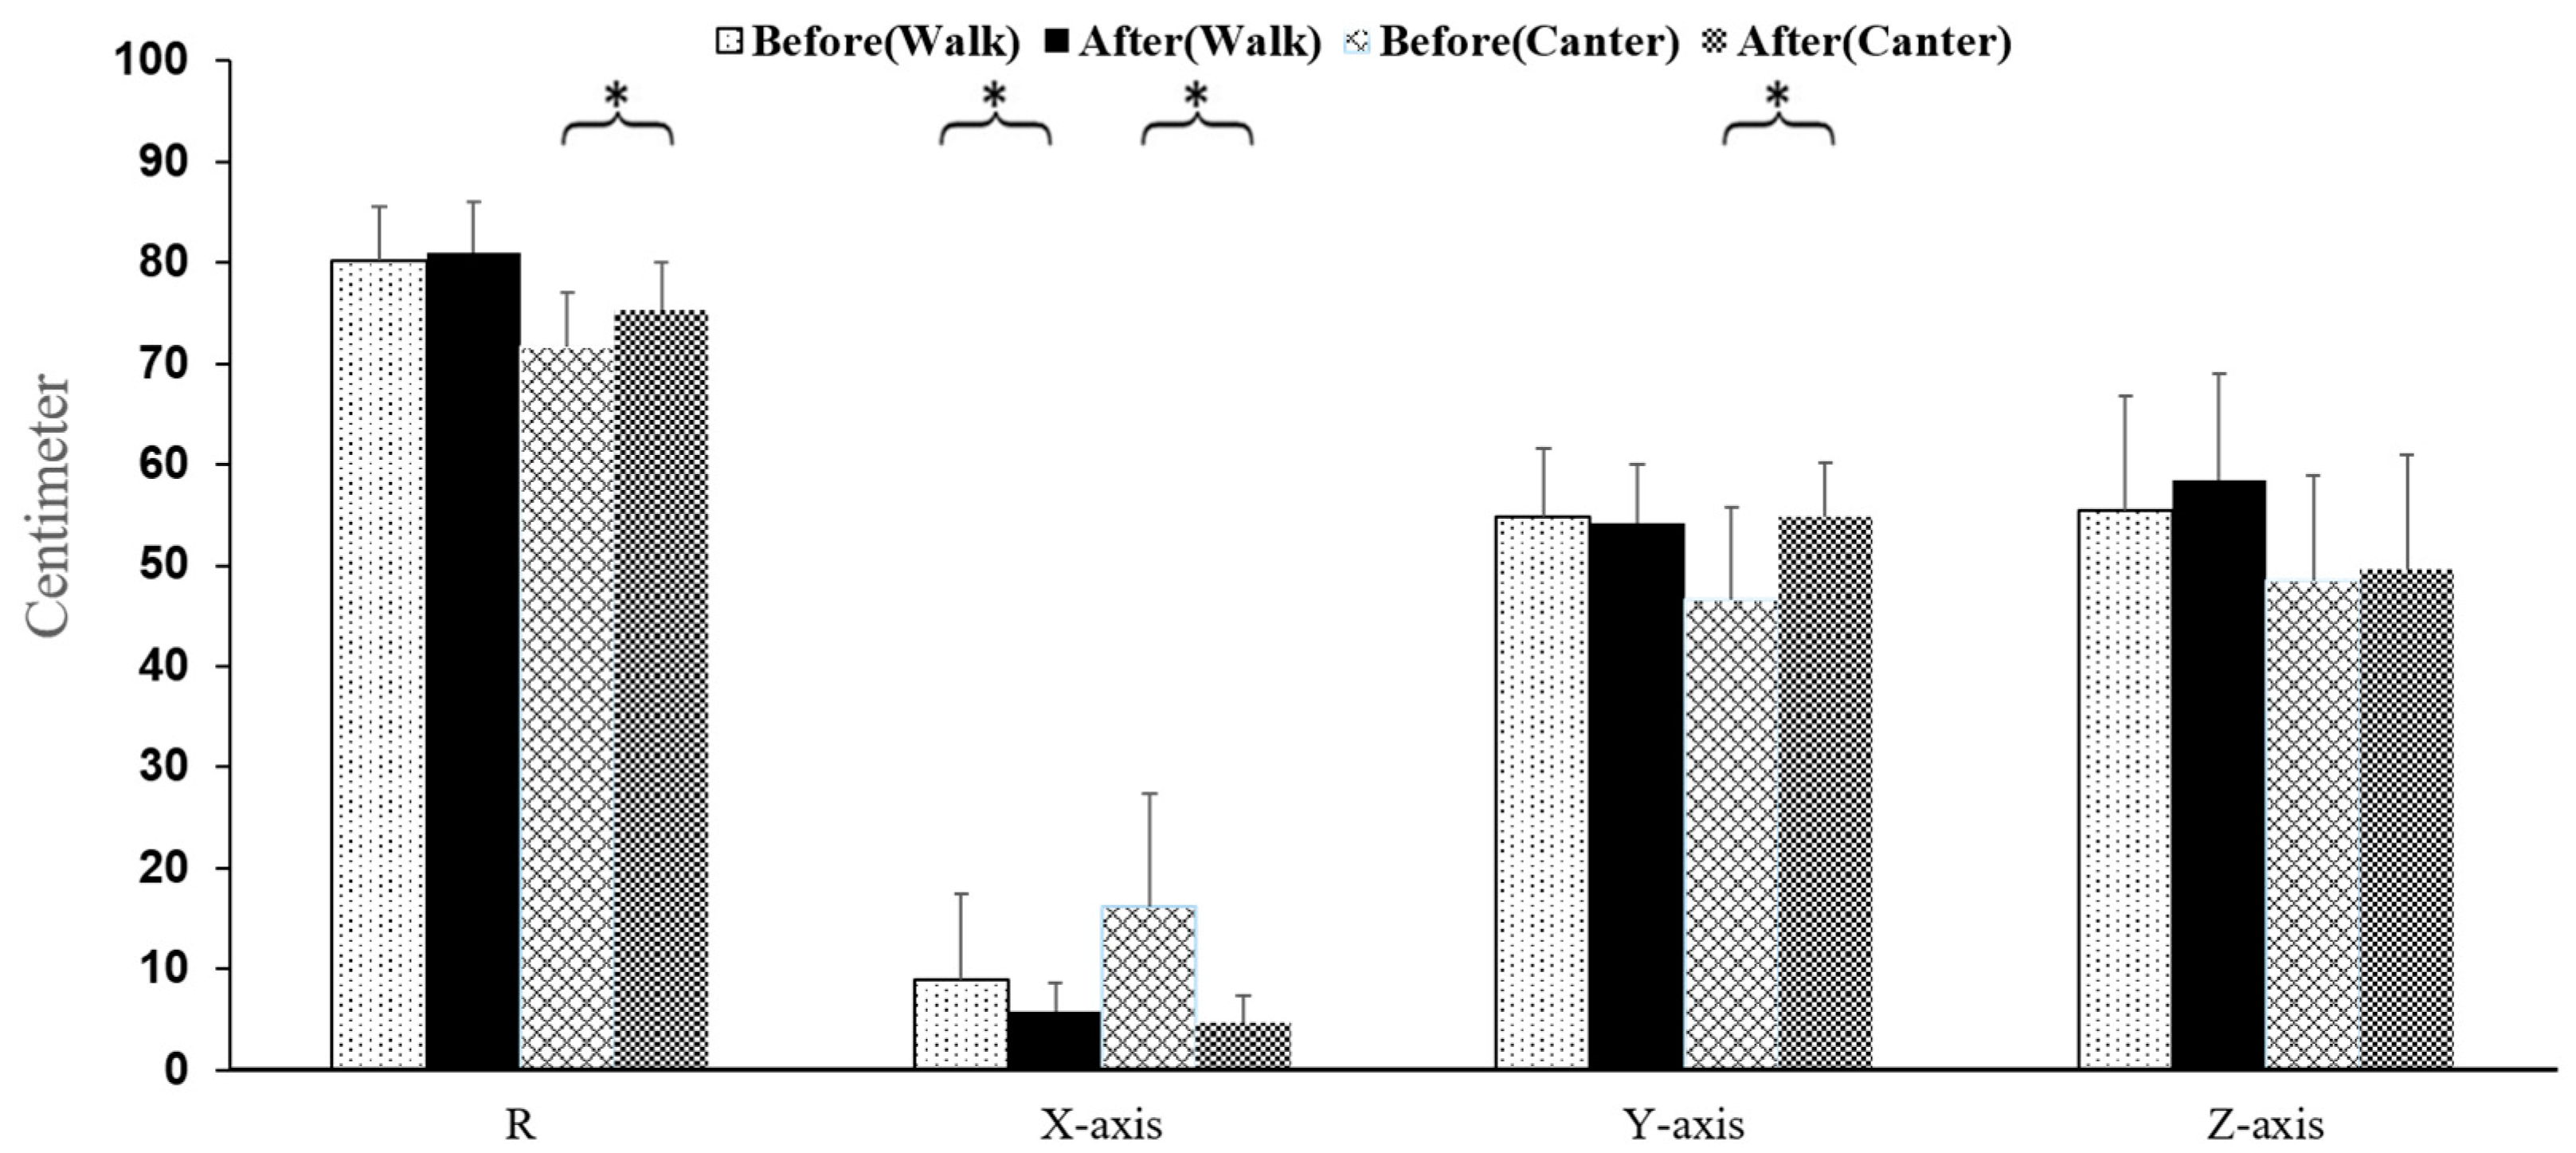
To analyze the displacements between the center of the head and the center of the neck, the average composite displacement from the center of the head to the center of the neck and the average displacement on the x-axis, y-axis, and z-axis were calculated. There were statistically significant differences in the average displacement on the x-axis in Walk after retraining (before: 8.94 cm, after: 5.85 cm, p = 0.040) and in Canter in the average composite displacement from the center of the head to the center of the neck (before: 71.69 cm, after: 75.32 cm, p = 0.044), the average displacement on the x-axis (before: 16.18 cm, after: 4.62 cm, p = 0.001), and the average displacement on the y-axis (before: 46.68 cm, after: 54.82 cm, p = 0.000) after retraining as shown in Figure 5.
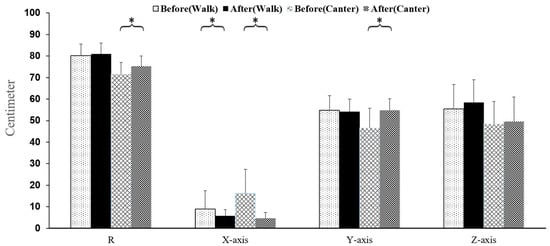
Figure 5.
The displacement between the center of the head and the center of the neck. *: p < 0.05.
4. Discussion
It has been shown that approximately 800,000 horses are slaughtered globally each year [16]. According to the 2009–2010 and 2012 US Horse Industry Surveys, respondents identified the unwanted horse problem as the most crucial issue facing the US horse industry [17]. Holcomb et al. [18] investigated whether the characteristics of individual horses could be used to predict which unwanted horses are more attractive; they concluded that nonprofit equine rescue and sanctuary facility capacity are limiting factors to continue to care for the unwanted horses in the United States [17]. In Korea, about 1700 retired horses are produced every year, but most of them are traded at a bargain price, and even racehorses with a handsome price of USD 1 million per horse are sold for between USD 1000 and USD 2000 when they retire. Horses sold at low prices are deprived of welfare and treatment, and there are accidents in which they die while being abused in places unrelated to racing. Although there are many studies about Thoroughbred health issues during racing, there is a scarcity of research-based data on what happens after retirement [4]. In particular, there are no studies on the effect of retraining for the conversion of saddle horses after retirement from racing.
This study aimed to biomechanically examine the effects of 12-week retraining for the saddle horse conversion on the horse’s gait in retired Thoroughbred racehorses. This study also includes both the saddle horse conversion training plan and a horse gait analysis because biomechanical researchers have not observed changes in horse gait variables after retraining. The retraining program applied to the Thoroughbreds in this study induced significant changes in the kinematic parameters. After training, retired Thoroughbred racehorses had shorter stride lengths and a reduced center of mass displacement, center of head displacement, displacement between the center of the head and the center of the neck, and head–neck angles, bearing in mind that no significant differences in the duration of gaits and the center of mass and head velocities were observed. According to Cavanah and Williams [19], there is an ideal stride length for human movement that consumes the least amount of oxygen preferred by runners. Deviations from the ideal stride length cause excessive oxygen consumption. Likewise, Hoyt and Taylor [20] proposed that horses preferentially choose a velocity that requires the least energy expenditure, which might entail using a specified stride length and/or stride frequency [21]. Thus, one of the effects of retraining to become a saddle horse on the gait may be that horses have a more excellent capacity to adjust their stride length, resulting in reduced energy expenditure and avoiding unnecessary fatigue. However, further investigations are needed to confirm this interpretation. Van Weeren et al. [13] discovered that stride length was not changed after five months of treadmill training statistically. On a treadmill, the stride lengths were not affected by training because the speed is fixed so that the horses may employ their ideal stride length/frequency inside each speed step [12]. Furthermore, exercises on a horizontal treadmill require less energy than exercises on the ground [22]. The differences between the outcomes from the previous study are possibly due to the different training environments because Van Weeren et al. trained on a treadmill. In contrast, the horses used in the current study were trained on the ground and were mounted. Drevemo et al. [14] reported the effects of training a Standardbred for three years to be a racehorse. The results of three years of training increased stride length, stride duration, and swing phase. Contrary to the previous study, a retired racehorse was retrained to become a saddle horse in this study.
Although the effect of retraining was not statistically significant in the stride lengths, all stride lengths were reduced in both Walk and Canter. Leach [21] showed that the relationship between stride length and velocity was linear, and velocity can be estimated by multiplying stride length by frequency. Since the retrained horses did not have to run at the maximum speed as in a race, this reduction of the stride lengths is considered the effect of retraining as racehorses are converted to saddle horses. In particular, the results show that the right side of the stride length decreased to a greater extent. Considering that only one side of the body (right side) had a greater effect, the cause can be the horse’s asymmetry.
It has been reported that the left femur was significantly enlarged in Australian Thoroughbreds [23]. The cause was from running clockwise repeatedly. The difference in pressure repeatedly applied to the left leg of Australian Thoroughbreds when turning a curved corner caused the asymmetry between the left and right hind limbs [23]. On the contrary, the right legs greatly affected Korean Thoroughbreds racing counterclockwise. As a result, the stride lengths of the right fore/hind feet were changed more than those of the left side through the saddle horse conversion training. These changes mean that the retraining positively affected the imbalance of the horse’s body.
In lameness examinations, lunging that rotates in only one direction is used. This rotation in only one direction induces artificial lameness and examines the movement to compensate for the lameness [24]. Considering that lunging causes lameness, in the case of a racehorse that runs only in one direction for a long period, the imbalance in the left and right of the body becomes chronic. It naturally affects the movement, resulting in compensatory movements (front–back/left–right movements of the head and the body increase). Previous studies [24,25,26] have shown that lameness in horses is related to compensatory head and body movements. The current study showed that the left–right (x-axis) movements of the center of mass and the center of the head decreased after the saddle horse conversion training. These results can be considered as more balanced and as less movement to compensate for the head and body imbalance, meaning straightness has improved.
In addition, the head–neck angle was smaller than before training in all events of Walk and in five events of Canter. The head and neck positions considerably impact movement patterns and limb loading, which might affect the horse’s orthopedic health [27,28]. For example, the horse’s elasticity and back function can be enhanced by a head and neck position that is very low, and hyperflexion [29] though this posture has been harshly criticized as cruel to the horse due to the alleged excessive tension induced in the structures of the neck and back [30].
Furthermore, the horses showed a significant decrease in the displacement between the center of the head and the center of the neck, pulling the head toward the body after the retraining. It is thought that the horse pulled its head and attempted a vertical flexion to adjust itself to the rider’s center. Vertical flexion is when the horse flexes the head at the poll and retains it in a vertical position, whether standing still or moving forward or backward. According to Heuschmann [31], the horse may then carry its back freely and without tension in this position, and it causes the horse’s spine to flex longitudinally, forming a bridge under the rider. This bridge integrates and strengthens the safe movement of the horse. Therefore, vertical flexion enables the horse to stop gently and adequately and move forward and backward effectively.
Through saddle horse conversion training, the horse’s movement changes may be considered as the habitual movements in the life of a racehorse being gradually transformed into ideal movements for a saddle horse.
5. Conclusions
The conclusions about the effect of 12 weeks of saddle horse conversion training on the gait of Thoroughbreds are as follows:
- The change in the stride length of each foot differed according to the gait. There was no significant difference in the stride lengths of the foot in Walk and Canter, though it decreased in all events;
- The saddle horse conversion training improved straightness of the body. There were no significant differences in the velocity of the center of the body and center of the head in Walk and Canter. Nonetheless, it was found that the movement of the center of the body and the center of the head decreased along the x-axis (left and right movement);
- The horses tried to focus their center on the rider. There was a significant decrease in head–neck angle in Walk. In addition, the displacement between the center of the head and the center of the neck was decreased in Canter.
What is interesting from the above results is that the compensatory movement of the horse was significantly reduced after training, and the horse tried to center itself on the rider. It means that life as a racehorse to run the fastest changed the horse’s gait and that change can be seen when recovering as a saddle horse.
The current study has several limitations:
- Although all Thoroughbreds were retired within six months from the start of the first gait analysis, the racehorse’s retirement time differed, so the gait test was not performed immediately after retirement;
- The prepost test in this study alone cannot reveal the causal relationship. It may be due to the absence of a control group, whose training level cannot be estimated because there is no information on the standard of excellent saddle horse and changes in gait due to injury or disease;
- There is a change in the environment in which the horse resides. Horses have been reported to be stressed depending on the environment in which they live. As an example, compared to traditional stable and natural horse boarding, horses living in a stable developed increased stress [32]. Since stress can have a negative effect on horse performance [33], the environmental conditions between the pre and posttests should be similarly configured.
Author Contributions
Conceptualization, T.J. and H.P.; methodology, T.J. and H.P.; software, T.J. and H.P.; validation, T.J. and H.P.; formal analysis, T.J. and H.P.; investigation, T.J. and H.P.; resources, T.J. and H.P.; data curation, T.J. and H.P.; writing—original draft preparation, T.J. and H.P.; writing—review and editing, T.J. and H.P.; visualization, T.J. and H.P.; supervision, T.J. and H.P.; project administration, T.J. and H.P.; funding acquisition, T.J. All authors have read and agreed to the published version of the manuscript.
Funding
This work was supported by a grant from the Korea Racing Authority, grant title: Development of practical model for saddle horse training of Thoroughbred.
Institutional Review Board Statement
The animal study protocol was approved by the Institutional Review Board of Jeonbuk Horse Industrial Complex Center (under the title of Development of practical model for saddle horse training of Thoroughbred, December 2019).
Informed Consent Statement
Informed consent was obtained from all subjects involved in the study.
Data Availability Statement
Not applicable.
Conflicts of Interest
The authors declare no conflict of interest.
References
- Bower, M.A.; McGivney, B.A.; Campana, M.; Gu, J.; Andersson, L.S.; Barrett, E.; Davis, C.R.; Mikko, S.; Stock, F.; Voronkova, V.; et al. The genetic origin and history of speed in the Thoroughbred racehorse. Nat. Commun. 2012, 3, 643. [Google Scholar] [CrossRef] [PubMed]
- American Horse Council Foundation. 2017 Economic Impact of the U.S. Horse Industry; American Horse Council Foundation: Washington, DC, USA, 2018. [Google Scholar]
- Khummuang, S.; Lee, H.G.; Joo, S.S.; Park, J.-W.; Choi, J.-Y.; Oh, J.H.; Kim, K.H.; Youn, H.-H.; Kim, M.; Cho, B.-W. Comparison for immunophysiological responses of Jeju and Thoroughbred horses after exercise. Asian-Australas. J. Anim. Sci. 2020, 33, 424–435. [Google Scholar] [CrossRef] [PubMed]
- Reed, S.K.; Ley, B.B.V.; Bell, R.P.; Wilson, D.A.; Wilborn, E.; Keegan, K.G. Survey on Thoroughbred use, health and owner satisfaction following retirement from racing. Equine Veter. Educ. 2019, 32, 82–87. [Google Scholar] [CrossRef]
- Crawford, K.L.; Finnane, A.; Greer, R.M.; Phillips, C.J.C.; Woldeyohannes, S.M.; Perkins, N.R.; Ahern, B.J. Appraising the Welfare of Thoroughbred Racehorses in Training in Queensland, Australia: The Incidence, Risk Factors and Outcomes for Horses after Retirement from Racing. Animals 2021, 11, 142. [Google Scholar] [CrossRef]
- Yeo, H. Retired Racing Horse Management System; A Publication of the Korea Racing Authority; Horse Industry Research Symposium: Gwacheon, Korea, 2019. [Google Scholar]
- Lee, K. Common Sense And Laws Related To Horses; Korea Disabled Writers Welfare Support Association: Seoul, Korea, 2020. [Google Scholar]
- Jung, T.-W.; Kim, T.-S. The influences of 12 weeks riding horse training program on Ear Position, Cortisol and Stress Index with Thoroughbred retired racehorse. Korean J. Sports Sci. 2020, 29, 931–939. [Google Scholar] [CrossRef]
- Valberg, S.J. Muscle anatomy, physiology, and adaptations to exercise and training. In The Athletic Horse: Principles and Practice of Equine Sports Medicine, 2nd ed.; Elsevier Inc.: Amsterdam, The Netherlands, 2013; pp. 174–201. [Google Scholar]
- Rivero, J.L.L.; Ruz, M.C.; Serrano, A.L.; Diz, A.M. Effects of a 3 month endurance training programme on skeletal muscle histochemistry in Andalusian, Arabian and Anglo-Arabian horses. Equine Veter. J. 1995, 27, 51–59. [Google Scholar] [CrossRef] [PubMed]
- Cano, M.; Miró, F.; Diz, A.; Agüera, E.; Galisteo, A. Influence of training on the biokinematics in trotting Andalusian horses. Veter. Res. Commun. 2000, 24, 477–489. [Google Scholar] [CrossRef]
- Corley, J.M.; Goodship, A.E. Treadmill training induced changes to some kinematic variables measured at the canter in Thoroughbred fillies. Equine Veter. J. 2010, 26, 20–24. [Google Scholar] [CrossRef]
- van Weeren, P.; Bogert, A.V.D.; Back, W.; Bruin, G.; Barneveld, A. Kinematics of the Standardbred Trotter Measured at 6, 7, 8 and 9 m/s on a Treadmill, before and after 5 Months of Prerace Training. Cells Tissues Organs 1993, 146, 154–161. [Google Scholar] [CrossRef]
- Drevemo, S.; Dalin, G.; Fredricson, I.; Björne, K. Equine locomotion: 3. The reproducibility of gait in Standardbred trotters. Equine Veter. J. 1980, 12, 71–73. [Google Scholar] [CrossRef]
- Abdel-Aziz, Y.I.; Karara, H.M.; Hauck, M. Direct linear transformation from comparator coordinates into object space coordinates in close-range photogrammetry. Photogramm. Eng. Remote Sens. 2015, 81, 103–107. [Google Scholar] [CrossRef]
- Padalino, B.; Riley, C.B. The implications of transport practices for horse health and welfare. Front. Vet. Sci. 2020, 7, 202. [Google Scholar] [CrossRef] [PubMed] [Green Version]
- Stowe, C.J.; Kibler, M.L. Characteristics of Adopted Thoroughbred Racehorses in Second Careers. J. Appl. Anim. Welf. Sci. 2015, 19, 81–89. [Google Scholar] [CrossRef] [PubMed]
- Holcomb, K.E.; Stull, C.L.; Kass, P.H. Unwanted horses: The role of nonprofit equine rescue and sanctuary organizations1. J. Anim. Sci. 2010, 88, 4142–4150. [Google Scholar] [CrossRef] [PubMed]
- Cavanagh, P.R.; Williams, K.R. The effect of stride length variation on oxygen uptake during distance running. Med. Sci. Sports Exerc. 1982, 14, 30–35. [Google Scholar] [CrossRef]
- Hoyt, D.F.; Taylor, C.R. Gait and the energetics of locomotion in horses. Nature 1981, 292, 239–240. [Google Scholar] [CrossRef]
- Leach, D.H. Equine Exercise Physiology 2. In Locomotion Of The Athletic Horse; ICEEP Publications: Davis, CA, USA, 1987; pp. 516–535. [Google Scholar]
- van Oldruitenborgh Oosterbaan, M.S.; Barneveld, A.; Schamhardt, H.C. Kinematics of unmounted and mounted horses at walk before and after treadmill exercise. Pferdeheilkunde 1996, 12, 651–655. [Google Scholar] [CrossRef]
- Pearce, G.P.; May-Davis, S.; Greaves, D. Femoral asymmetry in the Thoroughbred racehorse. Aust. Vet. J. 2005, 83, 367–370. [Google Scholar] [CrossRef]
- Rhodin, M.; Pfau, T.; Roepstorff, L.; Egenvall, A. Effect of lungeing on head and pelvic movement asymmetry in horses with induced lameness. Vet. J. 2013, 198, e39–e45. [Google Scholar] [CrossRef] [Green Version]
- Pfau, T.; Noordwijk, K.; Sepulveda Caviedes, M.F.; Persson-Sjodin, E.; Barstow, A.; Forbes, B.; Rhodin, M. Head, withers and pelvic movement asymmetry and their relative timing in trot in racing Thoroughbreds in training. Equine Vet. J. 2018, 50, 117–124. [Google Scholar] [CrossRef]
- Kelmer, G.; Keegan, K.G.; Kramer, J.; Wilson, D.A.; Pai, F.P.; Singh, P. Computer-assisted kinematic evaluation of induced compensatory movements resembling lameness in horses trotting on a treadmill. Am. J. Vet. Res. 2005, 66, 646–655. [Google Scholar] [CrossRef] [PubMed]
- Rhodin, M.; Byström, A.; Roepstorff, L.; Hernlund, E.; Van Weeren, P.R.; Weishaupt, M.A.; Egenvall, A. Effect of different head and neck positions on kinematics of elite dressage horses ridden at walk on treadmill. Comp. Exerc. Physiol. 2018, 14, 69–78. [Google Scholar] [CrossRef]
- Rhodin, M.; Álvarez, C.B.G.; Byström, A.; Johnston, C.; Van Weeren, P.R.; Roepstorff, L.; Weishaupt, M.A. The effect of different head and neck positions on the caudal back and hindlimb kinematics in the elite dressage horse at trot. Equine Veter. J. 2009, 41, 274–279. [Google Scholar] [CrossRef]
- Janssen, S. Zur Brust genommen. Reit. Rev. 2003, 46, 41–45. [Google Scholar]
- Balkenhol, K.; Müller, H.; Plewa, M.; Heuschmann, G. Zur Entfaltung kommen–statt zur Brust genommen. Reit. Rev. 2003, 2, 46–51. [Google Scholar]
- Heuschmann, G. Tug of War: Classical Versus “Modern” Dressage: Why Classical Training Works and How Incorrect “Modern” Training Negatively Affects Horses’ Health; Trafalgar Square Books: Pomfret, VT, USA, 2007. [Google Scholar]
- Placci, M.; Marliani, G.; Sabioni, S.; Gabai, G.; Mondo, E.; Borghetti, P.; De Angelis, E.; Accorsi, P.A. Natural Horse Boarding Vs. Traditional Stable: A Comparison of Hormonal, Hematological and Immunological Parameters. J. Appl. Anim. Welf. Sci. 2019, 23, 366–377. [Google Scholar] [CrossRef]
- Bartolomé, E.; Cockram, M.S. Potential Effects of Stress on the Performance of Sport Horses. J. Equine Vet. Sci. 2016, 40, 84–93. [Google Scholar] [CrossRef]

Publisher’s Note: MDPI stays neutral with regard to jurisdictional claims in published maps and institutional affiliations. |
© 2022 by the authors. Licensee MDPI, Basel, Switzerland. This article is an open access article distributed under the terms and conditions of the Creative Commons Attribution (CC BY) license (https://creativecommons.org/licenses/by/4.0/).