Abstract
The progress of data technology and wireless networks is generated by open online communication channels. Unfortunately, trolls are abusing the technology for executing cyberattacks and threats. An automated cybersecurity solution is vital for avoiding the threats and security issues from social media. This can be a requirement for tackling and considering cyberbullying in various aspects including prevention of such incidents and automated detection. This study introduces a novel Artificial Fish Swarm Algorithm with Weighted Extreme Learning Machine (AFSA-WELM) model for cybersecurity on social media. The proposed model is mostly intended to detect the existence of cyberbullying on social media. The proposed model starts by processing the dataset and making it ready for the next stages of the model. It then uses the TF-IDF vectorizer for word embedding. After that, it uses the WELM model for the identification and classification of cyberbullying. Finally, the optimal tunning parameters used in the WELM model are derived for the AFSA model. The experimental analysis has shown that the proposed model achieves maximum accuracy compared with existing algorithms. Moreover, our proposed model achieves maximum precision–recall performance with various datasets.
1. Introduction
Cyberbullying has been a progressive and always developing issue all through most recent years, and thus programmed recognition of it has been an engaging point for scientists. Cyberbullying or disdain discourse is the demonstration of posting scornful substance on social media, which is found to be harmful because of its tedious and oppressive nature [1]. Cyberbullying can influence individuals’ mental states and different parts of life. Particularly for youngsters, cyberbullying could even lead them to cause self-harm and self-destruction [2]. Scientists have likewise concentrated on the relationship between cyberbullying exploitation and the risk of self-destructive ideation [3,4]. It is a fundamental and provoking task to distinguish cyberbullying. Concerning its significance, although the mischief of cyberbullying should be limited as much as can be expected, it is more vital to foster a programmed model to foresee cyberbullying occasions, rather than checking physically or helping victims a while later.
The difficulties of cyberbullying discovery are as follows [5]. To begin with, according to the point of view of manual verification, the judgment of whether specific conduct is cyberbullying changes from one individual to another. For instance, when a sentence contains swear words, it may very well be considered cyberbullying activity, yet now and again, this is not accurate, such as when some teenagers speak with their companions on social networks. After that, where cyberbullying happens most often [6], social organization’s platforms generally have the idea of communicating with the public and unknown commenters. Thus, posts are more autonomous and context-free, and it is simple to cause doubt or misdirect others. Third, one significant issue with cyberbullying research is the absence of standard information [7]. Although the information utilized in numerous past investigations was obtained from similar social networks (e.g., Twitter), they were made by freely utilizing public API or by site scraping. Subsequently, individual data cannot be measured against each another and are not helpful for checking the technique’s comprehensiveness.
This study introduces a novel Artificial Fish Swarm Algorithm with Weighted Extreme Learning Machine (AFSA-WELM) model for cybersecurity on social media. The AFSA-WELM model presented here is mainly intended to detect the existence of cyberbullying on social media. The main contributions of this study are summarized as follows:
- Introducing an efficient AFSA-WELM model to detect cyberbullying on social media using an artificial fish swarm algorithm and weighted extreme machine learning.
- Using the TF-IDF model for feature extraction, using the WELM model for classification, and applying the AFSA model for parameter tuning.
- The presented AFSA-WELM model has been validated through extensive experimental evaluations on various datasets. It achieved the maximum precision–recall performance for various datasets.
Finally, the presented AFSA-WELM has shown maximum accuracy compared with existing algorithms such as the SVM and Naïve Bayes algorithms.
2. Related Work
Regarding instant messages in social networks, the length of sentences is generally short and noisy. These messages can likewise be unstructured, e.g., messages could contain emoticons, emojis, or incorrect spellings, which befuddles models catching information from instant messages [8]. While a multitude of techniques have attempted to work on the exactness of the cyberbullying-related task somewhat, we accept that they have not completely used precise data on past text-based information, which we call the setting in the context of this study [9]. The main classification of setting is an inner setting that incorporates any non-text-based data that can be separated from the dataset itself, e.g., the client’s liked posts, adherents, or multimedia content connected to the social media post, e.g., pictures and recordings [10,11].
Bozyiğit et al. [12] described the significance of social networking characteristics in detecting cyberbullying. Initially, a balanced dataset consisting of 5000 labeled contents with numerous social networking characteristics was built. Next, the relationships between social media features and cyberbullying were analyzed by chi-square testing. It is obvious that a few characteristics (for example, the sender’s followers) are powerfully connected with online bullying events according to the tested outcomes. The researchers in [13] proposed a DNN method for detecting cyberbullying in three distinct types of social information, such as visual media, infographics, and textual content (embedded text and an image). The compact structure, CapsNet–ConvNet, comprises ConvNet to predict the visual bullying content and CapsNet-DNN with dynamic routing to predict text bullying content. The researchers in [14] presented an ML technique that (i) fine-tunes variants of BERT, a deep attention-based language technique that can detect patterns in a long and noisy body of text; (ii) extracts contextual data from various sources involving external knowledge sources, metadata, and images, and uses those characteristics for complementing the learning method; and (iii) effectively integrates textual and contextual characteristics through boosting and a wide-ranging framework. Fang et al. [15] presented the advantages of GRU cells and Bi-GRU for learning the fundamental relationships among words in these two directions. Rupesh et al. [16] used machine learning algorithms to efficiently detect hate speech on social networks. In addition, we presented a self-attention model which had the advantage of achieving great efficiency in cyberbullying classification tasks.
In this study, we conducted a comparative analysis of the presented the proposed model with some recent models, as shown in Table 1.

Table 1.
A comparative analysis of the AFSA-WELM technique and existing algorithms.
The table portrays a brief comparative study of the AFSA-WELM model and recent models [17].
3. The Proposed Model
This study introduces a novel model for cybersecurity on social media, as shown in Figure 1. The figure illustrates the overall process of the proposed model. The presented model is mainly intended to detect the existence of cyberbullying on social media. The proposed model is composed of five main stages:
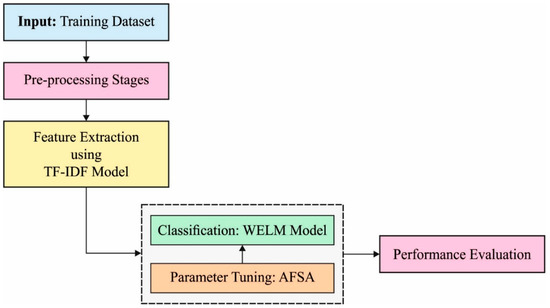
Figure 1.
Overall process of the proposed model for secure social media applications.
- Data input: The model accepts the training dataset.
- Data pre-processing: The inputted data will be pre-processed to the formats that will be used in the next stages.
- Feature extraction: The model uses a TF-IDF vectorizer for word embedding.
- Classification and identification: The model uses WELM to efficiently identify and classify cyberbullying.
- Parameter tunning: In this stage, the AFSA model is derived to perfectly obtain the optimal tuned parameters that are used in the proposed model.
Finally, in order to validate the introduced model, we introduced a comparative study that showed the efficiency of the introduced model over other methods in the related literature.
3.1. TF-IDF Vectorizer
In this work, the TF-IDF vectorizer was used for word embedding. TF-IDF is an extensively used feature extraction system for examining texts. The two substantial tasks are indexing and weighting; TF-IDF manages the weighting. It determines the weight of t in a document D. TF-IDF is derived from TF and IDF as follows [18]:
Now , and are used to characterize the inclusive number of times of appears in a document , the total number of documents and the quantity of documents with term
The weight of each term according to the TF-IDF is estimated by:
where and denote the frequency of in document and the sum of documents containing , respectively.
3.2. WELM-Based Classification
Next, the WELM model was used for the identification and classification of cyberbullying. The WELM classification model was used to assign appropriate class labels. ELM was used for the classification of a balanced dataset, while WELM was used for the classification of an imbalanced dataset [19]. The training dataset has distinct instances. A single hidden layer NN with hidden layer node was formulated by:
whereas characterizes a single hidden layer’s input weight, denotes the activation functions, indicates the output weights, and signifies the bias of the individual hidden layers.
where denotes the output matrix of a single hidden layer
Based on the Karush–Kuhn–Tucker concept, the Lagrangian factor was used to change the trained ELM as a dual problem [20]. The output weight can be evaluated as follows:
Here, denotes the regularization coefficient. Therefore, the output function of the ELM classification is formulated by:
where denotes the kernel matrix, which is calculated by:
It is obvious in (13) that the hidden layer feature maps denote the independence in classification results of ELM. The classification result is related to the kernel function, . denotes an inner product, and the number of hidden layers is no outcomes in the resulting output.
Therefore, the KELM classification efficacy is distributed into two variables, namely the kernel function parameter, and the penalty parameter, C. The original goal of ELM is achieved in WELM by preserving the weight for distinct instances to handle imbalanced classification problems. It is calculated by the following equations:
where denotes the weight matrix. WELM has two weightage models as follows:
where denotes the number of instances assigned to class ; denotes the number of classes; and indicates the average instance of all the classes. Figure 2 showcases the framework of ELM.
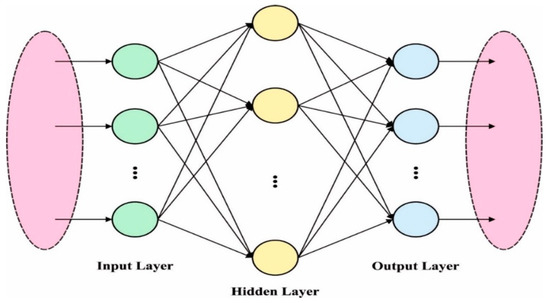
Figure 2.
The structure of ELM.
3.3. AFSA-Based Parameter Optimization
At this stage, the AFSA model is derived for optimal tuning of the parameters involved in the WELM model. The ASFA replicates the behavior of a prey fish swarm and it has been established for rapid searching. Exploration begins with arbitrary result maps for each fish. Fitness is assessed and the fish following techniques are initiated, and each fish follows the other fishes via the optimum outcome. Once the outcome is sub-optimum, a swarming method is initiated. Once the chosen outcome is not linked, the prey method is initiated. This process repeats until the required threshold or termination condition is encountered [21]. The AFSA has four functions that have been modeled on the nature of fish in a fish swarm. A primary function is free-moving action: in the environment, a fish travels in a swarm when it is not injured. The next function is prey action, since it uses smell, vision, and other available senses in the body. In AFSA, the area where an artificial fish senses a predator is modeled as a neighborhood via a visual-sized radius. The next function is following action when a fish identifies food; other swarm members follow it to reach the food. The last function is the swarm action, which replicates fishes as each fish continually attempts to be in the swarm and does not leave so it can be protected from the hunter.
Consider the condition vector of AFS is , where denotes the location of the fish. The food in this location of the fish is characterized by , in which indicates the objective function value. The distance amongst artificial fish is and represent arbitrary fish, Step indicates the maximum step size of artificial fish, and denotes the degree of congestion factor.
Let be the visual location at a particular moment. denotes the novel location. The development process is shown as follows:
During the prey model, the behavior of fish is represented as follows:
where rand denotes a random function within In the swarming phase, the behavior of the swarm is represented as follows:
The next stage is represented in the following (Equation (19)):
where xmax is the last location that the fish can arrive and ymax is the maximum value of the objective function to guarantee that local and global exploration, and the exploration direction towards the optimum food source are carried out.
4. Results and Discussion
The presented AFSA-WELM model was simulated using a dataset collected from the Kaggle repository. The dataset holds 12,729 samples with 11,661 data classified as non-cyberbullying and 1068 data in the cyberbullying class.
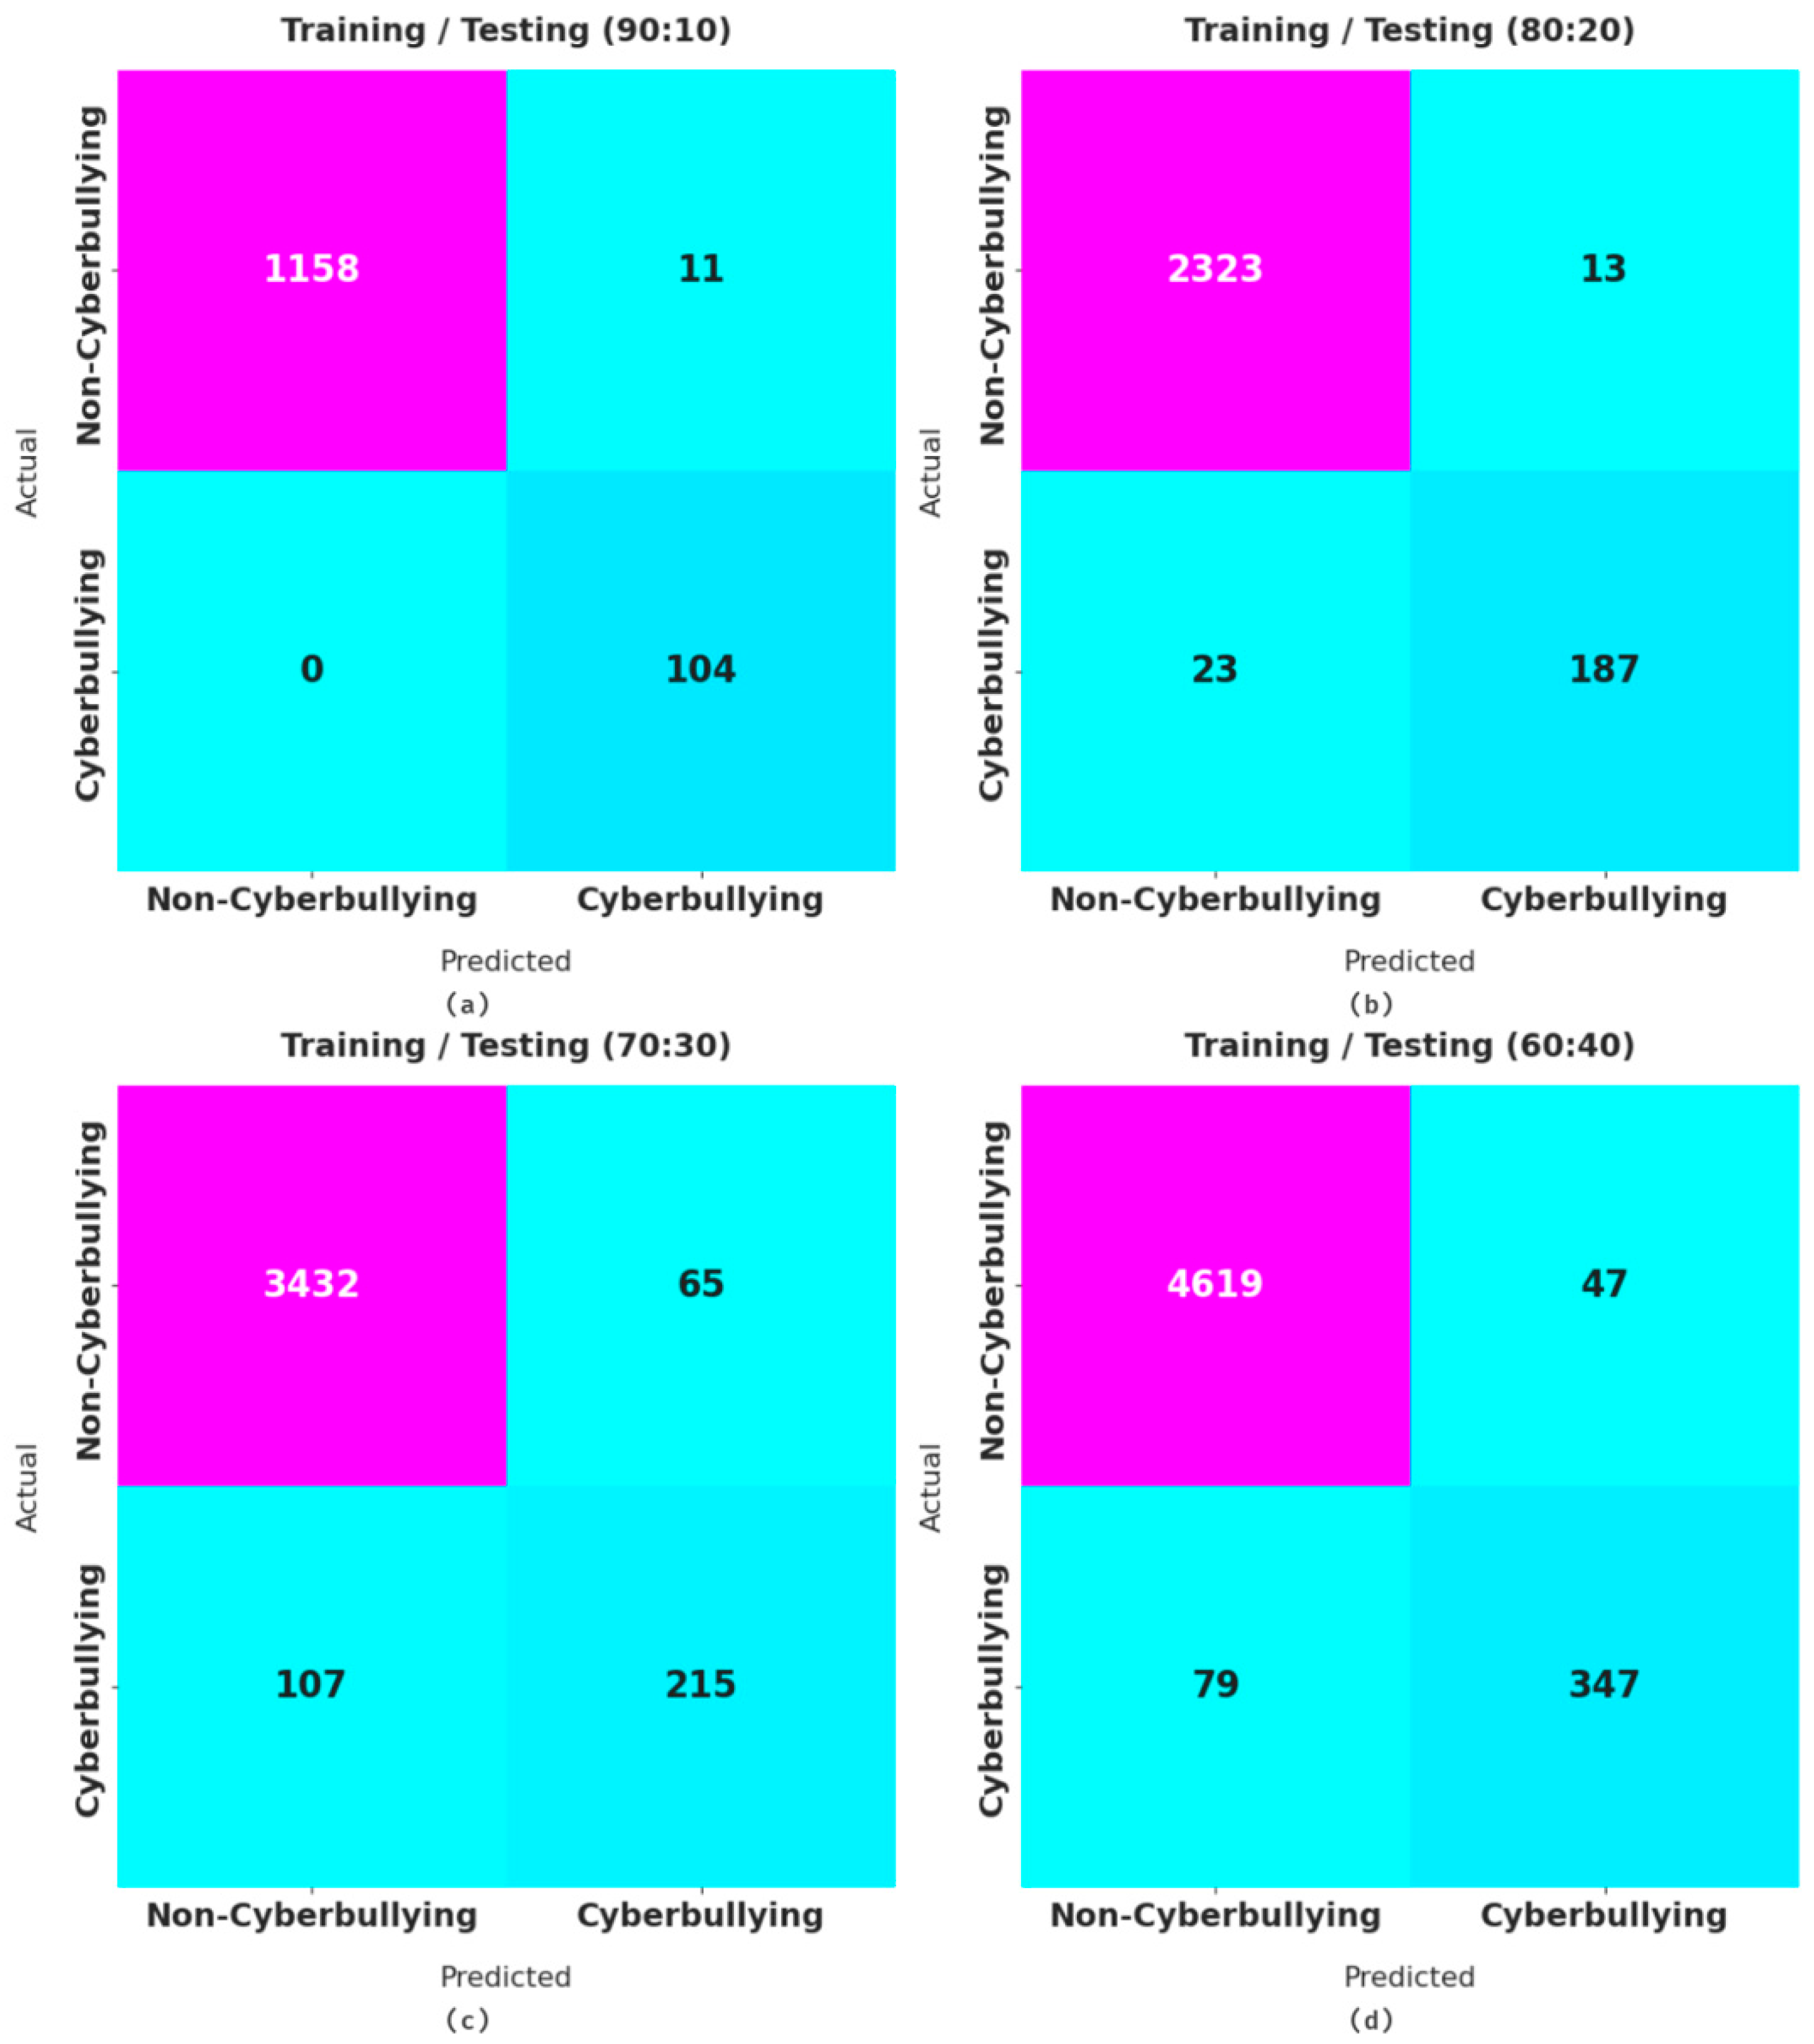
Figure 3 illustrates the confusion matrices offered by the AFSA-WELM model for distinct sizes of training/testing datasets. With a training/testing data split of 90:10, the proposed model identified 1158 samples in the non-cyberbullying class and 104 samples in the cyberbullying class. In addition, with a training/testing data split of 80:20, the AFSA-WELM method identified 2323 samples in the non-cyberbullying class and 187 samples in the cyberbullying class. Meanwhile, with a training/testing data split of 70:30, the proposed model identified 3432 samples in the non-cyberbullying class and 215 samples in the cyberbullying class. Finally, with a training/testing data split of 60:40, the AFSA-WELM technique identified 4619 samples in the non-cyberbullying class and 347 samples in the cyberbullying class.
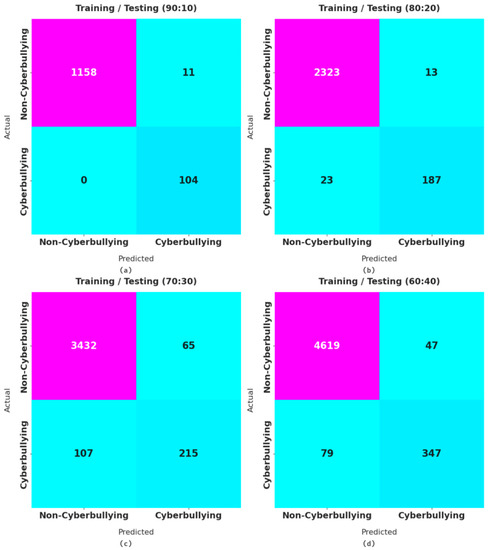
Figure 3.
Confusion matrix of the proposed model for different training/testing dataset sizes. Where (a) considers 90:10 training/testing data split, (b) considers 80:20 training/testing data split, (c) considers 70:30 training/testing data split, and (d) considers 60:40 training/testing data split.
Table 2 reports the overall classifier results of our proposed model with different training/testing dataset sizes. With a training/testing dataset split of 90:10, the AFSA-WELM model resulted in an , , , and of 99.14%, 95.22%, 99.53%, and 97.25%, respectively. Moreover, with a training/testing dataset split of 80:20, the proposed model resulted in an , , , and of 98.59%, 96.26%, 94.25%, and 95.23%c correspondingly. In addition, with a training/testing dataset split of 70:30, the proposed model resulted in an , , , and of 95.50%, 86.88%, 82.46%, and 84.49%, correspondingly. Lastly, with a training/testing dataset split of 60:40, the proposed model resulted in an , , , and of 97.53%, 93.19%, 90.22%, and 91.64%, correspondingly.
Table 2.
Results of the proposed model with different measures and training/testing datasets sizes.
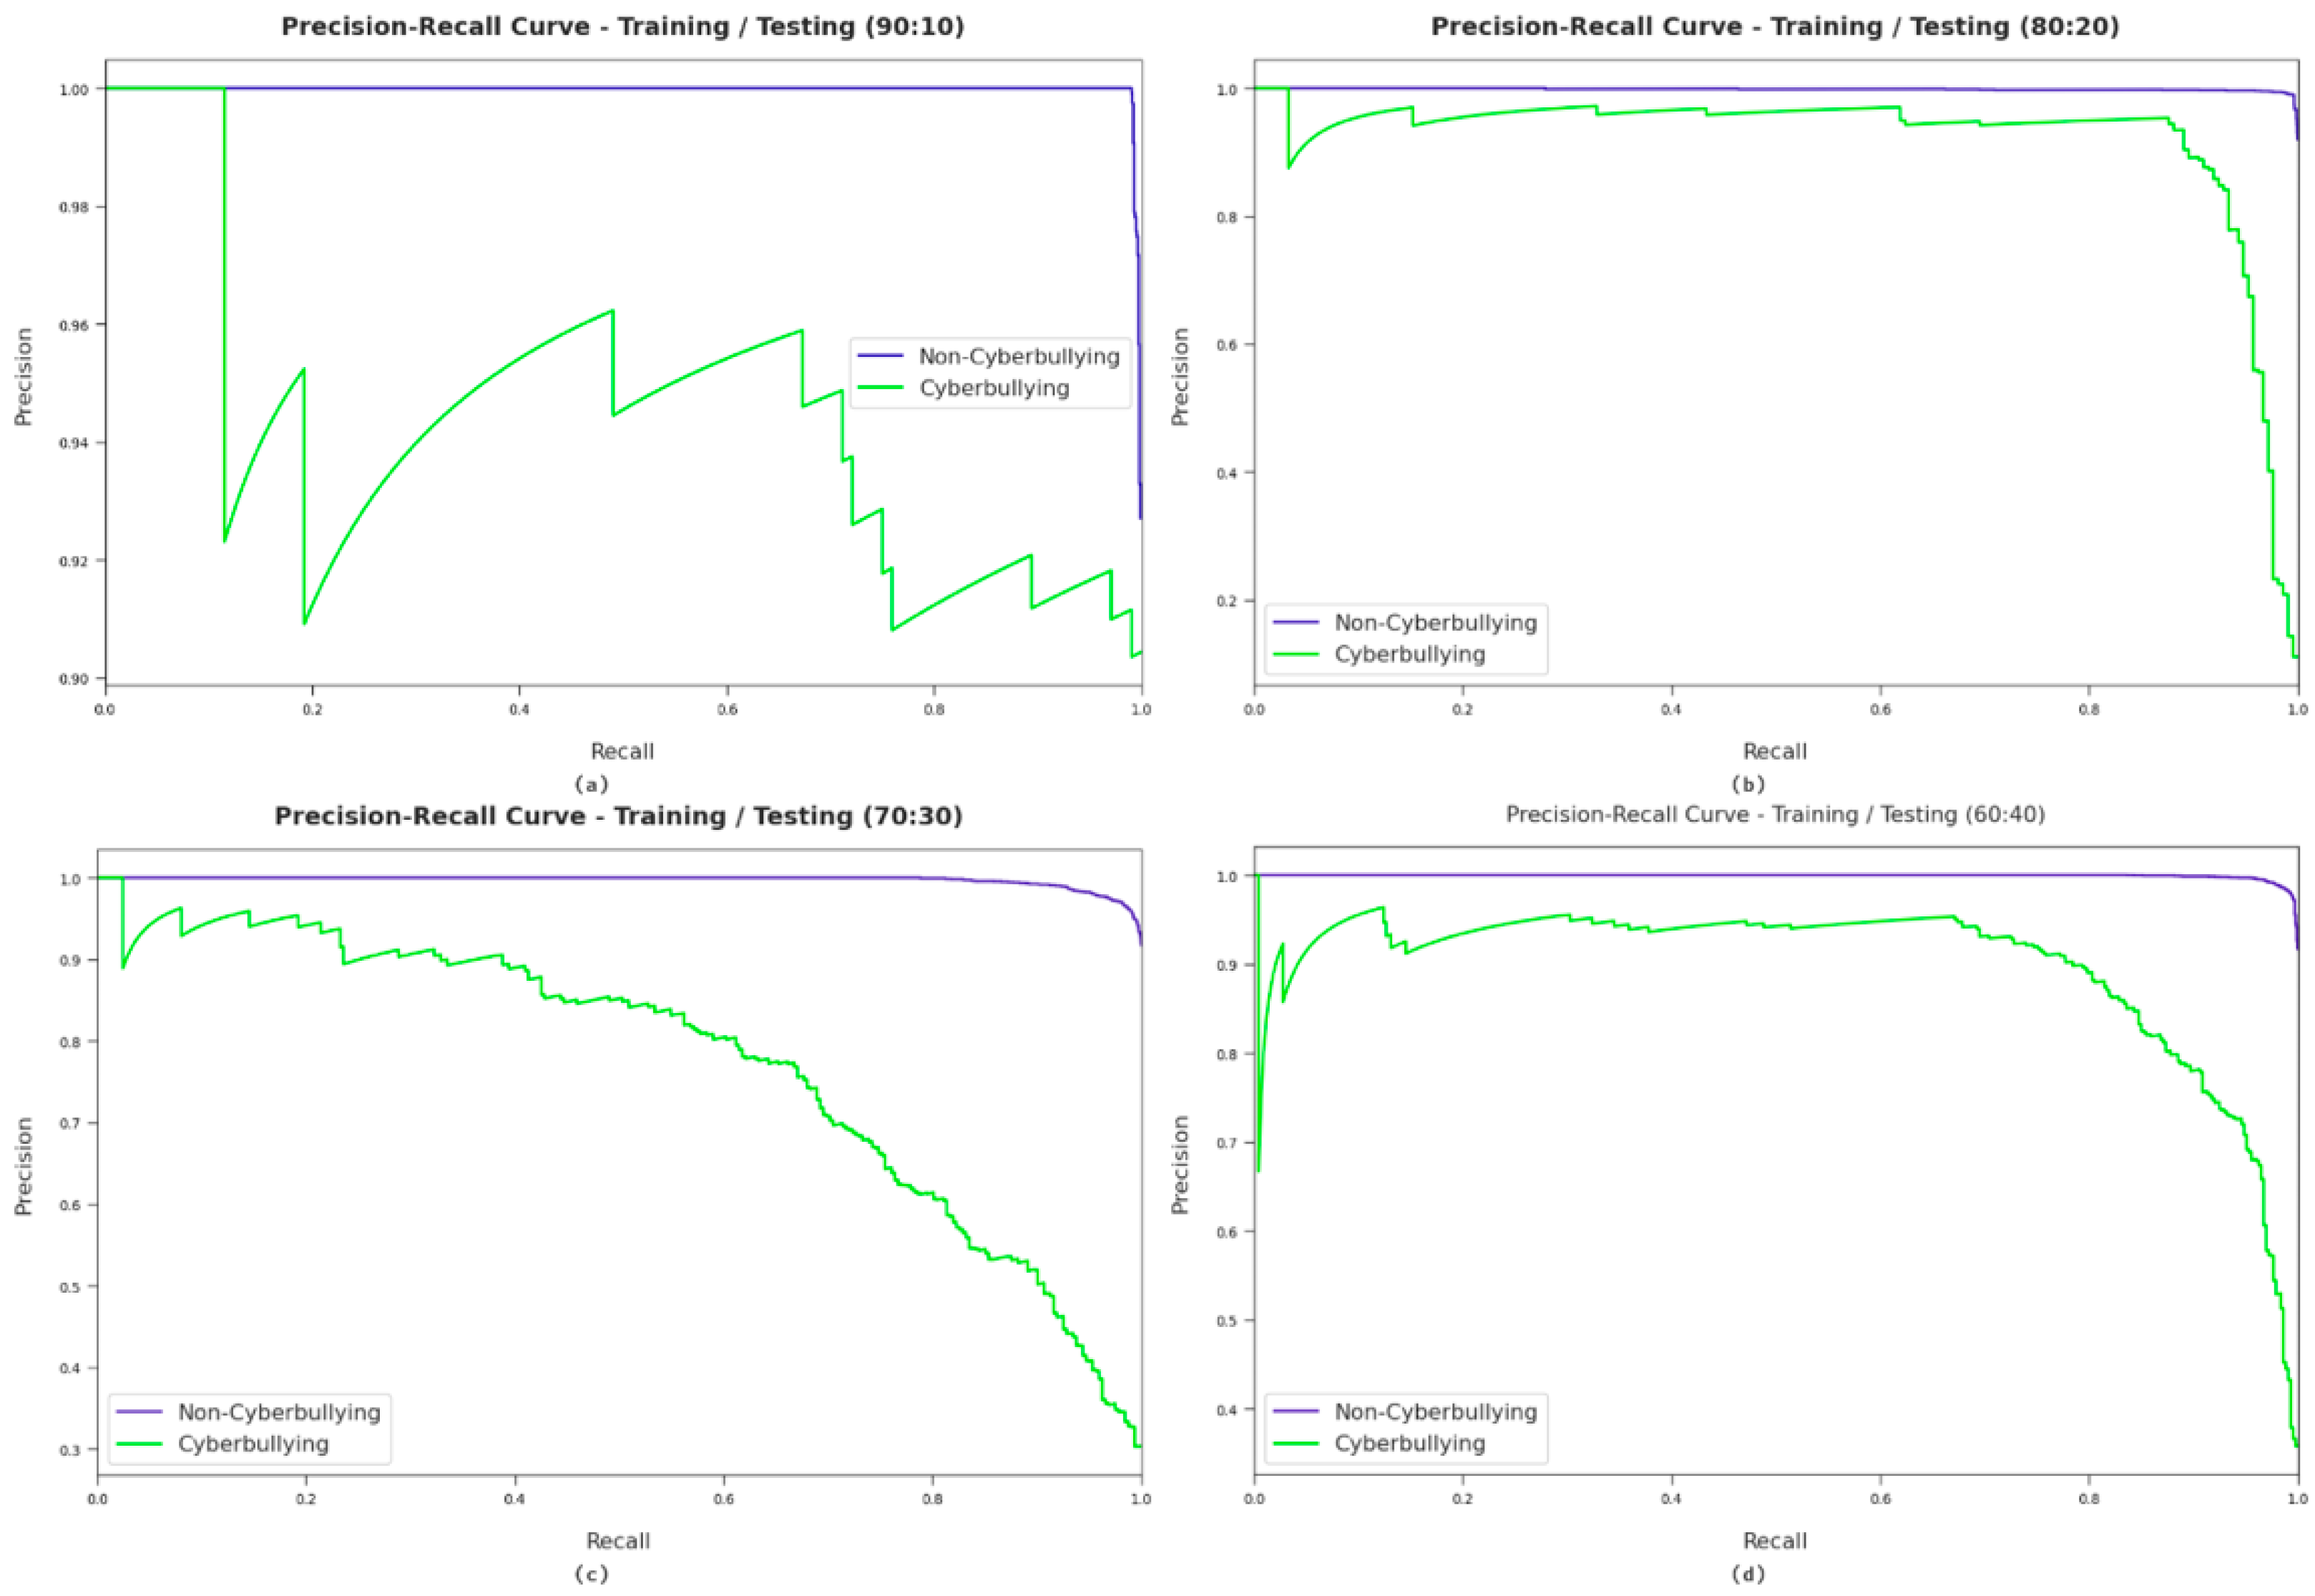
A brief precision–recall examination of the AFSA-WELM model with different training/testing dataset sizes is portrayed in Figure 4. By observing the figure, it can be noticed that the AFSA-WELM model achieved maximum precision–recall performance for all datasets. The figure shows the recall and the precision values of the four different samples.
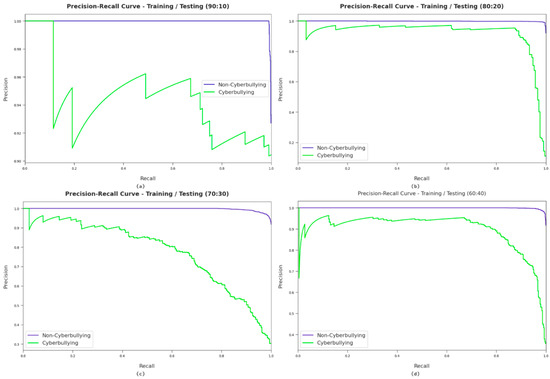
Figure 4.
Precision–recall analysis of the proposed model with different training/testing dataset sizes. Where (a) considers 90:10 training/testing data split, (b) considers 80:20 training/testing data split, (c) considers 70:30 training/testing data split, and (d) considers 60:40 training/testing data split.
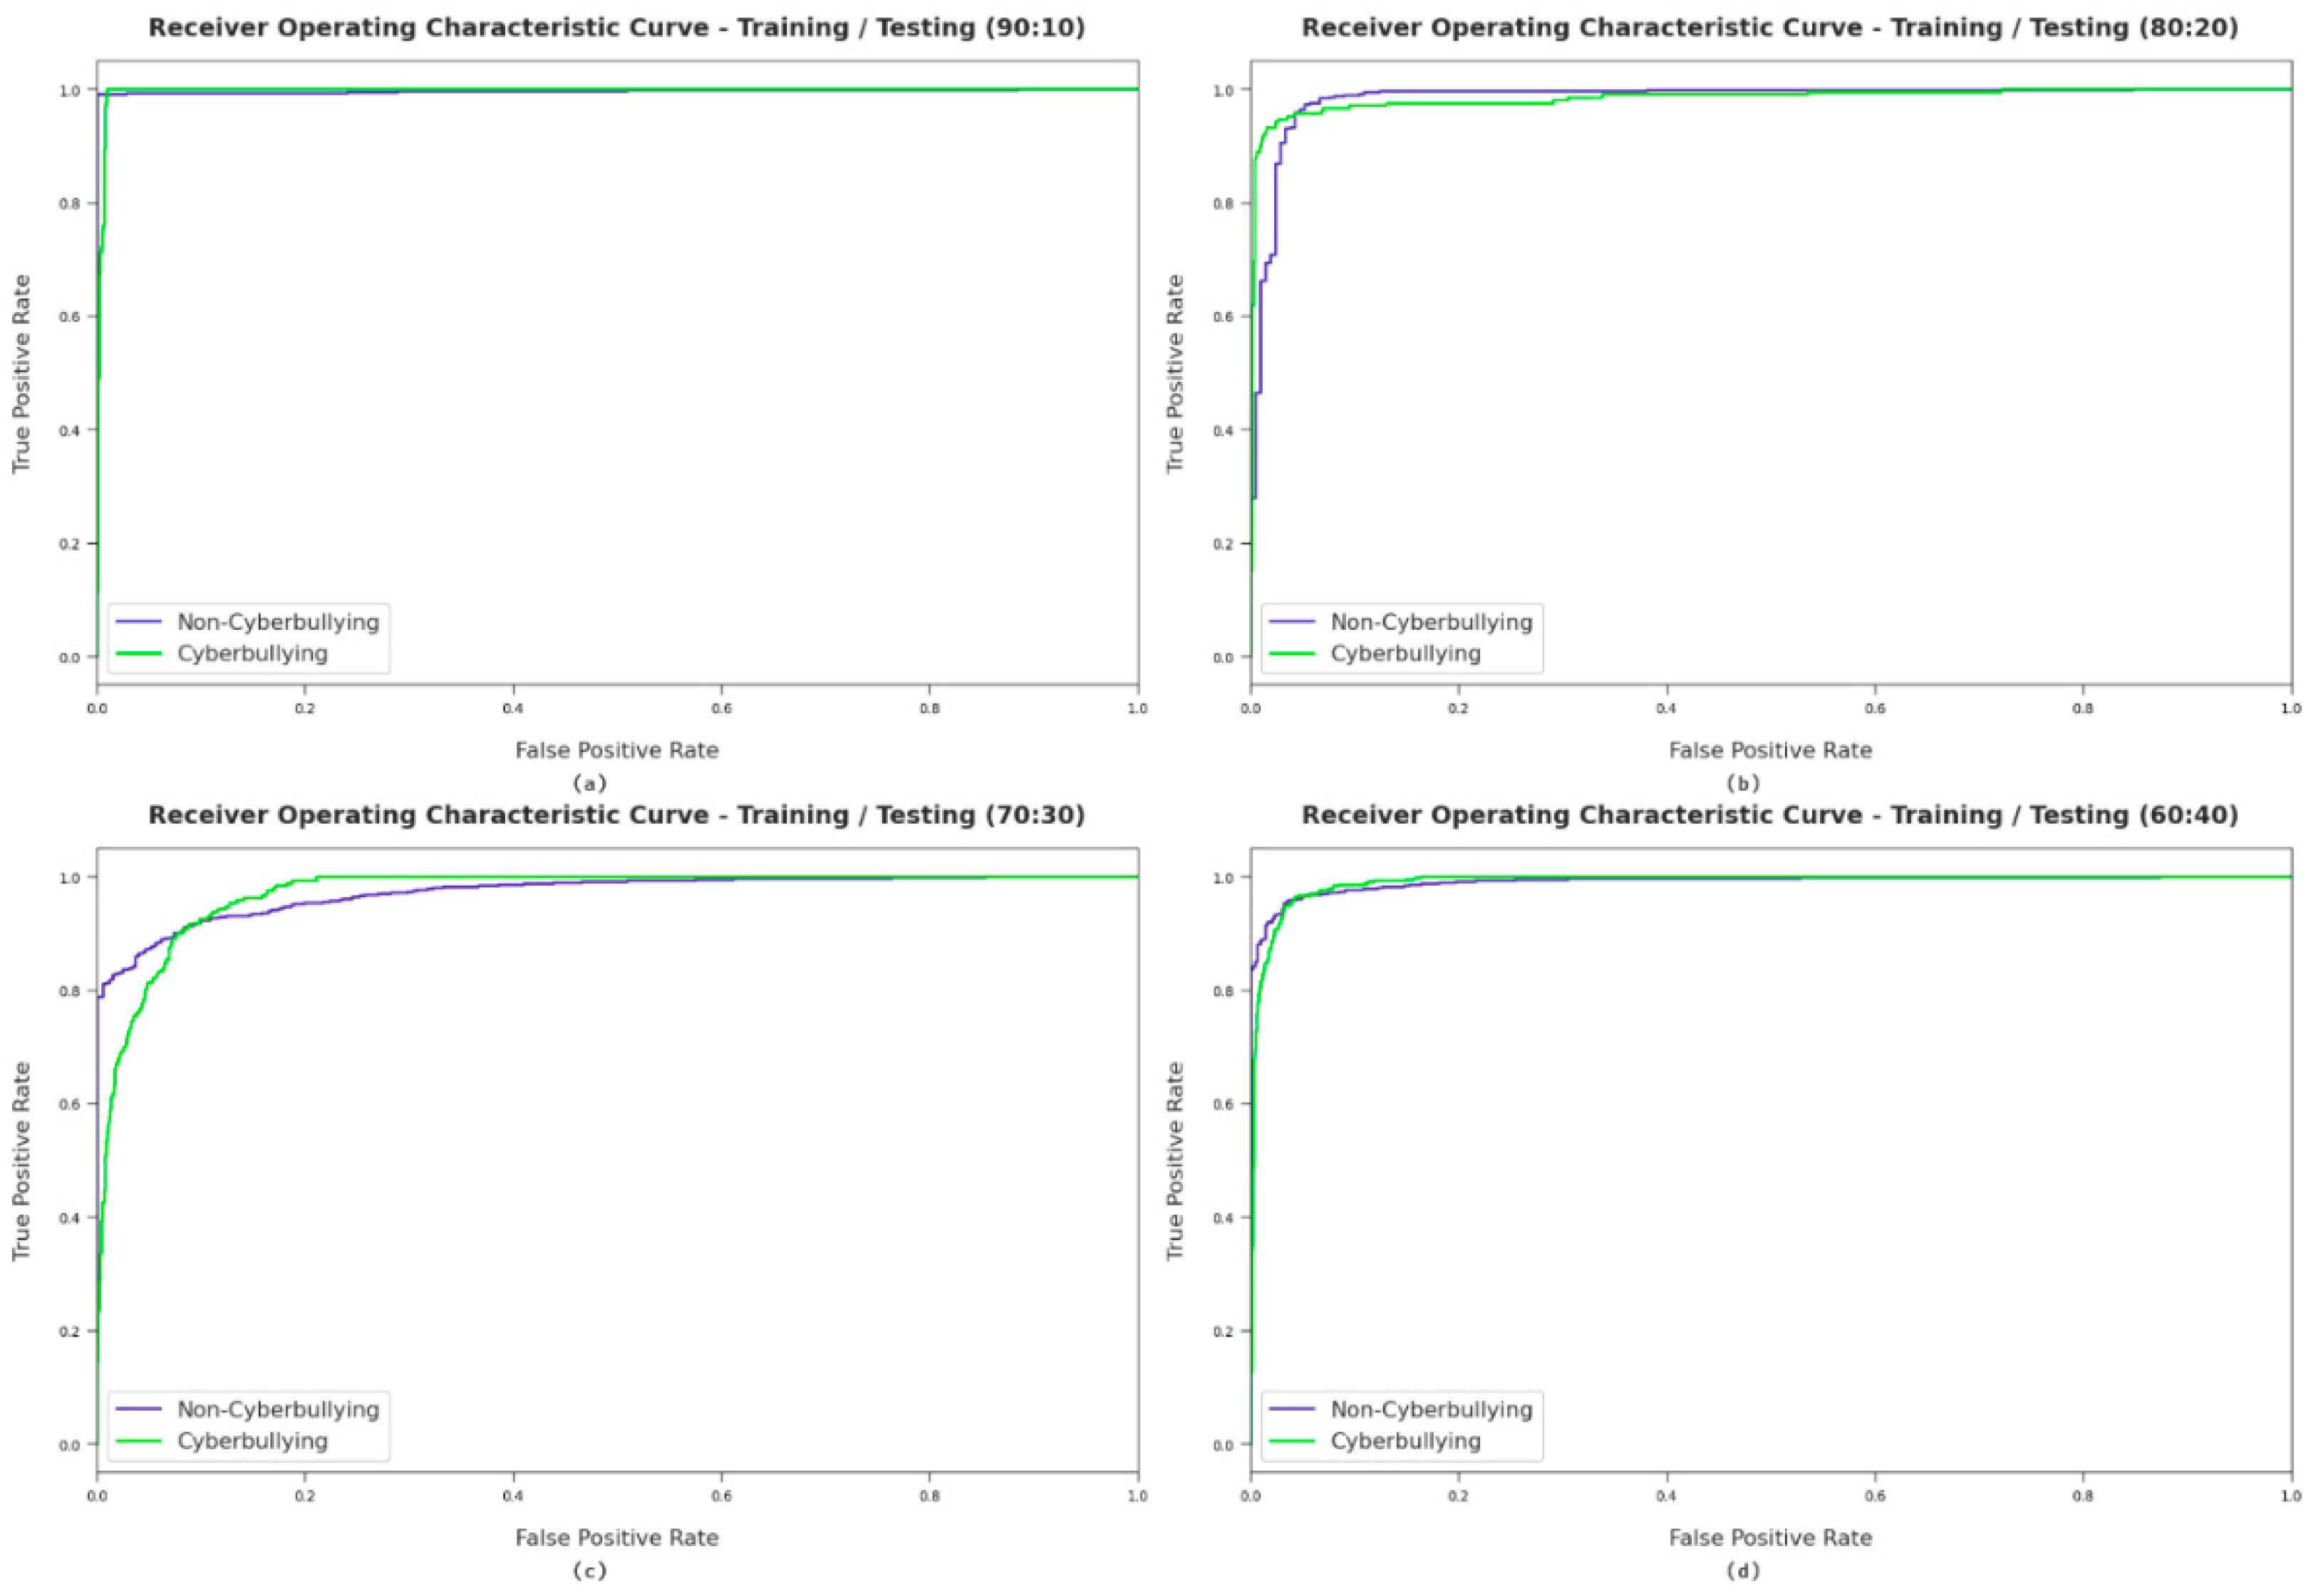
Figure 5 portrays the ROC investigation of the proposed model with different training/testing dataset sizes. The figure shows the false positive rate and the true positive rate. The figure has four different training/testing samples to verify the stability of the proposed model’s performance. The figure shows that the AFSA-WELM model produces adequate results with maximum ROC values for the different class labels.
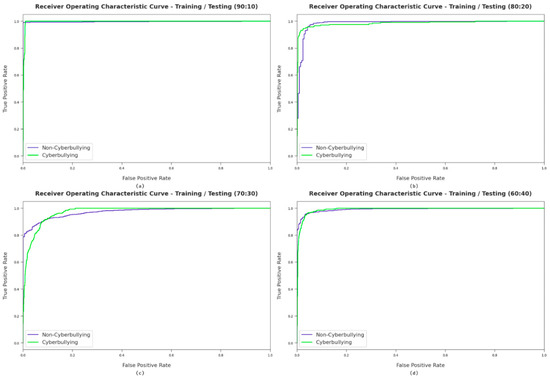
Figure 5.
The ROC analysis of the proposed model with different training/testing dataset sizes. Where (a) considers 90:10 training/testing data split, (b) considers 80:20 training/testing data split, (c) considers 70:30 training/testing data split, and (d) considers 60:40 training/testing data split.
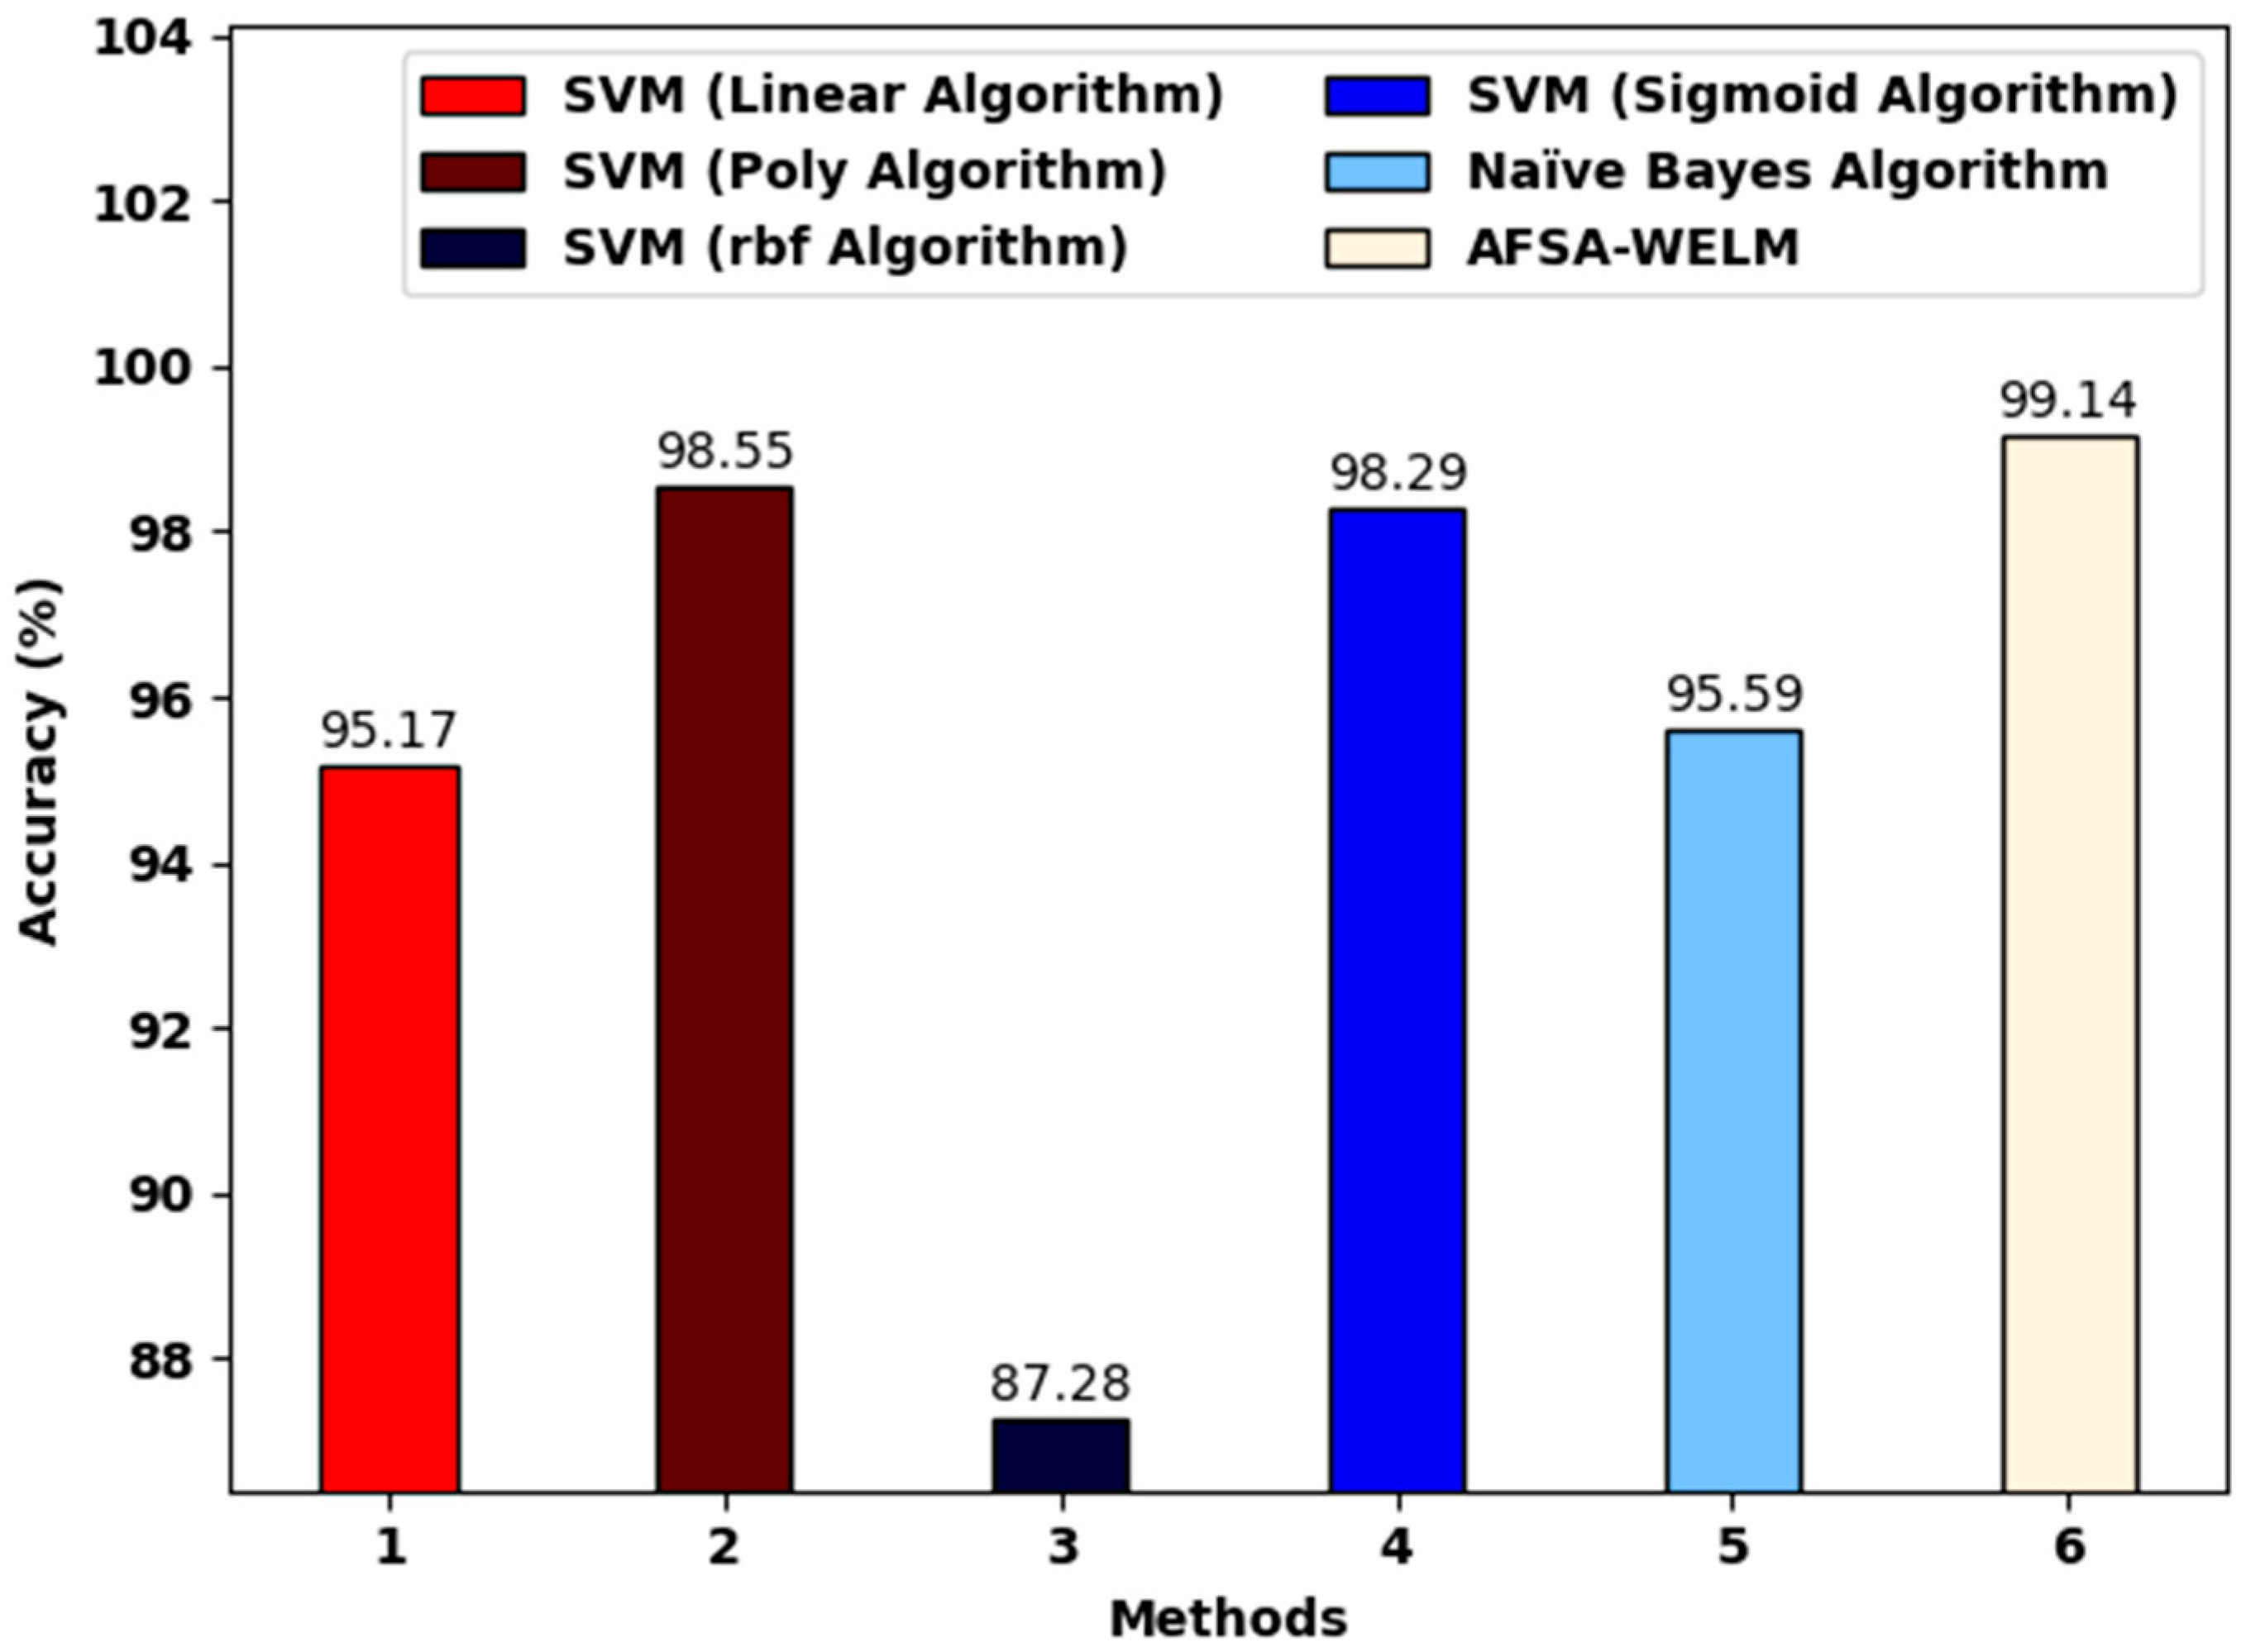
Figure 6 reports a comparative investigation of the AFSA-WELM model and existing models. The figure shows that the SVM (RBF algorithm) achieved a lower of 87.28%. Next, the SVM (linear algorithm) and the Naïve Bayes algorithm achieved a slightly increased of 95.17% and 95.59%, respectively. Along with that, the SVM (poly-algorithm) and SVM (sigmoid algorithm) models achieved a reasonable of 98.55% and 98.29%, respectively. However, the AFSA-WELM model achieved the maximum of 99.14%.
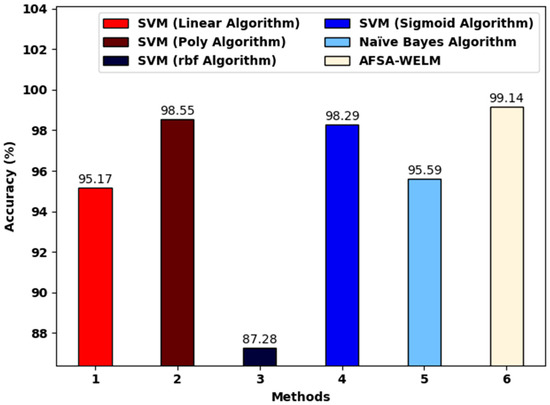
Figure 6.
The analysis of the proposed model and existing algorithms.
Figure 7 shows a comparative investigation of our proposed model and existing models. The figure portrays that the SVM (RBF algorithm) obtained a lower of 88.57%. Moreover, the SVM (linear algorithm) and the Naïve Bayes algorithm attained a slightly increased of 93.75% and 95.24%, respectively. Next, the SVM (poly-algorithm) and SVM (sigmoid algorithm) models reached a reasonable of 97.94% and 98.43%, correspondingly. Finally, the proposed method achieve a maximal of 95.22%.
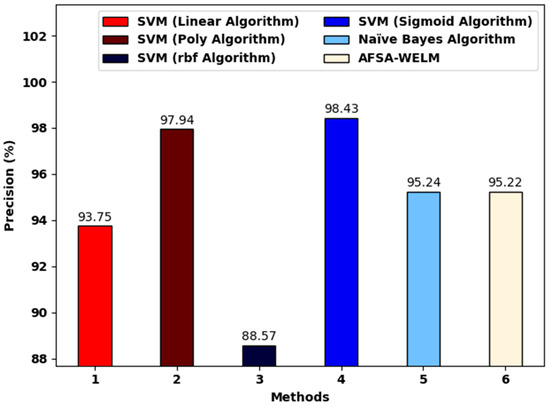
Figure 7.
The analysis of the AFSA-WELM technique and existing algorithms.
Figure 8 showcases a comparative investigation of the proposed method and existing models. The figure shows that the SVM (RBF algorithm) achieved a lower of 89.67%. Moreover, the SVM (linear algorithm) and the Naïve Bayes algorithm reached a somewhat increased of 95.07% and 96.70%, correspondingly. At the same time, the SVM (poly-algorithm) and SVM (sigmoid algorithm) models reached a reasonable of 98.795% and 98.43%, correspondingly. Finally, the proposed model achieved a maximum of 99.53%.
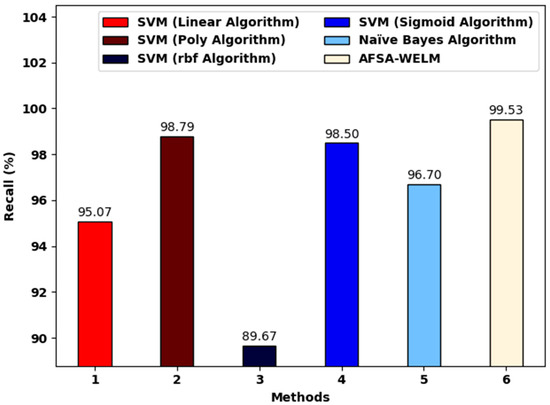
Figure 8.
The analysis of the proposed model and existing algorithms.
After examining the results and discussion, it was verified that the proposed model resulted in maximum performance in terms of the detection and classification of cyberbullying.
5. Conclusions
This study presented a novel model for cybersecurity on social media. The proposed model developed here mostly detects the existence of cyberbullying on social media. The introduced model is composed of five main stages: input, pre-processing, feature extraction, classification and identification, and parameter tuning. Our model uses an artificial fish swarm algorithm and weighted extreme machine learning to effectively detect cyberbullying on social networks. It also uses the TF-IDF model to successfully carry out the feature extraction process with the dataset. Moreover, it uses WELM and AFSA for classification and parameter tuning, respectively. The experimental results show that the developed method achieved a maximum and in comparison with the SVM and Naïve Bayes algorithms. Future extensions of this study are as follows. Deep learning models can be introduced to improve the cyberbullying detection outcomes. Moreover, an extensive comparison needs to be conducted between the proposed model and some recent models in the related literature.
Author Contributions
Conceptualization, K.R. and M.E.; methodology, K.R. and M.E.; software, K.R. and M.E.; validation, K.R. and M.E.; formal analysis, K.R. and M.E.; investigation, K.R. and M.E.; resources, K.R. and M.E.; data curation, K.R. and M.E.; writing—original draft preparation, K.R. and M.E.; writing—review and editing, K.R. and M.E.; visualization, K.R.; supervision, K.R.; project administration, K.R.; funding acquisition, K.R. All authors have read and agreed to the published version of the manuscript.
Funding
This work was supported through the Annual Funding track by the Deanship of Scientific Research, Vice Presidency for Graduate Studies and Scientific Research, King Faisal University, Saudi Arabia [Project No. AN000108].
Institutional Review Board Statement
Not applicable.
Informed Consent Statement
Not applicable.
Data Availability Statement
Not applicable.
Acknowledgments
The authors extend their appreciation to the Deanship of Scientific Research, Vice Presidency for Graduate Studies and Scientific Research, King Faisal University, Saudi Arabia, for funding this research work through the project number AN000108.
Conflicts of Interest
The authors declare that there is no conflict of interest.
References
- Kim, S.; Razi, A.; Stringhini, G.; Wisniewski, P.J.; De Choudhury, M. A Human-Centered Systematic Literature Review of Cyberbullying Detection Algorithms. Proc. ACM Hum.-Comput. Interact. 2021, 5, 1–34. [Google Scholar]
- Hall, D.L.; Silva, Y.N.; Wheeler, B.; Cheng, L.; Baumel, K. Harnessing the Power of Interdisciplinary Research with Psychology-Informed Cyberbullying Detection Models. Int. J. Bullying Prev. 2021, 4, 47–54. [Google Scholar] [CrossRef]
- Bharti, S.; Yadav, A.K.; Kumar, M.; Yadav, D. Cyberbullying detection from tweets using deep learning. Kybernetes 2021. [Google Scholar] [CrossRef]
- Perera, A.; Fernando, P. Accurate Cyberbullying Detection and Prevention on Social Media. Procedia Comput. Sci. 2021, 181, 605–611. [Google Scholar] [CrossRef]
- Arif, M. A Systematic Review of Machine Learning Algorithms in Cyberbullying Detection: Future Directions and Challenges. J. Inf. Secur. Cybercrimes Res. 2021, 4, 1–26. [Google Scholar] [CrossRef]
- Cheng, L.; Guo, R.; Silva, Y.N.; Hall, D.; Liu, H. Modeling Temporal Patterns of Cyberbullying Detection with Hierarchical Attention Networks. ACM/IMS Trans. Data Sci. 2021, 2, 1–23. [Google Scholar] [CrossRef]
- Kumar, A.; Sachdeva, N. A Bi-GRU with attention and CapsNet hybrid model for cyberbullying detection on social media. World Wide Web 2021, 1–14. [Google Scholar] [CrossRef]
- Alotaibi, M.; Alotaibi, B.; Razaque, A. A Multichannel Deep Learning Framework for Cyberbullying Detection on Social Media. Electronics 2021, 10, 2664. [Google Scholar] [CrossRef]
- Noviantho, S.I.; Ashianti, L. Cyberbullying classification using text mining. In Proceedings of the 2017 1st International Conference on Informatics and Computational Sciences (ICICoS), Semarang, Indonesia, 15–16 November 2017; pp. 241–246. [Google Scholar]
- Azeez, N.A.; Idiakose, S.O.; Onyema, C.J.; Van Der Vyver, C. Cyberbullying Detection in Social Networks: Artificial Intelligence Approach. J. Cyber Secur. Mobil. 2021, 10, 745–774. [Google Scholar] [CrossRef]
- Jain, V.; Saxena, A.K.; Senthil, A.; Jain, A.; Jain, A. Cyber-Bullying Detection in Social Media Platform using Machine Learning. In Proceedings of the 2021 10th International Conference on System Modeling & Advancement in Research Trends (SMART), Gold Coast, Australia, 16–18 December 2021; pp. 401–405. [Google Scholar]
- Bozyiğit, A.; Utku, S.; Nasibov, E. Cyberbullying detection: Utilizing social media features. Expert Syst. Appl. 2021, 179, 115001. [Google Scholar] [CrossRef]
- Kumar, A.; Sachdeva, N. Multimodal cyberbullying detection using capsule network with dynamic routing and deep convolutional neural network. Multimed. Syst. 2021, 1–10. [Google Scholar] [CrossRef]
- Rezvani, N.; Beheshti, A. Towards Attention-Based Context-Boosted Cyberbullying Detection in social media. J. Data Intell. 2021, 2, 418–433. [Google Scholar] [CrossRef]
- Fang, Y.; Yang, S.; Zhao, B.; Huang, C. Cyberbullying Detection in Social Networks Using Bi-GRU with Self-Attention Mechanism. Information 2021, 12, 171. [Google Scholar] [CrossRef]
- Rupesh, C.; Gad, R.; Gawali, P.; Gite, M.; Pawa, A.B. Hate Speech Detection on Social Media Using Machine Learning Algorithms. J. Cogn. Hum.-Comput. Interact. 2022, 2, 56–59. [Google Scholar] [CrossRef]
- Zhang, C.; Zhang, F.M.; Li, F.; Wu, H.S. Improved artificial fish swarm algorithm. In Proceedings of the 2014 9th IEEE Conference on Industrial Electronics and Applications, Tianjin, China, 14–16 August 2014; pp. 748–753. [Google Scholar]
- Dey, A.; Jenamani, M.; Thakkar, J.J. Lexical TF-IDF: An n-gram feature space for cross-domain classification of sentiment reviews. In Pattern Recognition and Machine Intelligence; Springer: Cham, Switzerland, 2017; pp. 380–386. [Google Scholar]
- Zhu, H.; Liu, G.; Zhou, M.; Xie, Y.; Abusorrah, A.; Kang, Q. Optimizing Weighted Extreme Learning Machines for imbalanced classification and application to credit card fraud detection. Neurocomputing 2020, 407, 50–62. [Google Scholar] [CrossRef]
- Liu, Z.; Tang, D.; Cai, Y.; Wang, R.; Chen, F. A hybrid method based on ensemble WELM for handling multi class imbalance in cancer microarray data. Neurocomputing 2017, 266, 641–650. [Google Scholar] [CrossRef]
- Neshat, M.; Sepidnam, G.; Sargolzaei, M.; Toosi, A.N. Artificial fish swarm algorithm: A survey of the state-of-the-art, hybridization, combinatorial and indicative applications. Artif. Intell. Rev. 2014, 42, 965–997. [Google Scholar] [CrossRef]


Publisher’s Note: MDPI stays neutral with regard to jurisdictional claims in published maps and institutional affiliations. |
© 2022 by the authors. Licensee MDPI, Basel, Switzerland. This article is an open access article distributed under the terms and conditions of the Creative Commons Attribution (CC BY) license (https://creativecommons.org/licenses/by/4.0/).