
Daytime Lipid Metabolism Modulated by CLOCK Gene Is Linked to Retinal Ganglion Cells Damage in Glaucoma

 ,
,  , ,
, , 
Abstract
:Featured Application
Abstract
1. Introduction
2. Results
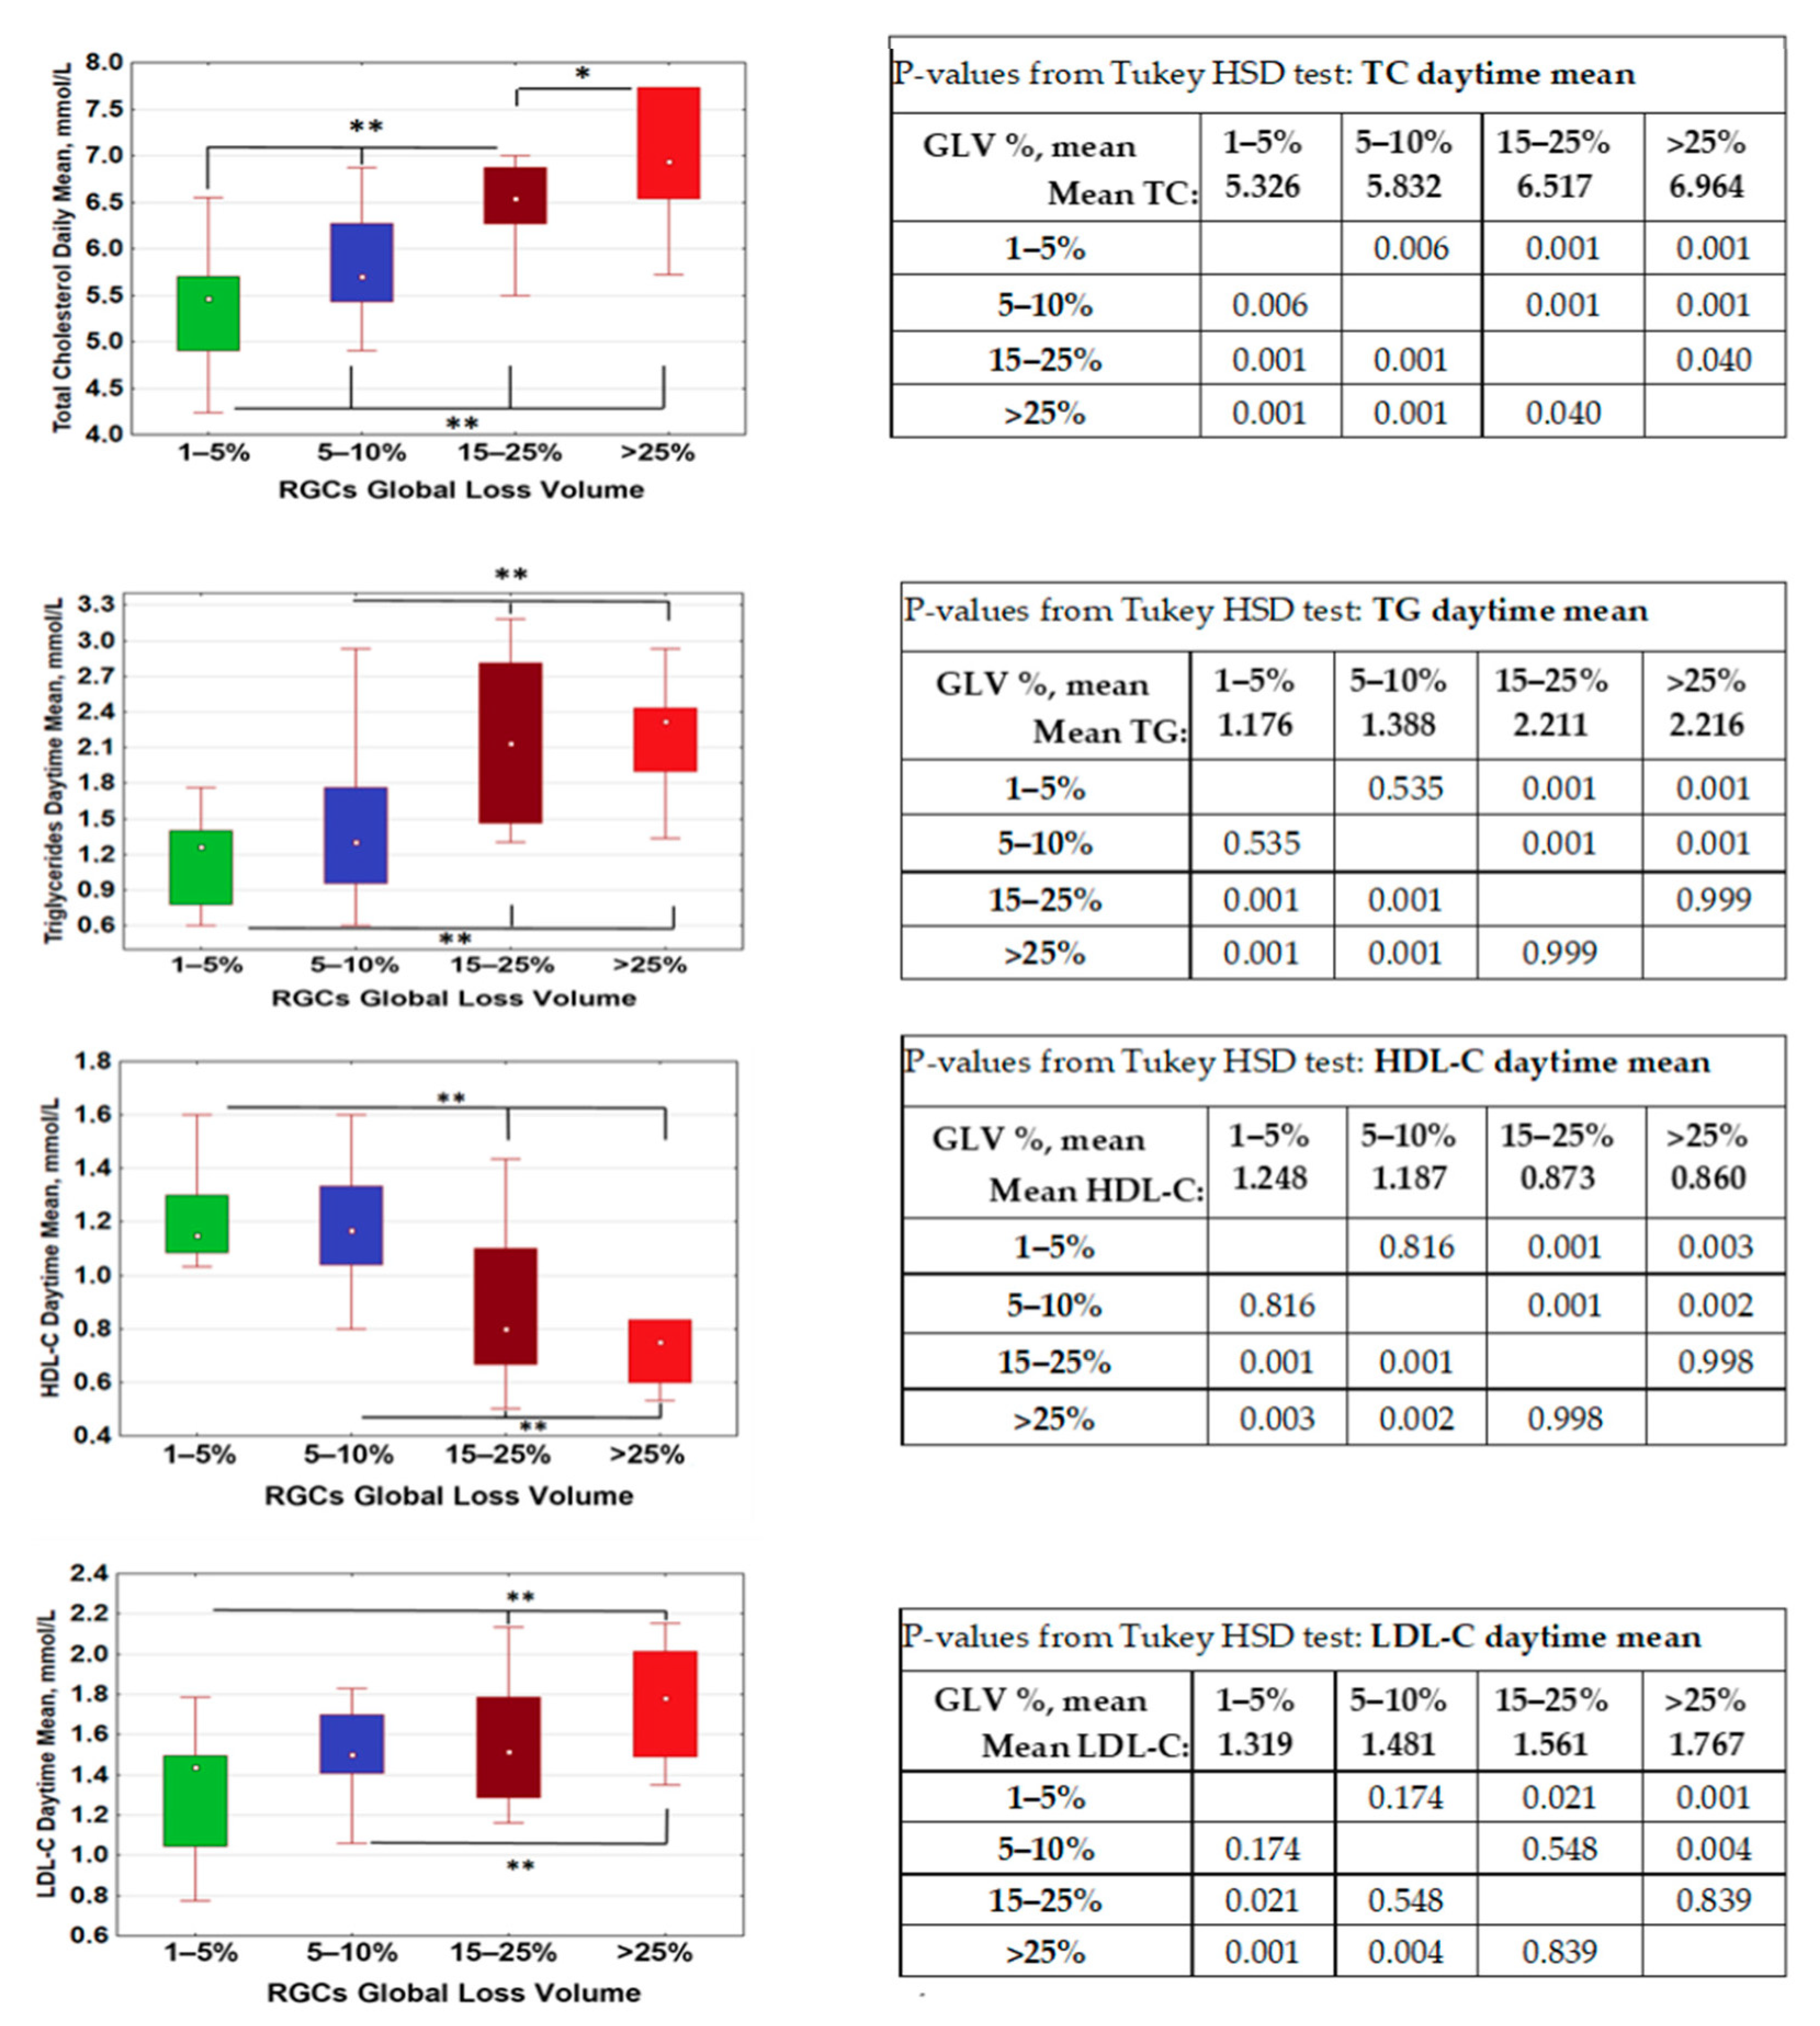
2.1. Lipid Metabolism Was Associated with Retinal Ganglion Cells Loss
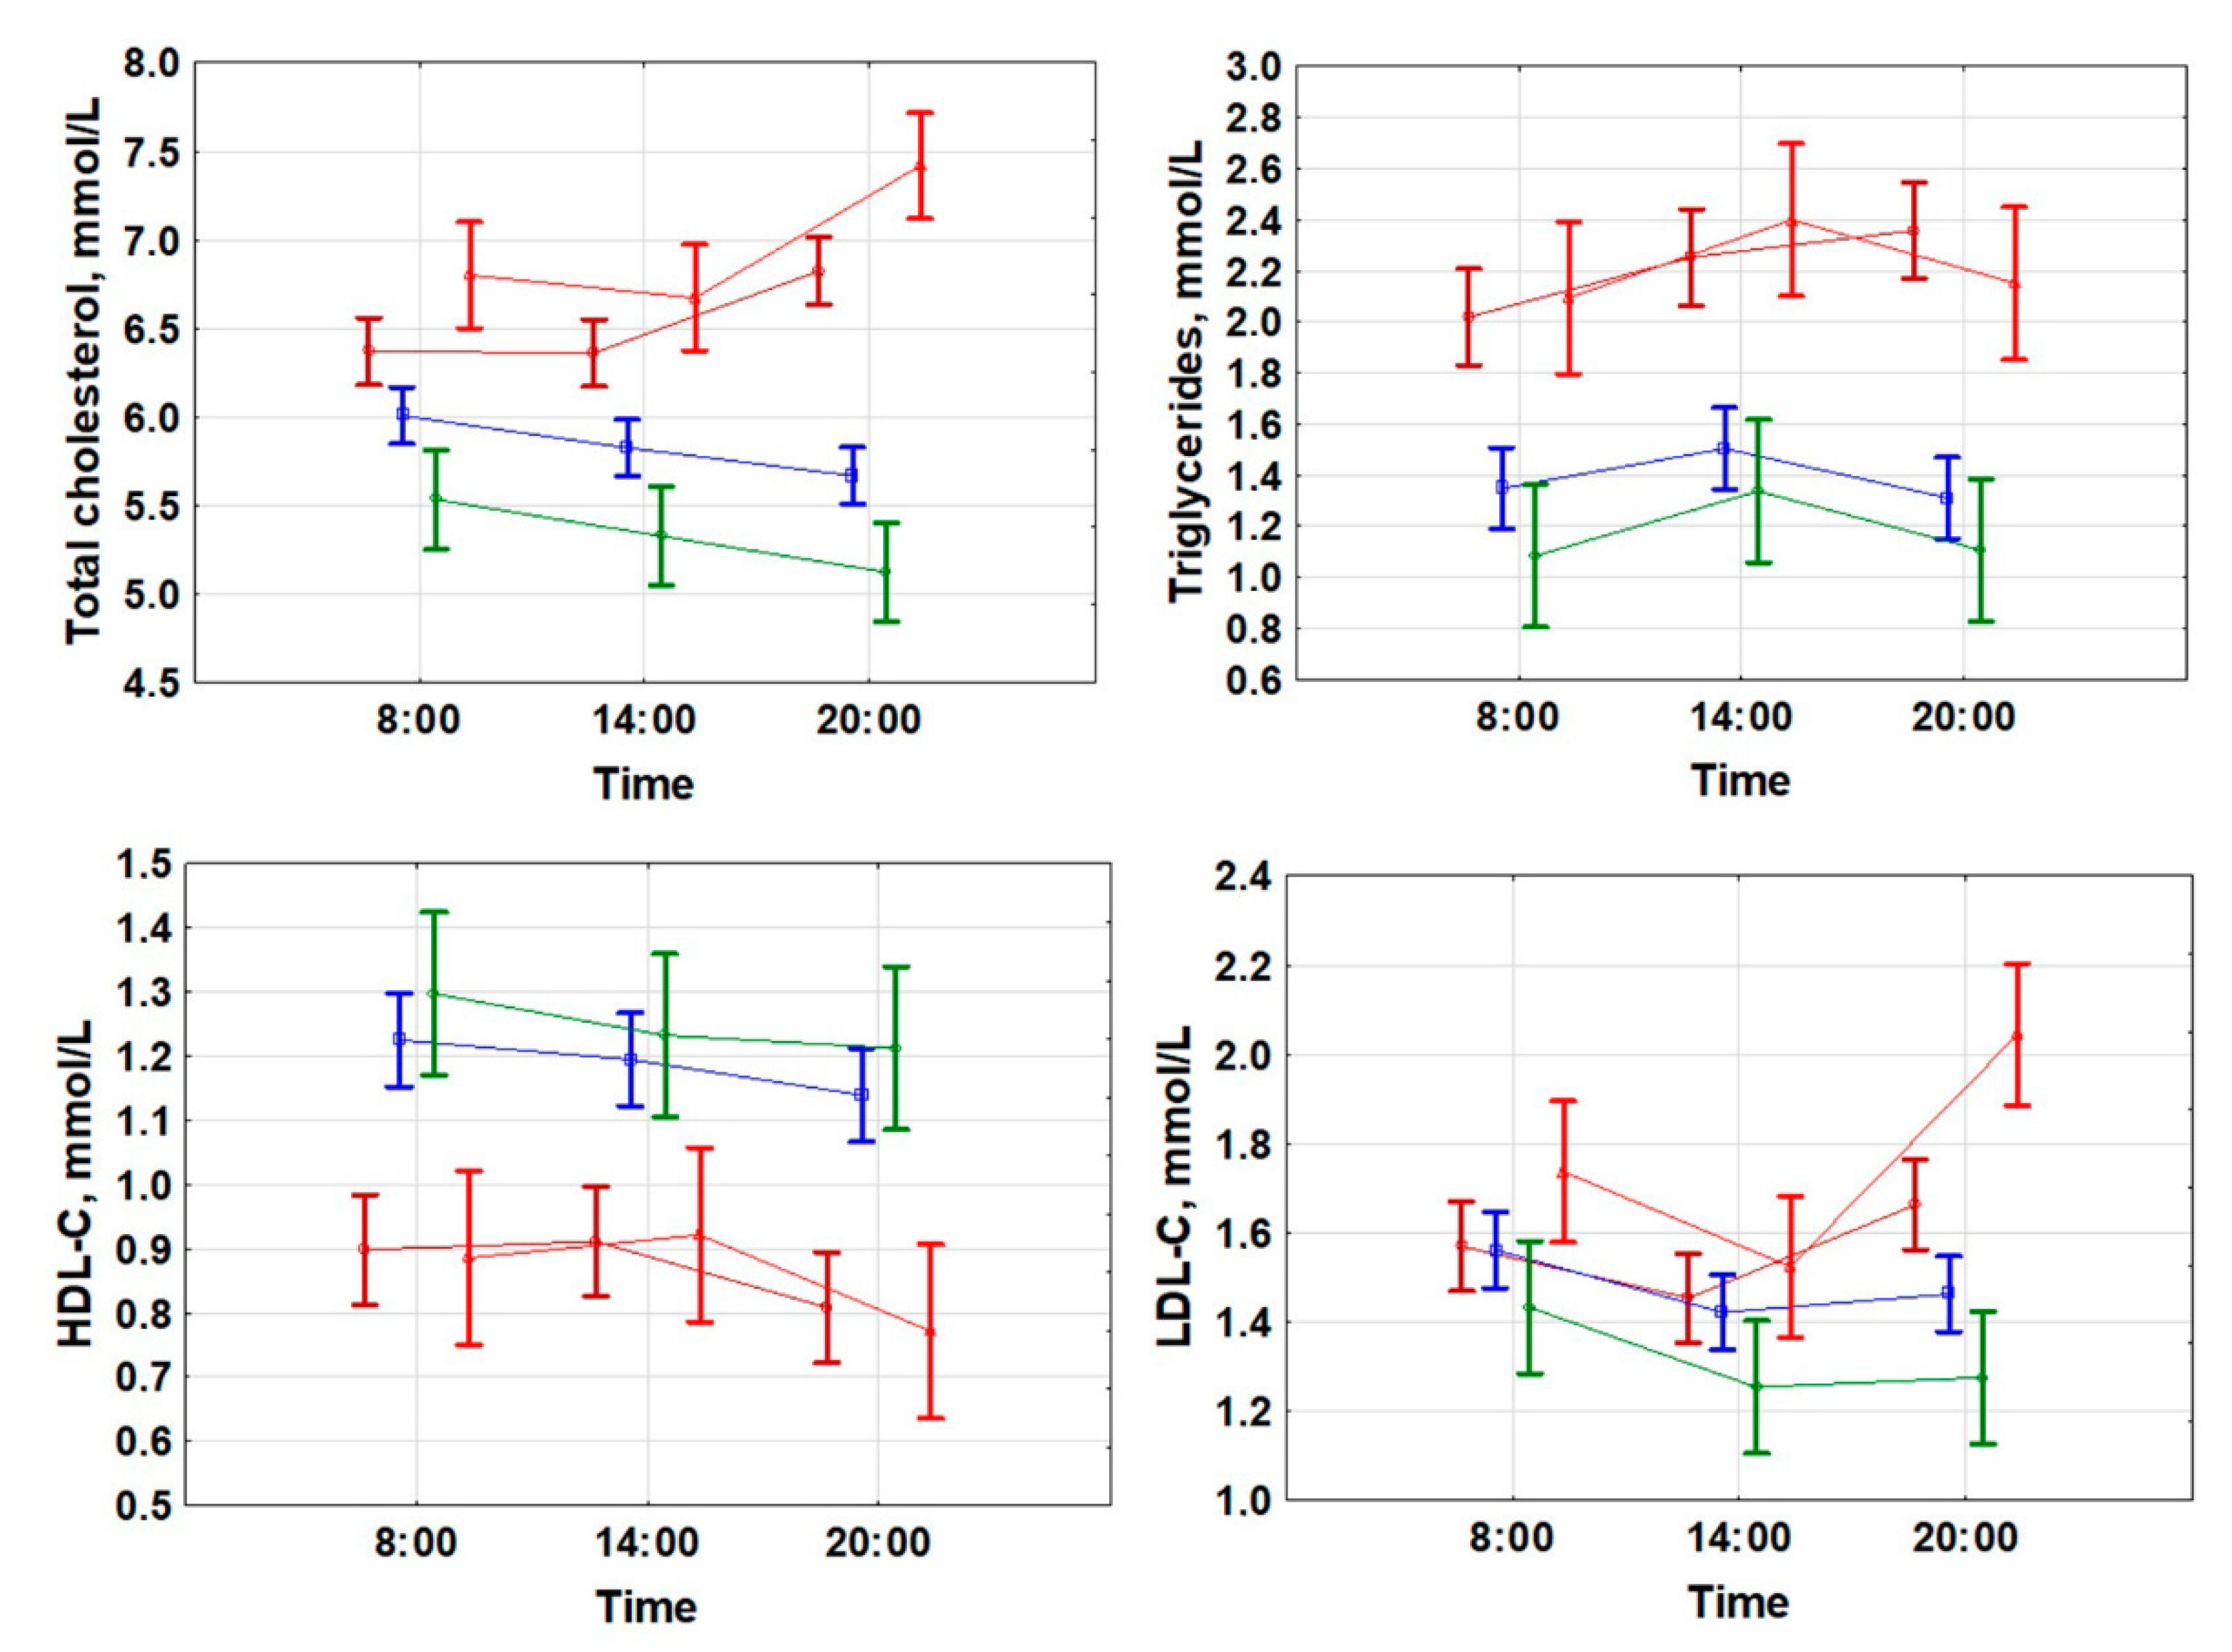
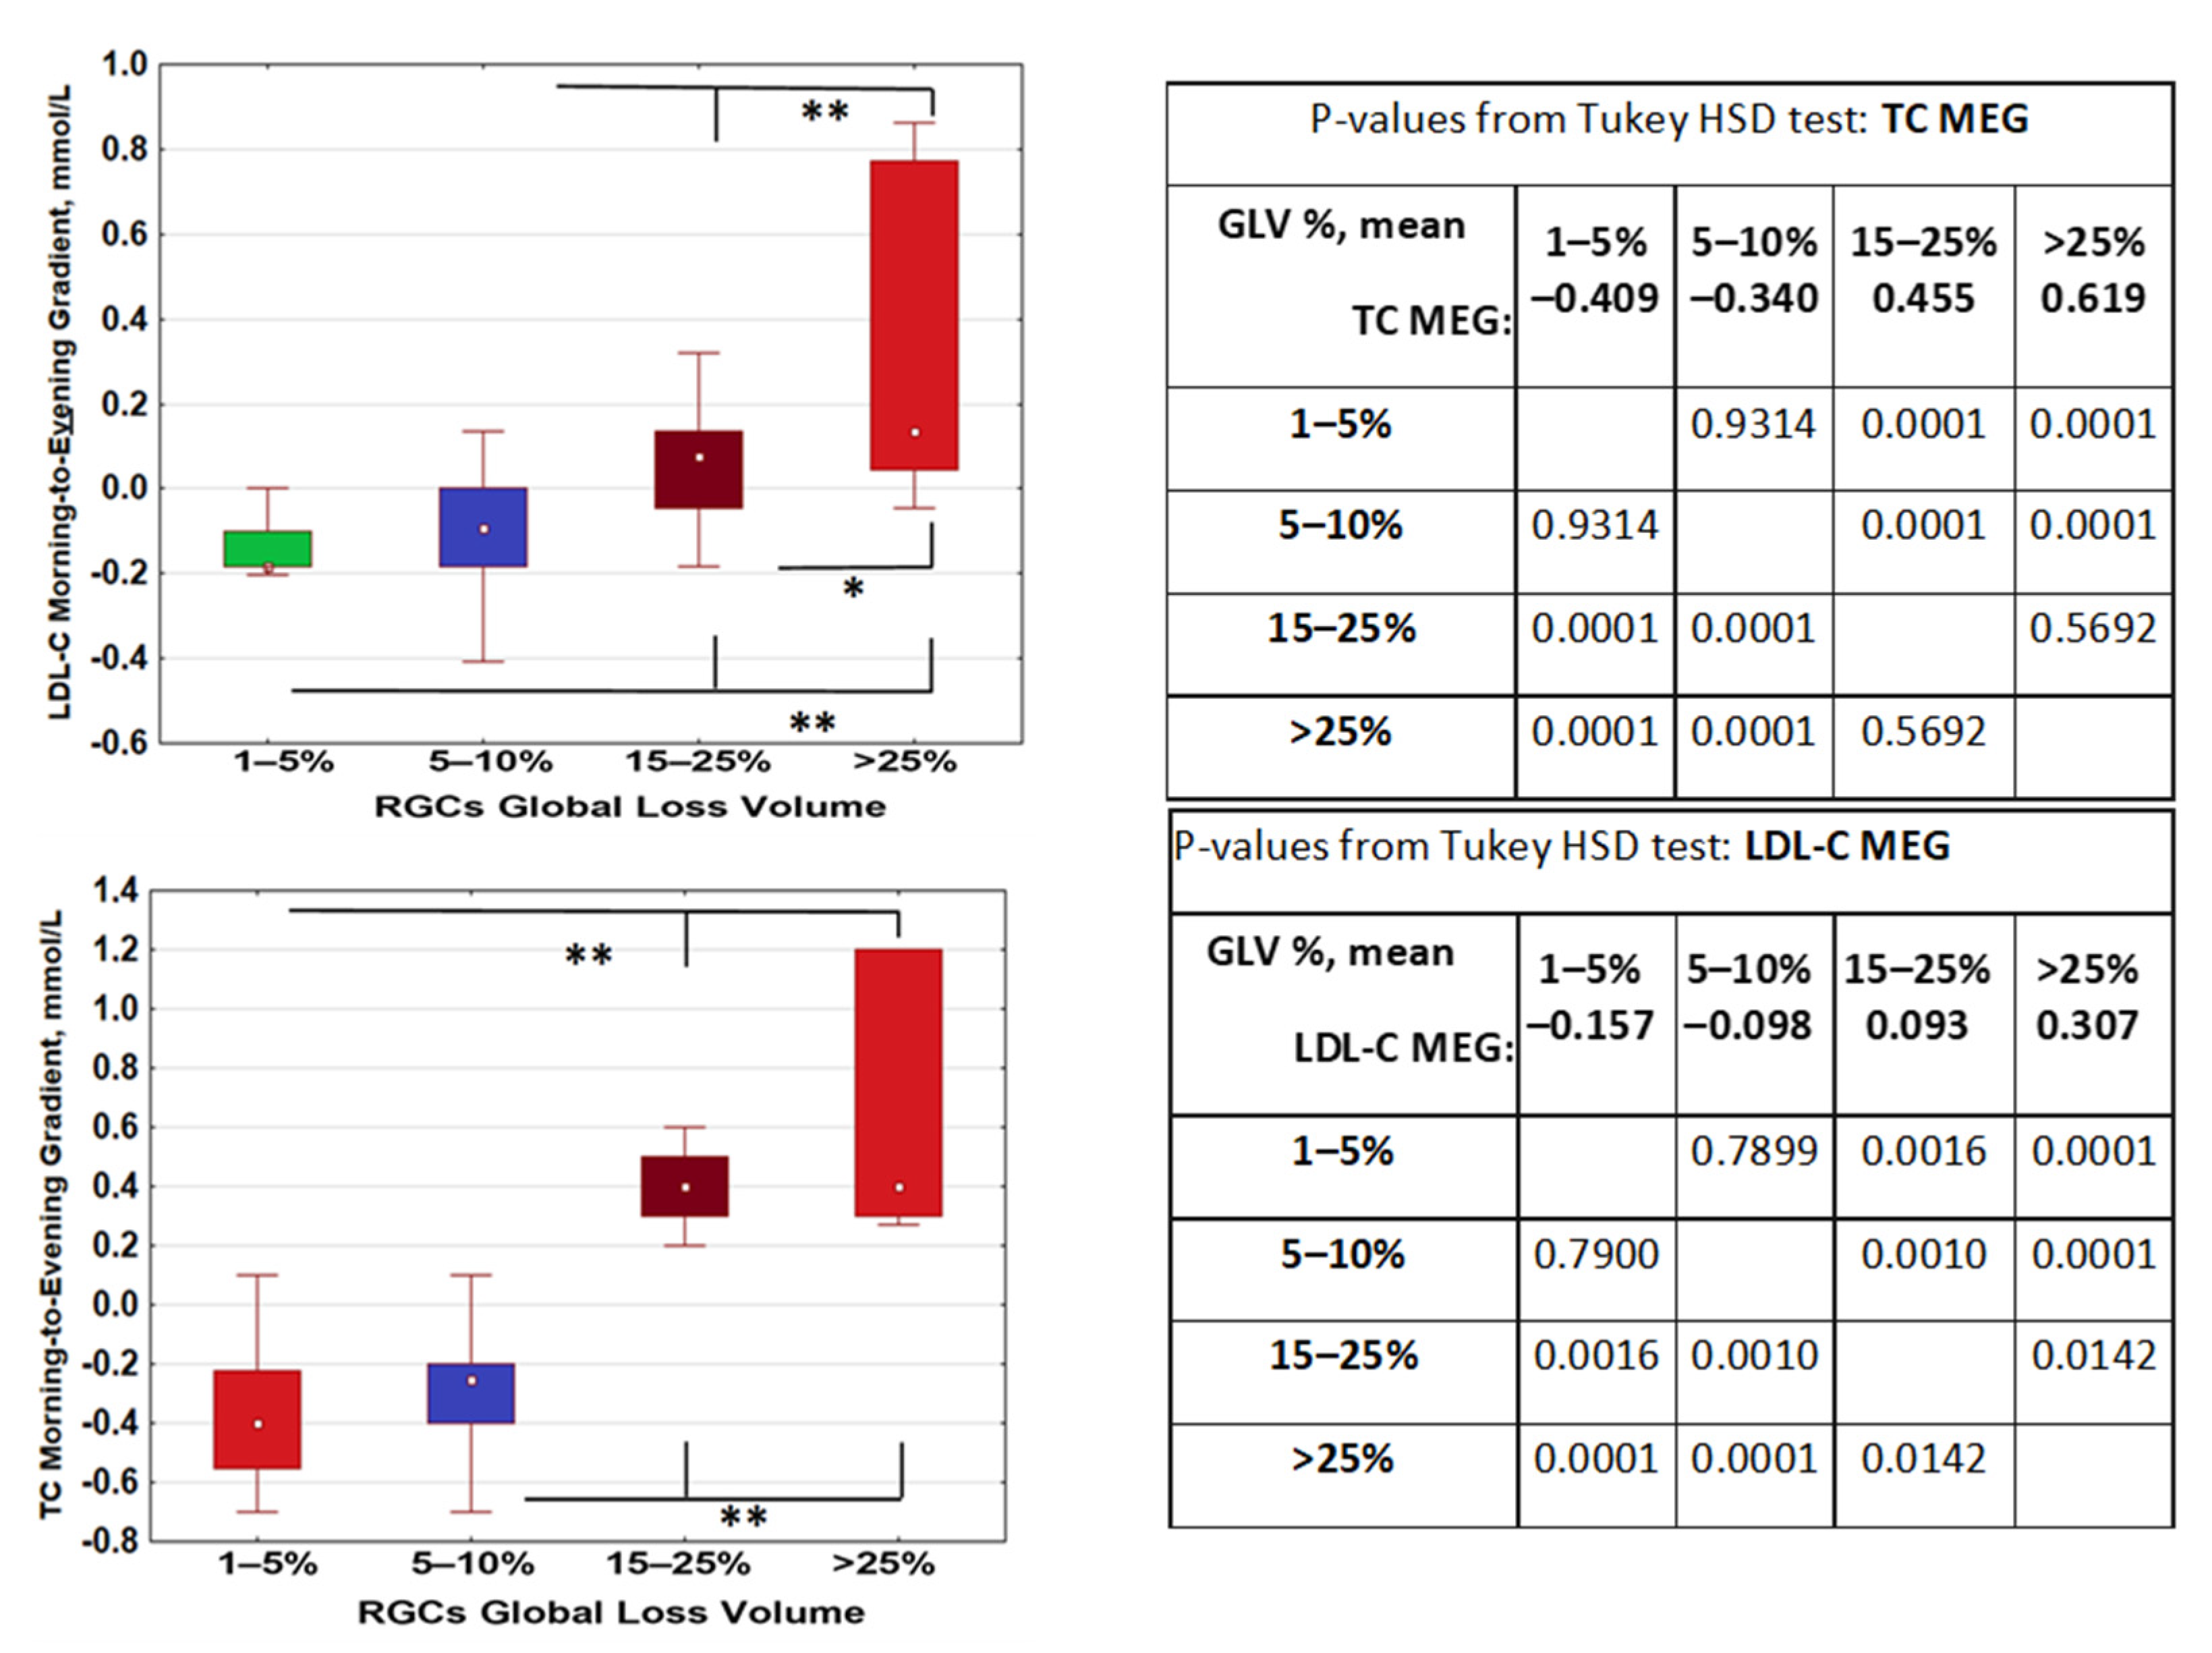
2.2. Changes of Lipid Metabolism during the Day Depend on RGC Loss. Evening–Morning Gradient of Cholesterol and Low-Density Lipids Was Associated with Retinal Ganglion Cells Loss
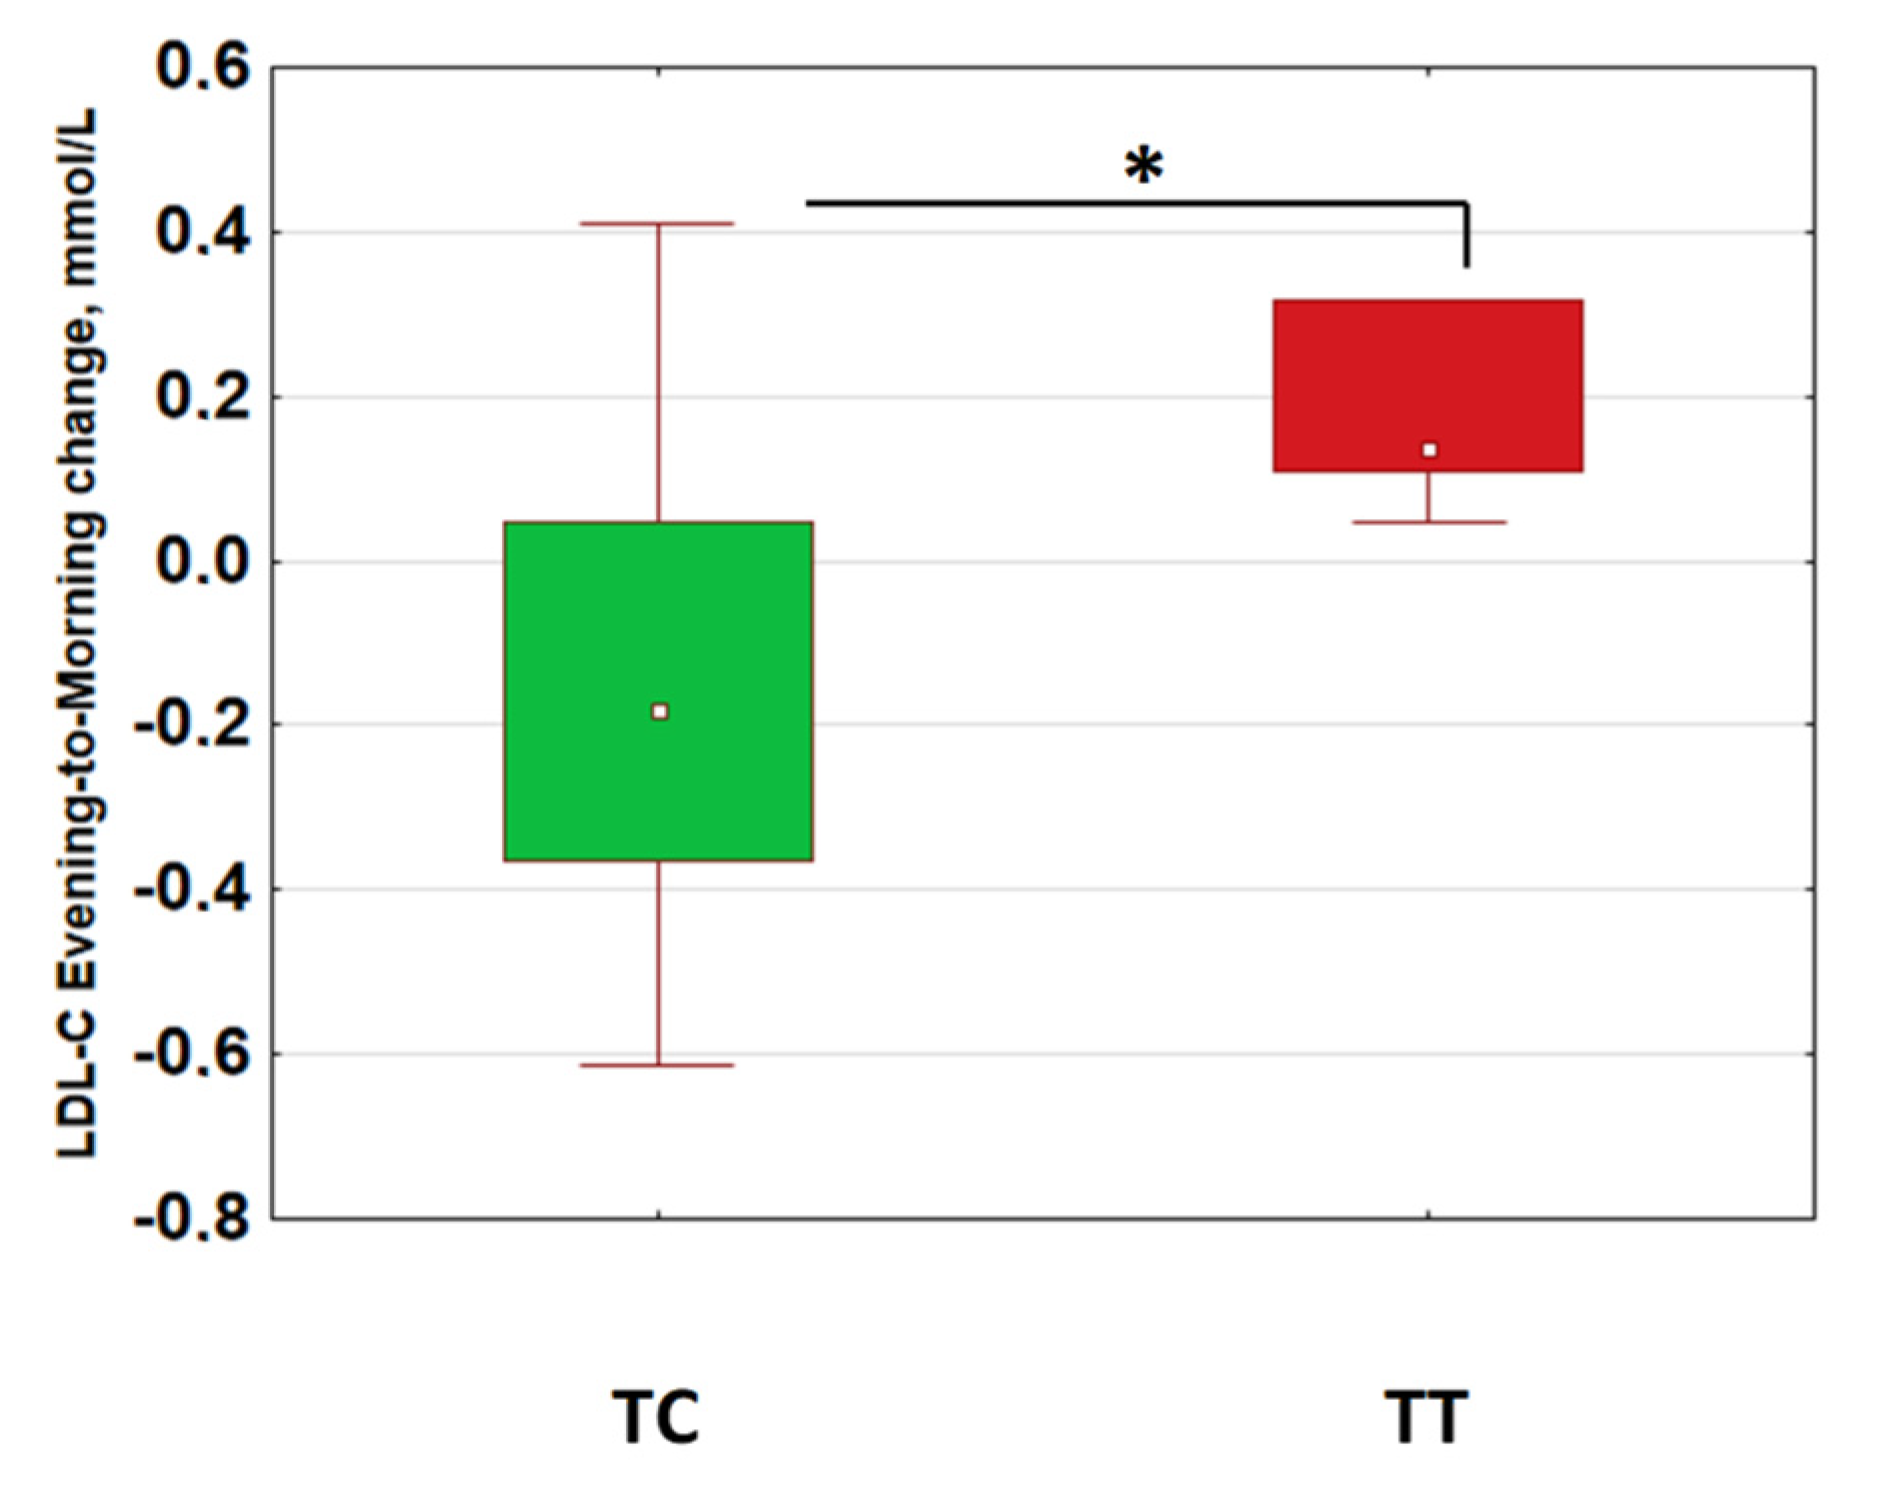
2.3. Morning–Evening Gradient of Low-Density Lipids Was Linked to Retinal Ganglion Cell Loss and CLOCK Gene Polymorphism
3. Discussion
4. Materials and Methods
4.1. POAG Diagnosis and Progression Criteria
4.2. RGC Damage Assessment
4.3. Plasma Lipid Assessment
4.4. Salivary Melatonin Assessment
4.5. Genotyping
4.6. Data Analysis
5. Conclusions
Supplementary Materials
Author Contributions
Funding
Institutional Review Board Statement
Informed Consent Statement
Data Availability Statement
Conflicts of Interest
Abbreviations
| A-POAG | Advanced primary open-angle glaucoma |
| GLV | Global loss volume |
| HDL-C | High-density lipid cholesterol |
| LDL-C | Low-density lipid cholesterol |
| MEG | Morning–evening gradient |
| POAG | Primary open-angle glaucoma |
| RNFL | Retinal nerve fiber layer |
| RGCs | Retinal ganglion cells |
| TC | Total cholesterol |
| TG | Triglycerides |
| SAP | Standard automated perimetry |
| SNP | Single nucleotide polymorphisms |
| S-POAG | Stable primary open-angle glaucoma |
References
- Green, C.B.; Takahashi, J.S.; Bass, J. The meter of metabolism. Cell 2008, 134, 728–742. [Google Scholar] [CrossRef] [PubMed] [Green Version]
- Marcheva, B.; Ramsey, K.M.; Affinati, A.; Bass, J. Clock genes and metabolic disease. J. Appl. Physiol. 2009, 107, 1638–1646. [Google Scholar] [CrossRef] [PubMed] [Green Version]
- Solt, L.A.; Kojetin, D.J.; Burris, P.T. The REV-ERBs and RORs: Molecular links between circadian rhythms and lipid homeostasis. Future Med. Chem. 2011, 5, 623–638. [Google Scholar] [CrossRef] [PubMed] [Green Version]
- Sahar, S.; Sassone-Corsi, P. Regulation of metabolism: The circadian clock dictates the time. Trends Endocrinol. Metab. 2012, 23, 1–8. [Google Scholar] [CrossRef] [PubMed] [Green Version]
- Maury, E.; Hong, H.K.; Bass, J. Circadian disruption in the pathogenesis of metabolic syndrome. Diabetes Metab. 2014, 40, 338–346. [Google Scholar] [CrossRef] [PubMed]
- Gnocchi, D.; Pedrelli, M.; Hurt-Camejo, E.; Parini, P. Lipids around the Clock: Focus on Circadian Rhythms and Lipid Metabolism. Biology 2015, 4, 104–132. [Google Scholar] [CrossRef] [Green Version]
- Kumar Jha, P.; Challet, E.; Kalsbeek, A. Circadian rhythms in glucose and lipid metabolism in nocturnal and diurnal mammals. Mol. Cell. Endocrinol. 2015, 418, 74–88. [Google Scholar] [CrossRef] [Green Version]
- Gooley, J.J. Circadian regulation of lipid metabolism. Proc. Nutr. Soc. 2016, 75, 440–450. [Google Scholar] [CrossRef]
- Potter, G.D.; Skene, D.J.; Arendt, J.; Cade, J.E.; Grant, P.J.; Hardie, L.J. Circadian Rhythm and Sleep Disruption: Causes, Metabolic Consequences, and Countermeasures. Endocr. Rev. 2016, 37, 584–608. [Google Scholar] [CrossRef] [Green Version]
- Poggiogalle, E.; Jamshed, H.; Peterson, C.M. Circadian regulation of glucose, lipid, and energy metabolism in humans. Metabolism 2018, 84, 11–27. [Google Scholar] [CrossRef] [Green Version]
- Cornelissen, G. Altered circadian energy metabolism and chronobiological risk factors of chronic diseases. In The Role of Functional Food Security in Global Health; Watson, R., Singh, R., Takahashi, T., Eds.; Elsevier: Amsterdam, The Netherlands, 2019; pp. 513–524. [Google Scholar]
- Cornelissen, G. Circadian disruption and metabolic disease risk. In Functional Foods and Nutraceuticals in Metabolic and Non-Communicable Diseases; Singh, R., Watanabe, S., Isaza, A., Eds.; Elsevier: Amsterdam, The Netherlands, 2022; pp. 513–524. [Google Scholar]
- Okuliarova, M.; Rumanova, V.S.; Stebelova, K.; Zeman, M. Dim Light at Night Disturbs Molecular Pathways of Lipid Metabolism. Int. J. Mol. Sci. 2020, 21, 6919. [Google Scholar] [CrossRef] [PubMed]
- Kessler, K.; Gerl, M.J.; Hornemann, S.; Damm, M.; Klose, C.; Petzke, K.J.; Kemper, M.; Weber, D.; Rudovich, N.; Grune, T.; et al. Shotgun Lipidomics Discovered Diurnal Regulation of Lipid Metabolism Linked to Insulin Sensitivity in Nondiabetic Men. J. Clin. Endocrinol. Metab. 2020, 105, dgz176. [Google Scholar] [CrossRef] [PubMed]
- Kent, B.A.; Rahman, S.A.; Hilaire, M.A., St.; Grant, L.K.; Rüger, M.; Czeisler, C.A.; Lockley, S.W. Circadian lipid and hepatic protein rhythms shift with a phase response curve different than melatonin. Nat. Commun. 2022, 13, 681. [Google Scholar] [CrossRef]
- Sihota, R.; Saxena, R.; Gogoi, M.; Sood, A.; Gulati, V.; Pandey, R.M. A comparison of the circadian rhythm of intraocular pressure in primary phronic angle closure glaucoma, primary open angle glaucoma and normal eyes. Indian J. Ophthalmol. 2005, 53, 243–247. [Google Scholar] [CrossRef] [PubMed]
- Neroev, V.; Malishevskaya, T.; Weinert, D.; Astakhov, S.; Kolomeichuk, S.; Cornelissen, G.; Kabitskaya, Y.; Boiko, E.; Nemtsova, I.; Gubin, D. Disruption of 24-Hour Rhythm in Intraocular Pressure Correlates with Retinal Ganglion Cell Loss in Glaucoma. Int. J. Mol. Sci. 2020, 22, 359. [Google Scholar] [CrossRef]
- Drouyer, E.; Dkhissi-Benyahya, O.; Chiquet, C.; WoldeMussie, E.; Ruiz, G.; Wheeler, L.A.; Denis, P.; Cooper, H.M. Glaucoma alters the circadian timing system. PLoS ONE 2008, 3, e3931. [Google Scholar] [CrossRef] [Green Version]
- Gubin, D.; Neroev, V.; Malishevskaya, T.; Cornelissen, G.; Astakhov, S.Y.; Kolomeichuk, S.; Yuzhakova, N.; Kabitskaya, Y.; Weinert, D. Melatonin mitigates disrupted circadian rhythms, lowers intraocular pressure, and improves retinal ganglion cells function in glaucoma. J. Pineal Res. 2021, 70, e12730. [Google Scholar] [CrossRef] [PubMed]
- Gubin, D.G.; Malishevskaya, T.N.; Astakhov, Y.S.; Astakhov, S.Y.; Cornelissen, G.; Kuznetsov, V.A.; Weinert, D. Progressive retinal ganglion cell loss in primary open-angle glaucoma is associated with temperature circadian rhythm phase delay and compromised sleep. Chronobiol. Int. 2019, 36, 564–577. [Google Scholar] [CrossRef]
- Gubin, D.; Weinert, D. Melatonin, circadian rhythms and glaucoma: Current perspective. Neural Regen. Res. 2022, 17, 1759–1760. [Google Scholar] [CrossRef]
- Gracitelli, C.P.; Duque-Chica, G.L.; Roizenblatt, M.; Moura, A.L.; Nagy, B.V.; de Melo, G.R.; Borba, P.D.; Teixeira, S.H.; Tufik, S.; Ventura, D.F.; et al. Intrinsically photosensitive retinal ganglion cell activity is associated with decreased sleep quality in patients with glaucoma. Ophthalmology 2015, 122, 1139–1148. [Google Scholar] [CrossRef]
- Wang, H.; Zhang, Y.; Ding, J.; Wang, N. Changes in the circadian rhythm in patients with primary glaucoma. PLoS ONE 2013, 8, e62841. [Google Scholar] [CrossRef] [PubMed] [Green Version]
- Wright, K.P., Jr.; McHill, A.W.; Birks, B.R.; Griffin, B.R.; Rusterholz, T.; Chinoy, E.D. Entrainment of the human circadian clock to the natural light-dark cycle. Curr. Biol. 2013, 23, 1554–1558. [Google Scholar] [CrossRef] [PubMed] [Green Version]
- Roenneberg, T.; Merrow, M. The Circadian Clock and Human Health. Curr. Biol. 2016, 26, R432–R443. [Google Scholar] [CrossRef] [PubMed]
- Swaminathan, K.; Klerman, E.B.; Phillips, A.J.K. Are Individual Differences in Sleep and Circadian Timing Amplified by Use of Artificial Light Sources? J. Biol. Rhythm. 2017, 32, 165–176. [Google Scholar] [CrossRef]
- Moreno, C.R.C.; Wright, K., Jr.; Skene, D.J.; Louzada, F.M. Phenotypic plasticity of circadian entrainment under a range of light conditions. Neurobiol. Sleep Circadian Rhythm. 2020, 9, 100055. [Google Scholar] [CrossRef]
- Korman, M.; Tkachev, V.; Reis, C.; Komada, Y.; Kitamura, S.; Gubin, D.; Kumar, V.; Roenneberg, T. Outdoor daylight exposure and longer sleep promote wellbeing under COVID-19 mandated restrictions. J. Sleep Res. 2022, 31, e13471. [Google Scholar] [CrossRef]
- Kawasaki, A.; Udry, M.; El Wardani, M.; Münch, M. Can Extra Daytime Light Exposure Improve Well-Being and Sleep? A Pilot Study of Patients with Glaucoma. Front. Neurol. 2021, 11, 584479. [Google Scholar] [CrossRef]
- Ockene, I.S.; Chiriboga, D.E.; Stanek, E.J., 3rd; Harmatz, M.G.; Nicolosi, R.; Well, A.D.; Freedson, P.; Merriam, P.A.; Reed, G.; Ma, Y.; et al. Seasonal variation in serum cholesterol levels: Treatment implications and possible mechanisms. Arch. Intern. Med. 2004, 164, 863–870. [Google Scholar] [CrossRef] [Green Version]
- Ma, X.; Yan, H.; Zhang, H.; Wang, M.; Zhang, Q.; Zhou, X. Progress in the seasonal variations of blood lipids: A mini-review. Lipids Health Dis. 2020, 19, 108. [Google Scholar] [CrossRef]
- Ahlers, I.; Ahlersová, E.; Kapuriková, K.; Toropila, M.; Smajda, B. Influence of the light regimen on the circadian rhythm of serum lipids in the laboratory rat. Physiol. Bohemoslov. 1982, 31, 75–82. [Google Scholar]
- Fan, X.; Chen, D.; Wang, Y.; Tan, Y.; Zhao, H.; Zeng, J.; Li, Y.; Guo, X.; Qiu, H.; Gu, Y. Light intensity alters the effects of light-induced circadian disruption on glucose and lipid metabolism in mice. Am. J. Physiol. Endocrinol. Metab. 2022, 322, E1–E9. [Google Scholar] [CrossRef] [PubMed]
- Wang, S.; Bao, X. Hyperlipidemia, Blood Lipid Level, and the Risk of Glaucoma: A Meta-Analysis. Investig. Ophthalmol. Vis. Sci. 2019, 60, 1028–1043. [Google Scholar] [CrossRef] [PubMed] [Green Version]
- Betzler, B.K.; Rim, T.H.; Sabanayagam, C.; Cheung, C.M.G.; Cheng, C.Y. High-Density Lipoprotein Cholesterol in Age-Related Ocular Diseases. Biomolecules 2020, 10, 645. [Google Scholar] [CrossRef] [PubMed]
- Pertl, L.; Mossböck, G.; Wedrich, A.; Weger, M.; Königsbrügge, O.; Silbernagel, G.; Posch, F. Triglycerides and Open Angle Glaucoma—A Meta-analysis with meta-regression. Sci. Rep. 2017, 7, 7829. [Google Scholar] [CrossRef] [Green Version]
- Posch-Pertl, L.; Michelitsch, M.; Wagner, G.; Wildner, B.; Silbernagel, G.; Pregartner, G.; Wedrich, A. Cholesterol and glaucoma: A systematic review and meta-analysis. Acta Ophthalmol. 2022, 100, 148–158. [Google Scholar] [CrossRef]
- Semenova, N.; Madaeva, I.; Kolesnikov, S.; Rychkova, L.; Bairova, T.; Darenskaya, M.; Kolesnikova, L. CLOCK 3111TT Genotype Is Associated with Increased Total Cholesterol and Low-Density Lipoprotein Levels in Menopausal Women with a Body Mass Index of at Least 25 kg/m2. Pathophysiology 2021, 28, 1–9. [Google Scholar] [CrossRef]
- Pérez-Rico, C.; de la Villa, P.; Arribas-Gómez, I.; Blanco, R. Evaluation of functional integrity of the retinohypothalamic tract in advanced glaucoma using multifocal electroretinography and light-induced melatonin suppression. Exp. Eye Res. 2010, 91, 578–583. [Google Scholar] [CrossRef]
- Feigl, B.; Mattes, D.; Thomas, R.; Zele, A.J. Intrinsically photosensitive (melanopsin) retinal ganglion cell function in glaucoma. Investig. Ophthalmol. Vis. Sci. 2011, 52, 4362–4367. [Google Scholar] [CrossRef] [Green Version]
- Kankipati, L.; Girkin, C.A.; Gamlin, P.D. The post-illumination pupil response is reduced in glaucoma patients. Investig. Ophthalmol. Vis. Sci. 2011, 52, 2287–2292. [Google Scholar] [CrossRef] [Green Version]
- Obara, E.A.; Hannibal, J.; Heegaard, S.; Fahrenkrug, J. Loss of melanopsin-expressing retinal ganglion cells in severely staged glaucoma patients. Investig. Ophthalmol. Vis. Sci. 2016, 57, 4661–4667. [Google Scholar] [CrossRef] [Green Version]
- Fonken, L.K.; Workman, J.L.; Walton, J.C.; Weil, Z.M.; Morris, J.S.; Haim, A.; Nelson, R.J. Light at night increases body mass by shifting the time of food intake. Proc. Natl. Acad. Sci. USA 2010, 107, 18664–18669. [Google Scholar] [CrossRef] [PubMed] [Green Version]
- Obayashi, K.; Saeki, K.; Iwamoto, J.; Okamoto, N.; Tomioka, K.; Nezu, S.; Ikada, Y.; Kurumatani, N. Exposure to light at night, nocturnal urinary melatonin excretion, and obesity/dyslipidemia in the elderly: A cross-sectional analysis of the HEIJO-KYO study. J. Clin. Endocrinol. Metab. 2013, 98, 337–344. [Google Scholar] [CrossRef] [PubMed]
- Shi, S.Q.; Ansari, T.S.; McGuinness, O.P.; Wasserman, D.H.; Johnson, C.H. Circadian disruption leads to insulin resistance and obesity. Curr. Biol. 2013, 23, 372–381. [Google Scholar] [CrossRef] [PubMed] [Green Version]
- Lin, E.; Kuo, P.H.; Liu, Y.L.; Yang, A.C.; Kao, C.F.; Tsai, S.J. Effects of circadian clock genes and health-related behavior on metabolic syndrome in a Taiwanese population: Evidence from association and interaction analysis. PLoS ONE 2017, 12, e0173861. [Google Scholar] [CrossRef]
- Singh, R.; Sharma, S.; Singh, R.K.; Cornelissen, G. Circadian Time Structure of Circulating Plasma Lipid Components in Healthy Indians of Different Age Groups. Indian J. Clin. Biochem. 2016, 31, 215–223. [Google Scholar] [CrossRef] [Green Version]
- Rivera-Coll, A.; Fuentes-Arderiu, X.; Diez-Noguera, A. Circadian rhythmic variations in serum concentrations of clinically important lipids. Clin. Chem. 1994, 40, 1549–1553. [Google Scholar] [CrossRef]
- Grant, A.D.; Wolf, G.I. Free-Living Humans Cross Cardiovascular Disease Risk Categories Due to Daily Rhythms in Cholesterol and Triglycerides. J. Circadian Rhythm. 2019, 17, 3. [Google Scholar] [CrossRef]
- Miida, T.; Nakamura, Y.; Mezaki, T.; Hanyu, O.; Maruyama, S.; Horikawa, Y.; Izawa, S.; Yamada, Y.; Matsui, H.; Okada, M. LDL-cholesterol and HDL-cholesterol concentrations decrease during the day. Ann. Clin. Biochem. 2002, 39, 241–249. [Google Scholar] [CrossRef] [Green Version]
- Van Kerkhof, L.W.; Van Dycke, K.C.; Jansen, E.H.; Beekhof, P.K.; van Oostrom, C.T.; Ruskovska, T.; Velickova, N.; Kamcev, N.; Pennings, J.L.; van Steeg, H.; et al. Diurnal Variation of Hormonal and Lipid Biomarkers in a Molecular Epidemiology-Like Setting. PLoS ONE 2015, 10, e0135652. [Google Scholar]
- Chua, E.C.; Shui, G.; Lee, I.T.; Lau, P.; Tan, L.C.; Yeo, S.C.; Lam, B.D.; Bulchand, S.; Summers, S.A.; Puvanendran, K.; et al. Extensive diversity in circadian regulation of plasma lipids and evidence for different circadian metabolic phenotypes in humans. Proc. Natl. Acad. Sci. USA 2013, 110, 14468–14473. [Google Scholar] [CrossRef] [Green Version]
- Tomizawa, A.; Nogawa, K.; Watanabe, Y.; Oishi, M.; Tanaka, K.; Sakata, K.; Suwazono, Y. Effect of circadian rhythm type on serum lipid levels in shift workers: A 5-year cohort study. Chronobiol. Int. 2019, 36, 751–757. [Google Scholar] [CrossRef] [PubMed]
- Kwon, Y.J.; Chung, T.H.; Lee, H.S.; Park, J.; Chung, J.Y.; Lee, B.K.; Lee, J.W. Association between circadian preference and blood lipid levels using a 1:1:1 propensity score matching analysis. J. Clin. Lipidol. 2019, 13, 645–653.e2. [Google Scholar] [CrossRef] [PubMed]
- Cambras, T.; Baena-Fustegueras, J.A.; Pardina, E.; Ricart-Jané, D.; Rossell, J.; Díez-Noguera, A.; Peinado-Onsurbe, J. Seasonal variation in plasma lipids and lipases in young healthy humans. Chronobiol. Int. 2017, 34, 1248–1258. [Google Scholar] [CrossRef] [PubMed]
- Pan, X.; Zhang, Y.; Wang, L.; Hussain, M.M. Diurnal regulation of MTP and plasma triglyceride by CLOCK is mediated by SHP. Cell Metab. 2010, 12, 174–186. [Google Scholar] [CrossRef] [PubMed] [Green Version]
- Tsuzaki, K.; Kotani, K.; Sano, Y.; Fujiwara, S.; Takahashi, K.; Sakane, N. The association of the Clock 3111 T/C SNP with lipids and lipoproteins including small dense low-density lipoprotein: Results from the Mima study. BMC Med. Genet. 2010, 11, 150. [Google Scholar] [CrossRef] [PubMed] [Green Version]
- Garaulet, M.; Sánchez-Moreno, C.; Smith, C.E.; Lee, Y.C.; Nicolás, F.; Ordovás, J.M. Ghrelin, sleep reduction and evening preference: Relationships to CLOCK 3111 T/C SNP and weight loss. PLoS ONE 2011, 6, e17435. [Google Scholar] [CrossRef] [PubMed] [Green Version]
- Bandín, C.; Martinez-Nicolas, A.; Ordovás, J.M.; Ros Lucas, J.A.; Castell, P.; Silvente, T.; Madrid, J.A.; Garaulet, M. Differences in circadian rhythmicity in CLOCK 3111T/C genetic variants in moderate obese women as assessed by thermometry, actimetry and body position. Int. J. Obes. 2013, 37, 1044–1050. [Google Scholar] [CrossRef] [Green Version]
- Garcia-Rios, A.; Gomez-Delgado, F.J.; Garaulet, M.; Alcala-Diaz, J.F.; Delgado-Lista, F.J.; Marin, C.; Rangel-Zuñiga, O.A.; Rodriguez-Cantalejo, F.; Gomez-Luna, P.; Ordovas, J.M.; et al. Beneficial effect of CLOCK gene polymorphism rs1801260 in combination with low-fat diet on insulin metabolism in the patients with metabolic syndrome. Chronobiol. Int. 2014, 31, 401–408. [Google Scholar] [CrossRef]
- Pagliai, G.; Sofi, F.; Dinu, M.; Sticchi, E.; Vannetti, F.; Molino Lova, R.; Ordovàs, J.M.; Gori, A.M.; Marcucci, R.; Giusti, B.; et al. CLOCK gene polymorphisms and quality of aging in a cohort of nonagenarians—The MUGELLO Study. Sci. Rep. 2019, 9, 1472. [Google Scholar] [CrossRef] [Green Version]
- Semenova, N.; Madaeva, I.; Bairova, T.; Kolesnikov, S.; Kolesnikova, L. Lipid peroxidation depends on the clock 3111T/C gene polymorphism in menopausal women with Insomnia. Chronobiol. Int. 2019, 36, 1399–1408. [Google Scholar] [CrossRef]
- Dornan, T.L.; Carter, R.D.; Bron, A.J.; Turner, R.C.; Mann, J.I. Low density lipoprotein cholesterol: An association with the severity of diabetic retinopathy. Diabetologia 1982, 22, 167–170. [Google Scholar] [CrossRef] [PubMed] [Green Version]
- Nagare, R.; Possidente, B.; Lagalwar, S.; Figueiro, M.G. Robust light-dark patterns and reduced amyloid load in an Alzheimer’s disease transgenic mouse model. Sci. Rep. 2020, 10, 11436. [Google Scholar] [CrossRef] [PubMed]
- Lou, F.; Li, M.; Ren, Y.; Luo, X.G.; Liu, N.; Li, X. CLOCK rs1801260 Polymorphism is Associated with Susceptibility to Parkinson’s Disease in a Chinese Population. Neurosci. Bull. 2017, 33, 734–736. [Google Scholar] [CrossRef] [PubMed]
- Lucas, R.J.; Freedman, M.S.; Muñoz, M.; García-Fernández, J.M.; Foster, R.G. Regulation of the mammalian pineal by non-rod, non-cone, ocular photoreceptors. Science 1999, 84, 505–507. [Google Scholar] [CrossRef]
- Berson, D.M.; Dunn, F.A.; Takao, M. Phototransduction by retinal ganglion cells that set the circadian clock. Science 2002, 295, 1070–1073. [Google Scholar] [CrossRef] [Green Version]
- Panda, S.; Provencio, I.; Tu, D.C.; Pires, S.S.; Rollag, M.D.; Castrucci, A.M.; Pletcher, M.T.; Sato, T.K.; Wiltshire, T.; Andahazy, M.; et al. Melanopsin is required for non-image-forming photic responses in blind mice. Science 2003, 301, 525–527. [Google Scholar] [CrossRef] [Green Version]
- Lockley, S.W.; Skene, D.J.; Arendt, J.; Tabandeh, H.; Bird, A.C.; Defrance, R. Relationship between melatonin rhythms and visual loss in the blind. J. Clin. Endocrinol. Metab. 1997, 82, 3763–3770. [Google Scholar] [CrossRef] [Green Version]
- Flynn-Evans, E.E.; Tabandeh, H.; Skene, D.J.; Lockley, S.W. Circadian Rhythm Disorders and Melatonin Production in 127 Blind Women with and without Light Perception. J. Biol. Rhythm. 2014, 29, 215–224. [Google Scholar] [CrossRef] [Green Version]
- Bellastella, A.; Pisano, G.; Iorio, S.; Pasquali, D.; Orio, F.; Venditto, T.; Sinisi, A.A. Endocrine secretions under abnormal light-dark cycles and in the blind. Horm. Res. 1998, 49, 153–157. [Google Scholar] [CrossRef]
- Bellastella, A.; De Bellis, A.; Bellastella, G.; Esposito, K. Opposite influence of light and blindness on pituitary-gonadal function. Front. Endocrinol. 2014, 4, 205. [Google Scholar] [CrossRef] [Green Version]
- Cederroth, C.R.; Albrecht, U.; Bass, J.; Brown, S.A.; Dyhrfjeld-Johnsen, J.; Gachon, F.; Green, C.B.; Hastings, M.H.; Helfrich-Förster, C.; Hogenesch, J.B.; et al. Medicine in the Fourth Dimension. Cell Metab. 2019, 30, 238–250. [Google Scholar] [CrossRef] [PubMed]
- Kramer, A.; Lange, T.; Spies, C.; Finger, A.M.; Berg, D.; Oster, H. Foundations of circadian medicine. PLoS Biol. 2022, 20, e3001567. [Google Scholar] [CrossRef] [PubMed]
- Allada, R.; Bass, J. Circadian Mechanisms in Medicine. N. Engl. J. Med. 2021, 384, 550–561. [Google Scholar] [CrossRef] [PubMed]
- Friedewald, W.T.; Levy, R.I.; Fredrickson, D.S. Estimation of the concentration of low-density lipoprotein cholesterol in plasma, without use of the preparative ultracentrifuge. Clin. Chem. 1972, 18, 499–502. [Google Scholar] [CrossRef]
- Pandi-Perumal, S.R.; Smits, M.; Spence, W.; Srinivasan, V.; Cardinali, D.P.; Lowe, A.D.; Kayumov, L. Dim light melatonin onset (DLMO): A tool for the analysis of circadian phase in human sleep and chronobiological disorders. Prog. Neuro-Psychopharmacol. Biol. Psychiatry 2007, 31, 1–11. [Google Scholar] [CrossRef]
- Diedenhofen, B.; Much, J. Cocor: A comprehensive solution for the statistical comparison of correlations. PLoS ONE 2015, 10, e0121945. [Google Scholar] [CrossRef] [Green Version]

 GLV < 5%;
  GLV 5–10%;
  GLV 15–25%;
  GLV > 25%.
GLV < 5%; GLV 5–10%; GLV 15–25%; GLV > 25%.
GLV > 25%.
GLV < 5%; GLV 5–10%; GLV 15–25%; GLV > 25%.
 TG at 08:00 (r = 0.568; p < 0.001);
  TG at 20:00 (r = 0.608; p < 0.001).
  HDLP at 08:00 (r = −0.613; p < 0.001);
  HDL-C at 20:00 (r = −0.585; p < 0.001).
  LDLP at 08:00 (r = 0.235; p = 0.012);
  LDL-C at 20:00 (r = 0.533; p < 0.001).
TG at 08:00 (r = 0.568; p < 0.001); TG at 20:00 (r = 0.608; p < 0.001). HDLP at 08:00 (r = −0.613; p < 0.001); HDL-C at 20:00 (r = −0.585; p < 0.001). LDLP at 08:00 (r = 0.235; p = 0.012); LDL-C at 20:00 (r = 0.533; p < 0.001).
LDL-C at 20:00 (r = 0.533; p < 0.001).
TG at 08:00 (r = 0.568; p < 0.001); TG at 20:00 (r = 0.608; p < 0.001). HDLP at 08:00 (r = −0.613; p < 0.001); HDL-C at 20:00 (r = −0.585; p < 0.001). LDLP at 08:00 (r = 0.235; p = 0.012); LDL-C at 20:00 (r = 0.533; p < 0.001).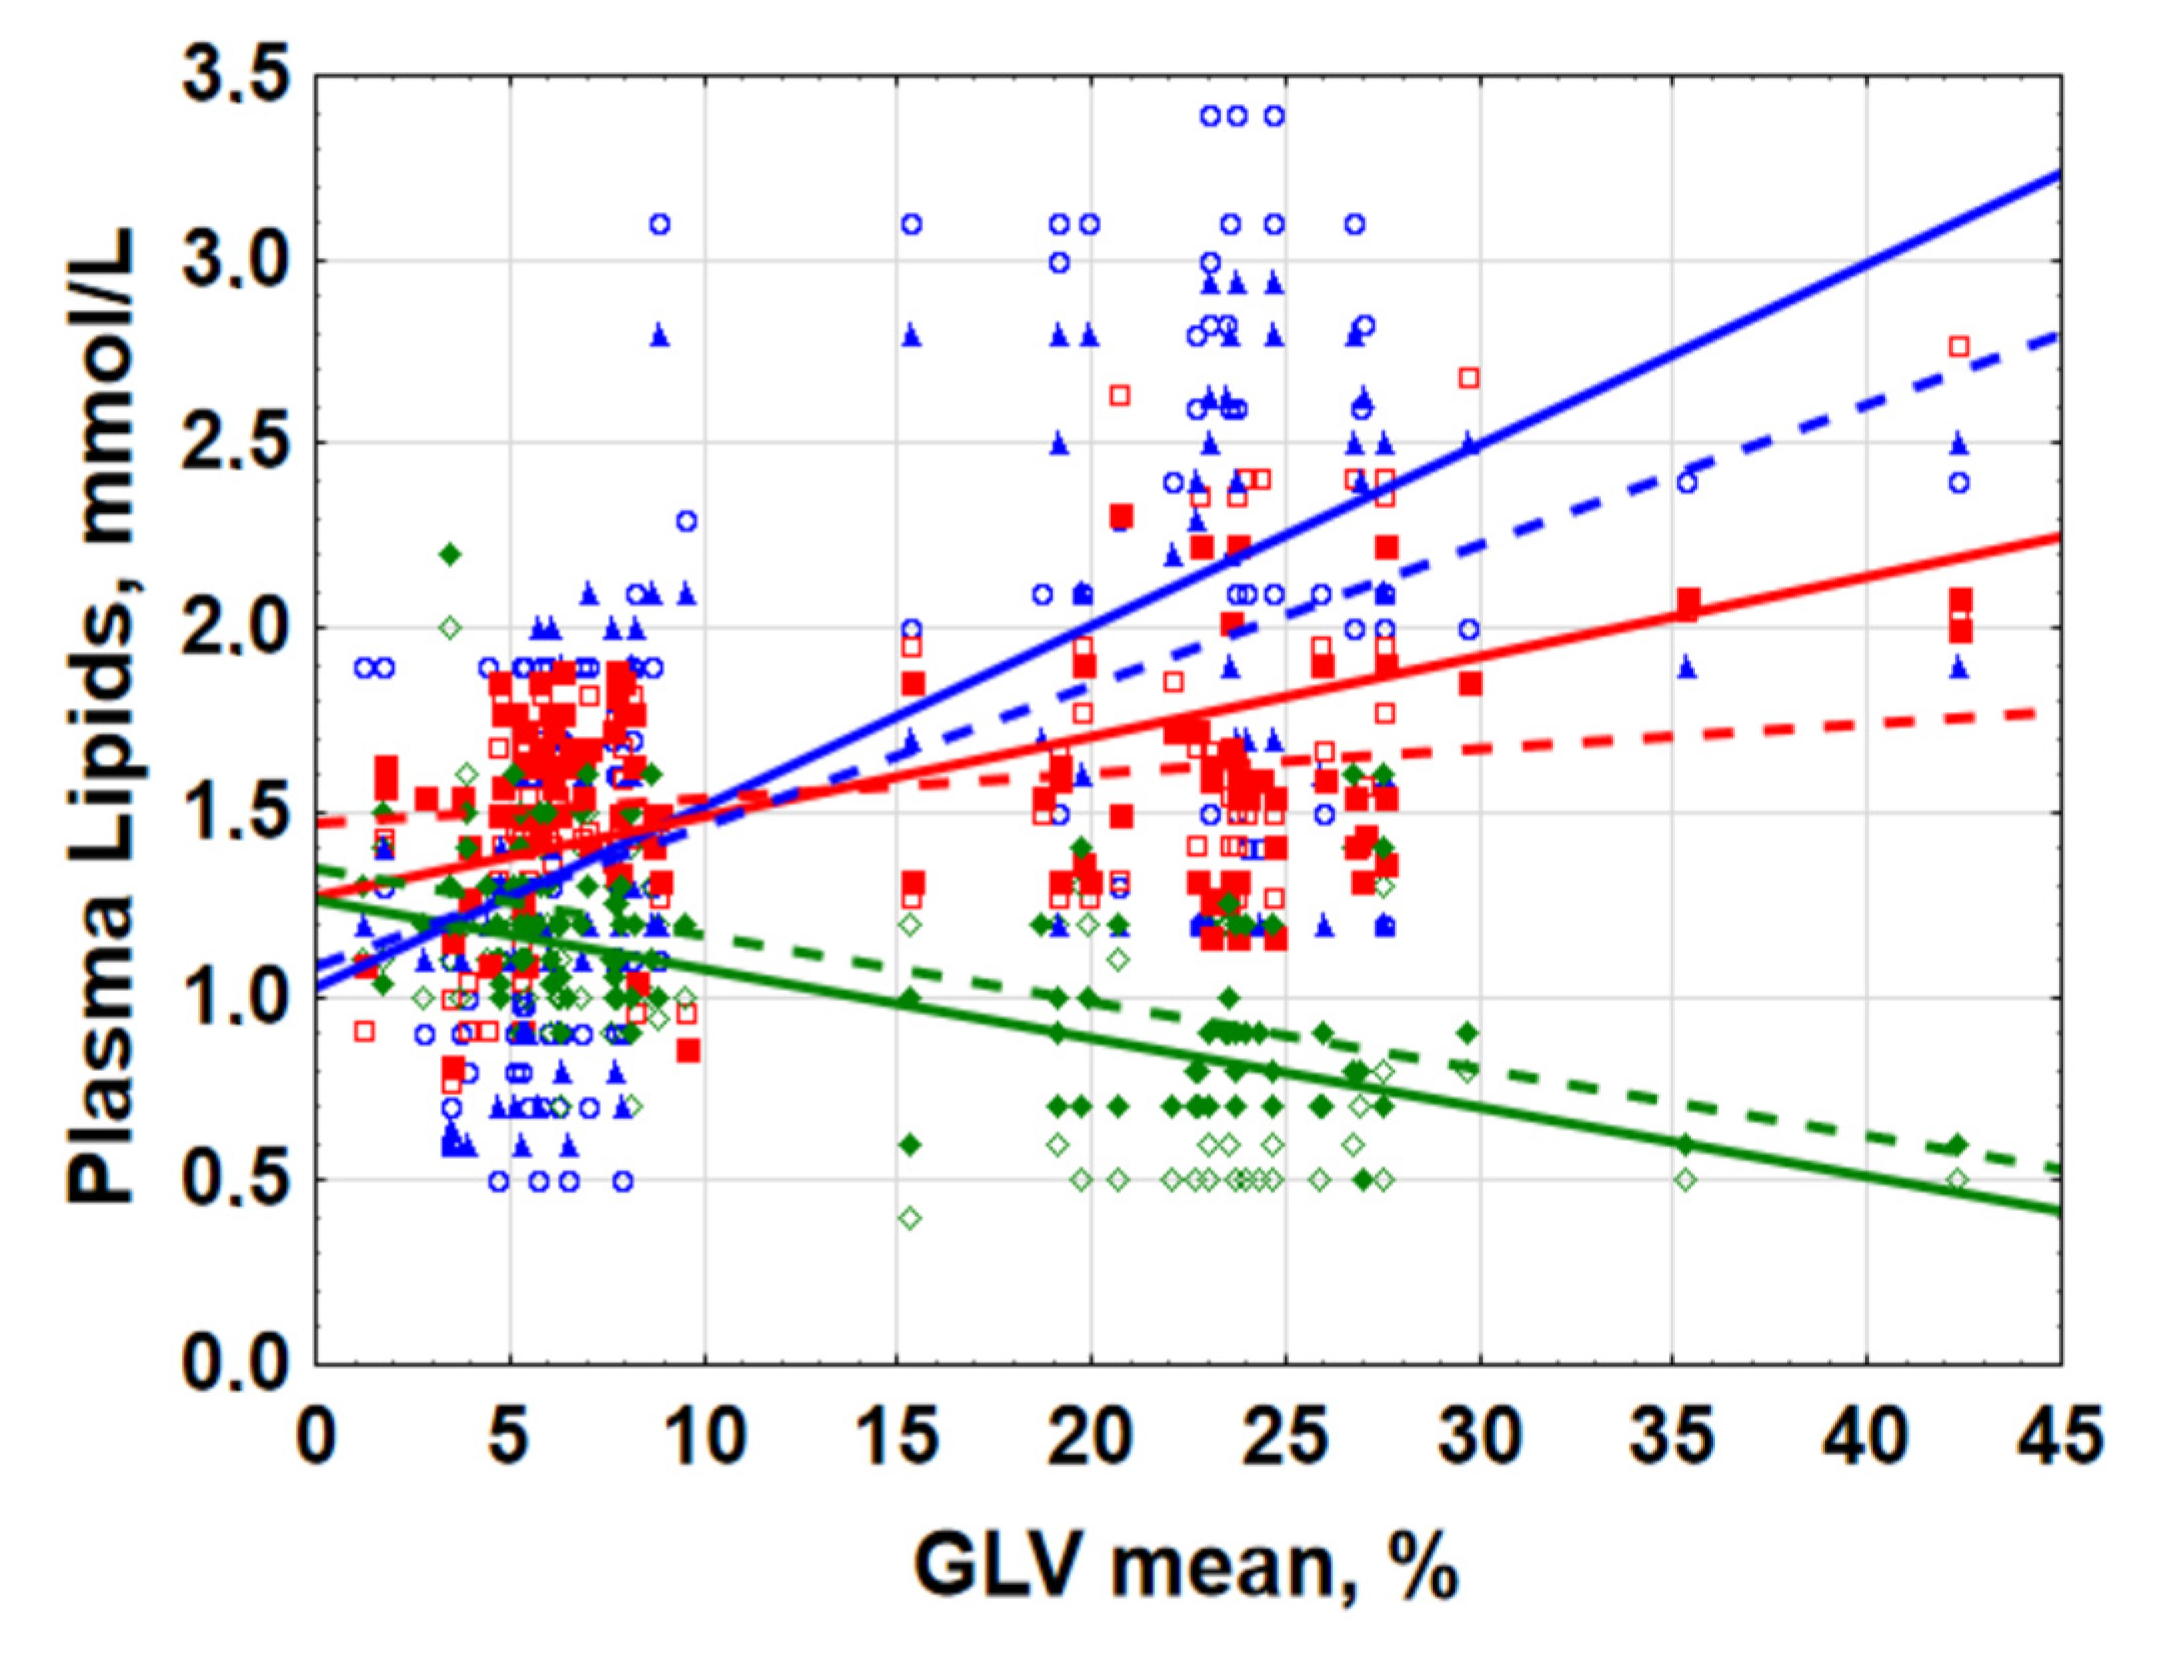
 25–75%;
  Non-Outlier Range.
25–75%; Non-Outlier Range.
Non-Outlier Range.
25–75%; Non-Outlier Range.


| Dependent Variable | GLV, r Value | Age, r Value | All-Effects Multiple Regression Model, b-Value(s) | Backward Stepwise Regression Model, b-Value(s) |
|---|---|---|---|---|
| Morning (08:00) | ||||
| Cholesterol | 0.526 | 0.365 | GLV, b = 0.458 Age, b = 0.231 | GLV, b = 0.526 |
| TG | 0.568 | 0.120 | GLV, b = 0.583 Age, b = −0.050 | GLV, b = 0.568 |
| HDL-C | −0.613 | −0.083 | GLV, b = −0.640 Age, b = 0.104 | GLV, b = −0.610 |
| LDL-C | 0.235 | 0.294 | Age, b = 0.247 GLV, b = 0.163 | Age, b = 0.294 |
| Evening (20:00) | ||||
| Cholesterol | 0.774 | 0.350 | GLV, b = 0.734 Age, b = 0.137 | GLV, b = 0.774 |
| TG | 0.608 | 0.017 | GLV, b = 0.659 Age, b = −0.170 | GLV, b = 0.608 |
| HDL-C | −0.585 | −0.070 | GLV, b = −0.620 Age, b = 0.109 | GLV, b = 0.580 |
| LDL-C | 0.533 | 0.403 | GLV, b = 0.454 Age, b = 0.271 | GLV, b = 0.454 Age, b = 0.271 |
| Morning–Evening Gradients (MEGs) | ||||
| Cholesterol | 0.721 | 0.185 | GLV, b = 0.728 Age, b = −0.030 | GLV, b = 0.720 |
| TG | 0.323 | −0.201 | GLV, b = 0.417 Age, b = −0.320 | GLV, b = 0.417 Age, b = −0.320 |
| HDL-C | −0.049 | 0.013 | GLV, b = −0.060 Age, b = 0.029 | --- |
| LDL-C | 0.558 | 0.297 | GLV, b = 0.514 Age, b = 0.147 | GLV, b = 0.557 |
| Gene Polymorphisms | p-Value for Effect Significance; ANOVA for LDL-C MEG |
|---|---|
| CLOCK rs1801260 3111T/C | 0.023 |
| PER2 rs6431590 | 0.507 |
| PER3 VNTR | 0.644 |
| CRY1 rs12820777 | 0.169 |
| MTNR1A rs34532313 | 0.656 |
| MTNR1B rs10830963 | 0.338 |
| GNB rs5443 | 0.814 |
Publisher’s Note: MDPI stays neutral with regard to jurisdictional claims in published maps and institutional affiliations. |
© 2022 by the authors. Licensee MDPI, Basel, Switzerland. This article is an open access article distributed under the terms and conditions of the Creative Commons Attribution (CC BY) license (https://creativecommons.org/licenses/by/4.0/).
Share and Cite
Gubin, D.; Neroev, V.; Malishevskaya, T.; Kolomeichuk, S.; Weinert, D.; Yuzhakova, N.; Nelaeva, A.; Filippova, Y.; Cornelissen, G. Daytime Lipid Metabolism Modulated by CLOCK Gene Is Linked to Retinal Ganglion Cells Damage in Glaucoma. Appl. Sci. 2022, 12, 6374. https://doi.org/10.3390/app12136374
Gubin D, Neroev V, Malishevskaya T, Kolomeichuk S, Weinert D, Yuzhakova N, Nelaeva A, Filippova Y, Cornelissen G. Daytime Lipid Metabolism Modulated by CLOCK Gene Is Linked to Retinal Ganglion Cells Damage in Glaucoma. Applied Sciences. 2022; 12(13):6374. https://doi.org/10.3390/app12136374
Chicago/Turabian StyleGubin, Denis, Vladimir Neroev, Tatyana Malishevskaya, Sergey Kolomeichuk, Dietmar Weinert, Natalya Yuzhakova, Alsu Nelaeva, Yulia Filippova, and Germaine Cornelissen. 2022. "Daytime Lipid Metabolism Modulated by CLOCK Gene Is Linked to Retinal Ganglion Cells Damage in Glaucoma" Applied Sciences 12, no. 13: 6374. https://doi.org/10.3390/app12136374
APA StyleGubin, D., Neroev, V., Malishevskaya, T., Kolomeichuk, S., Weinert, D., Yuzhakova, N., Nelaeva, A., Filippova, Y., & Cornelissen, G. (2022). Daytime Lipid Metabolism Modulated by CLOCK Gene Is Linked to Retinal Ganglion Cells Damage in Glaucoma. Applied Sciences, 12(13), 6374. https://doi.org/10.3390/app12136374