Abstract
Methods to learn informative representations of road networks constitute an important prerequisite to solve multiple traffic analysis tasks with data-driven models. Most existing studies are only developed from a topology structure or traffic attribute perspective, and the resulting representations are biased and cannot fully capture the complex traffic flow patterns that are attributed to human mobility in road networks. Moreover, real-world road networks usually contain millions of segments, which poses a great challenge regarding the memory usage and computational efficiency of existing methods. Consequently, we proposed a novel multiview representation learning framework for large-scale urban road networks to simultaneously preserve topological and human mobility information. First, the road network was modeled as a multigraph, and a multiview random walk method was developed to capture the structure function of the road network from a topology-aware graph and vehicle transfer pattern from a mobility-aware graph. In this process, a large-scale road network organization method was established to improve the random walk algorithm efficiency. Finally, word2vec was applied to learn representations based on sequences that were generated by the multiview random walk. In the experiment, two real-world datasets were used to demonstrate the superior performance of our framework through a comparative analysis.
1. Introduction
As the most basic computing unit of traffic analysis in intelligent transportation systems (ITSs) [1], urban road networks comprising various road segments play a vital role in multiple analysis tasks, such as traffic flow prediction [2] and travel time estimation [3]. In industry, a high-quality road network is also indispensable for location-based service (LBS) provision. For example, digital maps (e.g., Google Maps and Baidu Maps) utilize road networks to support navigation or recommendation [4]. However, it is a challenging issue to embed a road network, which is represented as a complex graph structure, into common data-driven methods, such as support vector machines and artificial neural networks [5]. Hence, learning low-dimensional vector representations of road segments is critical for data-driven traffic analysis.
An urban road network is a complex traffic system that reflects the connections among various regions from different perspectives, including topological structures and human mobility patterns. Compared to general graph structure data, the road network scale is significantly larger. For example, the number of road segments reaches tens of millions in some large cities. The above properties suggest that informative representations of road networks should be both topology and mobility aware. In addition, the representation method should be adapted to the calculation of large-scale data.
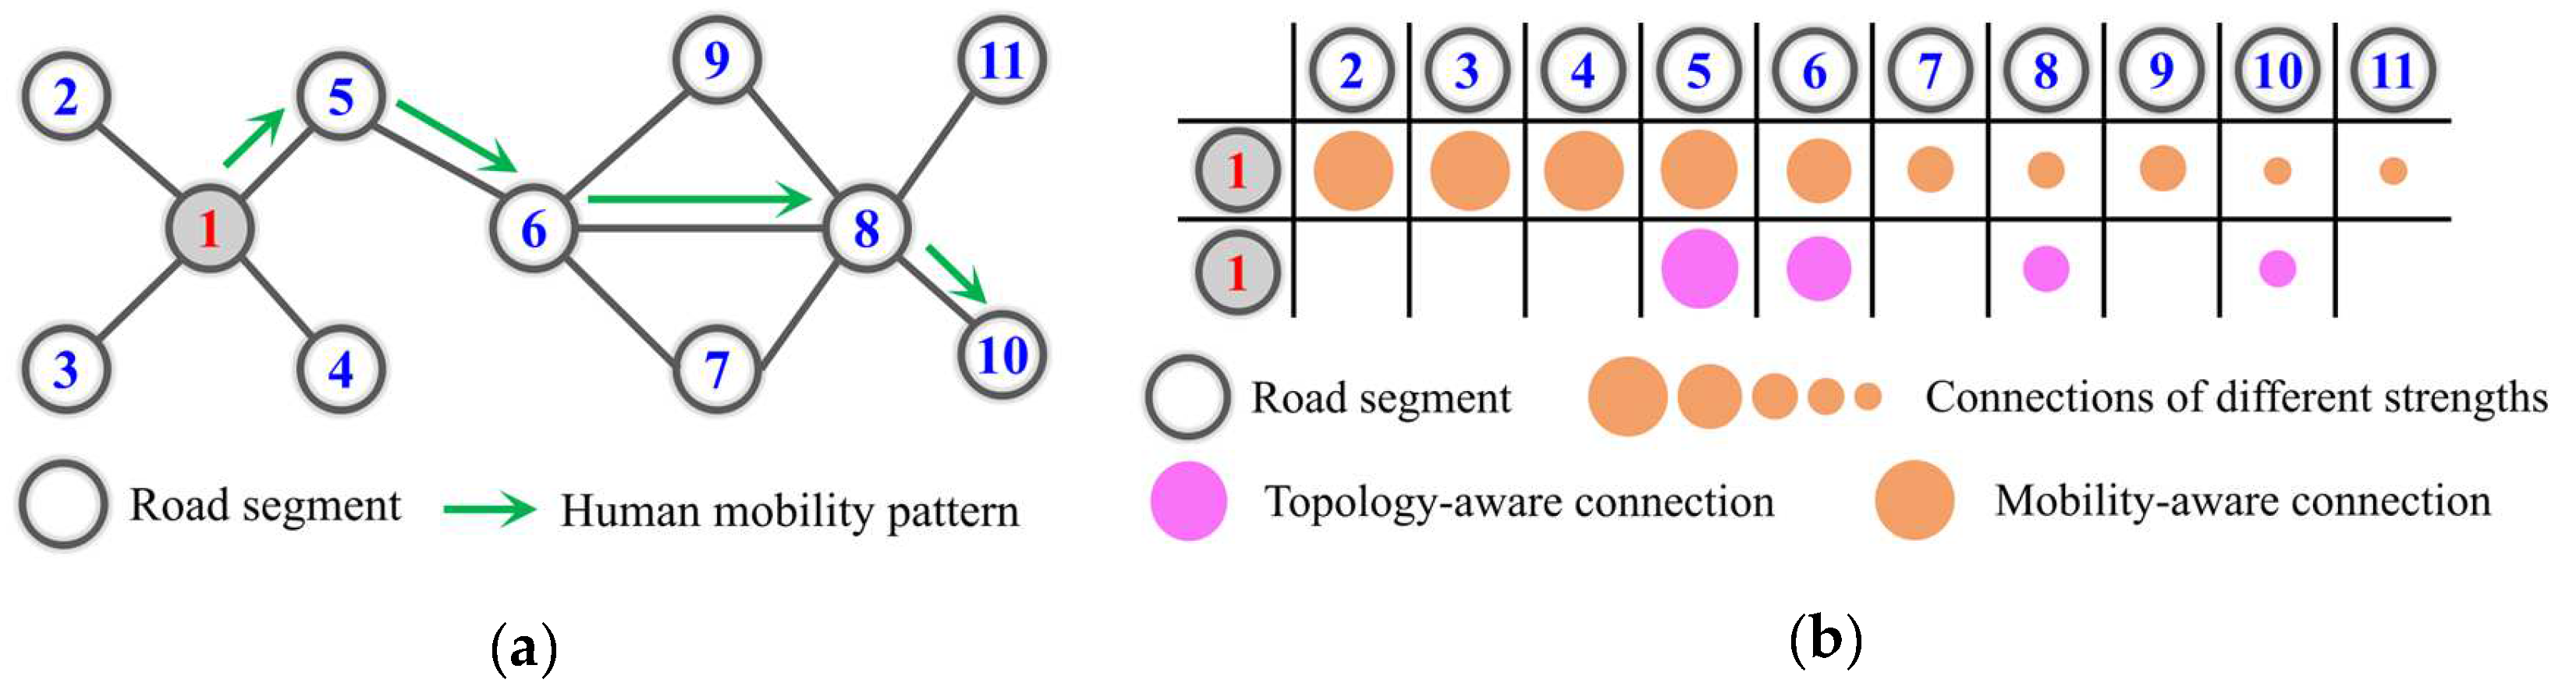
Topology awareness indicates that the latent space of representation should preserve the topological neighborhood of road segments [6]. Specifically, if two road segments are topologically close, then their representation vectors are also close in latent space. This property is a special case of Tobler’s first law of geography [7] in topological space. In the real world, if two road segments are topologically adjacent, their geographic and physical configurations (e.g., road class, speed limit, and land use type) should be similar. Hence, in the latent space of topology-aware representations, most road segments are usually connected, but those that are topologically adjacent are more notably connected than those that are further away in the topological structure of the road network. As illustrated in Figure 1a, road segments ②, ③, ④ and ⑤ are the topological neighborhoods of road segment ①, so their connections are stronger in latent space (Figure 1b).
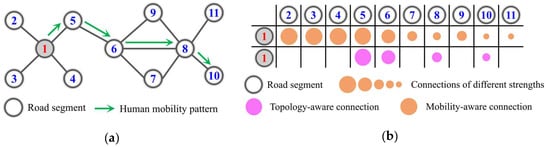
Figure 1.
Road network structure and underlying connections in latent space. (a) Road network structure; (b) different connections in latent space.
Mobility awareness indicates that the latent space of representations should preserve the human mobility pattern within the urban road network [8]. This perspective is motivated by the way a person sequentially visits locations through several road segments with distinctive purposes, and we analyzed the underlying connections within its context, defined as the set of road segments along a trajectory [9]. As shown in Figure 1a, if most vehicles travel from road segments ① to ⑩ via path {①→⑤→⑥→⑧→⑩}, the traffic configuration (e.g., speed, volume, and congestion) in each road segment along this path is similar. This similarity usually decays along the path direction (Figure 1b). This property can be likened to Tobler’s first law of geography regarding human mobility patterns. Compared to topology-aware representations, mobility-aware representations are more complex and informative but are often overlooked in existing research [2].
Due to the scale of real-world urban road networks, even if topology and mobility awareness aspects can be coupled via a sound objective, objective optimization for very large networks remains challenging [10]. This challenge is mainly reflected in two aspects. One aspect entails the improvement in both the inference effectiveness and efficiency, and the other aspect considers how to efficiently organize, index and compute large-scale networks in the process of embedding. The former aspect has been previously studied [10,11], but the latter aspect is yet to be resolved.
In this paper, we implement a novel multiview representation learning framework for large-scale urban road networks that simultaneously preserves topological and human mobility information. First, we design a large-scale road network organization method considering the random walk process. This method includes optimal partitioning, subgraph repair and walk index determination. Then, two matrices and two random walk mechanisms from two perspectives, i.e., topology and mobility awareness, are constructed for sequence generation. Based on the above approach, word2vec [12] is utilized to generate final vector representations of all road segments in latent space.
The contributions of this research are as follows:
- We propose a new random walk method to capture the structure function of the road network from a topology-aware graph and the vehicle transfer pattern from a mobility-aware graph.
- We design a new road network data-organization algorithm, including optimal segmentation, subgraph repair, and walk index calculation to optimize our representation framework for lossless random walks in large-scale road networks.
- We conduct extensive experiments involving two real-world urban road networks. The experimental results of the estimated time of arrival (ETA) task verify the effectiveness and efficiency of the proposed framework.
The remainder of this paper is organized as follows: Section 2 summarizes related works. Section 3 introduces the details of our proposed multiview representation learning framework. Section 4 presents the experimental results for two real-world urban road networks. Section 5 provides an attribution analysis of the experimental results. Finally, we conclude our work in Section 6.
2. Related Works and Motivations
2.1. Related Works
Most existing studies of road network representation can be divided into two categories. One category involves topological information encoding via classical general-network representation learning methods. The other category includes encoding various geospatial properties and transportation elements of road segments through various methods.
Recently, with the rapid development of deep learning [13], neural network-based representation learning methods [6,10,11,14] have achieved great success in natural language processing (NLP) [15], computer vision (CV) [16], etc. These works assumed that nearby nodes in a network tend to yield close representation vectors in latent space. Thus, the nodes are typically utilized to learn topological information of road networks. DeepWalk [14] first introduced the word2vec [12] framework based on NLP to generate network representations by sampling nodes via a random walk procedure. To capture the diversity of connectivity patterns that are observed in networks, Node2vec [6] follows the general framework of DeepWalk but embeds a parameterized random walk, which controls the node-sampling process based on the breadth-first search (BFS) and depth-first search (DFS) strategies. Considering the weakness of random walk-based methods for learning multiscale network information, LINE [10] samples nodes according to multiple connectivity considerations, rather than via the random walk method, and optimizes a carefully designed objective function to capture first- and second-order similarities. These topology-aware representation methods perform well in general networks, such as social or citation networks. However, due to the complex traffic dependency and traffic properties of urban road networks, these methods typically perform poorly in traffic downstream tasks (e.g., traffic flow prediction and travel time estimation) [2,17]. As shown in Figure 2, the connections between each topologically adjacent road segment are homogeneous in terms of topology awareness, but due to the different driving rules under various road properties, these connections are likely heterogeneous in the real world. For instance, segments ①, ⑧, ⑨ and ⑤ are all one-way roads with only one allowable driving direction; thus, the connection {①-⑧-⑨-⑤} is unidirectional. Furthermore, due to the passing prohibition in segment ⑦ and the inability to turn left in segment ⑨, the underlying relationships {⑦-①}, {⑦-⑧} and {⑨-④} should be disconnected in latent space, even though these segments are connected in topological space.
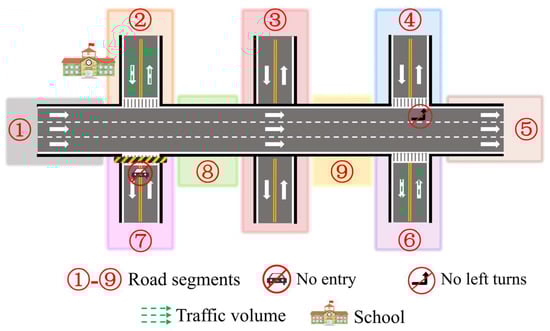
Figure 2.
Example of a real-world road network with complex traffic dependency and traffic properties.
To address this issue, researchers have focused on the geospatial properties and transportation elements of road segments, rather than on the topological structure. They have developed a series of methods [1,5,18,19,20]. Wang et al. [1,19] noted the shortcomings of topology-based methods in characterizing road property information and established the IRN2vec and RN2vec models. IRN2vec learns representations using the geographic location, intersection tag, and N-way type [19], while RN2vec learns representations using the shortest path [1]. Wu et al. [18] focused on multilevel properties (i.e., functional zones, structural regions, and road segments) to develop a hierarchical road-network representation model (HRNR). The experiment indicated that these models significantly outperformed topology-based models. Although these works could preserve the inherent properties of road segments, they still ignored the heterogeneity of connections among road segments in latent space. As illustrated in Figure 2, the two road segments of ② and ⑥ exhibit the same properties. However, the traffic volume in segment ② is larger than that in segment ⑥ due to the school that is located next to segment ②. Therefore, more vehicles are transferred from other segments to segment ② than to segment ⑥, which indicates the underlying heterogeneity of connections in latent space.
In addition, the scale of most existing representation methods cannot be adapted to real-world urban road networks, which usually contain tens of millions of nodes [21]. Although LINE developed an edge-sampling algorithm to improve the effectiveness and efficiency of general network representation [10], this model cannot capture the characteristics of road networks.
2.2. Motivations
Based on the above analysis, none of the representation methods based on a single or limited number of properties (e.g., topology and function) can fully preserve the underlying complex connection relationships between road segments in latent space. To resolve this issue, we tend to think in terms of implicit modeling rather than explicit modeling. Furthermore, it can be observed that human mobility within the road network is the comprehensive product of the complex traffic system, which can reflect the various properties of road segments. Hence, we provide a new perspective of informative road network representation: topology and mobility awareness. Based on this perspective, a novel multiview representation learning framework for large-scale road networks is proposed.
3. Methodology
3.1. Preliminaries
Considering that the two structures (i.e., topology- and mobility-aware representations) of the same road network must be formulated simultaneously, we denote a road network as a multigraph , which comprises a topology-aware graph and mobility-aware graph . The vertex set contains all the road segments in the network, and is the number of road segments. Note that to describe the process of data organization and indexing in the following section more clearly, each road segment records its corresponding geographic coordinates . Multi-edge denotes the multiview connections (i.e., topological connection and mobility connection ) between road segments and . Multiweight set denotes the multiview weights of the corresponding multi-edge set .
As an example, road segments ①–⑩ in Figure 1a comprise the vertex set , while the purple and orange color blocks in Figure 1b indicate the multiple nodes that are connected to , and the transparency of the arrow colors reflects the corresponding multiple weights.
Given a large-scale road network , the problem of representation learning aims to learn a function () that projects each vertex into a low-dimensional space , where . In the space , both the topological and human mobility information are preserved.
3.2. Large-Scale Road Network Organization
To effectively optimize the calculation efficiency and memory usage of the random walk algorithm for large-scale urban road networks, we develop a data organization method that is inspired by the Fast Newman concept [22]. The method comprises three steps: optimal partition, subgraph repair, and walk index calculation.
Optimal partitioning aims to partition the complete multigraph into independent subgraphs, which satisfy and . To ensure the quality of the subgraphs, we can define the partition process as an optimization problem with objective function :
The optimal graph partition result of this task should satisfy the following two properties:
- The complexity of each subgraph should be approximately uniformly distributed.
- The subgraphs should meet the needs of parallel computing and lossless random walks.
- Hence, we can define the objective function as:where matrix denotes the subgraph to which each node belongs. For instance, if , then ; otherwise, . is a vector of all of them. When the objective function is maximized, the partition result is optimal. Under the optimal partition, the nodes within a single subgraph are the most compact, and the nodes between multiple subgraphs are the sparsest.
To solve the optimization problem and obtain the optimal subgraph partition result, a bottom-up step-by-step iterative optimization strategy is adopted here. The specific steps are as follows:
- First, all the nodes are treated as independent subgraphs, representing the results of first-step partition , and the objective function is calculated in the first step.
- Then, two random subgraphs are merged that satisfy based on the previous partition result, and the objective function is calculated after the corresponding merge operation in this step.
- The subgraph set corresponding to the maximization of is selected as the result of this partition step , and the objective function is updated to .
- The above two steps are repeated. When the number of partition steps reaches , the partition result is selected, where k satisfies , as the optimal subgraph partition result.
After the optimal partition is obtained, to ensure that the random walk process between subgraphs can perfectly simulate the information of the complete road network, it is necessary to perform a subgraph repair of the partition results .
is defined as the topological k-order neighborhood set of node in graph . Based on the topology of the complete multigraph , all nodes in all subgraphs are filtered. Specifically, if , node set is then added as a patch to subgraph , and a new subgraph is formed.
Furthermore, to improve the efficiency of the path query operation in the random walk process, we coupled the topology and geospatial relationship of nodes to establish the fast inter- and intrasubgraph indexes. Specifically, for each original subgraph , we established the intrasubgraph index based on the corresponding submulti-edge . For each node in the set of patches , we established the R-tree index [23] based on geospatial coordinates as the intersubgraph index. In the random walk process, suppose the current node is located in subgraph . If satisfies the conditions of and , then the next node is queried by the intrasubgraph index. If satisfies the conditions of and , then the next node is queried by the intersubgraph index.
Consider the road network example in Figure 3a as an example. First, we can partition into two subgraphs and (Figure 3b). Then, we can repair these subgraphs to form new subgraphs and via the and patches (Figure 3c). Finally, we can establish the intra- and intersubgraph indexes according to the different nodes (Figure 3d).
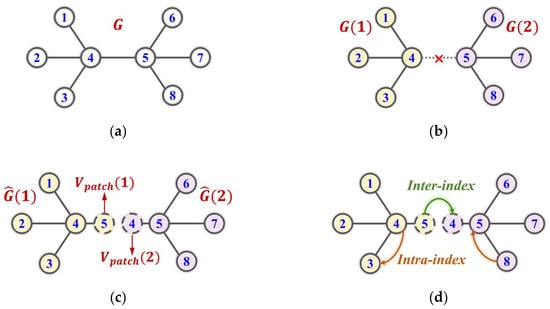
Figure 3.
Illustration of the large-scale road network organization method. (a) Original road network; (b) optimal partition; (c) subgraph repair; (d) walk index calculation.
3.3. Multiview Random Walk
To effectively realize more comprehensive and credible representations of urban road networks, this paper uses Markov and topological matrices to model the vehicle transfer pattern (mobility awareness) and structure function of the road network (topology awareness). Based on this approach, a multiview random walk method is proposed.
Regarding the vehicle transfer pattern, we use the vehicle trajectory to model the mobility edge in multigraph and assign the weight of edge through the Markov transition matrix. Therefore, the driving path of the vehicle between the road segments is first modeled as a Markov chain:
Notably, the road segment that is reached by the vehicle in the next step is only determined by the road segment that is passed in the previous step. Therefore, there is a transition probability between these two road segments to potentially control the driving pattern of the vehicle within the road network. The combination of this probability is a by matrix and becomes the Markov transition matrix .
To calculate the Markov transition matrix from massive vehicle trajectories, is defined as the number of vehicles traveling from segments to in the vehicle trajectory data, and the by matrix can be obtained.
Based on the above, the Markov transition matrix can be calculated with Equation (6) via the maximum likelihood:
Then, we can assign to the weight matrix of the mobility edge , i.e., . Graph describes the interaction among the road segments in multigraph from the perspective of human mobility.
Regarding the topology structure of the road network, we can construct the adjacency matrix via the physical connections in the road network. Specifically, for , 1; otherwise, 0. Based on this equation, the topological transition matrix can be calculated as:
Then, we can assign to the weight matrix of the mobility edge , i.e., . Graph describes the interaction among the road segments in the multigraph from the perspective of the topology.
Furthermore, to learn representations from two views of road network information, we can define an adjustment matrix to control the participation of two matrices ( and ) in the random walk process:
where denotes the Hadamard product operation and is the hyperparameter. Based on Equation (6), the process of a multiview random walk on multigraph can be expressed as follows: giving a start road segment , for all road segments and corresponding probabilities in , the alias sampling algorithm [24] is used to randomly sample the road segment of the next walk. It can be found that the adjustment matrices and control the coupling mode and participation ratio of human mobility and topology information in the random walk process. Specifically, choosing as the current sequence that is generated by a random walk after step as an example, element of can be calculated through the three hyperparameters of , , and :
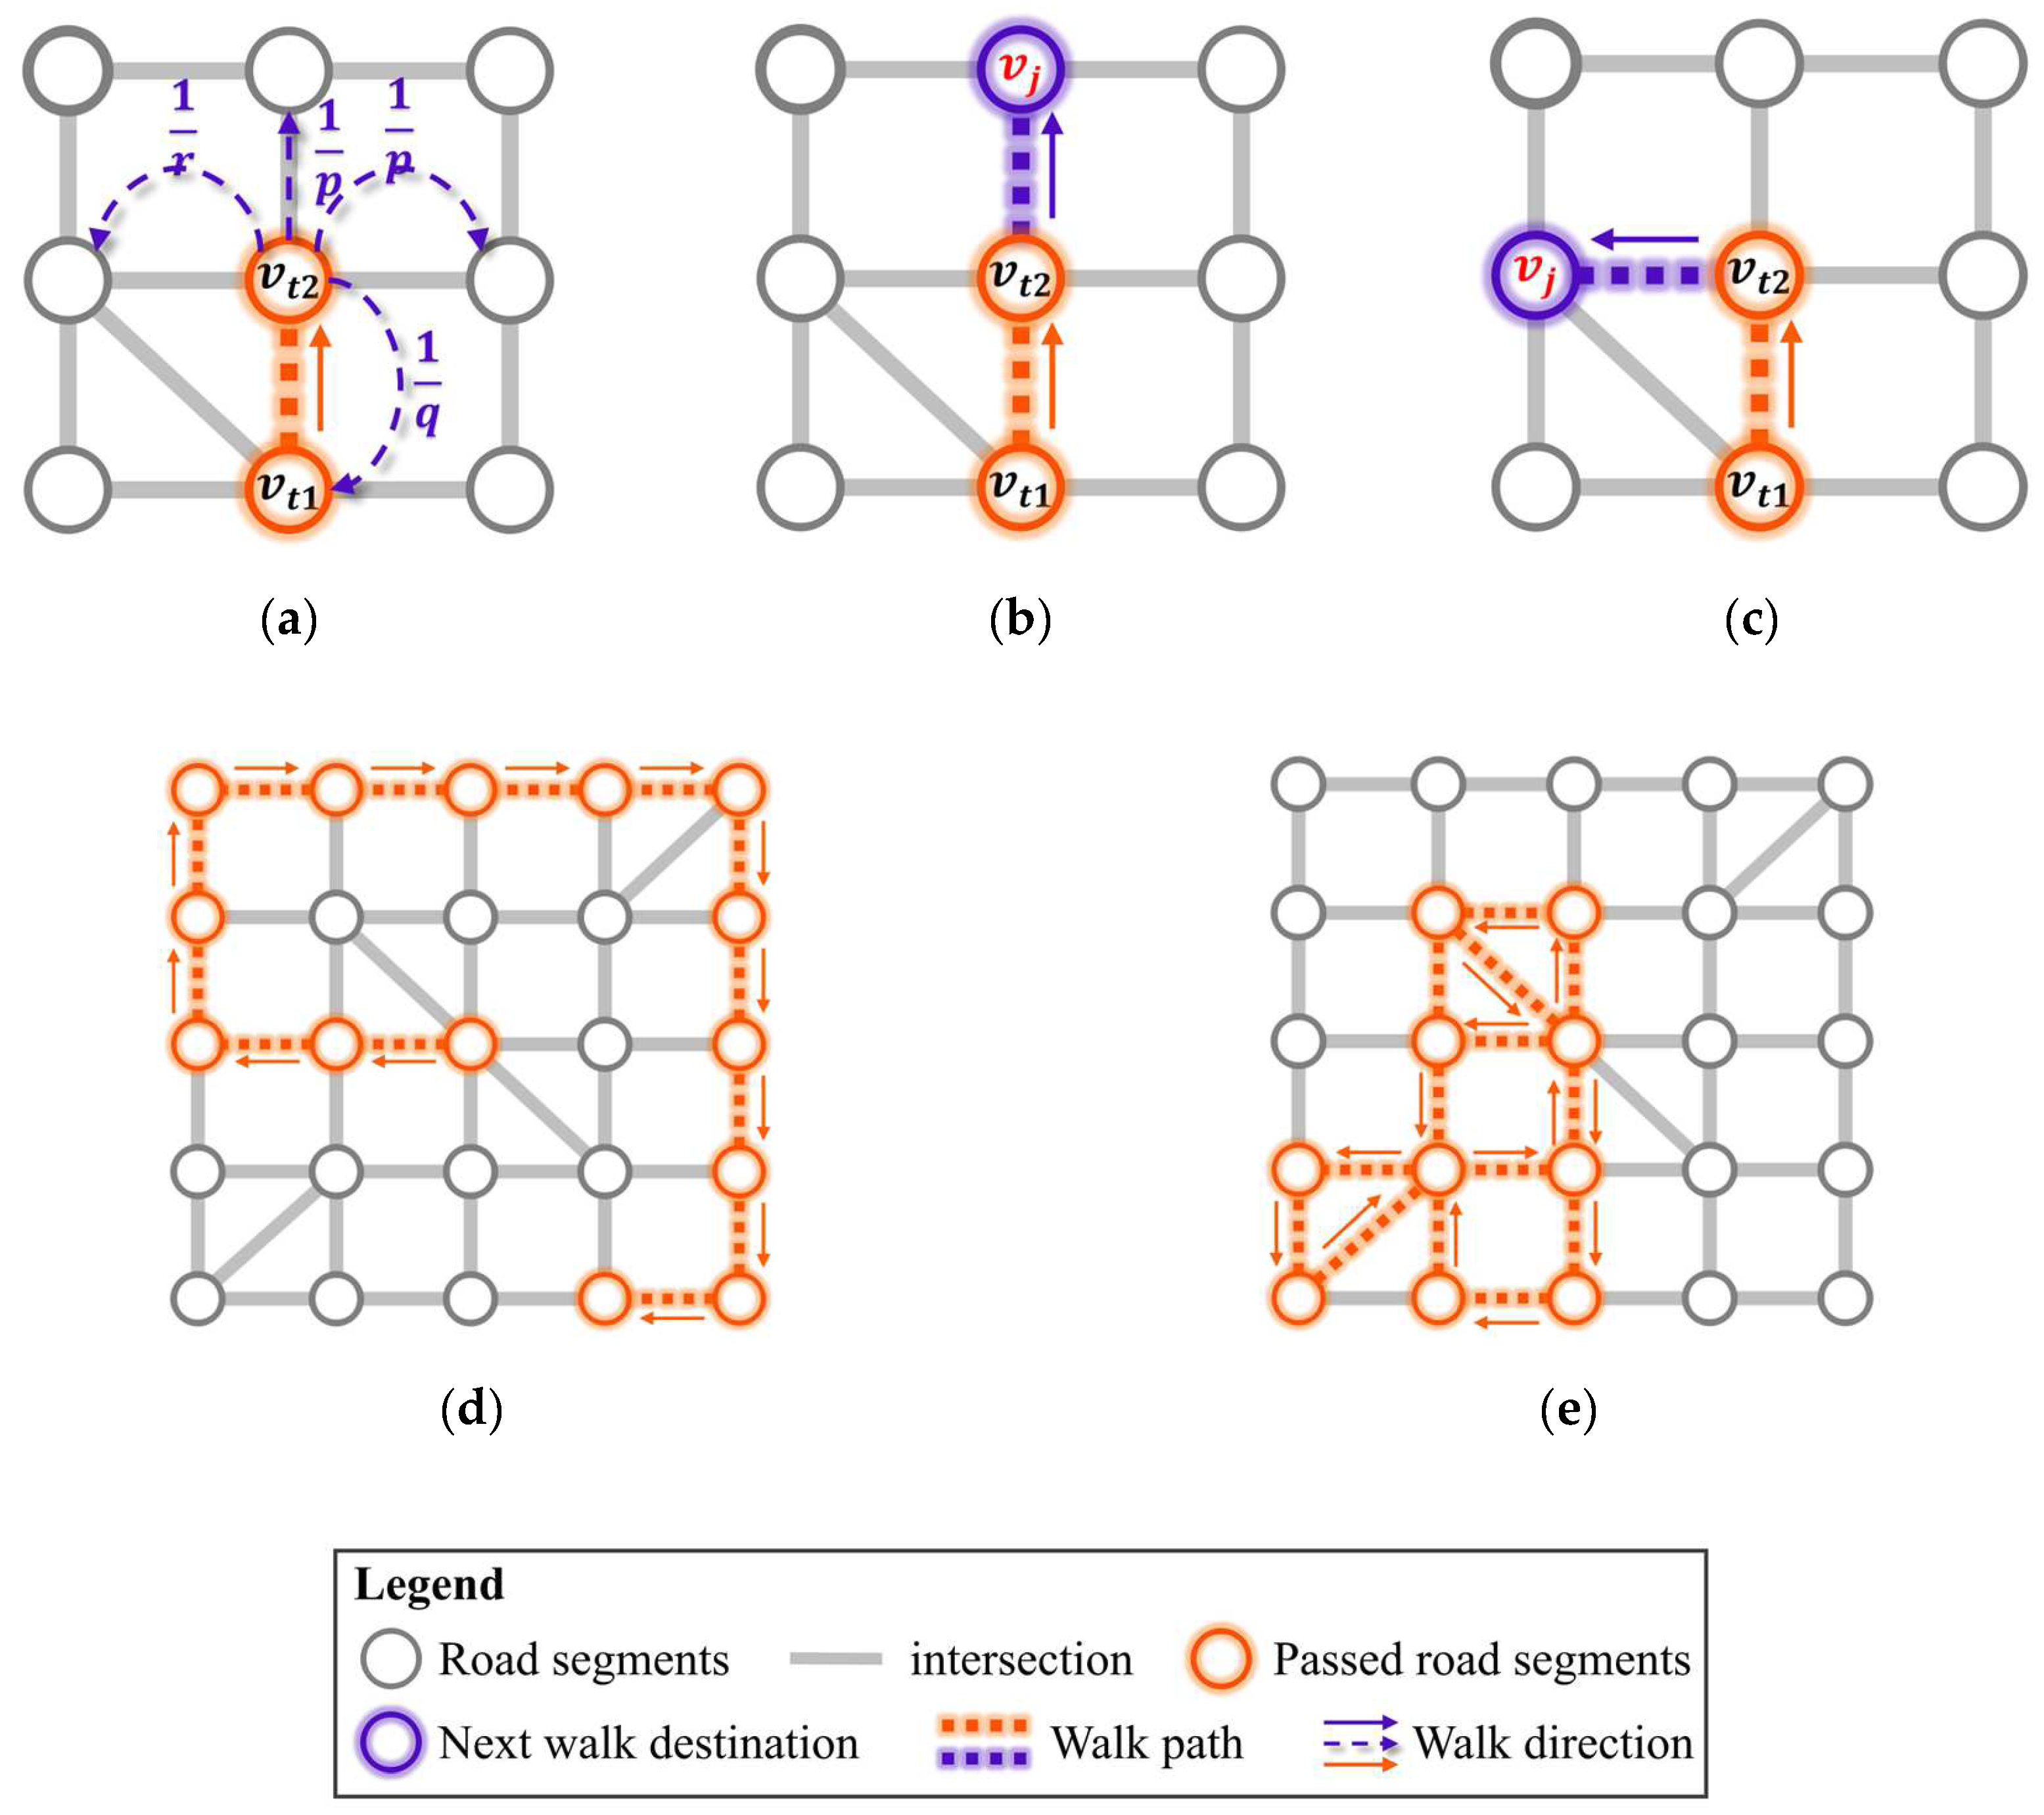
In Equation (7), the hyperparameters , , and control the weight of the next walk between the different nodes (Figure 4a). When the and values are large, is more inclined to facilitate convergence of the walk process to depth-first traversal on the graph (Figure 4b). When the and values are small, is more inclined to facilitate convergence of the walk process to breadth-first traversal on the graph (Figure 4c). Inspired by this finding, we can model the walk process on multigraph via synthesis of the following two parts by setting the parameters and to appropriate values, i.e., (1) breadth-first traversal on graph , which extracts topology information of the road network; (2) depth-first traversal on graph , which extracts human mobility information of the road network. As shown in Figure 4a,b, the resulting sequence of breadth-first traversal can capture more global and local structural features of the road network, while the resulting sequence of depth-first traversal tends to capture path features from origin to destination under road network constraints.
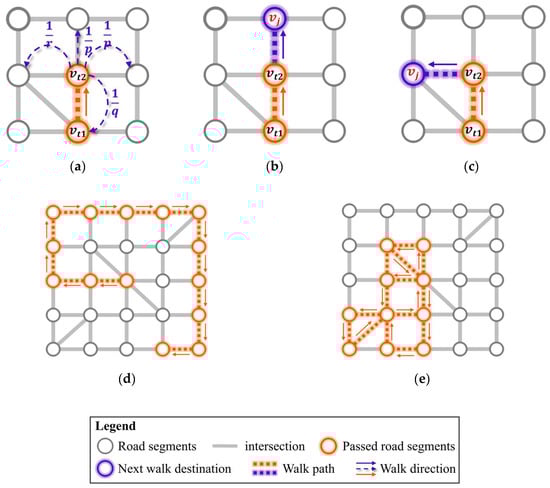
Figure 4.
Illustration of the adjustment matrix in the walk process via hyperparameters , , and : (a) The role of these three hyperparameters in determining the next walk destination; (b) a walk sequence case in which the and values are large; (c) a walk sequence case in which the and values are small; (d) depth-first traversal can capture path features from origin to destination; (e) breadth-first traversal can capture more global and local structural features.
Note that since multigraph is partitioned into many subgraphs {,...,}, matrix is actually stored and calculated in the form of block matrices {,...,}, where denotes the part of matrix that contains nodes in subgraph . At each node , in multigraph , we choose as the start node to generate sequences with length via the above multiview random walk process, where and L are hyperparameters. The details of the multiview random walk process are outlined in Appendix A. After the multiview random walk process, sequences that contain topology and human mobility information are generated.
3.4. Learning Representations
The goal of this section is to learn a function, i.e., , to generate informative road network representations that are both topology and mobility aware. Here, we are inspired by the idea of word2vec [12] to obtain the project function based on random walk sequences. Specifically, we can define the objective function as follows:
Equation (8) indicates the likelihood of a predictor using a node to predict its neighbors in the sequence. is the hyperparameter denoting the size of the neighborhood. We can optimize this neighborhood-preserving likelihood objective function to choose the best value via the stochastic gradient descent (SGD) method with negative sampling [25].
In this way, the learned representations of road networks exhibit the following properties: ① if two road segments are topologically close, then their representation vectors are close in latent space; ② if two road segments are frequently visited sequentially during human mobility, then the distance between their representation vectors is also small in latent space.
4. Experiments with a Real-World Dataset
4.1. Real-World Dataset
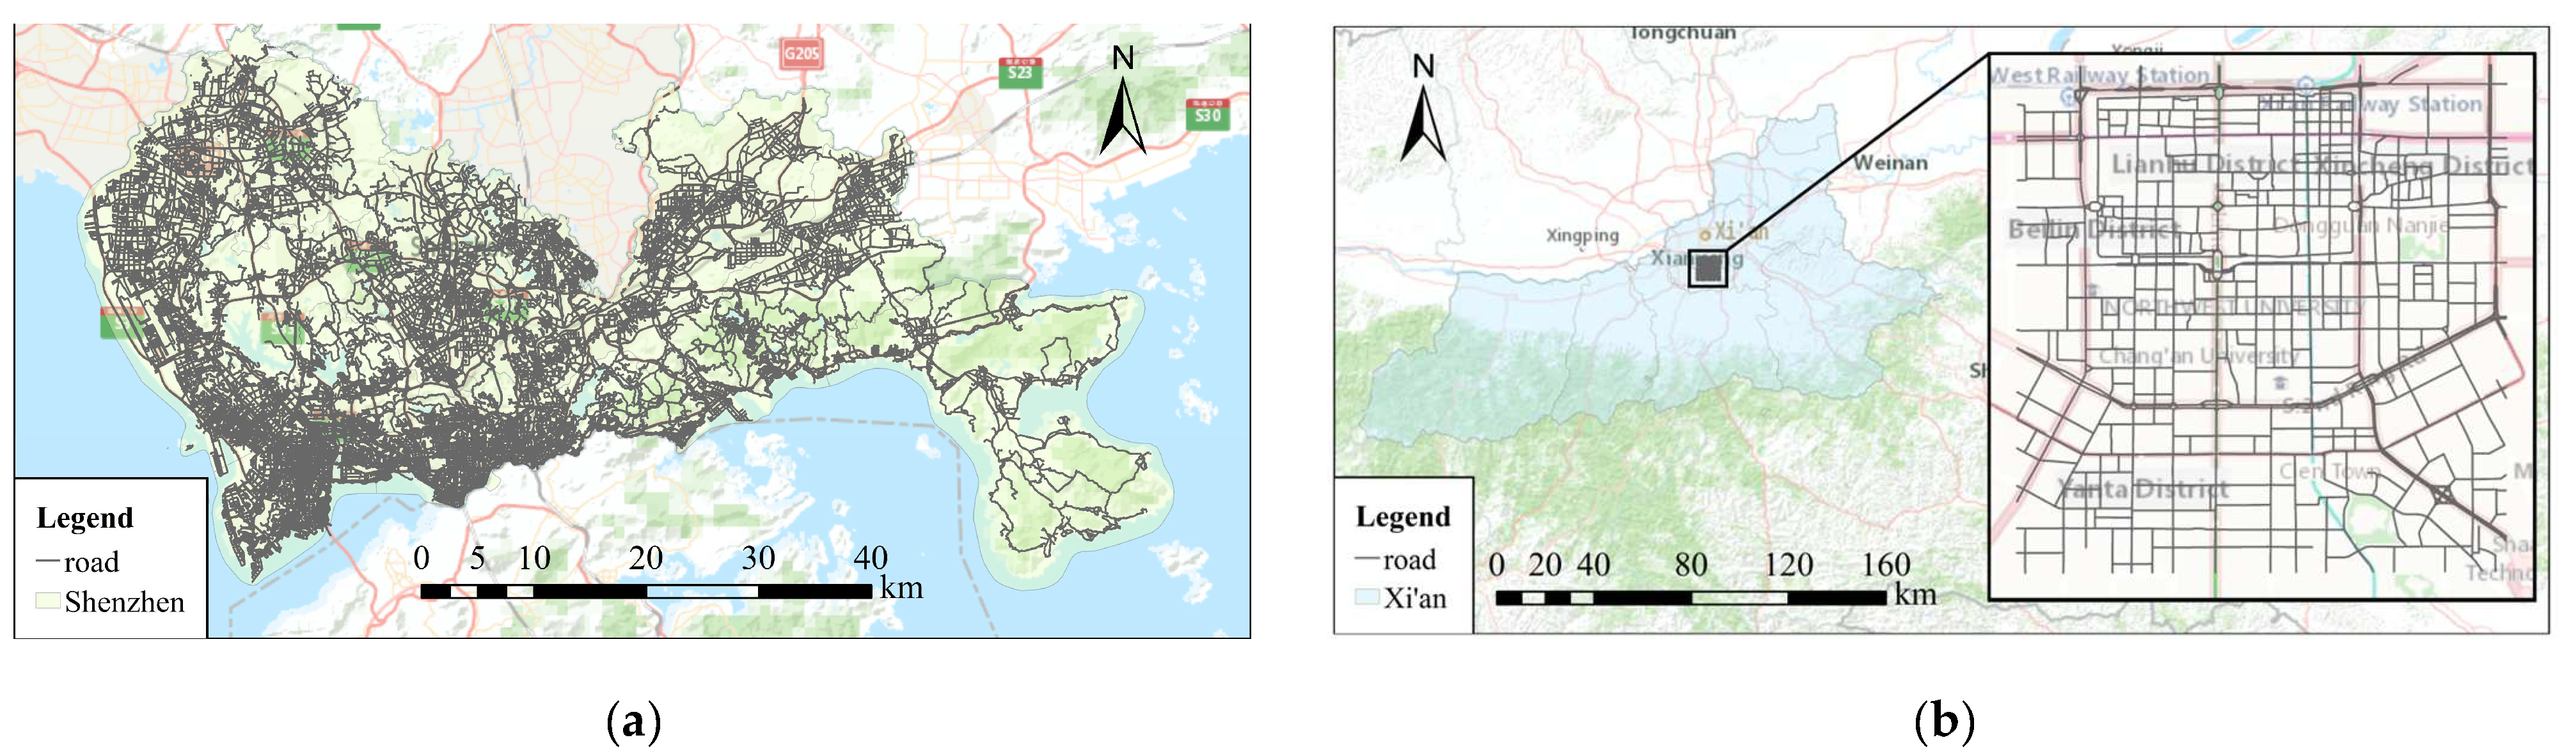
Two real-world datasets (i.e., the Shenzhen and Xi’an datasets) are used in this study to illustrate the effectiveness and superiority of the proposed representation learning framework. Each dataset comprises an urban road network and GPS trajectories. To recognize the fine-grained traffic information of road networks, we divide roads according to intersections and specific distances to form several small-road segments as the basic research units of our representation learning process. Thereafter, the ST-matching algorithm [26] is utilized to match GPS points to the corresponding road segments. Details of the datasets are provided in Table 1 and Table 2, respectively.

Table 1.
Statistics of the two road network datasets.
Table 2.
Statistics of trajectories of two datasets.
The Shenzhen dataset is a large-scale dataset that comprises over a million road segments. This dataset is used to demonstrate the effectiveness of the proposed method in improving the memory usage and computational efficiency. The Xi’an dataset is a small-scale dataset, and the Shenzhen dataset is used to verify the accuracy advantage of the proposed method in downstream traffic tasks. The study areas of the two datasets and their corresponding road networks are shown in Figure 5.
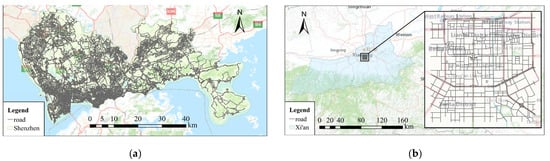
Figure 5.
The study area and the corresponding road network of (a) Shenzhen dataset and (b) Xi’an dataset.
4.2. Baselines and Downstream Traffic Tasks for Performance Evaluation
According to the categories of related works, we introduce baselines that are retrieved from general-network representation learning methods and geospatial property-based representation learning methods, as follows:
DeepWalk [14] embeds road segments in latent space via random walks based on only the topology structure of the road network.
Node2vec [6] is derived from DeepWalk. Node2vec designs a biased random walk procedure to capture the diversity of connectivity patterns. In road network representation, compared to DeepWalk, this method can learn richer topological features.
Road2vec [5] learns road segment representations from transportation elements. This method converts transportation elements into several NLP terms and utilizes the word2vec method to generate segment representations. In accuracy verification with traffic forecasting as the downstream task, this method provides great advantages over traditional methods.
To demonstrate the effectiveness of the proposed method, we choose a downstream traffic task that is highly dependent on the quality of the input features to assess the performance of these models with different representation inputs that are generated by DeepWalk, Node2Vec, Road2Vec and our method. The estimated time of arrival (ETA) as a basic service in intelligent transportation systems is widely deployed in various ride-hailing mobile apps [27]. Recently, outstanding ETA models are route-based models achieving high-precision estimation results by aggregating information of each road segment that is passed by vehicles [27,28,29,30]. Existing works note that the quality of road segment representation is crucial for accurate ETA estimation [3,4]. Therefore, we select several ETA models (i.e., GRU [31], GRU + ANN, DeepTTE [30], and WDR [28]) combined with road network representations that are retrieved from baseline methods and our framework to verify the advantage of the proposed representation learning framework.
In a performance evaluation, we use three metrics, i.e., the mean absolute percentage error (MAPE), root-mean-square error (RMSE), and mean average error (MAE):
where is the number of trips for which the ETA is needed, and and denote the model output and ground truth, respectively.
4.3. Experimental Settings
We implement our framework and all baseline methods on one machine with an NVIDIA RTX2080Ti GPU with 64 GB of raw memory and 16 CPU cores with the PyTorch library [32]. The hyperparameters , , , , and are set to 0.5, 12, 5, 10, and 30, respectively. During the training phase, we use the mini-batch gradient descent approach to optimize these parameters. Specifically, the learning rate and batch size are set to 0.001 and 341, respectively.
4.4. Efficiency Evaluation of Large-Scale Road Network Organization
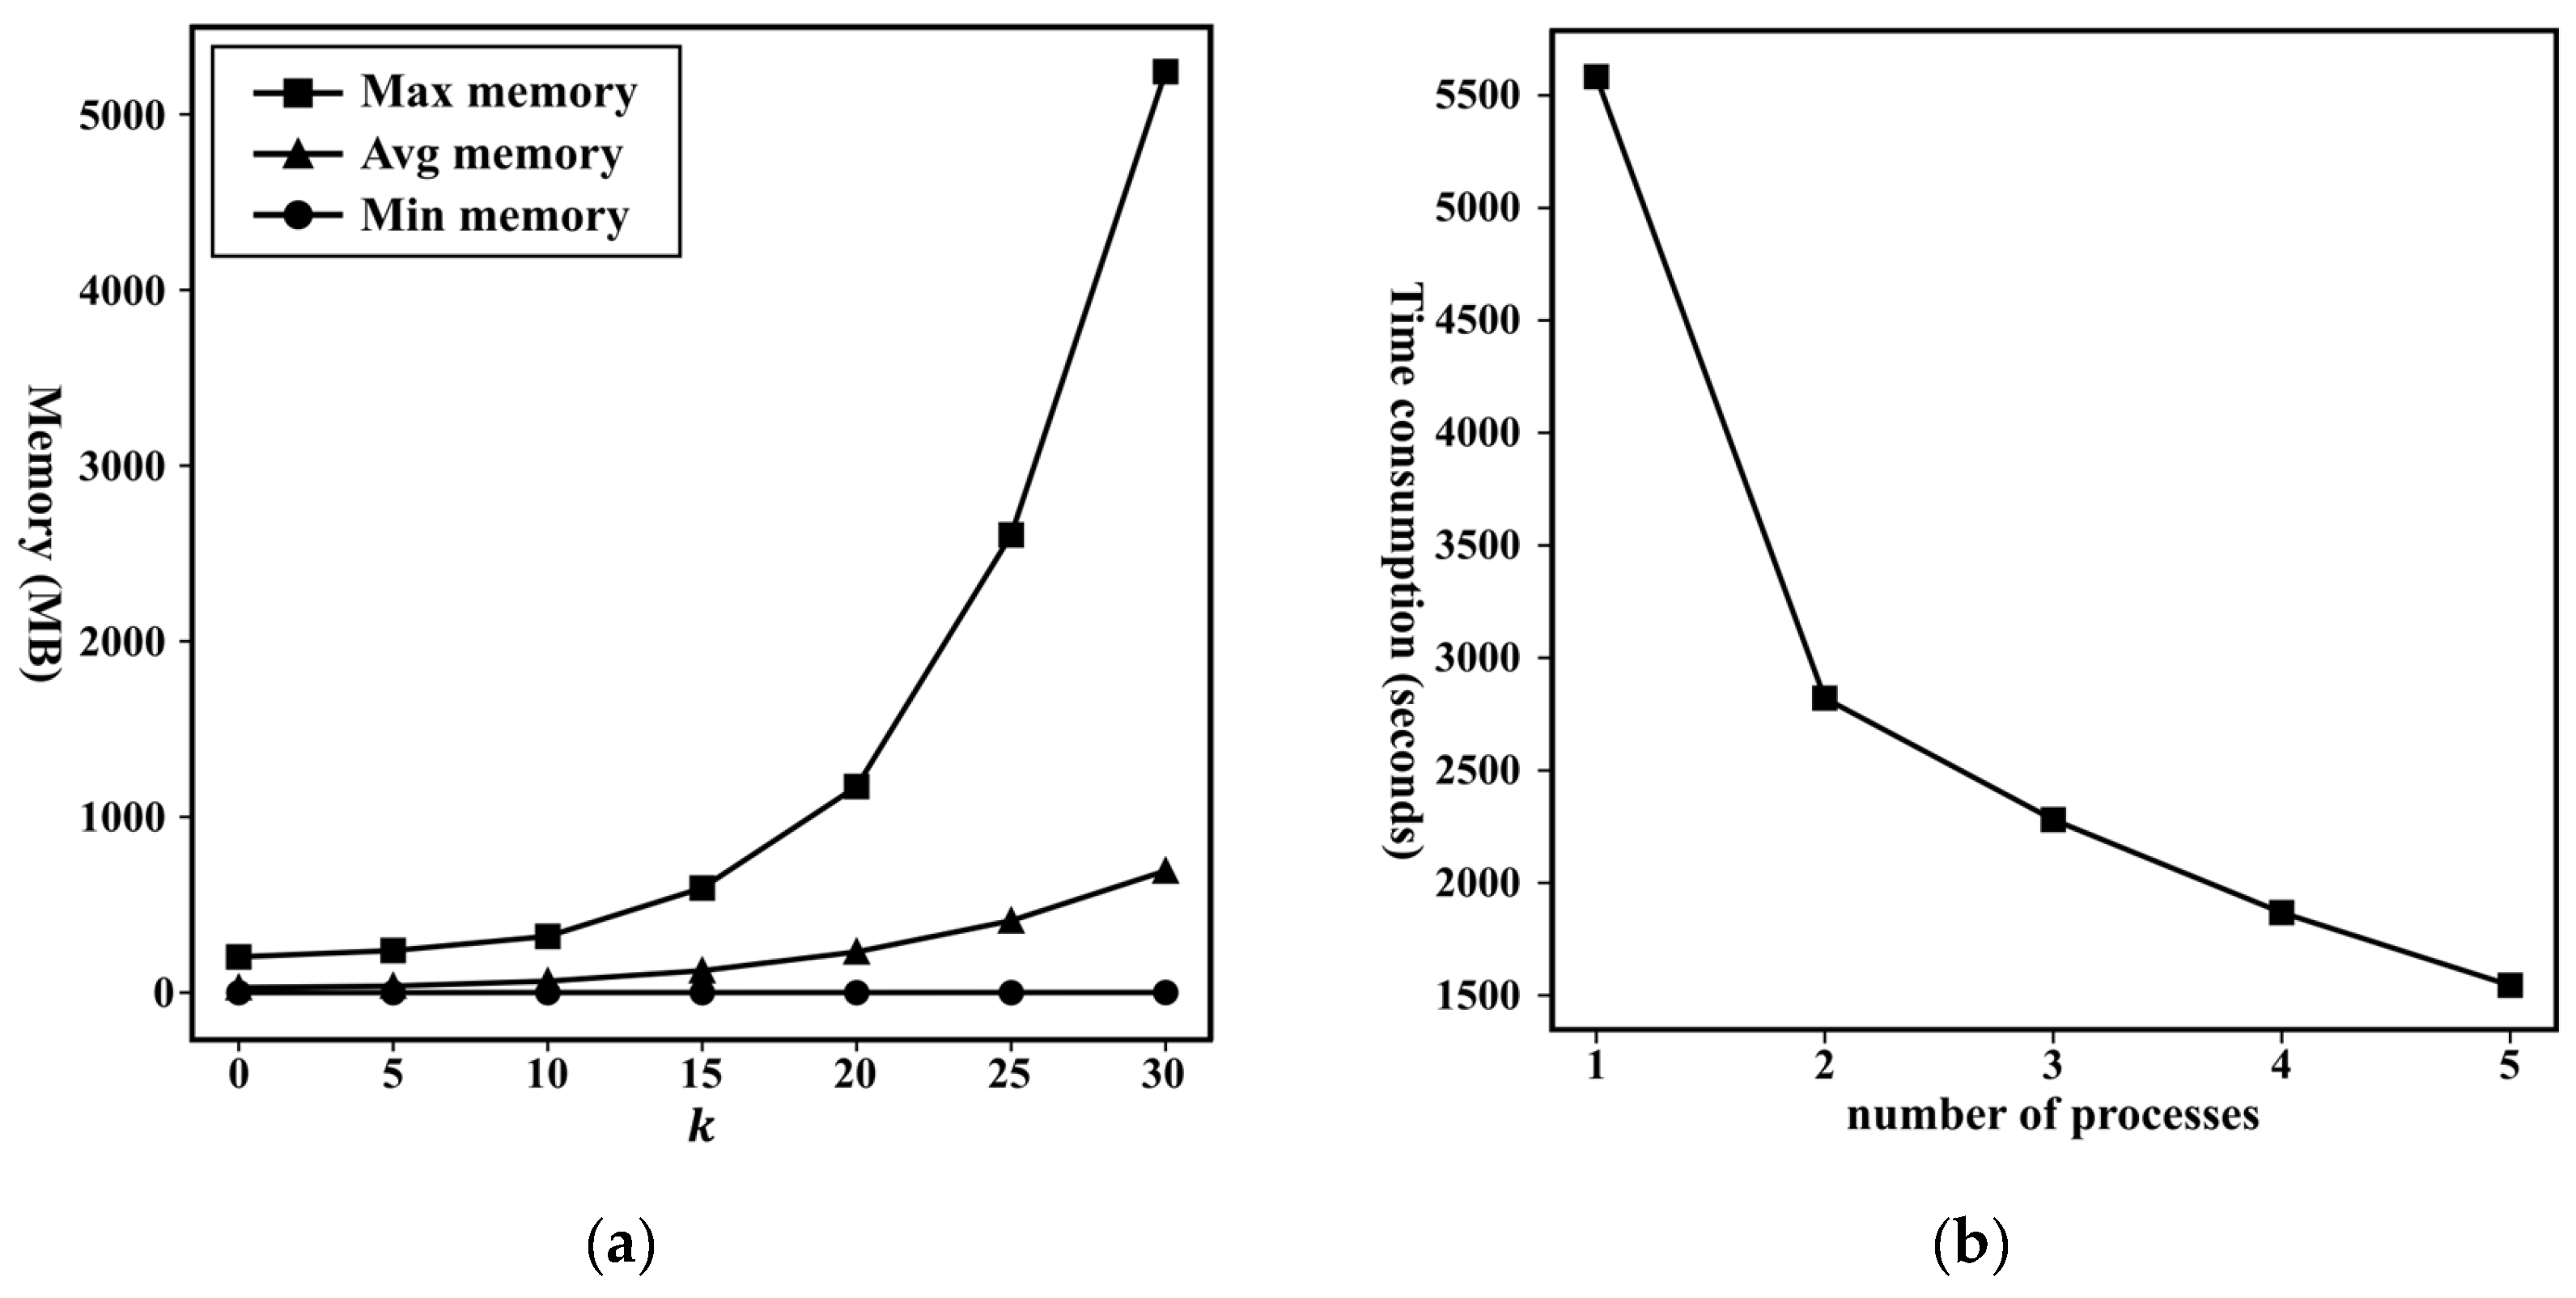
Before the performance evaluation of the downstream traffic task, we first illustrate the efficiency evaluation results of the proposed large-scale road network organization method in the multiview random walk process. With the use of a large-scale dataset, i.e., the Shenzhen dataset, as an example, the memory usage distribution of the subgraphs is shown in Figure 6a. Compared to the theoretical memory usage of 375 GB without optimal partitioning, our method significantly reduces the memory burden by optimal partitioning. Specifically, only approximately 1/60 of the theoretical memory usage is needed to perform the calculations. In addition, another advantage of our road network organization is that it is easy to parallelize the multiview random walk process via the partitioned subgraphs, thereby improving the computational time efficiency. As shown in Figure 6b, the computation speed exponentially increases with the number of processes.
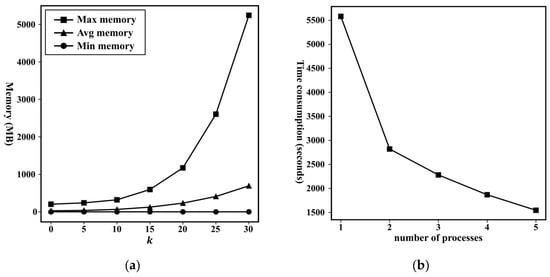
Figure 6.
Illustration of: (a) the memory usage efficiency; (b) random walk calculation efficiency of the proposed framework.
4.5. Performance Evaluation in Downstream Traffic Tasks
The goal of road network representation is to embed the road network into data-driven methods to better solve downstream traffic tasks. Here, we evaluate the performance in the ETA determination task, which uses road network representations that are retrieved from different methods. As reported in Table 3, the bolded and underlined numbers indicate the best performance among all the methods and among the baseline methods, respectively. In general, our framework provides significant advantages on the two datasets, especially the MAPE metric, and our framework leads overall. Considering the error that is attributed to the different ETA method structures, we select several ETA methods (i.e., GRU, GRU + DNN, DeepTTE, and WDR) for evaluation. Although some baseline methods perform better in rare cases, our framework consistently maintained a high accuracy under the different ETA methods. This demonstrates that accuracy improvement is a benefit of our representation learning framework, not of the unique structure of the different ETA methods.
Table 3.
Results of the baseline methods and our framework in the ETA determination task on the two datasets.
5. Analysis and Discussions
5.1. Information Evaluation of the Representations
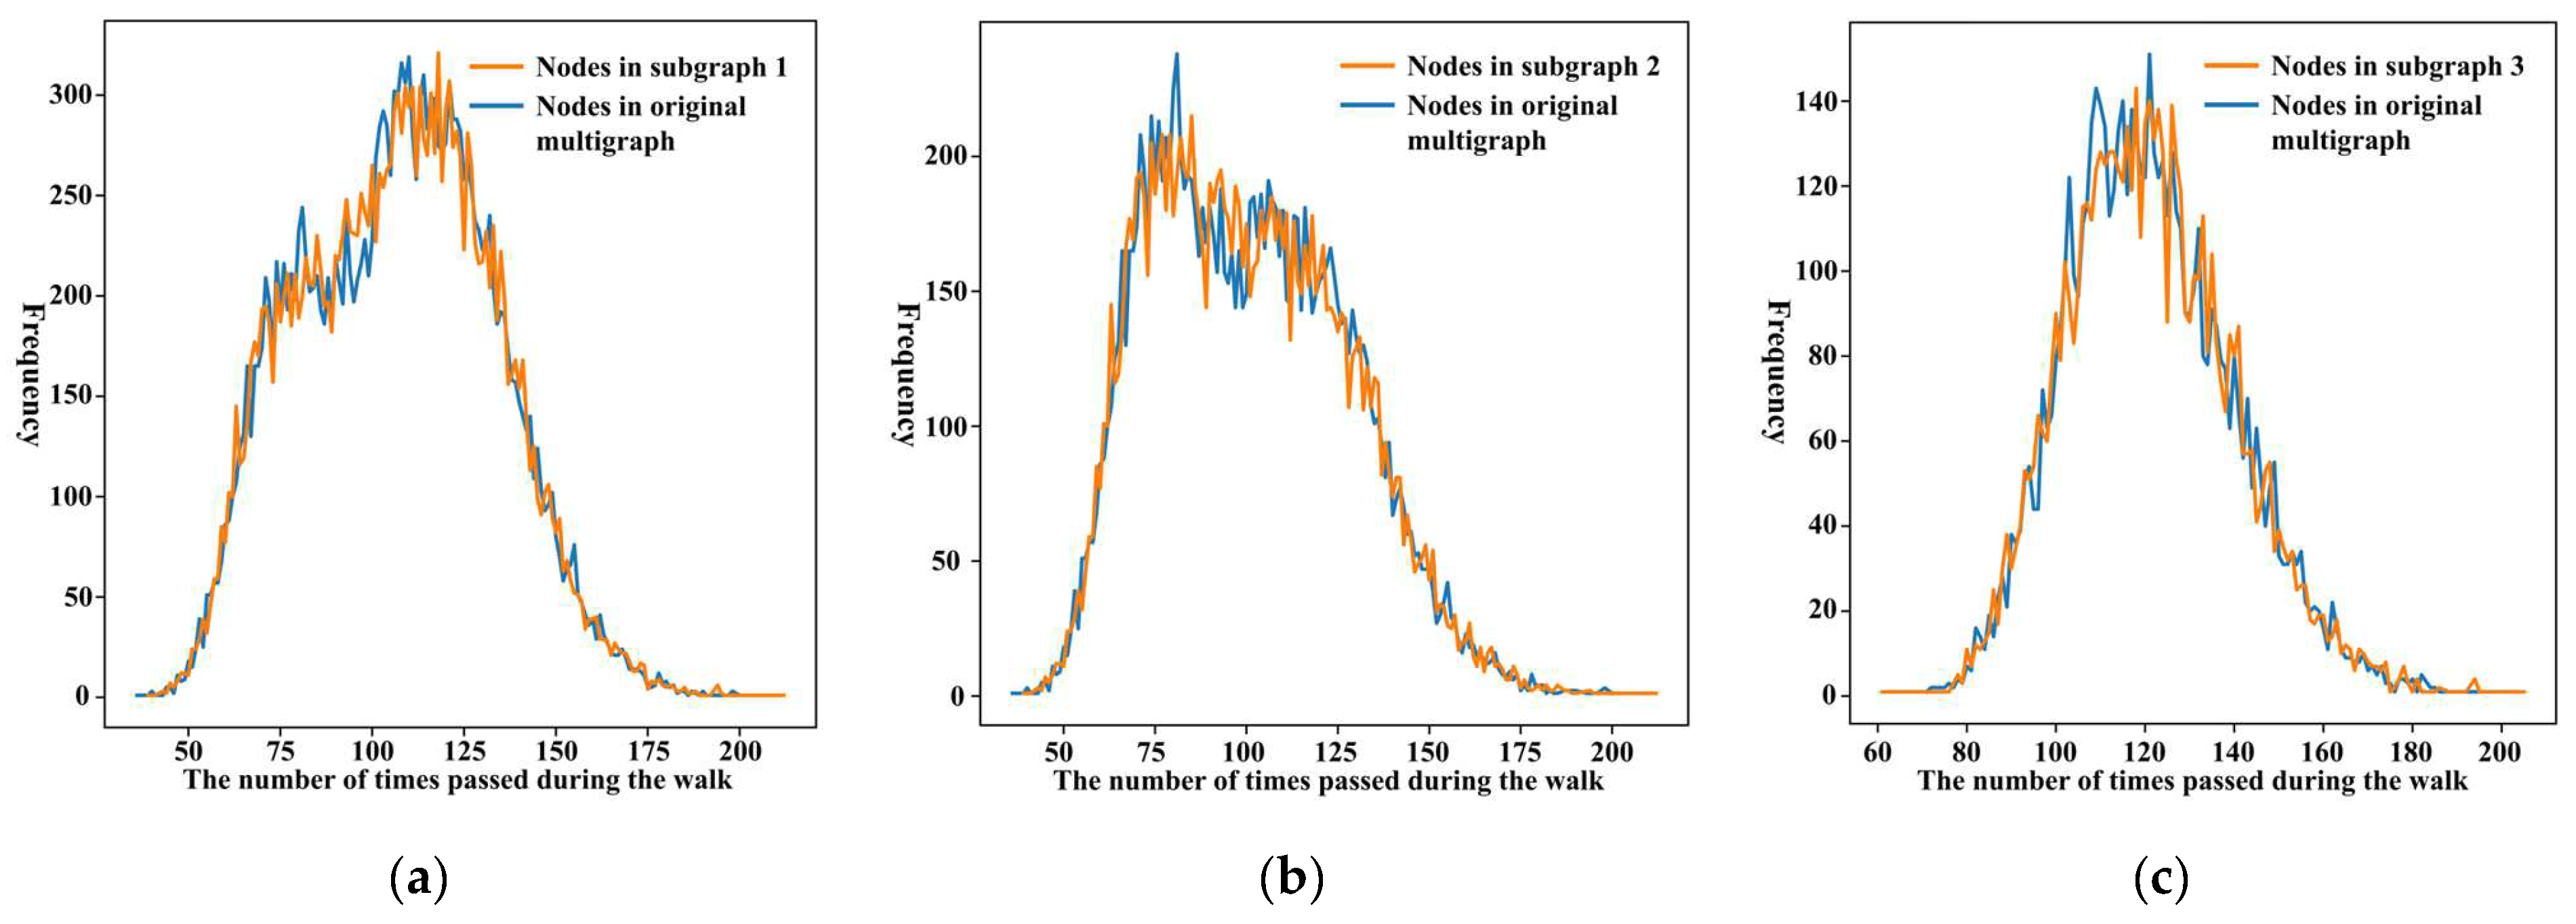
The information evaluation comprises two parts. One part aims to verify that the walk process on the partitioned subgraphs is information lossless, and the other part strives to verify that the representations produced by our framework can contain more information than that contained in the representation produced by baseline methods.
Figure 7 shows two frequency distributions of nodes in three subgraphs via two colors. The two frequency distributions are calculated from random walk sequences based on the original and partitioned subgraphs. It is evident that the two frequency distributions in the different subgraphs are almost the same, which suggests that the proposed road network organization does not affect the information that is expressed by each node in the multiview random walk process.
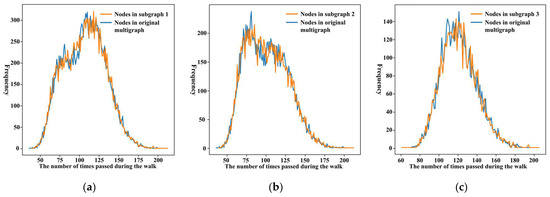
Figure 7.
Frequency distribution of each node in three subgraphs: (a–c) via the sequences generated based on the original multigraph (blue line) and partitioned subgraphs (orange line).
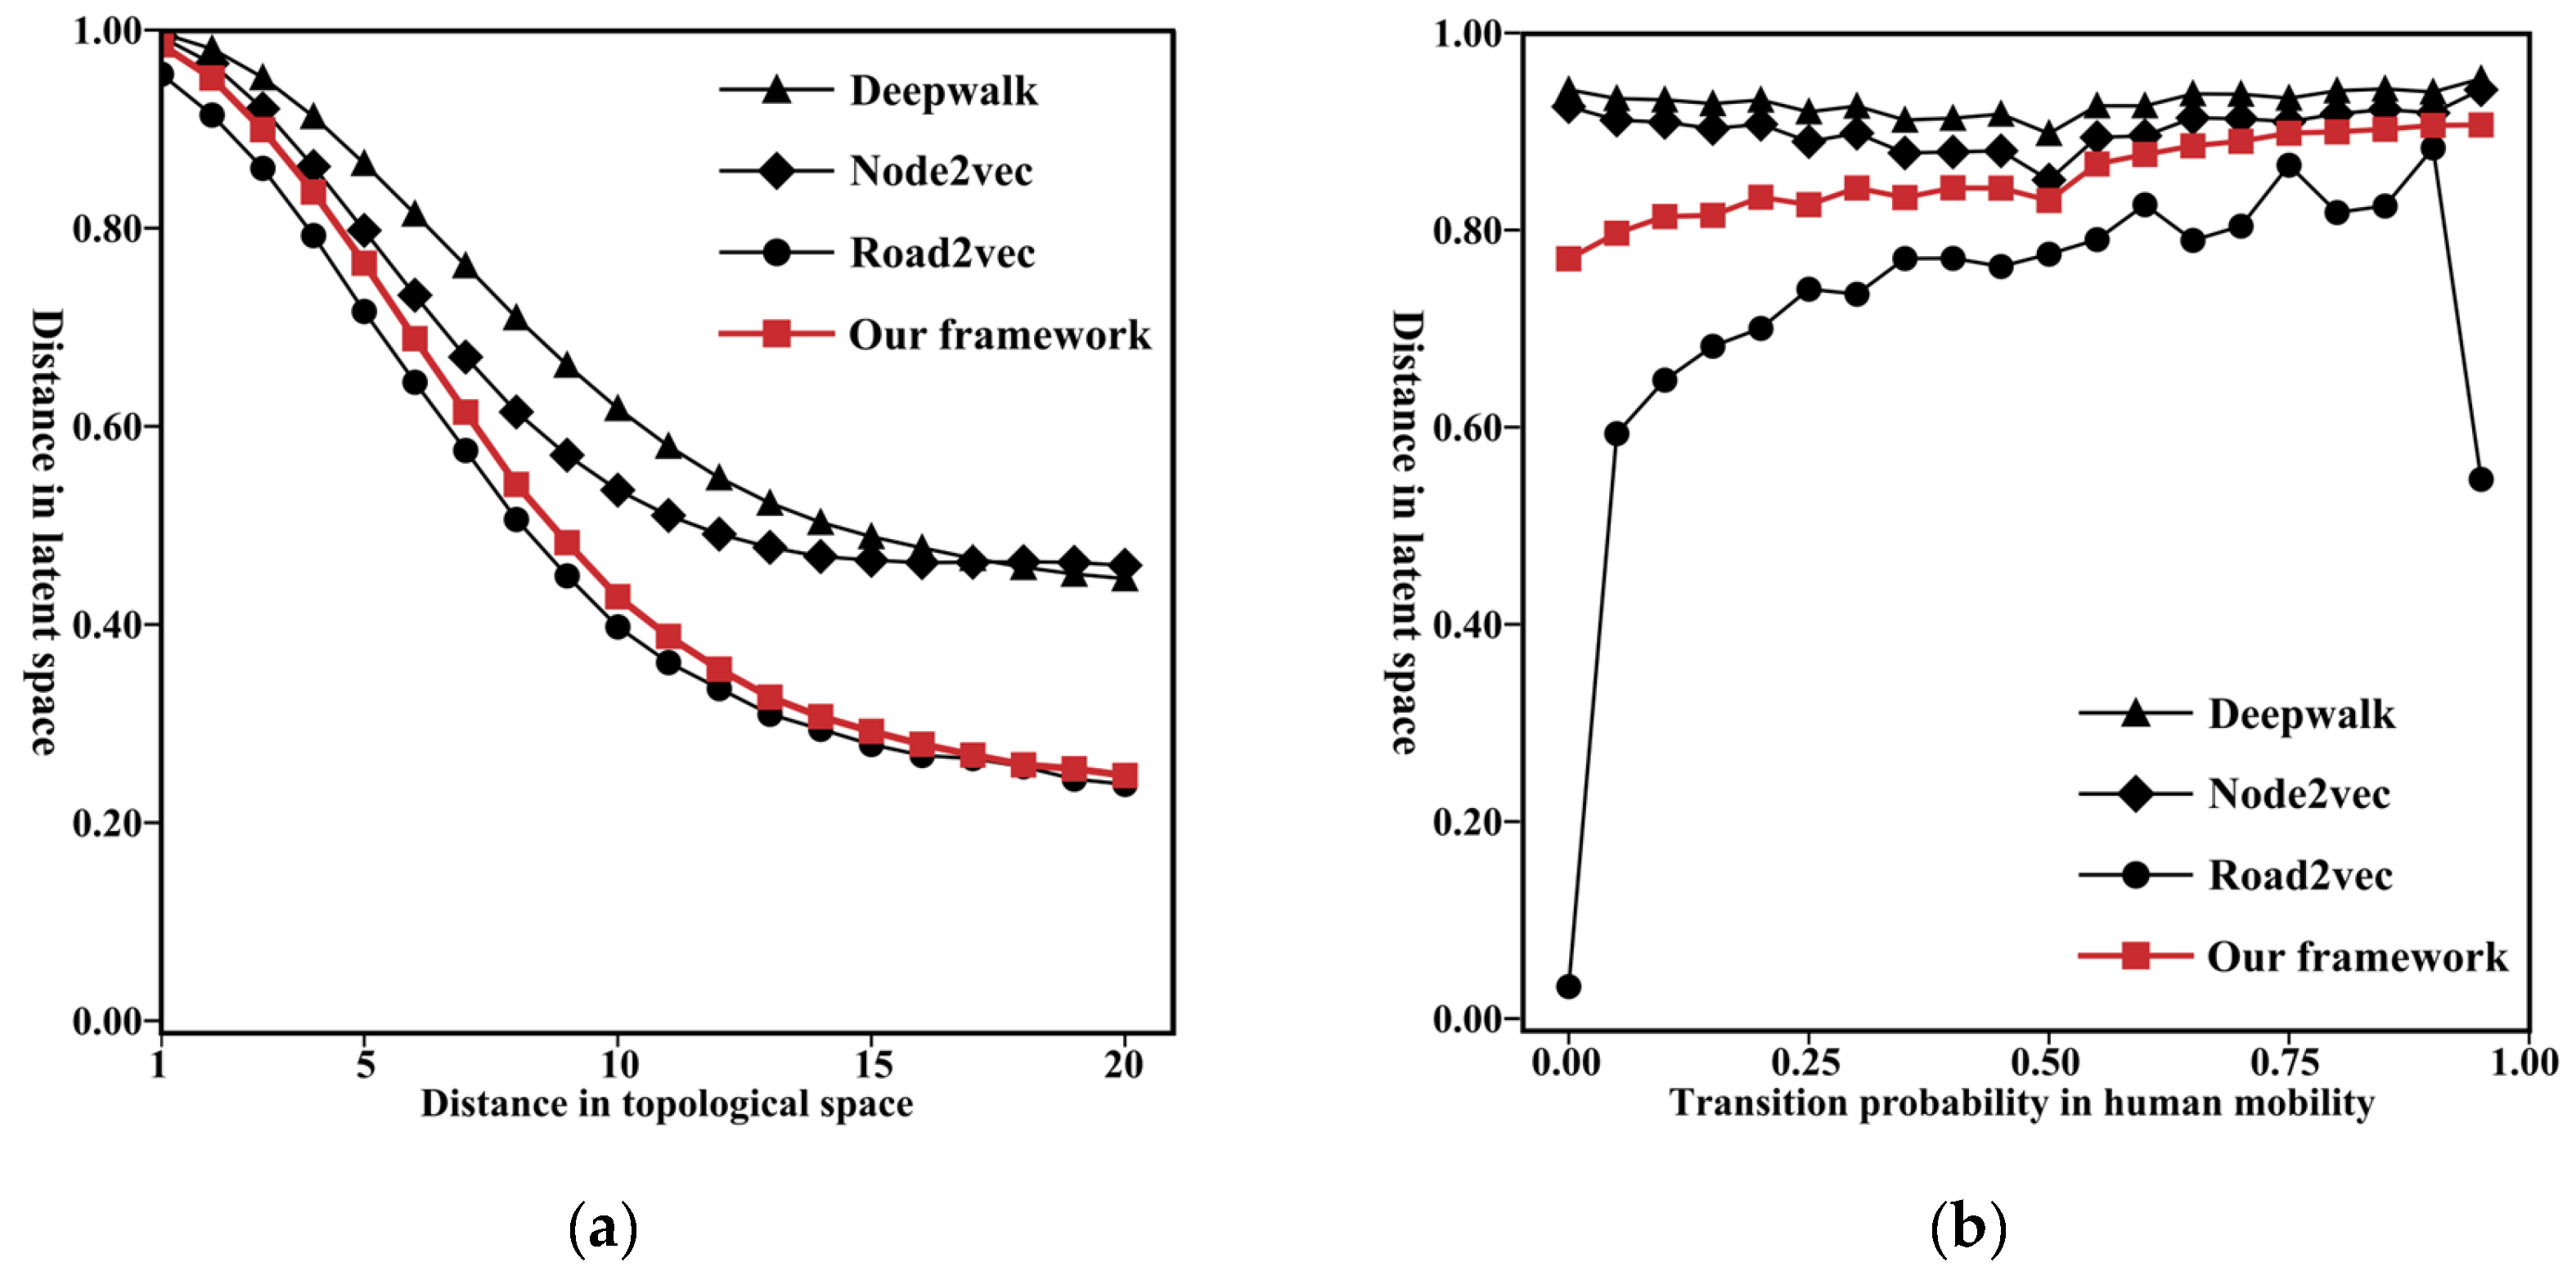
Furthermore, for each representation vector, there are three distances. One distance is the cosine distance in latent space, the second distance is the topological distance, and the third distance is the transition probability in human mobility. If the representation is topology aware, the smaller the topological distance between road segments, the smaller the cosine distance is between their corresponding vectors. As illustrated in Figure 8a, although all the methods can preserve topological information, our framework can preserve a larger amount. In our framework, the rate of change of the cosine distance with respect to the topological distance of the road segment is the most obvious and the most uniform. Additionally, if the representation is mobility aware, the lower the transition probability between road segments, the larger the cosine distance is between their corresponding vectors. As shown in Figure 8b, DeepWalk and Node2Vec lack the ability to preserve human mobility information, while our framework and Road2Vec can distinguish different transition probabilities in human mobility based on the cosine distance. However, when the transition probability is high (>0.8), the performance of Road2vec is low, and the trend of the curve abruptly changes within this interval. Based on the above analysis, compared to the baseline methods, our framework can preserve both topological and human mobility information.
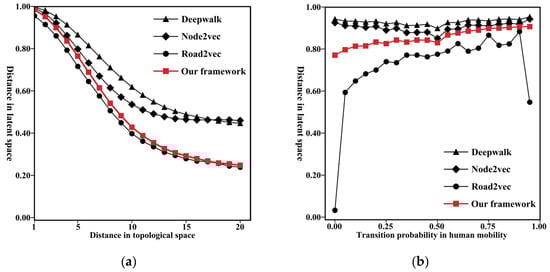
Figure 8.
Relationships of the different distances in various spaces, including: (a) the distance in latent space and the corresponding topological distance; (b) the distance in latent space and the corresponding transition probability.
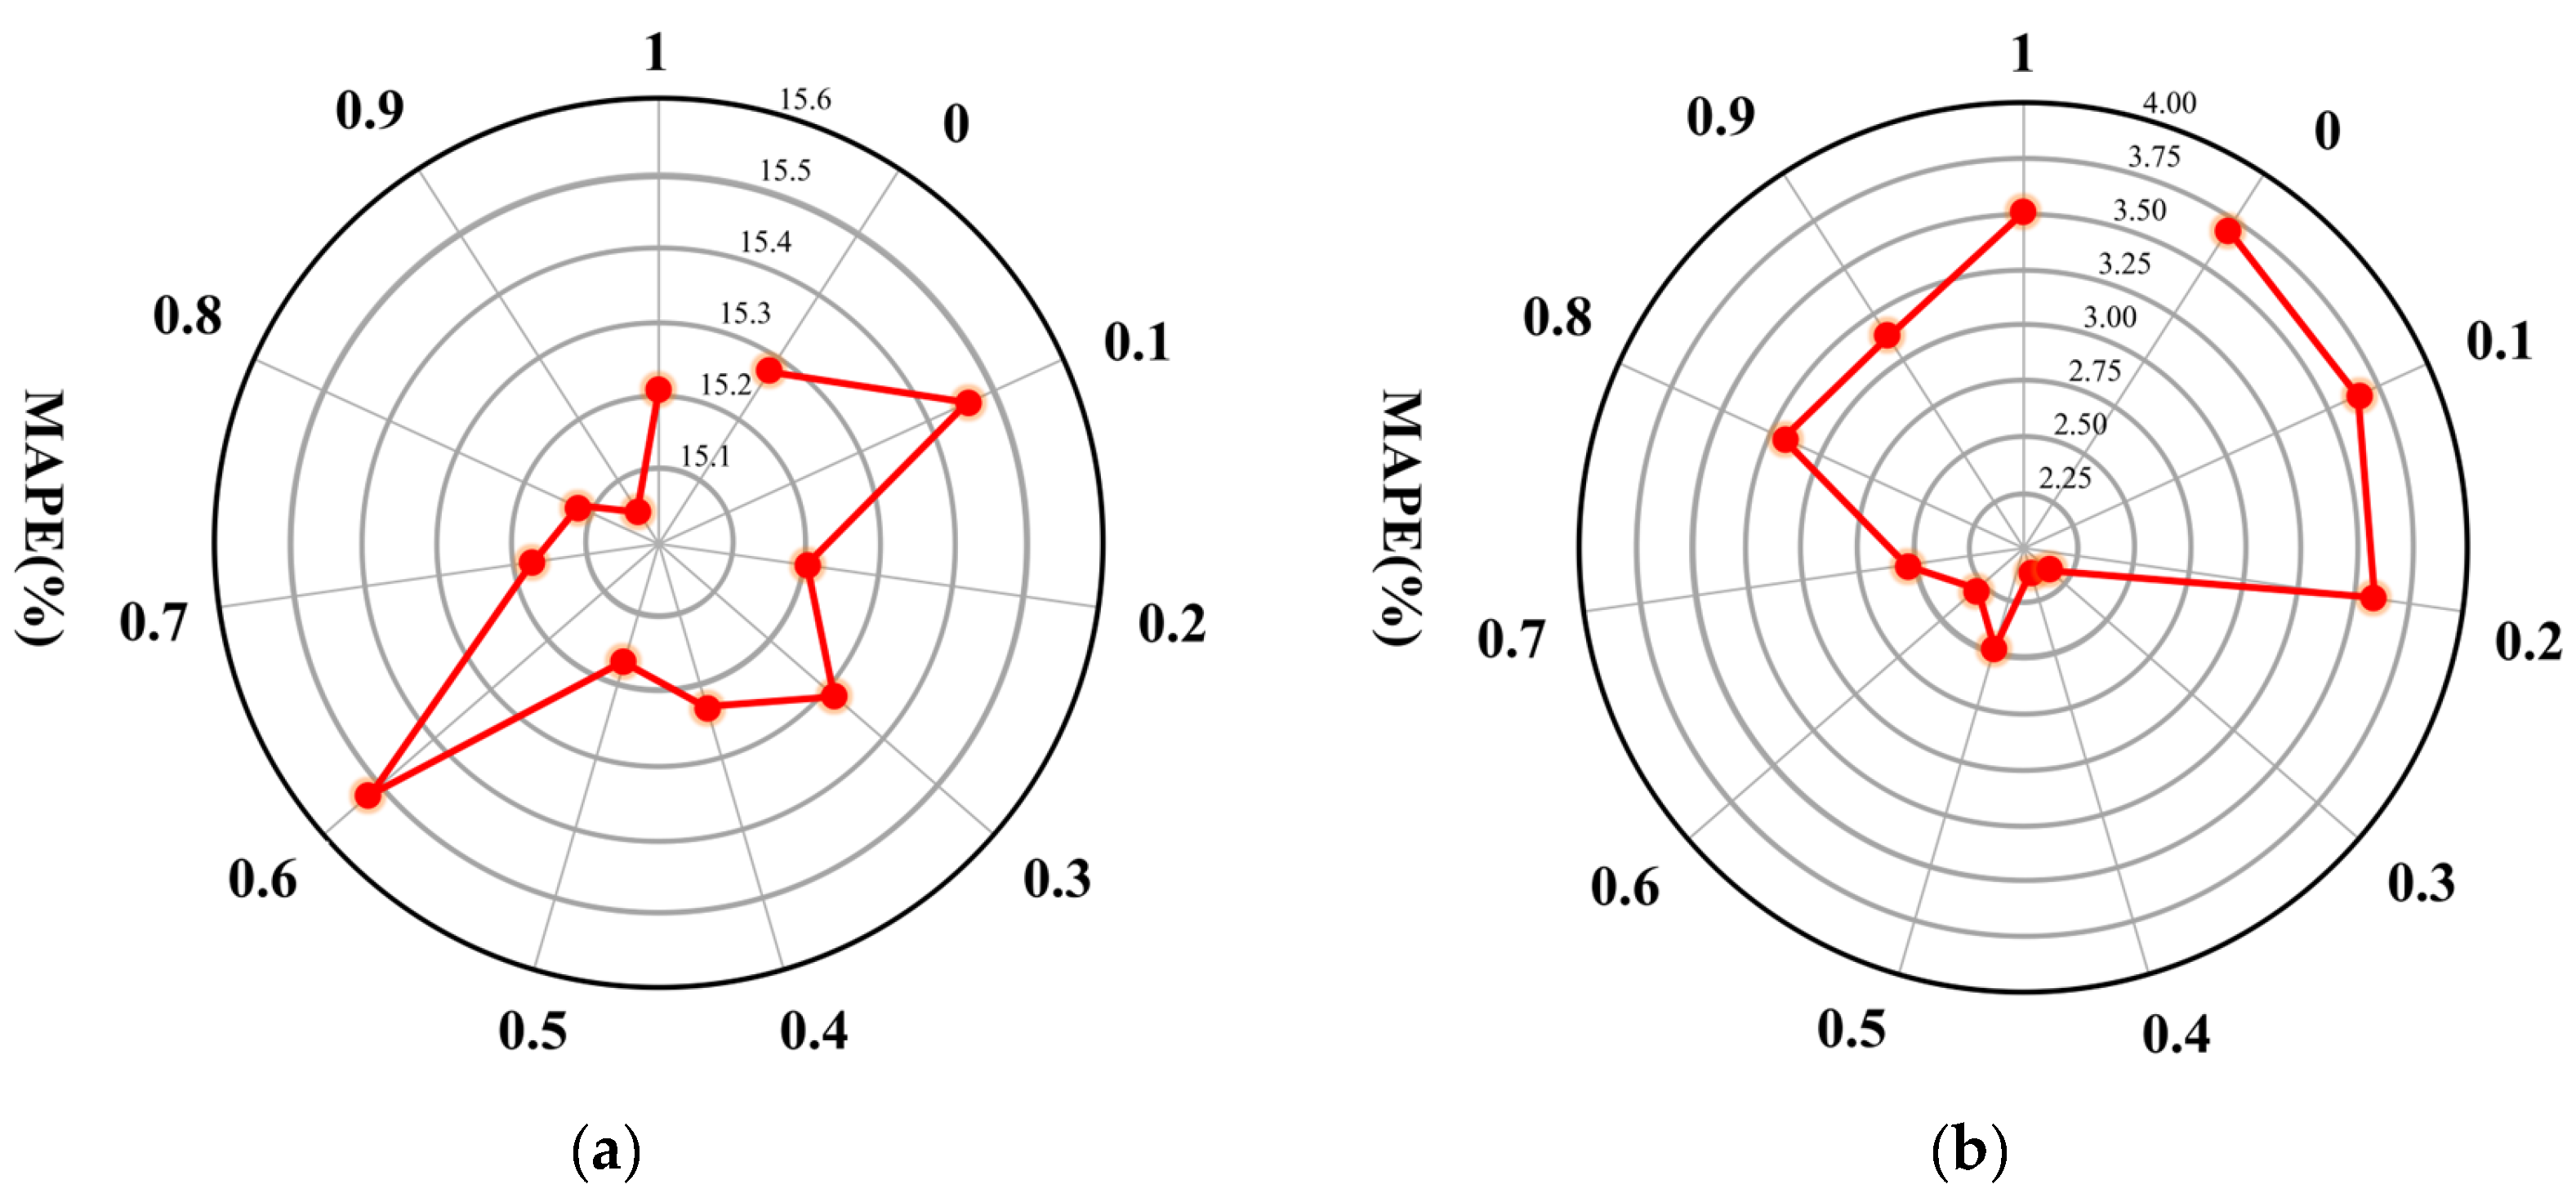
5.2. Effect of Topology and Human Mobility Information
To demonstrate the effectiveness of multiview information learning, we adjust hyperparameter in Equation (9) to control the different proportions of topology and human mobility information in the representation learning process. The ETA errors (MAPEs) resulting from the different representations under the various settings are illustrated in Figure 9. On the Xi’an dataset, there is a clear trend whereby the ETA error gradually decreases from only topology aware () or only mobility aware () to topology and mobility aware ( near 0.5). On the Shenzhen dataset, the minimum error occurs when the topology and mobility information are equally embedded (). This indicates the effectiveness of multiview information learning.
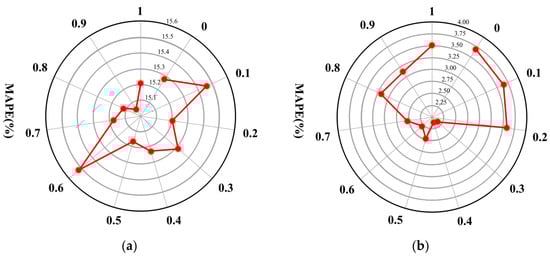
Figure 9.
MAPE variation with the different proportions of topology and human mobility information on the: (a) Shenzhen dataset; (b) Xi’an dataset.
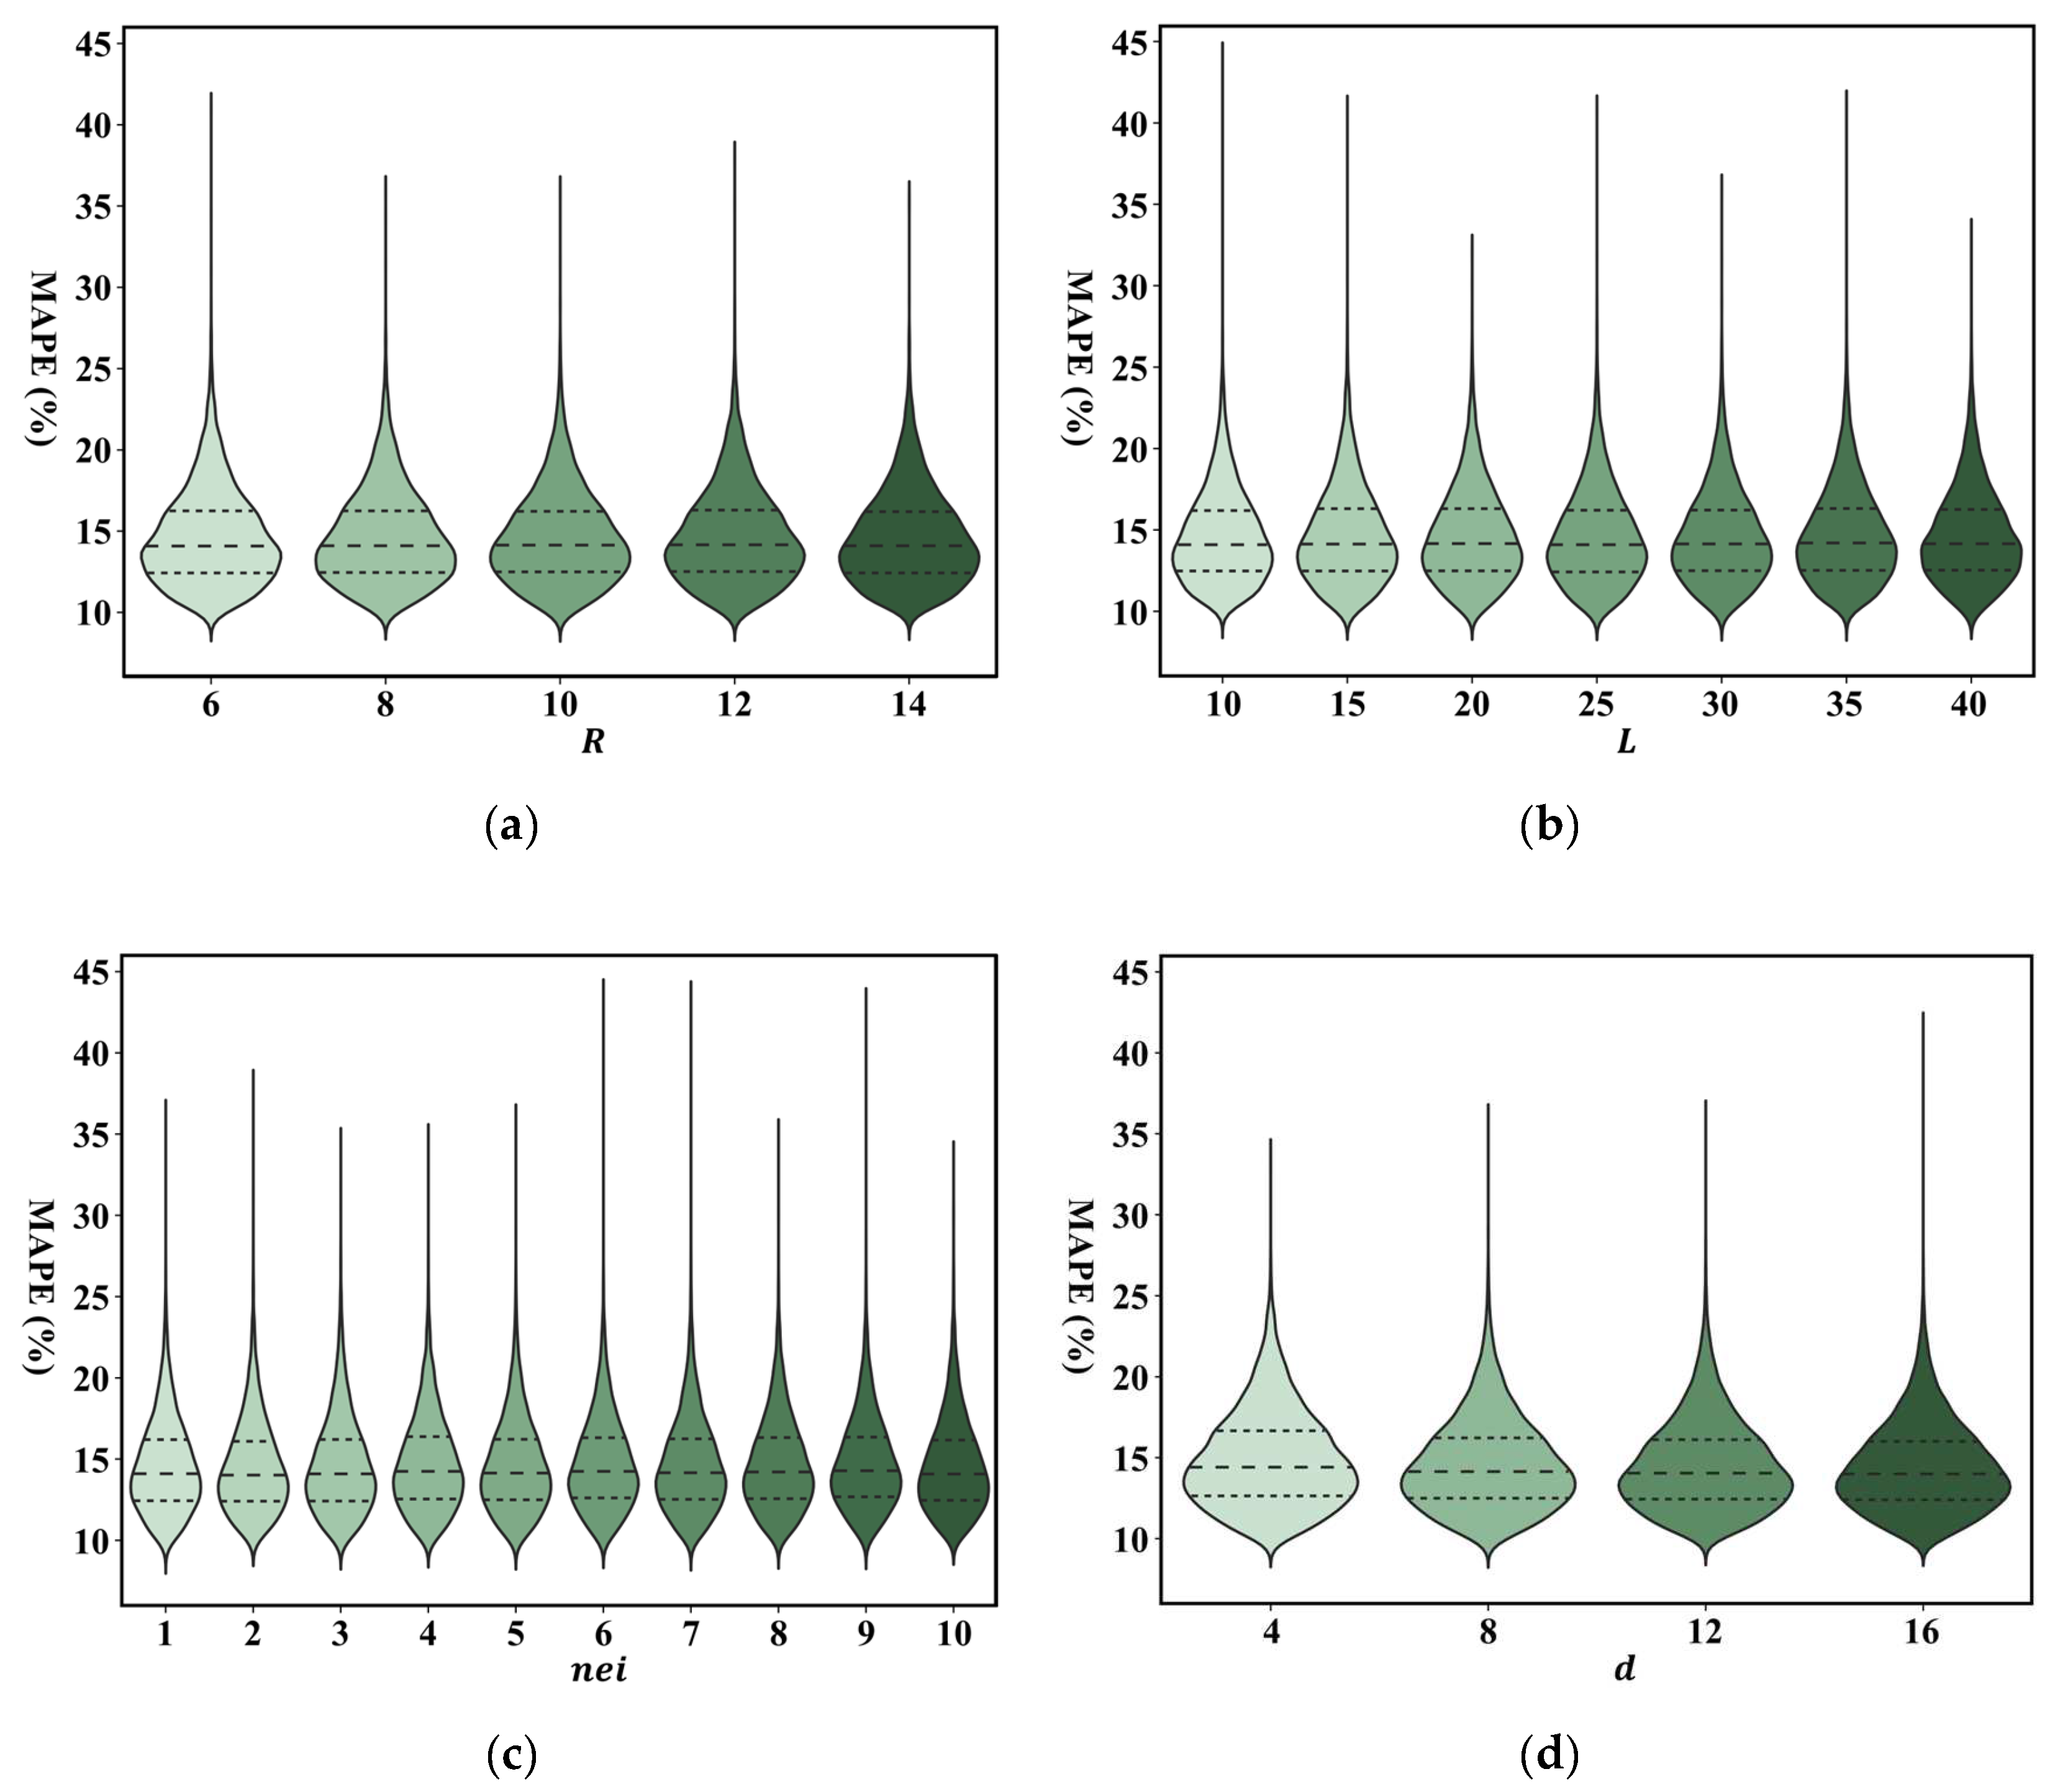
5.3. Hyperparameter Sensitivity
Next, we determine how different settings of the hyperparameters affect the calculation performance and calculation efficiency of our framework on the Shenzhen dataset in the ETA determination task. The hyperparameters include the length and number of sequences that are generated from each starting node, the size of neighborhood , and the dimension of representations in the learning process. The results of the calculation performance are shown in Figure 10. The mean and standard deviation values of MAPE under the different hyperparameter settings consistently remain at a very similar level. This demonstrates that the different settings of the hyperparameters do not affect the accuracy of solving downstream tasks based on our representation framework.
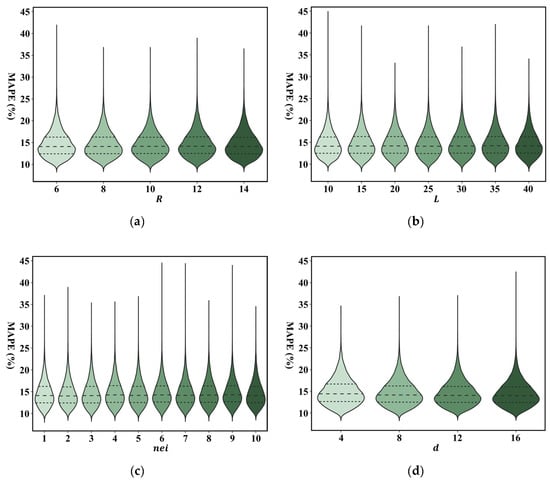
Figure 10.
ETA performance for the different hyperparameter settings, including: (a) : the number of sequences generated from each starting node; (b) : the length of the sequence generated by the random walk; (c) : the size of neighborhood in representation learning; (d) : the dimension of the learned representation.
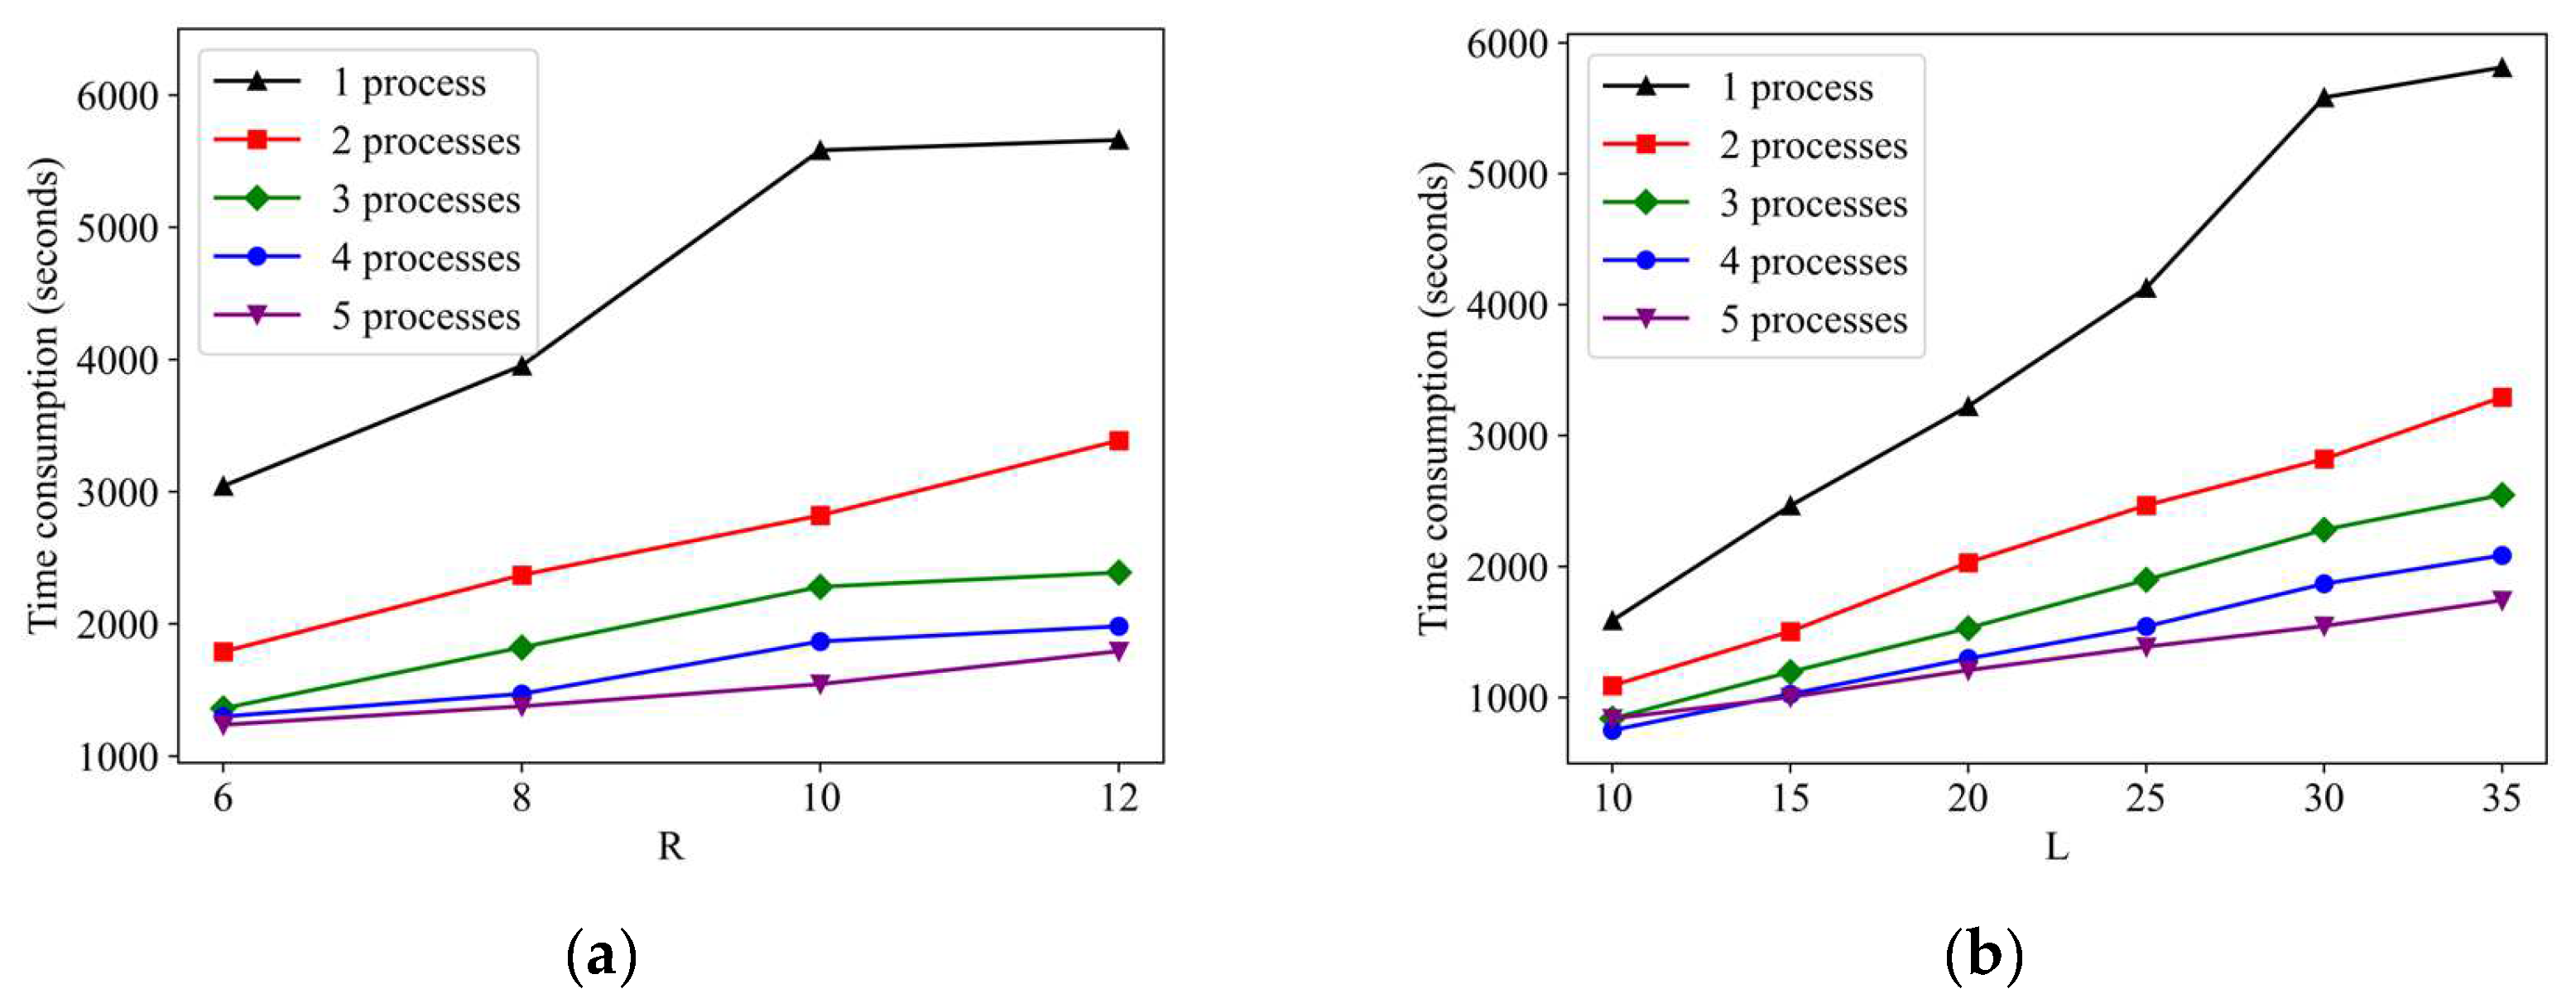
As for the calculation efficiency of our framework under the different hyperparameter settings, we adjust the values of hyperparameters and to observe the time-consuming changes during the random walk process. As shown in Figure 11, in most cases, with the increase in the two hyperparameter values, the calculation time also increases accordingly. The hyperparameter also has a greater impact on computation speed than hyperparameter . However, due to the large-scale road network organization method in our framework, we can also observe that the increased computing time that is caused by setting larger parameters can be completely offset by parallel computing. For instance, when we use six processes for parallel computing, no matter how large and are set, the computational efficiency is higher than the case of non-parallel computing when the values of and are the smallest. Based on the above analysis, our framework can be more easily deployed in intelligent transportation systems to serve different traffic analysis tasks.
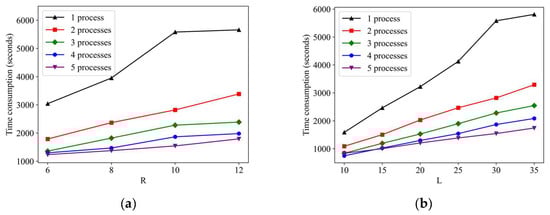
Figure 11.
Random walk calculation efficiency under the different hyperparameter settings, including: (a) : the number of sequences generated from each starting node; (b) : the length of the sequence generated by the random walk.
6. Conclusions
This paper presents a novel multiview representation learning framework for large-scale urban road networks that simultaneously preserves topological and human mobility information. Specifically, a road network organization method is proposed in this paper to effectively optimize the calculation efficiency and memory usage of the random walk algorithm for large-scale urban road networks. Based on this concept, we develop a multiview random walk method to capture the structure function of the road network from a topology-aware graph and vehicle transfer pattern from a mobility-aware graph. Finally, we utilize word2vec to generate representations of the road network.
In the experiments, two real-world datasets and the ETA determination task are utilized to evaluate the performance of our framework. The experimental results indicate the superiority of the proposed framework over baseline methods in three ways. ① The large-scale road network organization in our framework can effectively reduce the memory usage of the representation learning process and can improve the computational efficiency in real-world large-scale road network learning. ② The multiview random walk method in our framework can preserve both topological and human mobility information, but the baseline methods can only preserve one of them. ③ In the downstream traffic task, the representations that are generated based on our framework achieve the highest accuracy, compared to the baseline methods, which shows that our framework has great advantages in terms of accuracy and efficiency in practical application and deployment.
However, there are also some limitations in our framework: ① As an important part of a complex urban system, the road traffic network is inherently affected by the surrounding geographical environment, and our framework cannot model such geographical scene characteristics. ② The relationship between road segments is also dynamic and non-stationarity in the time dimension, which our method cannot handle. Based on this, in the future, we will continue to enhance the road network representation framework in the following ways: first, unstructured knowledge in the human perception of road networks (e.g., this road is the main road connecting two functional areas) should be considered to enrich the multiview context. Furthermore, road network representations should be dynamic over time to identify the different characteristics of different road segments at various times (e.g., morning and evening peaks).
Author Contributions
Conceptualization, K.C., Y.S. and M.D.; methodology, K.C. and G.C.; validation, G.C. and K.L.; formal analysis, K.C.; resources, Y.S. and M.D.; data curation, K.C., G.C. and K.L.; writing—original draft preparation, K.C.; writing—review and editing, K.C.; visualization, G.C. and K.L.; supervision, M.D. and Y.S.; project administration, M.D., K.C. and Y.S.; funding acquisition, M.D. All authors have read and agreed to the published version of the manuscript.
Funding
This work was supported by the National Natural Science Foundation of China (NFSC), Project No. 42171459 and 41901319; the Key Program of the National Natural Science Foundation of China, Project No. 41730105.
Institutional Review Board Statement
Not applicable.
Informed Consent Statement
Not applicable.
Data Availability Statement
Not applicable.
Acknowledgments
This work was conducted in part using computing resources at the High-Performance Computing Platform of the Central South University.
Conflicts of Interest
The authors declare no conflict of interest.
Appendix A
| Algorithm A1: Multiview Random Walk. |
| Input: |
| (a) Matrix |
| (b) Hyperparameters and L |
| (c) Subgraphs } |
| (d) Patches } |
| Output: |
| (a) random walk sequences |
| Variables: |
| : index of node in ; : index of the sequence generated by the random walk process based on the same start node; : index of the node in one sequence; : index of random walk index; : sampled node in step . |
| Method: |
| 1. //initialization |
| 2. Ifthen |
| 3. Select as the start node |
| 4. If then |
| 5. Set as and append to |
| 6. →0, →0 |
| 7. For from 1 to L |
| 8. If } then |
| 9. Sample the next node based on utilizing the intrasubgraph index |
| 10. Append to sequence |
| 11. Else |
| 12. Sample the next node based on utilizing the intersubgraph index |
| 13. Append to sequence |
| 14. End if |
| 15. t →t + 1 |
| 16. End for |
| 17. → + 1 |
| 18. End if |
| 19. i → i + 1 |
| 20. End if |
| 21. Return |
References
- Wang, M.X.; Lee, W.C.; Fu, T.Y.; Yu, G. On representation learning for road networks. ACM Trans. Intell. Syst. Technol. 2020, 12, 1–27. [Google Scholar] [CrossRef]
- Chen, K.; Deng, M.; Shi, Y. A temporal directed graph convolution network for traffic forecasting using taxi trajectory data. ISPRS Int. J. Geo-Inf. 2021, 10, 624. [Google Scholar] [CrossRef]
- Hong, H.; Lin, Y.; Yang, X.; Li, Z.; Fu, K.; Wang, Z.; Qie, X.; Ye, J. HetETA: Heterogeneous information network embedding for estimating time of arrival. In Proceedings of the 26th ACM SIGKDD International Conference on Knowledge Discovery & Data Mining, Virtual, CA, USA, 6–10 July 2020; pp. 2444–2454. [Google Scholar]
- Derrow-Pinion, A.; She, J.; Wong, D.; Lange, O.; Hester, T.; Perez, L.; Nunkesser, M.; Lee, S.; Guo, X.; Wiltshire, B.; et al. ETA prediction with graph neural networks in Google maps. In Proceedings of the 30th ACM International Conference on Information & Knowledge Management, Quensland, Australia, 1–5 November 2021; pp. 3767–3776. [Google Scholar]
- Liu, K.; Gao, S.; Qiu, P.; Liu, X.; Yan, B.; Lu, F. Road2Vec: Measuring traffic interactions in urban road system from massive travel routes. ISPRS Int. J. Geo-Inf. 2017, 6, 321. [Google Scholar] [CrossRef] [Green Version]
- Grover, A.; Leskovec, J. node2vec: Scalable feature learning for networks. In Proceedings of the 22nd ACM SIGKDD International Conference on Knowledge Discovery and Data Mining, San Francisco, CA, USA, 13–17 August 2016; pp. 855–864. [Google Scholar]
- Sui, D.Z. Tobler’s first law of geography: A big idea for a small world? Ann. Assoc. Am. Geogr. 2004, 94, 269–277. [Google Scholar] [CrossRef]
- Schläpfer, M.; Dong, L.; O’Keeffe, K.; Santi, P.; Szell, M.; Salat, H.; Anklesaria, S.; Vazifeh, M.; Ratti, C.; West, G.B. The universal visitation law of human mobility. Nature 2021, 593, 522–527. [Google Scholar] [CrossRef]
- Zhu, M.; Chen, W.; Xia, J.; Ma, Y.; Zhang, Y.; Luo, Y.; Huang, Z.; Liu, L. Location2vec: A situation-aware representation for visual exploration of urban locations. IEEE Trans. Intell. Transp. Syst. 2019, 20, 3981–3990. [Google Scholar] [CrossRef]
- Tang, J.; Qu, M.; Wang, M.; Zhang, M.; Yan, J.; Mei, Q. LINE: Large-scale information network embedding. In Proceedings of the 24th International Conference on World Wide Web, Florence, Italy, 18–22 May 2015; pp. 1067–1077. [Google Scholar]
- Song, G.; Zhang, L.; Li, Z.; Li, Y. Large scale network embedding: A separable approach. IEEE Trans. Knowl. Data Eng. 2020, 34, 1829–1842. [Google Scholar] [CrossRef]
- Mikolov, T.; Chen, K.; Corrado, G.; Dean, J. Efficient estimation of word representations in vector space. arXiv 2013, arXiv:1301.3781. [Google Scholar]
- LeCun, Y.; Bengio, Y.; Hinton, G. Deep learning. Nature 2015, 521, 436–444. [Google Scholar] [CrossRef]
- Perozzi, B.; Al-Rfou, R.; Skiena, S. DeepWalk: Online learning of social representations. In Proceedings of the 20th ACM SIGKDD International Conference on Knowledge Discovery and Data Mining, New York, NY, USA, 24–27 August 2014; pp. 701–710. [Google Scholar]
- Guo, W.; Gao, H.; Shi, J.; Long, B.; Zhang, L.; Chen, B.C.; Agarwal, D. Deep natural language processing for search and recommender systems. In Proceedings of the 25th ACM SIGKDD International Conference on Knowledge Discovery & Data Mining, Anchorage, AK, USA, 4–8 August 2019; pp. 3199–3200. [Google Scholar]
- Nixon, M.S.; Aguado, A.S. Feature Extraction & Image Processing for Computer Vision; Academic Press: Amsterdam, The Netherlands, 2019. [Google Scholar]
- Jepsen, T.; Jensen, C.; Nielsen, T.; Torp, K. On network embedding for machine learning on road networks: A case study on the Danish road network. In Proceedings of the 2018 IEEE International Conference on Big Data (Big Data), Seattle, WA, USA, 10–13 December 2018; pp. 3422–3431. [Google Scholar]
- Wu, N.; Zhao, X.W.; Wang, J.; Pan, D. Learning effective road network representation with hierarchical graph neural networks. In Proceedings of the 26th ACM SIGKDD International Conference on Knowledge Discovery & Data Mining, Virtual Event, CA, USA, 6–10 July 2020; pp. 6–14. [Google Scholar]
- Wang, M.X.; Lee, W.C.; Fu, T.Y.; Yu, G. Learning embeddings of intersections on road networks. In Proceedings of the 27th ACM SIGSPATIAL International Conference on Advances in Geographic Information Systems, Chicago, IL, USA, 5–8 November 2019; pp. 309–318. [Google Scholar]
- Crosby, H.; Damoulas, T.; Jarvis, S.A. Embedding road networks and travel time into distance metrics for urban modelling. Int. J. Geogr. Inf. Sci. 2019, 33, 512–536. [Google Scholar] [CrossRef] [Green Version]
- Zhou, J.; Cui, G.; Hu, S.; Zhang, Z.; Yang, C.; Liu, Z.; Wang, L.; Li, C.; Sun, M. Graph neural networks: A review of methods and applications. AI Open 2020, 1, 57–81. [Google Scholar] [CrossRef]
- Clauset, A.; Newman, M.E.J.; Moore, C. Finding community structure in very large networks. Phys. Rev. E 2004, 70, 066111. [Google Scholar] [CrossRef] [Green Version]
- Guttman, A. R-trees: A dynamic index structure for spatial searching. In Proceedings of the 1984 ACM SIGMOD International Conference on Management of Data, Boston, MA, USA, 18–21 June 1984; pp. 47–57. [Google Scholar]
- Li, A.Q.; Ahmed, A.; Ravi, S.; Smola, A.J. Reducing the sampling complexity of topic models. In Proceedings of the 20th ACM SIGKDD International Conference on Knowledge Discovery and Data Mining, New York, NY, USA, 24–27 August 2014; pp. 891–900. [Google Scholar]
- Mikolov, T.; Sutskever, I.; Chen, K.; Corrado, G.; Dean, J. Distributed representations of words and phrases and their compositionality. In Proceedings of the 26th International Conference on Neural Information Processing Systems, Lake Tahoe, NV, USA, 5–10 December 2013; pp. 3111–3119. [Google Scholar]
- Lou, Y.; Zhang, C.; Zheng, Y.; Xie, X.; Wang, W.; Huang, Y. Map-matching for low-sampling-rate GPS trajectories. In Proceedings of the 17th ACM SIGSPATIAL International Conference on Advances in Geographic Information Systems, Seattle, DC, USA, 4–6 November 2009; pp. 352–361. [Google Scholar]
- Chen, K.; Chu, G.; Yang, X.; Shi, Y.; Lei, K.; Deng, M. HSETA: A heterogeneous and sparse data learning hybrid framework for estimating time of arrival. IEEE Trans. Intell. Transp. Syst. 2022, 1–12. [Google Scholar] [CrossRef]
- Wang, Z.; Fu, K.; Ye, J. Learning to estimate the travel time. In Proceedings of the 24th ACM SIGKDD International Conference on Knowledge Discovery & Data Mining, London, UK, 19–23 August 2018; pp. 858–866. [Google Scholar]
- Fu, T.Y.; Lee, W.C. DeepIST: Deep image-based spatio-temporal network for travel time estimation. In Proceedings of the 28th ACM International Conference on Information and Knowledge Management, Beijing, China, 3–7 November 2019; pp. 69–78. [Google Scholar]
- Wang, D.; Zhang, J.; Cao, W.; Li, J.; Zheng, Y. When will you arrive? Estimating travel time based on deep neural networks. In Proceedings of the 32nd AAAI Conference on Artificial Intelligence (AAAI-18), New Orleans, LA, USA, 2–7 February 2018; pp. 2500–2507. [Google Scholar]
- Cho, K.; Van Merriënboer, B.; Gulcehre, C.; Bahdanau, D.; Bougares, F.; Schwenk, H.; Bengio, Y. Learning phrase representations using RNN encoder-decoder for statistical machine translation. arXiv 2014, arXiv:1406.1078. [Google Scholar]
- Paszke, A.; Gross, S.; Massa, F.; Lerer, A.; Bradbury, J.; Chanan, G.; Killeen, T.; Lin, Z.; Gimelshein, N.; Antiga, L.; et al. PyTorch: An imperative style, high-performance deep learning library. In Proceedings of the 33rd International Conference on Neural Information Processing Systems, Vancouver, BC, Canada, 1–5 November 2019; pp. 8026–8037. [Google Scholar]


Publisher’s Note: MDPI stays neutral with regard to jurisdictional claims in published maps and institutional affiliations. |
© 2022 by the authors. Licensee MDPI, Basel, Switzerland. This article is an open access article distributed under the terms and conditions of the Creative Commons Attribution (CC BY) license (https://creativecommons.org/licenses/by/4.0/).