
A Method of Multi-Objective Optimization and Multi-Attribute Decision-Making for Huangjinxia Reservoir

Abstract
:1. Introduction
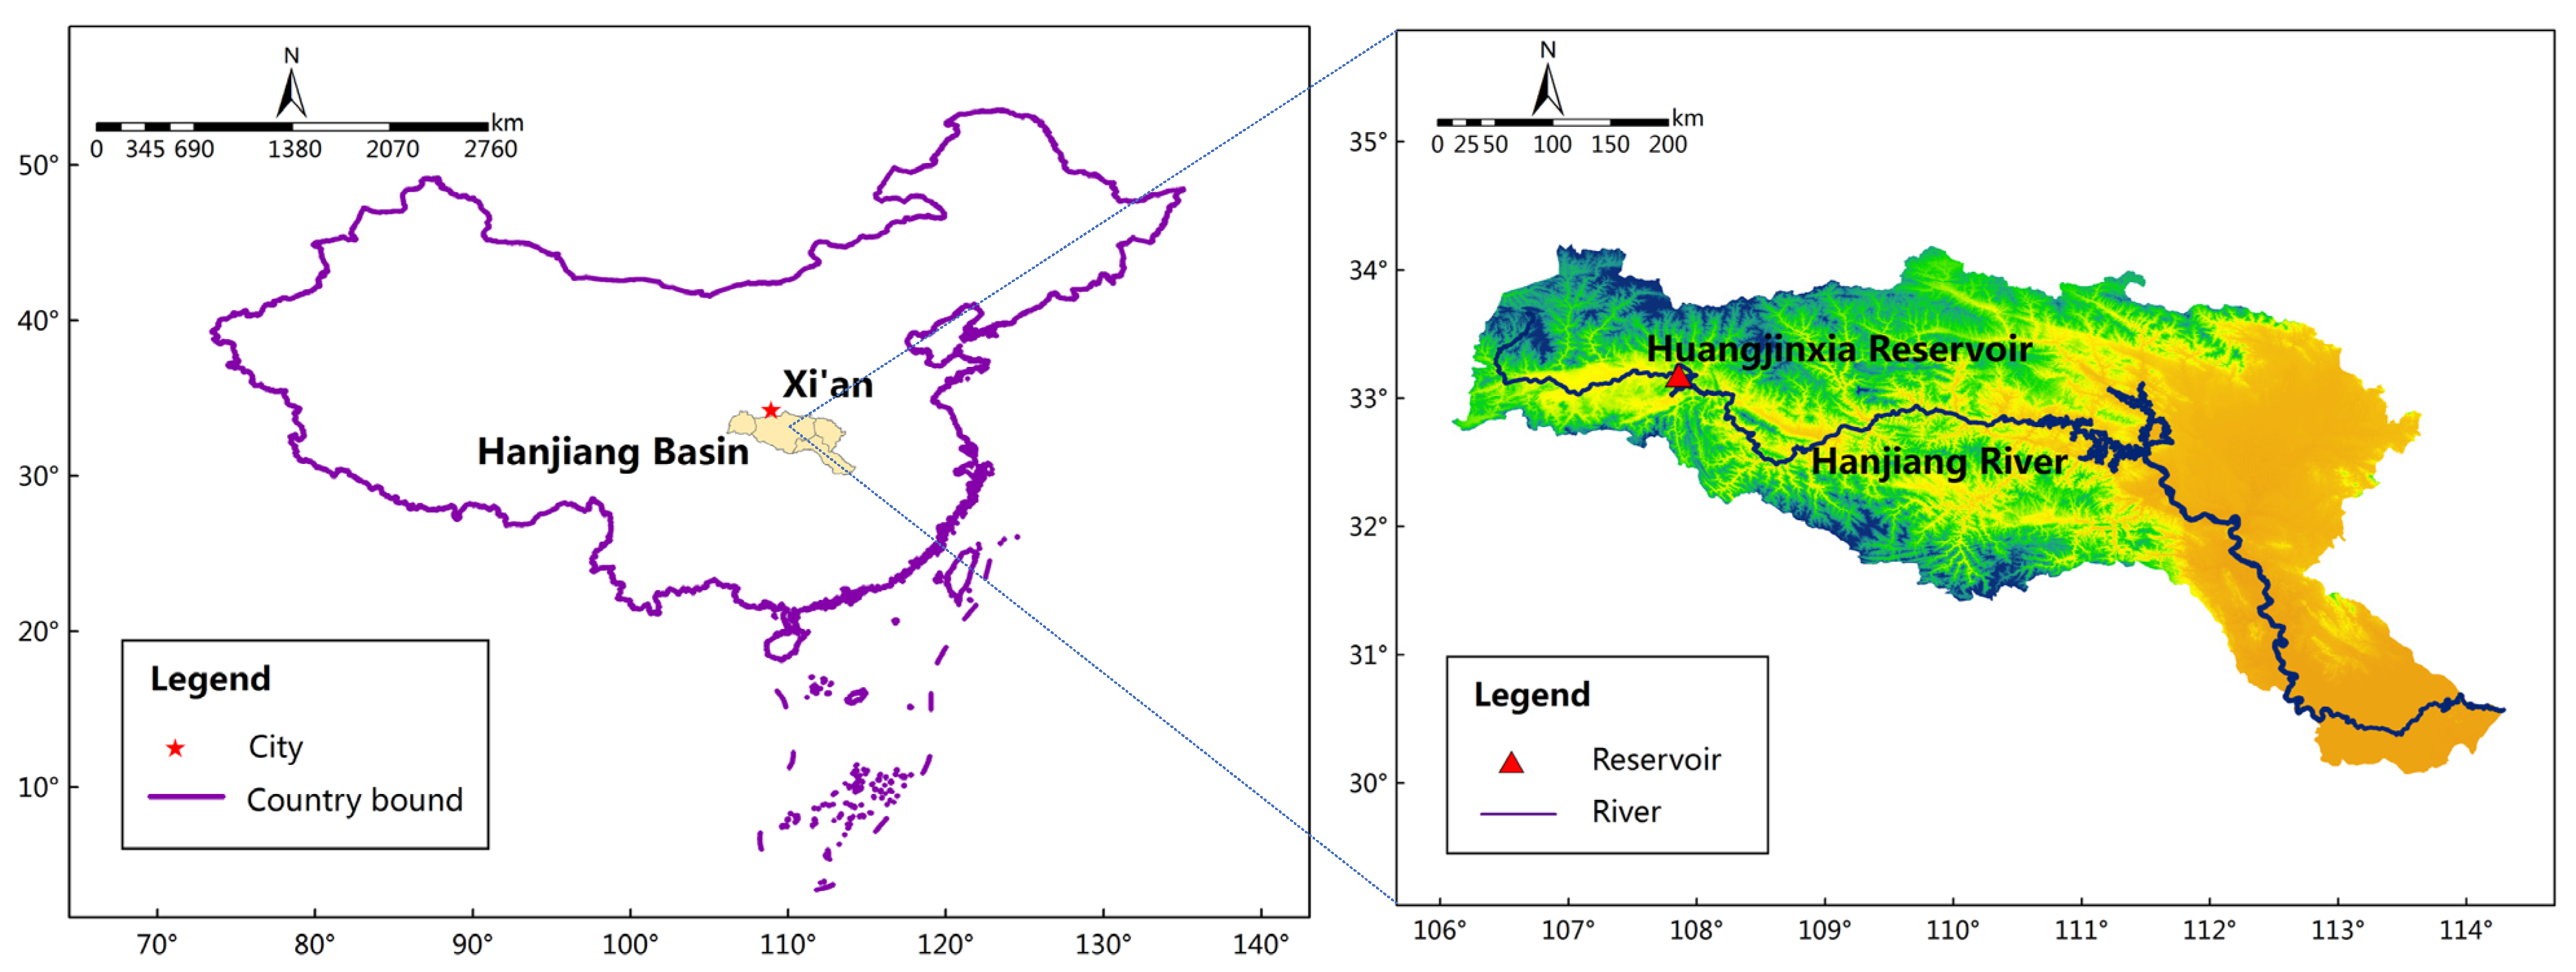
2. Study Area
2.1. Project Overview
2.2. Selection of Typical Years and Water Demand Analysis
3. Model Construction
3.1. Objective Functions
3.1.1. Objective Extraction
3.1.2. Correlation Analysis
3.1.3. Objective Determination
3.2. Constraints
4. Model Solving
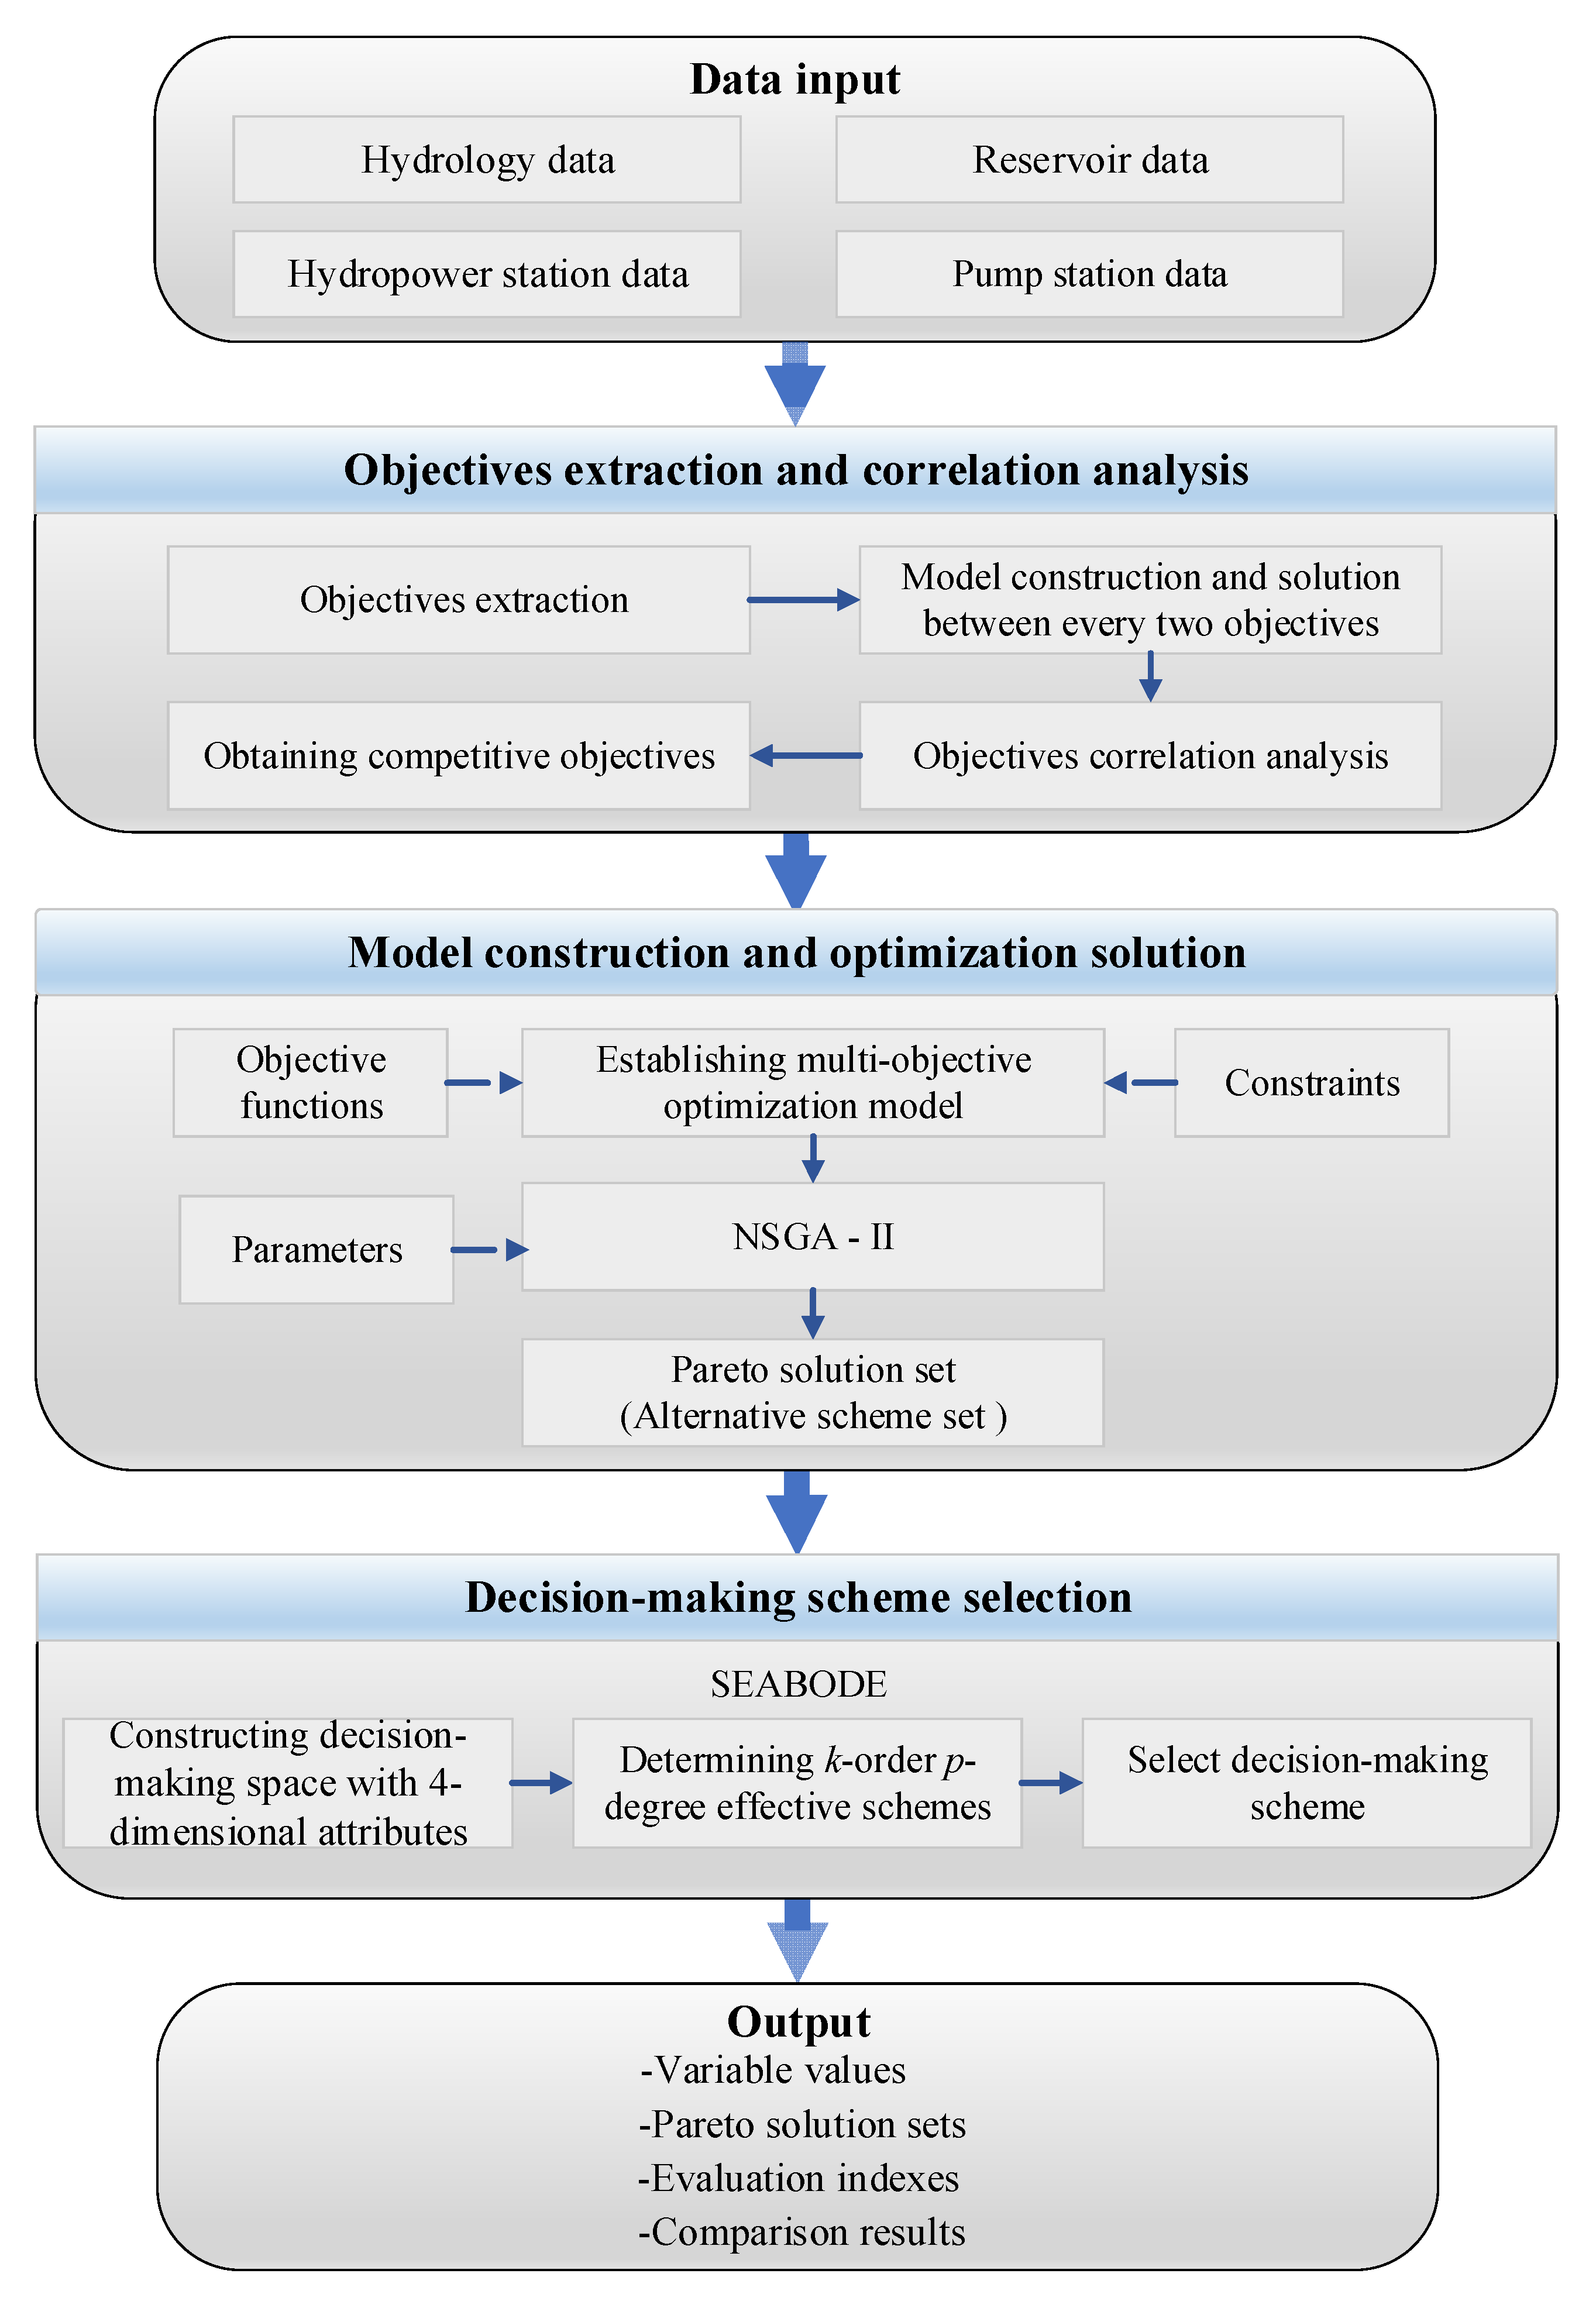
4.1. NSGA-II-SEABODE
4.2. Application of NSGA-II-SEABODE for the MODRO Problem
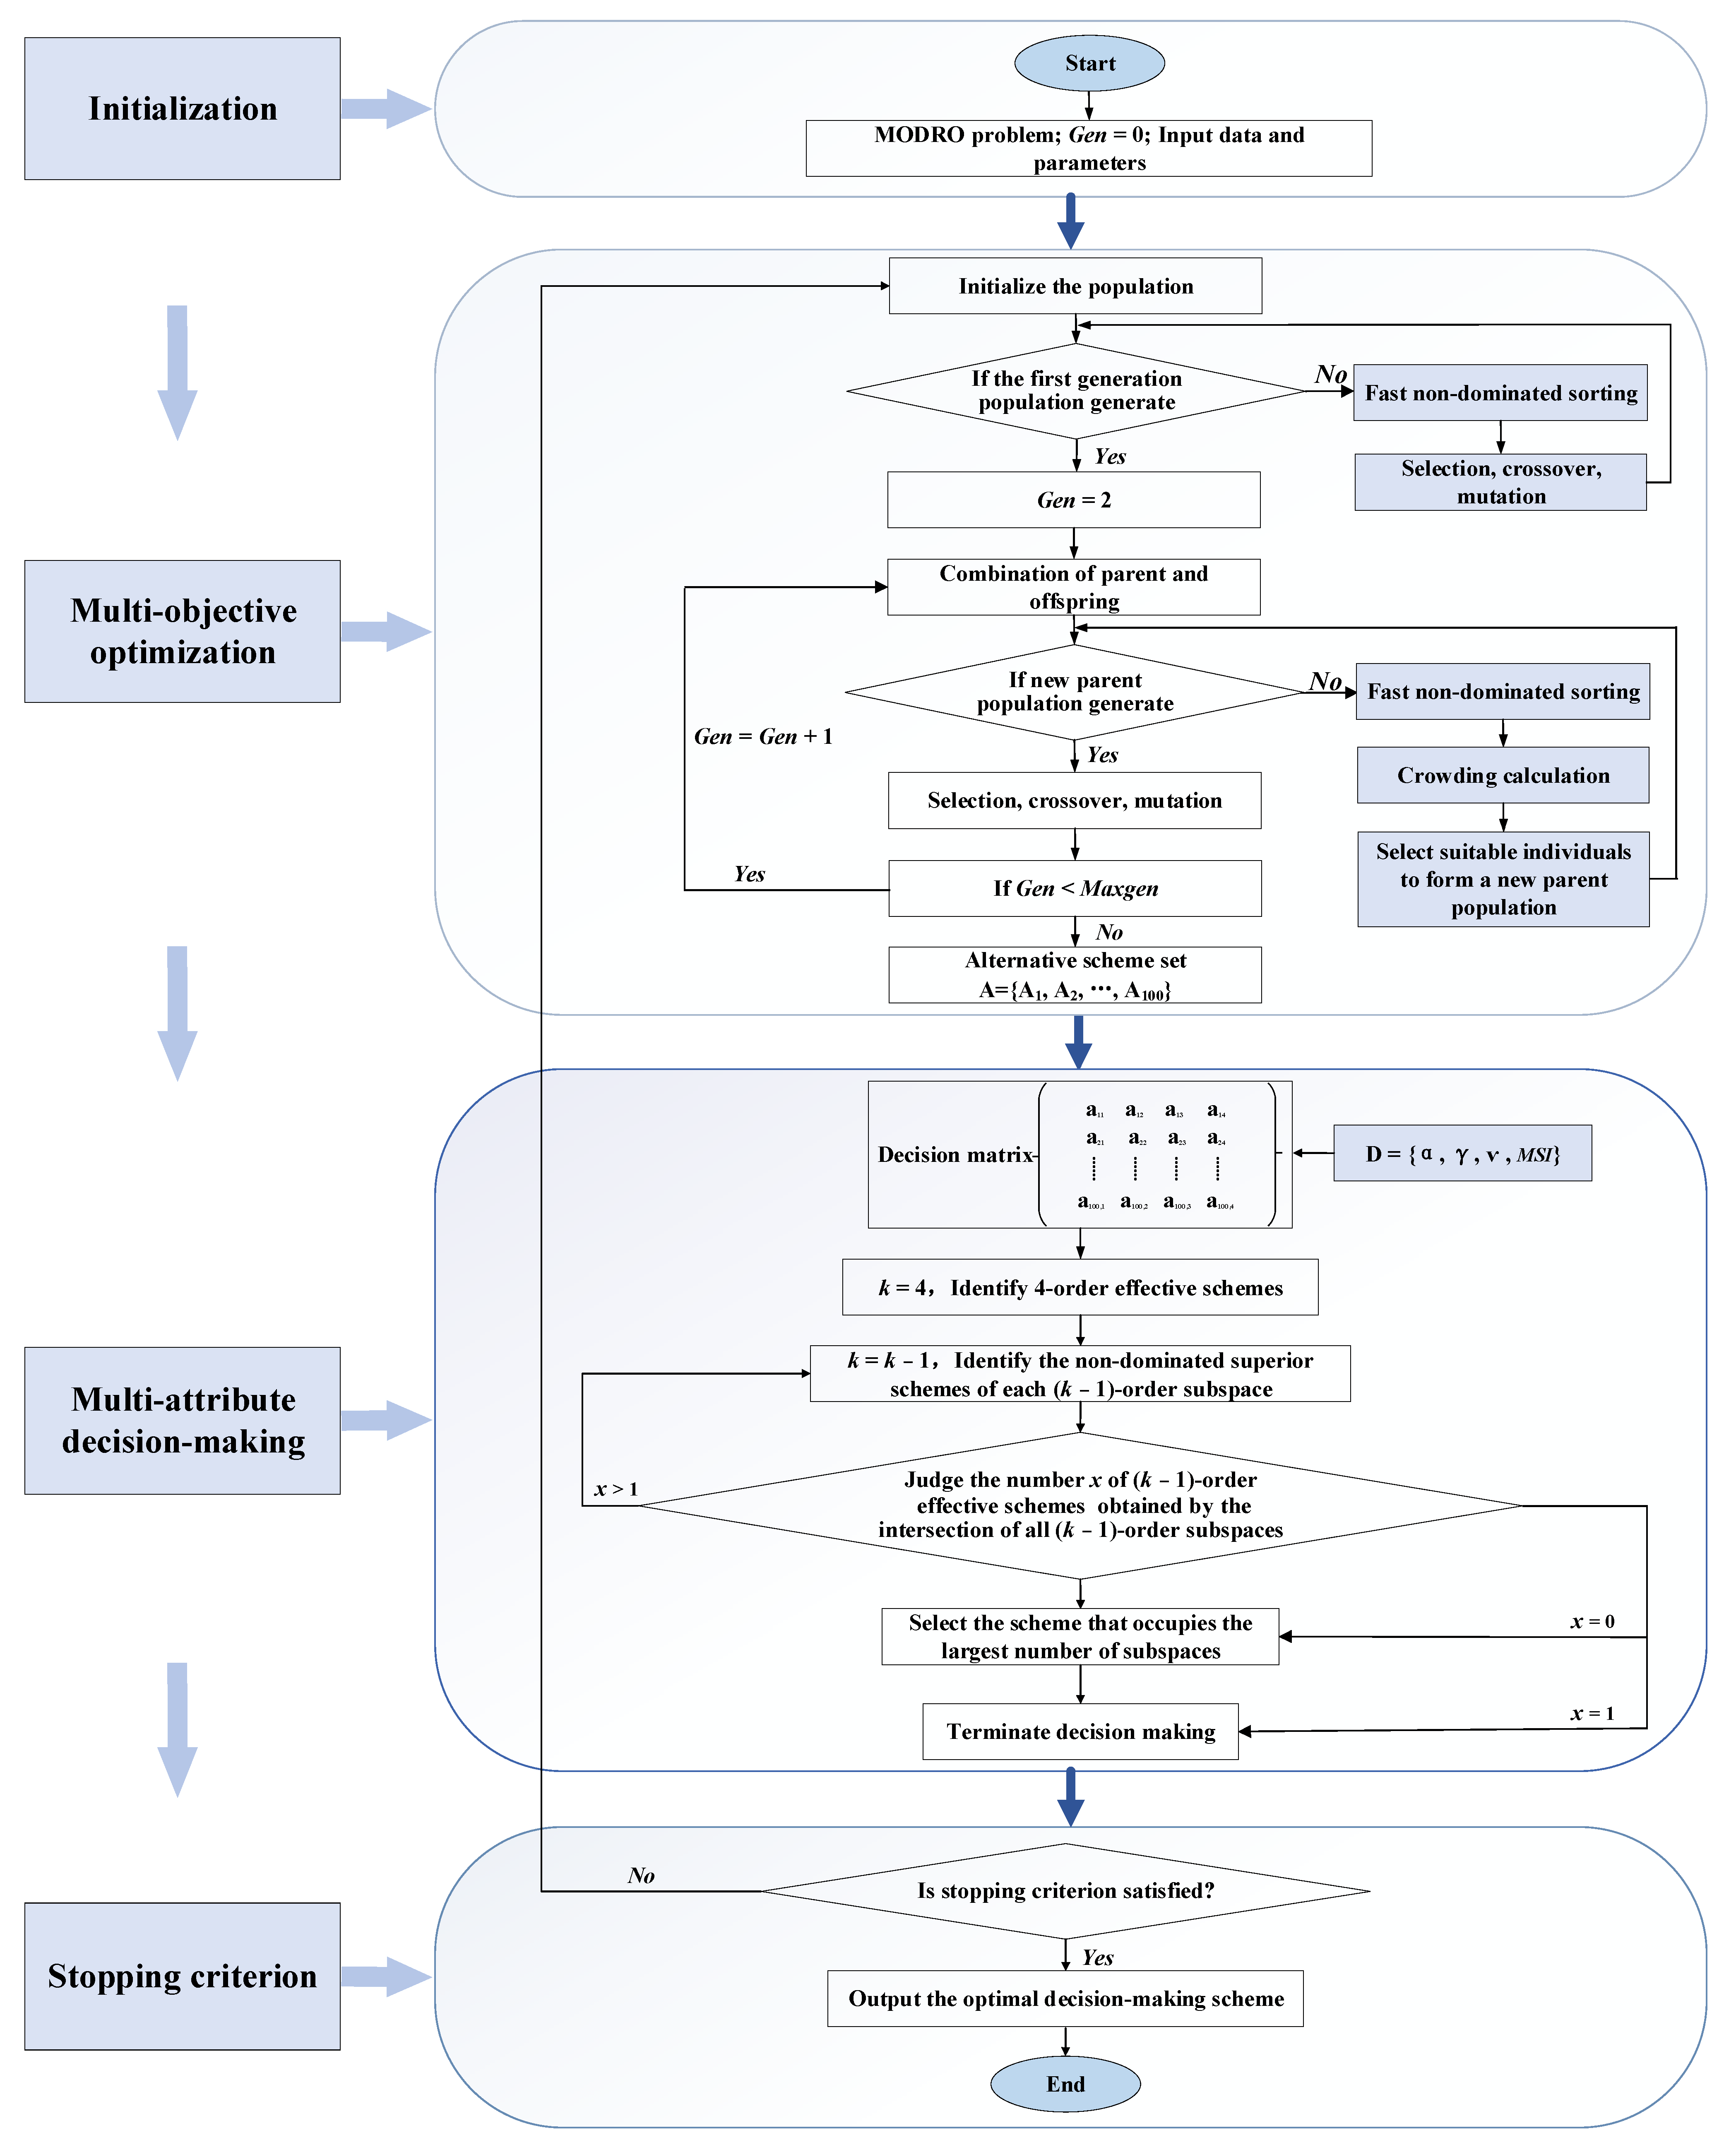
| Algorithm 1: NSGA-II-SEABODE |
| Input: The MODRO problem, constraints, decision variables (water levels), population size , maximum iteration times , crossover probability , mutation probability , cross distribution index , mutation distribution index . |
| Output: and Final water levels and decision-making scheme. |
| Step 1: Initialization |
| 1.1 Setting parameters: N = 100, Maxgen = 2000, pc = 0.9, pm = 0.08, = 20, = 20, Gen = 0. 1.2 Initialization population randomly. |
| Step 2: Multi-objective optimization |
| 2.1 Non-dominated sorting of initialized population , select individuals with good fitness. Perform genetic operations to generate the first-generation subgroup . |
| 2.2 Gen = 2, intermediate population Combine parent population with offspring population. |
| 2.3 New parent population Fast non-dominated sorting and congestion calculation for , select individuals with good fitness. 2.4 New offspring population Perform genetic operations. 2.5 If , Obtain alternative scheme set; else , go to Step 2.2. |
| Step 3: Multi-attribute decision making |
| 3.1 Decision matrix and . |
| 3.2 = 4, identify 4-order effective scheme set in the 4-dimensional attribute space {}. |
| 3.3 = − 1, identify non-dominated superior schemes in each ( − 1)-order subspace; then identify the number of (k − 1)-order effective schemes obtained by the intersection of all ( − 1)-order subspaces. |
| 3.4 If x > 1, go to Step 3.3; else if = 1, the scheme is directly output as the final decision-making scheme ; else = 0, then the scheme that occupies the largest number of subspaces is selected. 3.5 Terminate decision making. Step 4: Stopping criteria If the stopping criterion is satisfied, stop; else go to Step 2. |
4.3. Evaluation Indexes Selection
5. Results and Discussion
5.1. Pareto Solution Set
5.2. Multi-Attribute Decision making Results
5.3. Decision-Making Scheme Analysis
6. Conclusions
Author Contributions
Funding
Institutional Review Board Statement
Informed Consent Statement
Data Availability Statement
Acknowledgments
Conflicts of Interest
References
- Huang, Q.; Liu, D.; Wei, X.T.; Yang, Y.Y. Analysis of causes of China has the most dams in the world. J. Hydroelectr. Eng. 2021, 40, 37–47. [Google Scholar]
- Ai, Y.D.; Ma, Z.Z.; Xie, X.M.; Huang, T.; Cheng, H.G. Optimization of ecological reservoir operation rules for a northern river in China: Balancing ecological and socio-economic water use. Ecol. Indic. 2022, 138, 108822. [Google Scholar] [CrossRef]
- Wang, Z.Z.; Wang, Y.T.; Chen, Y.W.; Liu, K.W. Multi-objective reservoir regulation model based on simulation rules and intelligent optimization and its application. J. Hydraul. Eng. 2015, 43, 564–579. [Google Scholar]
- Ming, B.; Liu, P.; Chang, J.; Wang, Y.; Huang, Q. Deriving operating rules of pumped water storage using multi-objective optimization: Case study of the Han to Wei inter-basin water transfer project, China. J. Water. Res. Plan. Man. 2017, 143, 05017012.1–05017012.9. [Google Scholar] [CrossRef]
- Sun, X.M.; Luo, J.G.; Xie, J.C. Multi-objective optimization for reservoir operation considering water diversion and power generation objectives. Water 2018, 10, 1540. [Google Scholar] [CrossRef] [Green Version]
- Zhang, J.W.; Wang, X.; Liu, P.; Lei, X.H.; Li, Z.J.; Gong, W.; Duan, Q.Y.; Wang, H. Assessing the weighted multi-objective adaptive surrogate model optimization to derive large-scale reservoir operating rules with sensitivity analysis. J. Hydrol. 2017, 544, 613–627. [Google Scholar] [CrossRef]
- Han, D.Y.; Lv, G.H.; He, X.M. A research on the ecological operation of reservoirs based on the indicators of hydrological alteration. Sustainability 2022, 14, 6400. [Google Scholar] [CrossRef]
- Wu, Y.Q.; Wang, L.P.; Zhang, Y.K.; Wu, J.J.; Ma, Q.M.; Yue, L.S. Application of marginal rate of transformation in decision making of multi-objective reservoir optimal operation scheme. Sustainability 2021, 13, 1488. [Google Scholar] [CrossRef]
- Chang, J.X.; Meng, X.J.; Wang, Z.Z.; Wang, X.B.; Huang, Q. Optimized cascade reservoir operation considering ice flood control and power generation. J. Hydrol. 2014, 519, 1042–1051. [Google Scholar] [CrossRef]
- Wu, Y.Q.; Wang, L.P.; Zhang, Y.K.; Wu, J.J.; Zhang, P. Decision making for multi-objective reservoir operation schemes based on marginal substitution rate. J. Hydroelectr. Eng. 2021, 40, 97–106. [Google Scholar]
- Chen, Y.Y.; Mei, Y.D.; Cai, H.; Xu, X.F. Multi-objective optimal operation of key reservoirs in Ganjiang River oriented to power generation, water supply and ecology. J. Hydraul. Eng. 2018, 49, 628–638. [Google Scholar]
- Wu, Z.H.; Mei, Y.D.; Cheng, B.; Hu, T.S. Use of a multi-objective correlation index to analyze the power generation, water supply and ecological flow mutual feedback relationship of a reservoir. Water Resour. Manag. 2021, 35, 465–480. [Google Scholar] [CrossRef]
- Yue, W.C.; Yu, S.J.; Xu, M.; Rong, Q.Q.; Xu, C.; Su, M.R. A Copula-based interval linear programming model for water resources allocation under uncertainty. J. Environ. Manag. 2022, 317, 115318. [Google Scholar] [CrossRef] [PubMed]
- Li, X.; Wei, J.H.; Li, T.J.; Wang, G.Q.; William, W.G. A parallel dynamic programming algorithm for multi-reservoir system optimization. Adv. Water Resour. 2014, 67, 1–15. [Google Scholar] [CrossRef]
- Yin, D.Q.; Li, X.; Wang, F.; Liu, Y.; Croke, B.F.W.; Jakeman, A.J. Water-energy-ecosystem nexus modeling using multi-objective, non-linear programming in a regulated river: Exploring tradeoffs among environmental flows, cascades small hydropower, and inter-basin water diversion projects. J. Environ. Manag. 2022, 308, 114582. [Google Scholar] [CrossRef]
- Ji, C.M.; Li, C.G.; Liu, X.Y.; Wang, B.Q.; Zhang, P. Research and application of dynamic programming algorithm in reservoir operation based on functional analysis. J. Hydraul. Eng. 2016, 47, 1–9. [Google Scholar]
- Ma, Y.F.; Zhong, P.A.; Xu, B.; Zhu, F.L.; Lu, Q.W.; Wang, H. Spark-based parallel dynamic programming and particle swarm optimization via cloud computing for a large-scale reservoir system. J. Hydrol. 2021, 298, 126444. [Google Scholar] [CrossRef]
- Wu, H.; Ji, C.M.; Jiang, Z.Q.; Zhang, Y.K. Large system decomposition-coordination model for optimal power-generation scheduling of cascade reservoirs. J. Hydroelectr. Eng. 2015, 34, 40–50. [Google Scholar]
- Bahrami, N.; Reza Nikoo, M.; Al-Rawas, G.; Al-Wardy, M.; Gandomi, A.H. Reservoir optimal operation with an integrated approach for managing floods and droughts using NSGA-III and prospect behavioral theory. J. Hydrol. 2022, 610, 127961. [Google Scholar] [CrossRef]
- Diao, Y.F.; Ma, H.R.; Wang, H.; Wang, J.N.; Li, S.X.; Li, X.Y.; Pan, J.Y.; Qiu, Q.T. Optimal flood-control operation of cascade reservoirs using an improved particle swarm optimization algorithm. Water 2022, 14, 1239. [Google Scholar] [CrossRef]
- Feng, Z.K.; Niu, W.J.; Zhang, R.; Wang, S.; Cheng, C.T. Operation rule derivation of hydropower reservoir by k-means clustering method and extreme learning machine based on particle swarm optimization. J. Hydrol. 2019, 576, 229–238. [Google Scholar] [CrossRef]
- Ostadrahimi, L.; Marino, M.A.; Afshar, A. Multi-reservoir operation rules: Multi-swarm PSO-based optimization approach. Water Resour. Manag. 2012, 26, 407–427. [Google Scholar] [CrossRef]
- Kumar, A.; Goyal, M.; Ojha, C.; Singh, R.; Swamee, P.; Nema, R. Application of ANN, fuzzy logic and decision tree algorithms for the development of reservoir operating rules. Water Resour. Manag. 2013, 27, 911–925. [Google Scholar] [CrossRef]
- Afshar, M.H.; Hajiabadi, R. Application of cellular automata in bi-objective operation of multi reservoir systems. Water 2021, 13, 2740. [Google Scholar] [CrossRef]
- Sharifazari, S.; Sadat-Noori, M.; Rahimi, H.; Khojasteh, D.; Clamore, W. Optimal reservoir operation using Nash bargaining solution and evolutionary algorithms. Water Sci. Eng. 2021, 14, 260–268. [Google Scholar] [CrossRef]
- Asvini, M.S.; Amudha, T. Design and development of bio-inspired framework for reservoir operation optimization. Adv. Water Resour. 2017, 110, 193–202. [Google Scholar] [CrossRef]
- Yang, C.G.; Tu, X.Y.; Chen, J. Algorithm of marriage in honey bees optimization based on the wolf pack search. In Proceedings of the International Conference on Intelligent Pervasive Computing, Jeju Island, Korea, 11–13 October 2007. [Google Scholar]
- Ahmadianfar, I.; Samadi-Koucheksaraee, A.; Bozorg-Haddad, O. Extracting optimal policies of hydropower multi-reservoir systems utilizing enhanced differential evolution algorithm. Water Resour. Manag. 2017, 31, 4375–4397. [Google Scholar] [CrossRef]
- Ahmadianfar, I.; Kheyrandish, A.; Jamei, M.; Gharabaghi, B. Optimizing operating rules for multi-reservoir hydropower generation systems: An adaptive hybrid differential evolution algorithm. Renew. Energy 2021, 167, 774–790. [Google Scholar] [CrossRef]
- Choong, S.M.; El-Shafie, A.; Mohtar, W.H.M. Optimisation of multiple hydropower reservoir operation using artificial bee colony algorithm. Water Resour. Manag. 2017, 31, 1397–1411. [Google Scholar] [CrossRef]
- Zou, Q.; Lu, J.; Zhou, C.; Zhou, J.Z. Optimal operation of cascade reservoirs based on parallel hybrid differential evolution algorithm. J. Hydroelectr. Eng. 2017, 36, 57–68. [Google Scholar]
- Lin, N.M.; Tian, X.; Rutten, M.; Abraham, E.; Maestre, J.M.; Giesen, N.V.D. Multi-objective model predictive control for real-time operation of a multi-reservoir system. Water 2020, 12, 1898. [Google Scholar] [CrossRef]
- Motlagh, A.D.; Sadeghian, M.S.; Javid, A.H.; Asgari, M.S. Optimization of dam reservoir operation using grey wolf optimization and genetic algorithms (A case study of Taleghan Dam). Int. J. Eng. Trans. B 2021, 34, 1644–1652. [Google Scholar]
- Ding, X.W.; Chong, X.; Bao, Z.F.; Xue, Y.; Zhang, S.H. Fuzzy comprehensive assessment method based on the entropy weight method and its application in the water environmental safety evaluation of the Heshangshan drinking water source area, Three Gorges reservoir area, China. Water 2017, 9, 329. [Google Scholar] [CrossRef] [Green Version]
- Gu, D.L.; Guo, J.H.; Fan, Y.R.; Zuo, Q.T.; Yu, L. Evaluating water-energy-food system of Yellow River basin based on type-2 fuzzy sets and Pressure-State-Response model. Agr. Water Manag. 2022, 267, 107607. [Google Scholar] [CrossRef]
- Ekmekcioğlu, Ö.; Koc, K.; Özger, M. Stakeholder perceptions in flood risk assessment: A hybrid fuzzy AHP-TOPSIS approach for Istanbul, Turkey. Int. J. Disast. Risk Reduct. 2021, 60, 102327. [Google Scholar] [CrossRef]
- Yang, Z.; Wang, Y.F.; Yang, K. The stochastic decision making framework for long-term multi-objective energy-water supply-ecology operation in parallel reservoirs system under uncertainties. Expert Syst. Appl. 2022, 187, 115907. [Google Scholar] [CrossRef]
- Ren, L.X.; Lu, H.W.; Zhao, H.H.; Xia, J. An interval-valued triangular fuzzy modified multi-attribute preference model for prioritization of groundwater resources management. J. Hydrol. 2018, 562, 335–345. [Google Scholar] [CrossRef]
- Li, B.; Wu, Q.; Zhang, W.P.; Liu, Z.J. Water resources security evaluation model based on grey relational analysis and analytic network process: A case study of Guizhou Province. J. Water Process Eng. 2020, 37, 101429. [Google Scholar] [CrossRef]
- Kang, L.; Zhang, S.; Ding, Y.; He, X.C. Extraction and preference ordering of multireservoir water supply rules in dry years. Water 2016, 8, 28. [Google Scholar] [CrossRef] [Green Version]
- Poff, N.L.; Allan, J.D.; Bain, M.B.; Karr, J.R.; Prestegaard, K.L.; Richter, B.D.; Sparks, R.E.; Stromberg, J.C. The natural flow regime: A paradigm for river conservation and restoration. Bioscience 1997, 47, 769–784. [Google Scholar] [CrossRef]
- Ladson, A.R.; White, L.J. An Index of Stream Condition: Reference Manual, 2nd ed.; Department of Natural Resources and Environment: East Melbourne, VIC, Australia, 1999; pp. 15–27. [Google Scholar]


| Parameter Category | Numerical Value |
|---|---|
| Dead water level/m | 440 |
| Normal pool level/m | 450 |
| Flood control level/m | 448 |
| Total reservoir storage/108 m3 | 2.29 |
| Effective storage capacity/108 m3 | 0.92 |
| Installed capacity/MW | 135 |
| Guaranteed output/MW | 8.6 |
| Installed capacity of pump station/MW | 129.5 |
| Pumping flow of pump station/(m3/s) | 70 |
| Ecological flow/(m3/s) | 25 |
| Design flow of fishway/(m3/s) | 1.5 1 |
| Typical Years | WSI | ||||
|---|---|---|---|---|---|
| Extraordinarily dry year | Variation range | [0, 0.083] | [0, 0.090] | [0.92, 1.00] | [48.03, 51.38] |
| Standard deviation | 0.008 | 0.009 | 0.03 | 1.084 | |
| Dry year | Variation range | [0.50, 0.66] | [0.2, 0.33] | [0.71, 1.00] | [15.78, 30.21] |
| Standard deviation | 0.047 | 0.063 | 0.093 | 3.99 | |
| Normal year | Variation range | [0.583, 0.75] | [0.2, 0.4] | [0.68, 0.99] | [9.13, 18.53] |
| Standard deviation | 0.038 | 0.064 | 0.064 | 2.66 | |
| Wet year | Variation range | [0.66, 0.83] | [0.25, 0.50] | [0.24, 0.86] | [0.86, 8.20] |
| Standard deviation | 0.063 | 0.265 | 0.179 | 1.85 | |
| Extraordinarily wet year | Variation range | [0.67, 0.91] | [0.25, 1.00] | [0.31, 0.99] | [0.91, 14.00] |
| Standard deviation | 0.049 | 0.087 | 0.259 | 4.06 |
| Typical Years | {, , , } | {, , } | {, , } | {, , } | {, , } | Number of 3-Order Effective Schemes |
|---|---|---|---|---|---|---|
| Extraordinarily dry year | 6 | 1 | 2 | 6 | 6 | 1 |
| Dry year | 6 | 3 | 3 | 3 | 5 | 0 |
| Normal year | 5 | 3 | 3 | 4 | 3 | 1 |
| Wet year | 6 | 4 | 4 | 3 | 5 | 2 |
| Extraordinarily wet year | 6 | 2 | 2 | 3 | 3 | 2 |
| Scheme No. | {, , } | {, , } | {, , } | {, , } | ||||
|---|---|---|---|---|---|---|---|---|
| 13 | 0.583 | 0.2 | 0.718 | 15.873 | √ 1 | √ | √ | |
| 51 | 0.583 | 0.2 | 0.716 | 16.273 | √ | √ | √ | |
| 85 | 0.667 | 0.25 | 0.887 | 19.991 | √ | √ | √ | |
| 35 | 0.500 | 0.33 | 0.770 | 18.257 | √ | √ | ||
| 49 | 0.500 | 0.33 | 0.760 | 18.678 | √ | √ | ||
| 15 | 0.500 | 0.33 | 0.769 | 18.535 | √ |
| Typical Years | Scheme No. | ||||
|---|---|---|---|---|---|
| Extraordinarily dry year | 32 | 0 | 0.090 | 0.931 | 48.038 |
| Dry year | 85 | 0.583 | 0.20 | 0.718 | 15.879 |
| Normal year | 63 | 0.667 | 0.25 | 0.689 | 9.130 |
| Wet year | 52 | 0.833 | 0.50 | 0.6224 | 3.976 |
| Extraordinarily wet year | 44 | 0.916 | 1 | 0.577 | 2.770 |
Publisher’s Note: MDPI stays neutral with regard to jurisdictional claims in published maps and institutional affiliations. |
© 2022 by the authors. Licensee MDPI, Basel, Switzerland. This article is an open access article distributed under the terms and conditions of the Creative Commons Attribution (CC BY) license (https://creativecommons.org/licenses/by/4.0/).
Share and Cite
Wei, N.; Yang, F.; Lu, K.; Xie, J.; Zhang, S. A Method of Multi-Objective Optimization and Multi-Attribute Decision-Making for Huangjinxia Reservoir. Appl. Sci. 2022, 12, 6300. https://doi.org/10.3390/app12136300
Wei N, Yang F, Lu K, Xie J, Zhang S. A Method of Multi-Objective Optimization and Multi-Attribute Decision-Making for Huangjinxia Reservoir. Applied Sciences. 2022; 12(13):6300. https://doi.org/10.3390/app12136300
Chicago/Turabian StyleWei, Na, Feng Yang, Kunming Lu, Jiancang Xie, and Shaofei Zhang. 2022. "A Method of Multi-Objective Optimization and Multi-Attribute Decision-Making for Huangjinxia Reservoir" Applied Sciences 12, no. 13: 6300. https://doi.org/10.3390/app12136300
APA StyleWei, N., Yang, F., Lu, K., Xie, J., & Zhang, S. (2022). A Method of Multi-Objective Optimization and Multi-Attribute Decision-Making for Huangjinxia Reservoir. Applied Sciences, 12(13), 6300. https://doi.org/10.3390/app12136300