1. Introduction
Understanding interactions between light and medium is a longstanding issue in biomedical imaging [
1,
2], as it has fundamental importance to imaging techniques such as photoacoustic imaging [
3,
4,
5,
6]. Optical resolution photoacoustic microscopy (ORPAM) is a photoacoustic imaging modality, which has demonstrated diffraction-limited lateral resolution on the surface [
7], subwavelength-resolution label-free imaging [
8], and subdiffraction label-free imaging [
9], despite typically limited penetration depth of 1–2 mm due to the tight optical focus of ballistic photons [
10]. Photoacoustic tomography (PAT) showed penetration depths down to 7 cm in phantom [
11,
12]. Most photoacoustic imaging utilizes water or ultrasound gel as an acoustic coupling medium to make contact between the phantom and ultrasonic transducers. Noncontact methods for acoustic wave sensing are always favorable in photoacoustic imaging.
The photoacoustic pressure can be observed or detected with interferometry, such as low-coherence interferometry ((LCI); optical coherence tomography (OCT) hardware) [
13] and stroboscopic polarization selective imaging [
14]. These methods are often sensitive to small vibrations around the phantom. However, a recently reported noncontact photoacoustic modality, called deep photoacoustic remote sensing (dPARS) microscopy, has demonstrated insensitivity to external vibration via the contact-free detection of photoacoustic signals [
15,
16].
In dPARS microscopy, the detection of photoacoustically induced sound pressure relies on the interaction process between light and the phantom, in which only the photoacoustic pressure effect was considered, and the photothermal effect was ignored. Although the induced effect caused by the photothermal effect, such as the perturbation of refractive index, is weak compared with photoacoustic pressure, it cannot be ignored in certain scenarios. In this paper, a theoretical model was used to describe the whole energy conversion process when pulsed light was absorbed by the medium, which is the fundamental signal generation mechanism in most photoacoustic modalities. The photothermal effect was considered together with the photoacoustic effect in both the theoretical model and finite element method (FEM) simulations.
A model is presented to describe the local modulation of the refractive index induced by both photoacoustic pressure and photothermal effect, by showing the whole process of absorbed energy conversion analysis (wAEC). The transient refractive index perturbation produced by the incident pulsed light when combined with an existing refractive index step at the interface of two different mediums can provide significant modulations to the local reflectivity from the interface. The absorbed energy from the light source causes a temperature increase in the specimen, which changes its refractive index and thus optical path length via the thermo-optic effect [
17]. For crystal and liquid materials, the change in refractive index caused by the thermal effect can be calculated by a thermo-optic coefficient. The photoacoustic pressure-induced refractive index change can also be calculated through initial pressure [
18,
19,
20].
An analytical description was made to demonstrate the progress on a planar surface, which was illuminated by a pulsed beam for excitation and a continuous beam for interrogation. The temporal evolution of the temperature, displacement changes, and temporal evolution of the outward propagating photoacoustic waves were calculated, and an analysis was carried out on how these processes affect the reflectivity intensity between the interface and when it was sensed by the probe beam.
To verify the accuracy of the model, FEM-based COMCOL software was employed for the simulation of the temporal temperature variation and photoacoustic signal in a silicon sample. The aim of the development of this model is to understand the temporal evolution caused by the photothermal and photoacoustic effects and recognize the evolution of the photoacoustic signal and the effects of the excitation light source parameters. We also explored the response of different materials in the experimental system; for example, silicon as one of the semiconductor materials is often inspected with laser ultrasonic techniques in the industry [
21], whereas carbon fibers are used as one of the bio-applied materials in photoacoustic imaging, and copper and aluminum serve as two major the materials in laser additive manufacturing. A comprehensive understanding of its photothermal and photoacoustic response to the absorbed optical energy is important for these applications. We sought to provide numerical and experimental evidence for evaluating the roles of photothermal and photoacoustic effects play in different materials under pulsed laser excitation.
2. Theoretical Model
In an attempt to explore the whole process of the absorbed energy conversion, the model is focused on the interaction of the one-dimensional plane of a sample. For simplicity, acoustic heterogeneity is ignored, giving a constant acoustic propagation velocity vs. over the considered region. Effects of optical dispersion are ignored assuming excitation and probe wavelengths are the same as their respective central wavelength for their respective whole beam bandwidths. Additionally, because the phantom is covered with agar, there is no free flow, convection heat transfer can be ignored in the model. When the pulse laser irradiates the sample, according to the energy conservation formula, the temperature changes according to Equation (1) below [
22,
23]:
where ρ is the mass density, Cp is the specific heat capacity at constant pressure, k is the thermal conductivity, T is the temperature, and Q is the energy of the pulsed laser.
Consider the following Fourier transform pairs
where if assuming a
2 =
, A =
, and φ(r) = T
0 = 293 K, then after Fourier transform and inverse Fourier transform,
so Equation (1) can be simplified as Equation (4) as follows:
The analytical solution cannot be directly derived from Equation (3) but the numerical solution can be obtained.
Therefore, as the temperature increases, the displacement
(r, t) of this region will change [
24].
where
(r, t) is the displacement, β is the expansion coefficient at constant pressure, P(r, t) is the pressure, and vs. is acoustic velocity. The first term on the right side of Equation (5) indicates the temperature expansion caused by stimulated endothermic reaction, and the second term implies the disturbance of displacement caused by pressure at this point.
The relation between displacement and pressure produced by the volume element is
Assuming that the above formula is continuously differentiable in time and space, then substituting Equation (5) into Equation (6) and calculating the divergence leads to
Substituting Equation (1) into Equation (7) gives
Equation (8) is the prevailing photoacoustic wave equation if the term
is removed [
25]. In this paper, this item is retained. Based on the Green’s function [
24,
26], Equation (8) can be expressed as a unified form of the partial differential equation, L P(r, t) = F(r, t),
where
The corresponding Green’s function can be defined as G(r, t; r′, t′) satisfying the equation
where r′ and t′ indicate the position and time of the source, respectively. In infinite space, and when there is no boundary, according to initial conditions,
G(r, t; r′, t′) can be expressed as
In general, assuming that the photoacoustic pressure produced by any light source in an infinite medium can be obtained
Following the elasto-optic relation, these large photoacoustic pressures can create nontrivial modulations ∆n(r, t) in the local index of refraction following the elasto-optic relation [
19]:
where n
0(r) is the local refraction index and ε is the elasto-optic coefficient.
The heat-induced refractive index changes also exist, though it is a relatively weak effect. For some crystalline materials, the local temperature rise brings about a change in the refractive index [
16]
and in displacement
where α is the thermo-optic coefficient. The thermo-optic coefficient
and thermo-expansion coefficient β for silicon are
RIU/°C and
m/(m* °C) at 25 °C, respectively [
27].
For nonmetallic materials such as silicon, the disturbed refractive index is
The refractive index modulation can produce strong changes in reflectivity modulation at the boundary between an absorbing medium with refractive index n
1 and a nonabsorbing medium with refractive index n
2. After a short laser pulse, the refractive index modulation ∆n is generated in the absorbing medium, so the intensity reflection coefficient modulation ∆R can be expressed as
where R is the unperturbed reflection coefficient.
For this paper, all of the participating materials, such as aluminum, copper, silicon, and phantom in the vicinity contribute to the generation of the photoacoustic signal and refractive-index-induced reflection. The refractive-index-induced reflection depends on the two interfaces, and photoacoustic signal generation relies on the thermo-elastic properties of aluminum, copper, silicon, carbon fiber, and phantom, which are summarized in
Table 1. Values of different parameters used are given in
Table 1.
3. Simulation Study
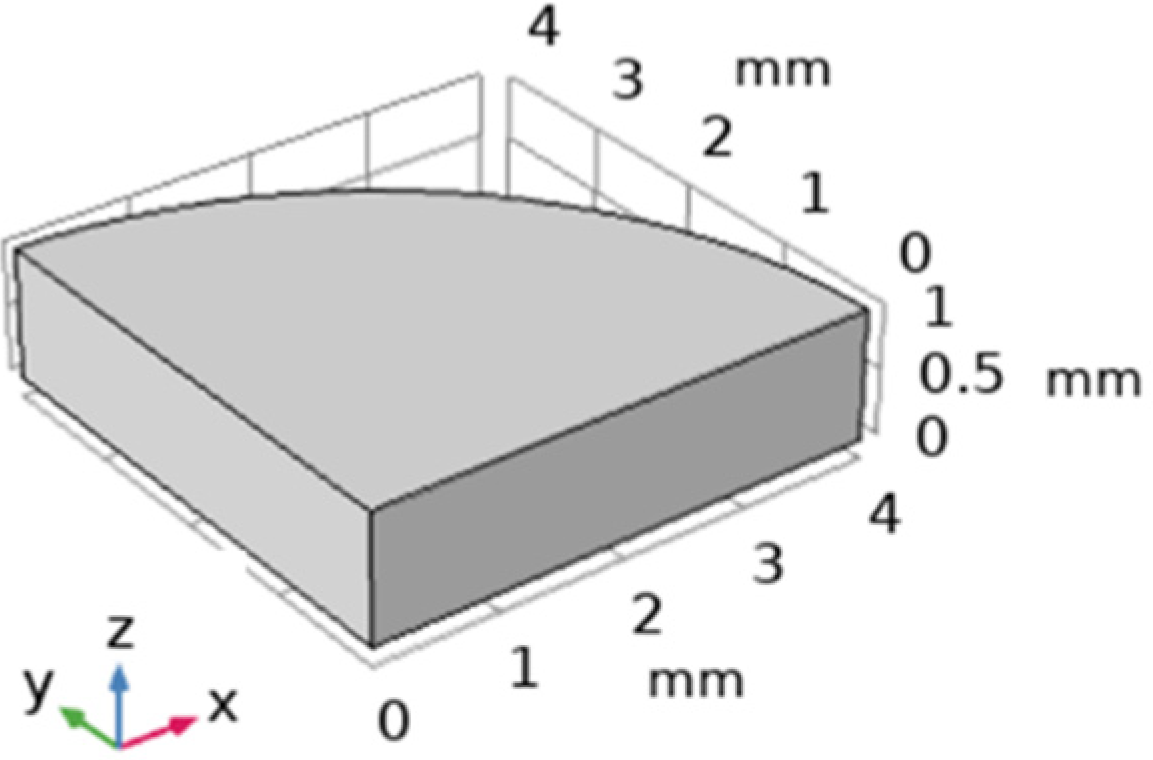
FEM-based COMSOL software was employed to simulate the temporal temperature, displacement, and photoacoustic signal. A three-dimensional geometry model was built to simulate the photoacoustic signal, by Heat Transfer in Solids Module and Solid Mechanics Module. Geometry was reduced to one-fourth of the whole sample structure to save simulation time. The results for the two modules with different incident light densities are shown below.
For simplicity, to show the results of photothermal and photoacoustic phenomena and their feasibility, a homogeneous, isotropic cylindrical silicon model with a height of 1 mm and a radius of 4 mm was constructed (model 1), as shown in
Figure 1. A 266 nm pulsed light source was perpendicularly incident on the center of the top surface of the cylinder. A pulsed laser was used to generate ultrasound, which was modeled as a Gaussian beam in the form of f(t) = t/t
0 e
−t/t0 vs. time domain, where t
0 represents the rise time of the pulse, and g(t) =
at space with temporal incident intensity of 160 µJ with an absorption coefficient of 0.8, where r
0 represents half-width at 1/e
2 -intensity point. The time and space profiles of the laser pulse are shown in
Figure 2 and
Figure 3, respectively.
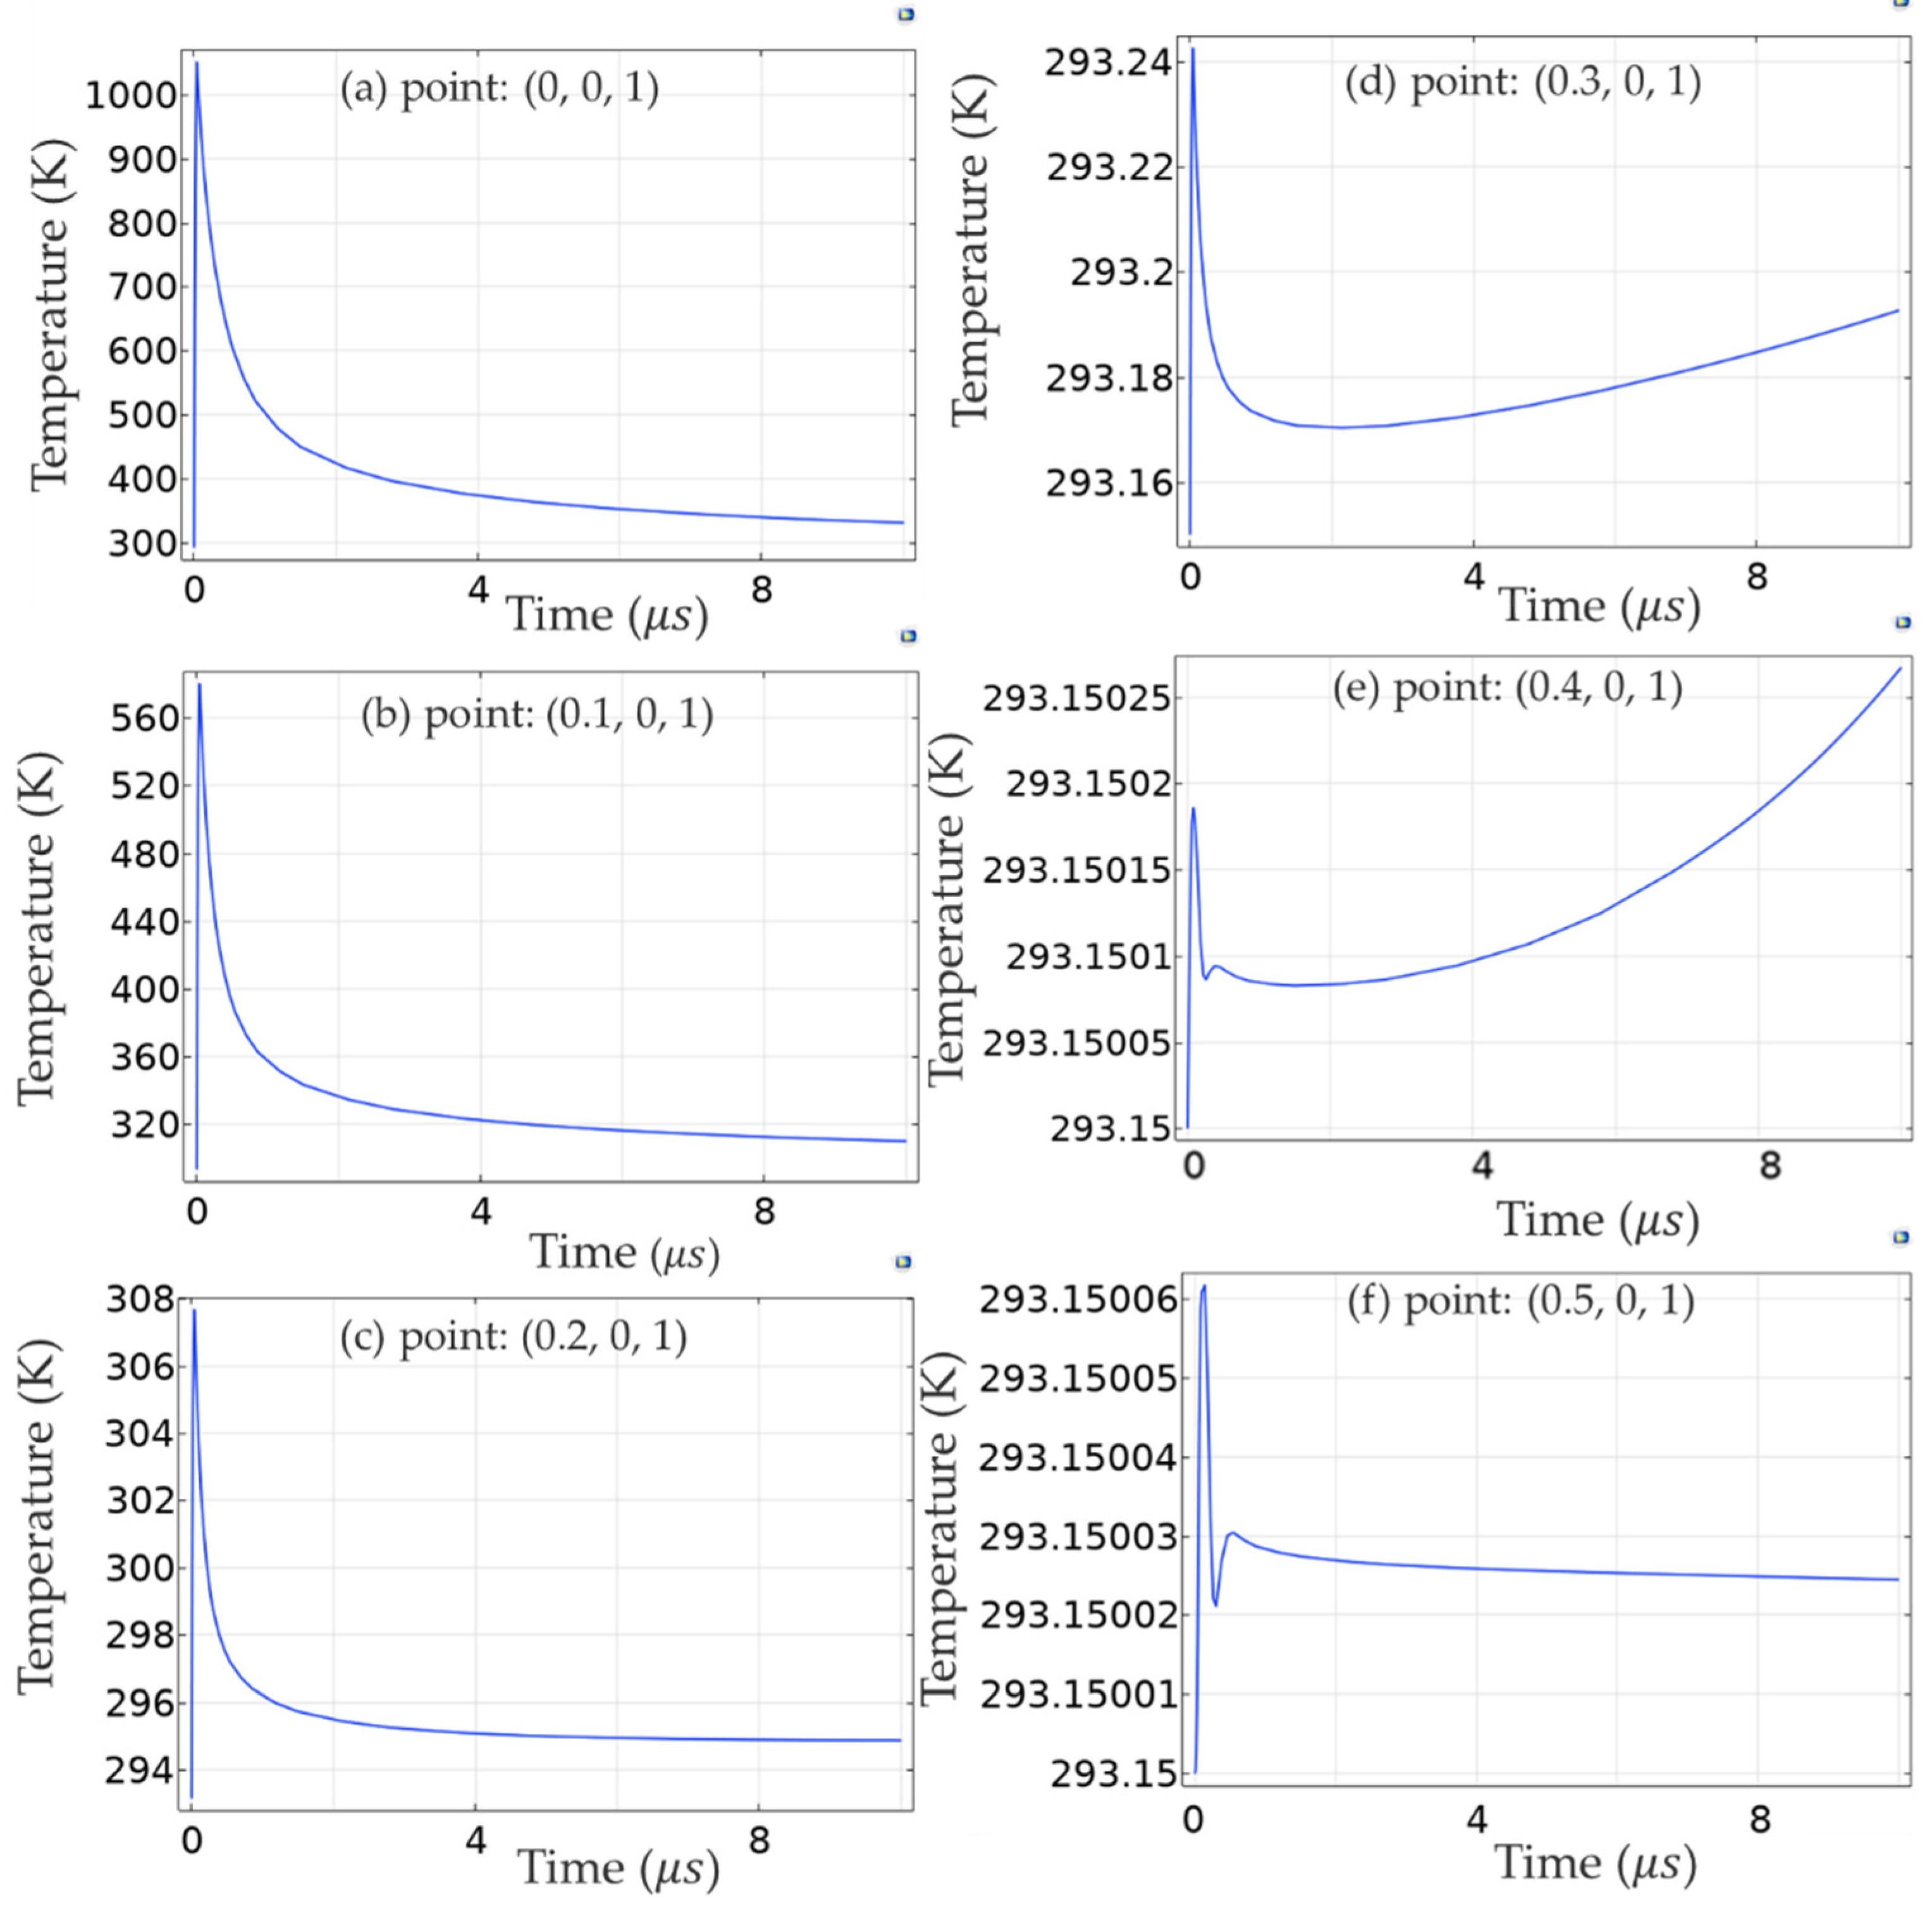
As it takes time for heat and sound to propagate, different detection points were chosen to measure the temperature and displacement of the material. The temperature curve can illustrate whether the heat propagates to this point, and the displacement curve can verify whether the fluctuation at this point is caused by thermal effects or sound waves. The distribution of temporal temperature is plotted in
Figure 4, showing a very fast period of increase (around 0.04 µs) from room temperature to the highest temperature and a very slow descending process from the peak temperature to room temperature. The displacement diagrams of different positions on the aluminum are shown in
Figure 5.
As evident from the results in
Figure 5a, the displacement of the center point (0, 0, 1 mm) showed a rapid trend at the very beginning and then slowly declined after reaching a peak value, but none of the curves is similar to the jitter of the sound wave. This is because the displacement change caused by temperature was far greater than that caused by pressure at the center point, which was the strongest incident energy point. Additionally, because of the small energy and the accuracy of the grid, there are steep changes in the curve, which may lead to unsmooth curves.
Therefore, it can be inferred from
Figure 5c that, when the thermal effect propagated to these points, the thermally induced displacement far exceeded the displacement caused by photoacoustic pressure, within 1 µs vibrations, which was caused by the photoacoustic pressure occurring in the curves by first spreading to the negative direction of the
Z-axis and then to the positive direction. However, after 1 µs, the displacement increased in the positive direction, because the thermal effect spread to this point, and the displacement disturbance caused by the thermal effect was greater than that caused by sound pressure, though the thermal diffusivity in silicon was 8.8 × 10
−5 slower than the propagation speed of photoacoustic waves.
Since the spot size at the 1/e
2 was 100 µm, as can be seen from
Figure 4b, in the 1/e
2 area of the laser spot range, the temperature changing trend at each point was similar to that of the center point (0, 0, 1 mm), while at the edge of the laser spot, the laser-induced heat was relatively low, so the temperature change range was small. Within the radius of 0.3 mm from the center point (0, 0, 1 mm), the overall trend of temperature change was usually unchanged, that is, the temperature reached the maximum value within a certain time delay when the laser pulse reached the maximum value in the time domain, and then slowly decayed. When it exceeded the area outside the laser spot range, the temperature change was relatively small, <1K, because the thermal effect propagation was relatively slow, as can be seen from
Table 1; the thermal conductivity of silicon at 293 K was 1.38 W/( m ∙ K).
From Equation (5), it can be seen that the temperature or thermal effect caused a corresponding change in displacement, meaning that they had a proportional relationship. Although photoacoustic signals also caused a corresponding displacement, the displacement caused by the thermal effect was far greater than that caused by photoacoustic pressure within the size range of the laser spot. Therefore, the changing trend of displacement was mainly dominated by the thermal effect within the range of point 0.1 mm. Thus, when using solid mechanics to observe photoacoustic signals in COMSOL, the observation points were all outside the range of the laser spot, and therefore, the influence of temperature on displacement was excluded. However, because of their fast propagation speed, sound waves were observed in a small range of 0.2 mm, but as time passed, the heat also reached this point, indicating that the displacement of the initial part of the curve in
Figure 5c strengthened instead.
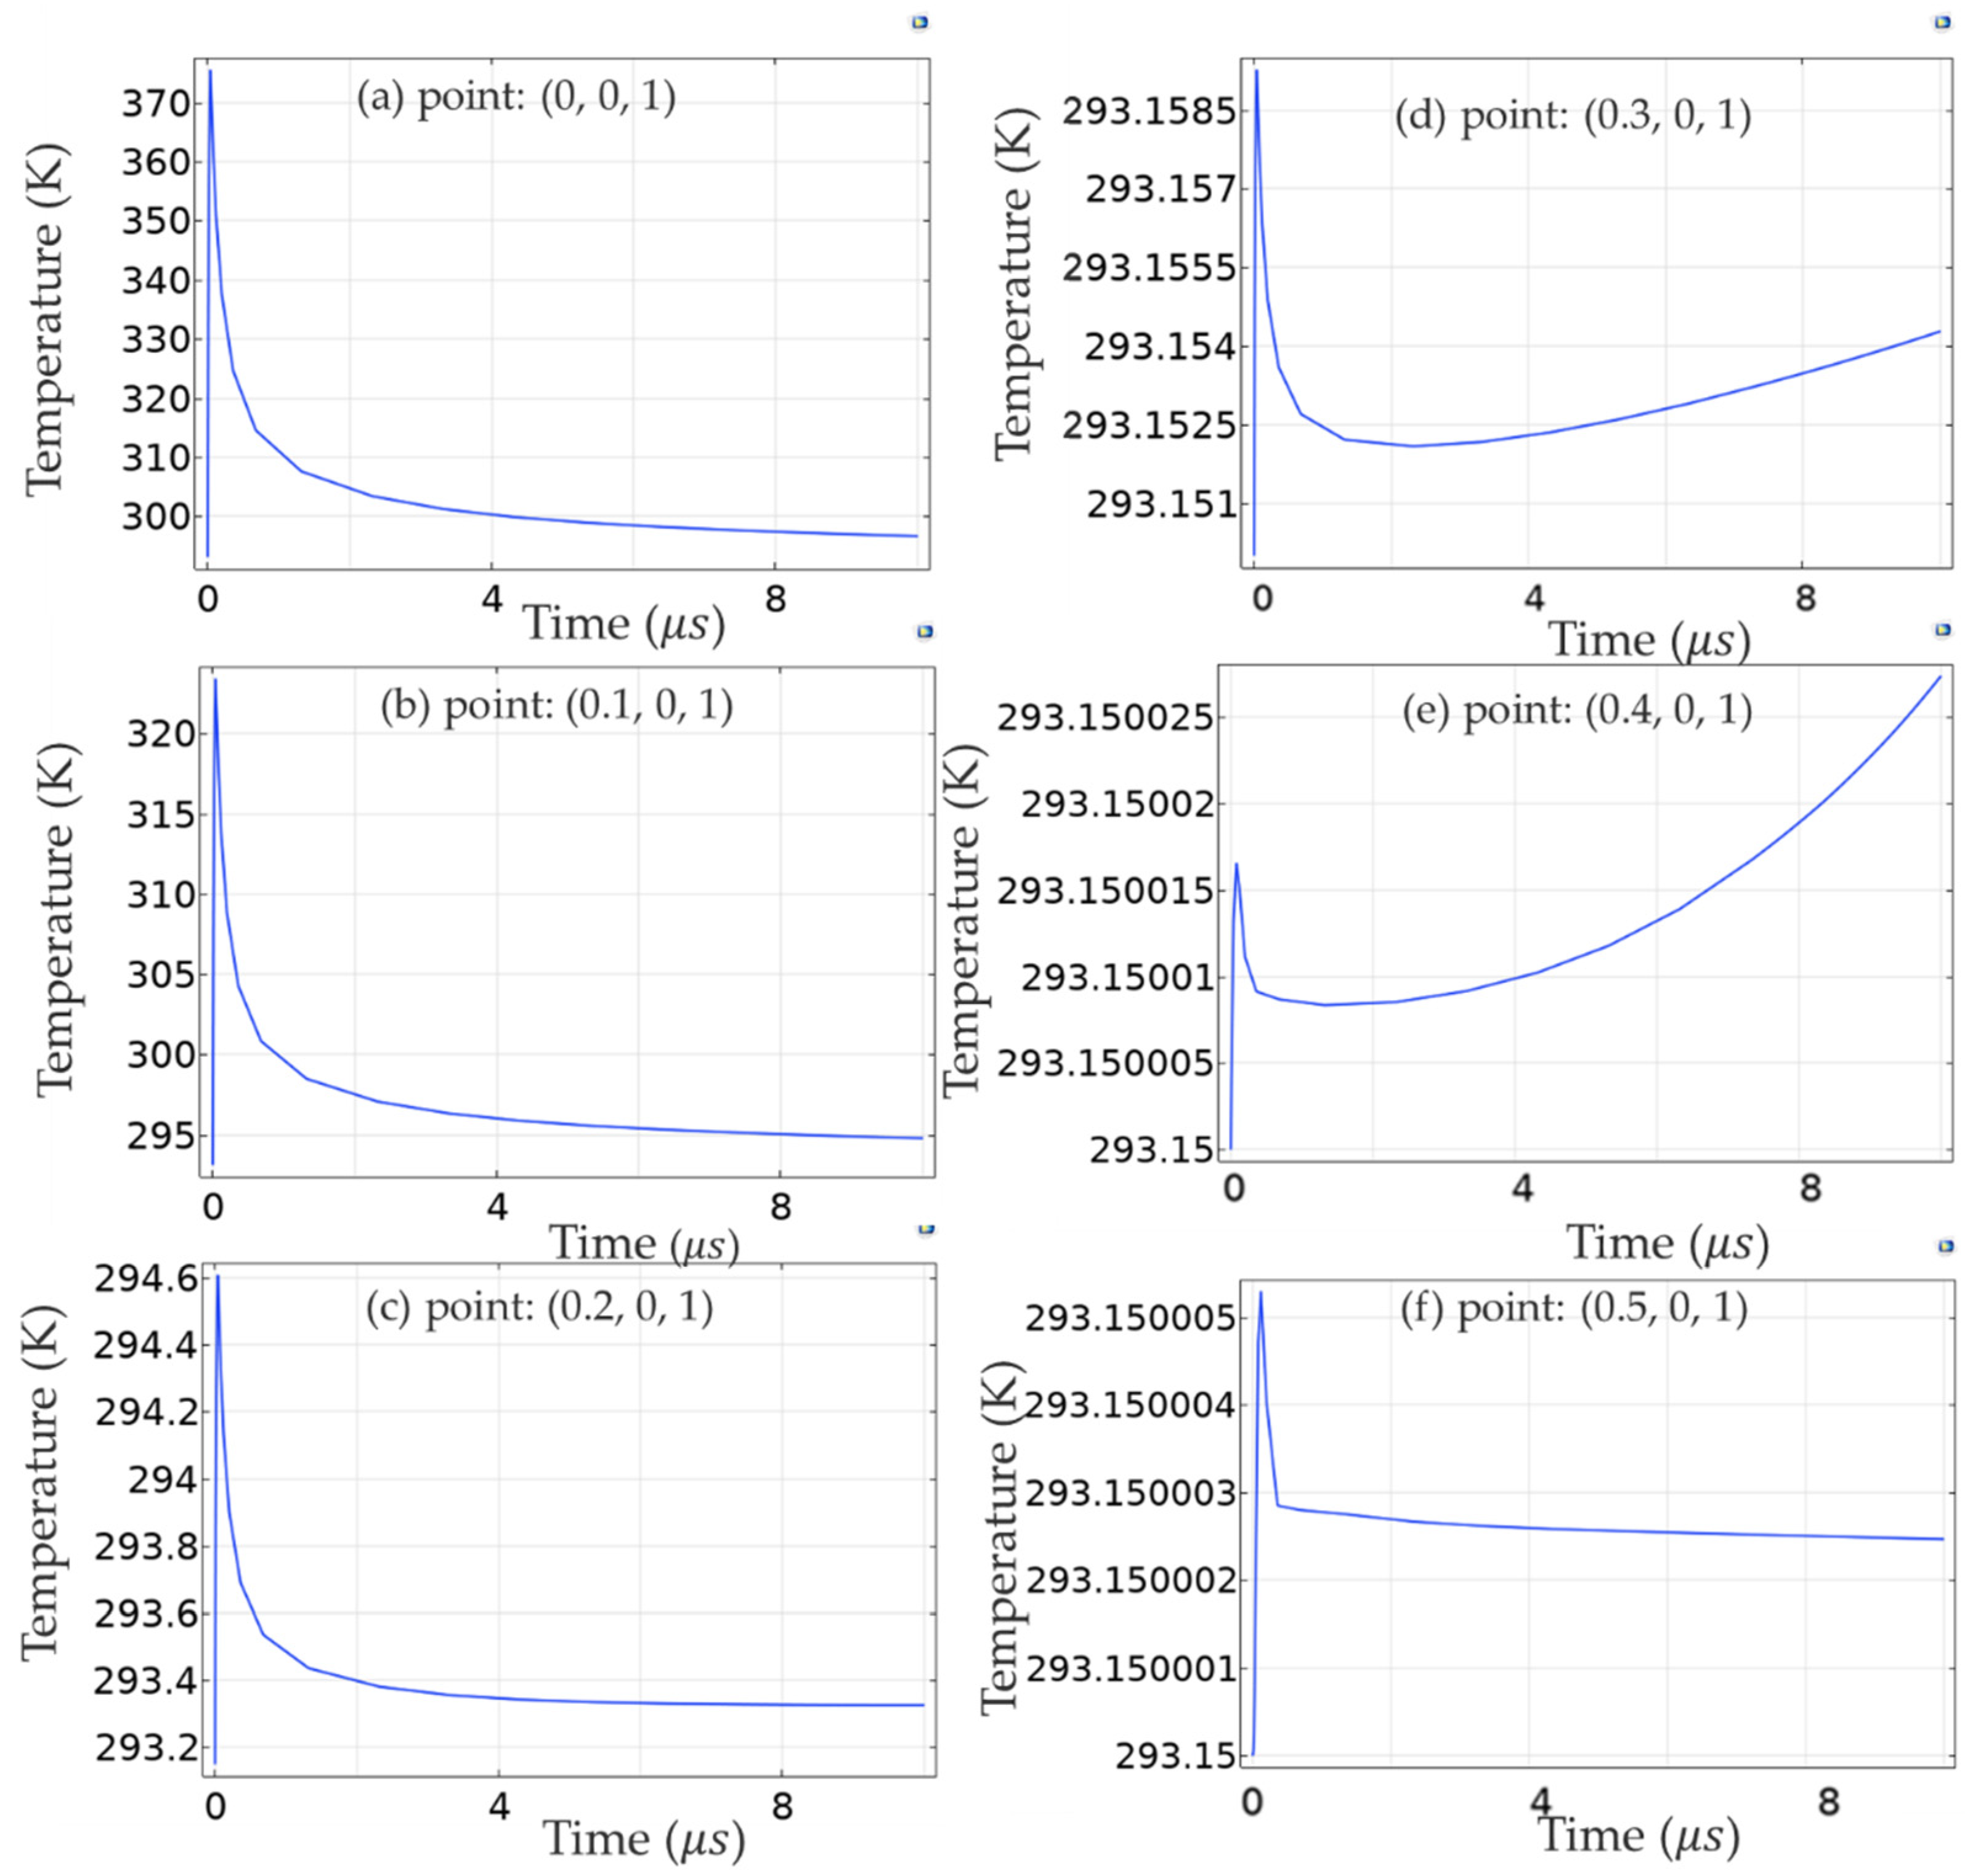
However, the incident intensity was too high for silicon, and the maximum temperature of the center point (0, 0, 1 mm) reached 1050 K, which is close to 1273.15 K, the melting point of silicon. Therefore, based on model 1, the incident intensity was reduced by 10 times, and then model 2 was constructed. The results of the distribution of temperature and displacement at each point are shown in
Figure 6 and
Figure 7, respectively.
By comparing
Figure 4 and
Figure 6, and
Figure 5 and
Figure 7, it can be found that the overall changing trend of temperature or displacement at each point is similar. As shown in
Figure 6a, the maximum temperature at the center point was 375 K, which is much lower than the melting point of silicon and, therefore, suitable for real-life applications.
The displacement value is reflected in the simulation, but it is characterized by the light intensity value in the experiment. To achieve consistency, the relationship between the measured reflected intensity according to the displacement is deduced below.
The total light intensity incident on the photodetector can be indicated as [
18]
where
is the signal electric field back-reflected from the sample, and
is the reference electric field. Then, the reference electric field can be expressed as
The signal electric field can be modeled as E
S = E
D + E
A,
where E
D is the electric magnitude of light reflected from the sample surface, and E
A is the electric field amplitude of back-reflected from the excitation region that is induced by the refractive index modulation due to thermal and photoacoustic effects [
18]. A
R and A
S are the attenuation degree of the density filter including the attenuation caused by depth in the scattering medium of the reference beam and signal beam, respectively. TS is the transmission intensity coefficient, and R
S = R + ∆R =
is the intensity reflection coefficient at the interface after the excitation volume, where
From Equations (5) and (17), the pressure-induced refractive index change can be indicated as
The thermally induced refractive index change can be expressed as
Then, the total refractive indices changes can be given as
When the displacement on the sample is small enough, the refractive indices change is proportional to the generated displacement.
From Equation (20), it derived that
where
As the AC term is collected during detection, there is
where
Although refractive index modulation induced by the thermal effect is small, it is potentially noticeable in the scattering medium and would be applied locally in the heating region [
18]. Thermal cooling occurs on a scale of microseconds to milliseconds after laser-induced heating. This was proved by simulation on COMSOL and was also verified by the following experiments.
4. Experimental Study
The schematic of the experimental setup is illustrated in
Figure 8. A burst of nanosecond laser pulses was used to illuminate the phantom. A 1310 nm continuous-wave interrogation beam was focused on the phantom. The reflected interrogation content from the phantom was then collected. The exciting beam was focused onto the phantom, using a focusing mirror with a focal length of 100 mm. The probe beam was passed through a polarized beam splitter, followed by a λ/4 zero-order wave plate. Then, the probe beam was focused onto the phantom using a 0.4 NA objective lens. The back-reflected probe beam returned through the λ/4 zero-order wave plate and was redirected through the polarized beam splitter and focused onto the photodiode for detection. The excitation beam was 266 nm, with a 5 ns pulsed laser, and laterally exposed to the particles.
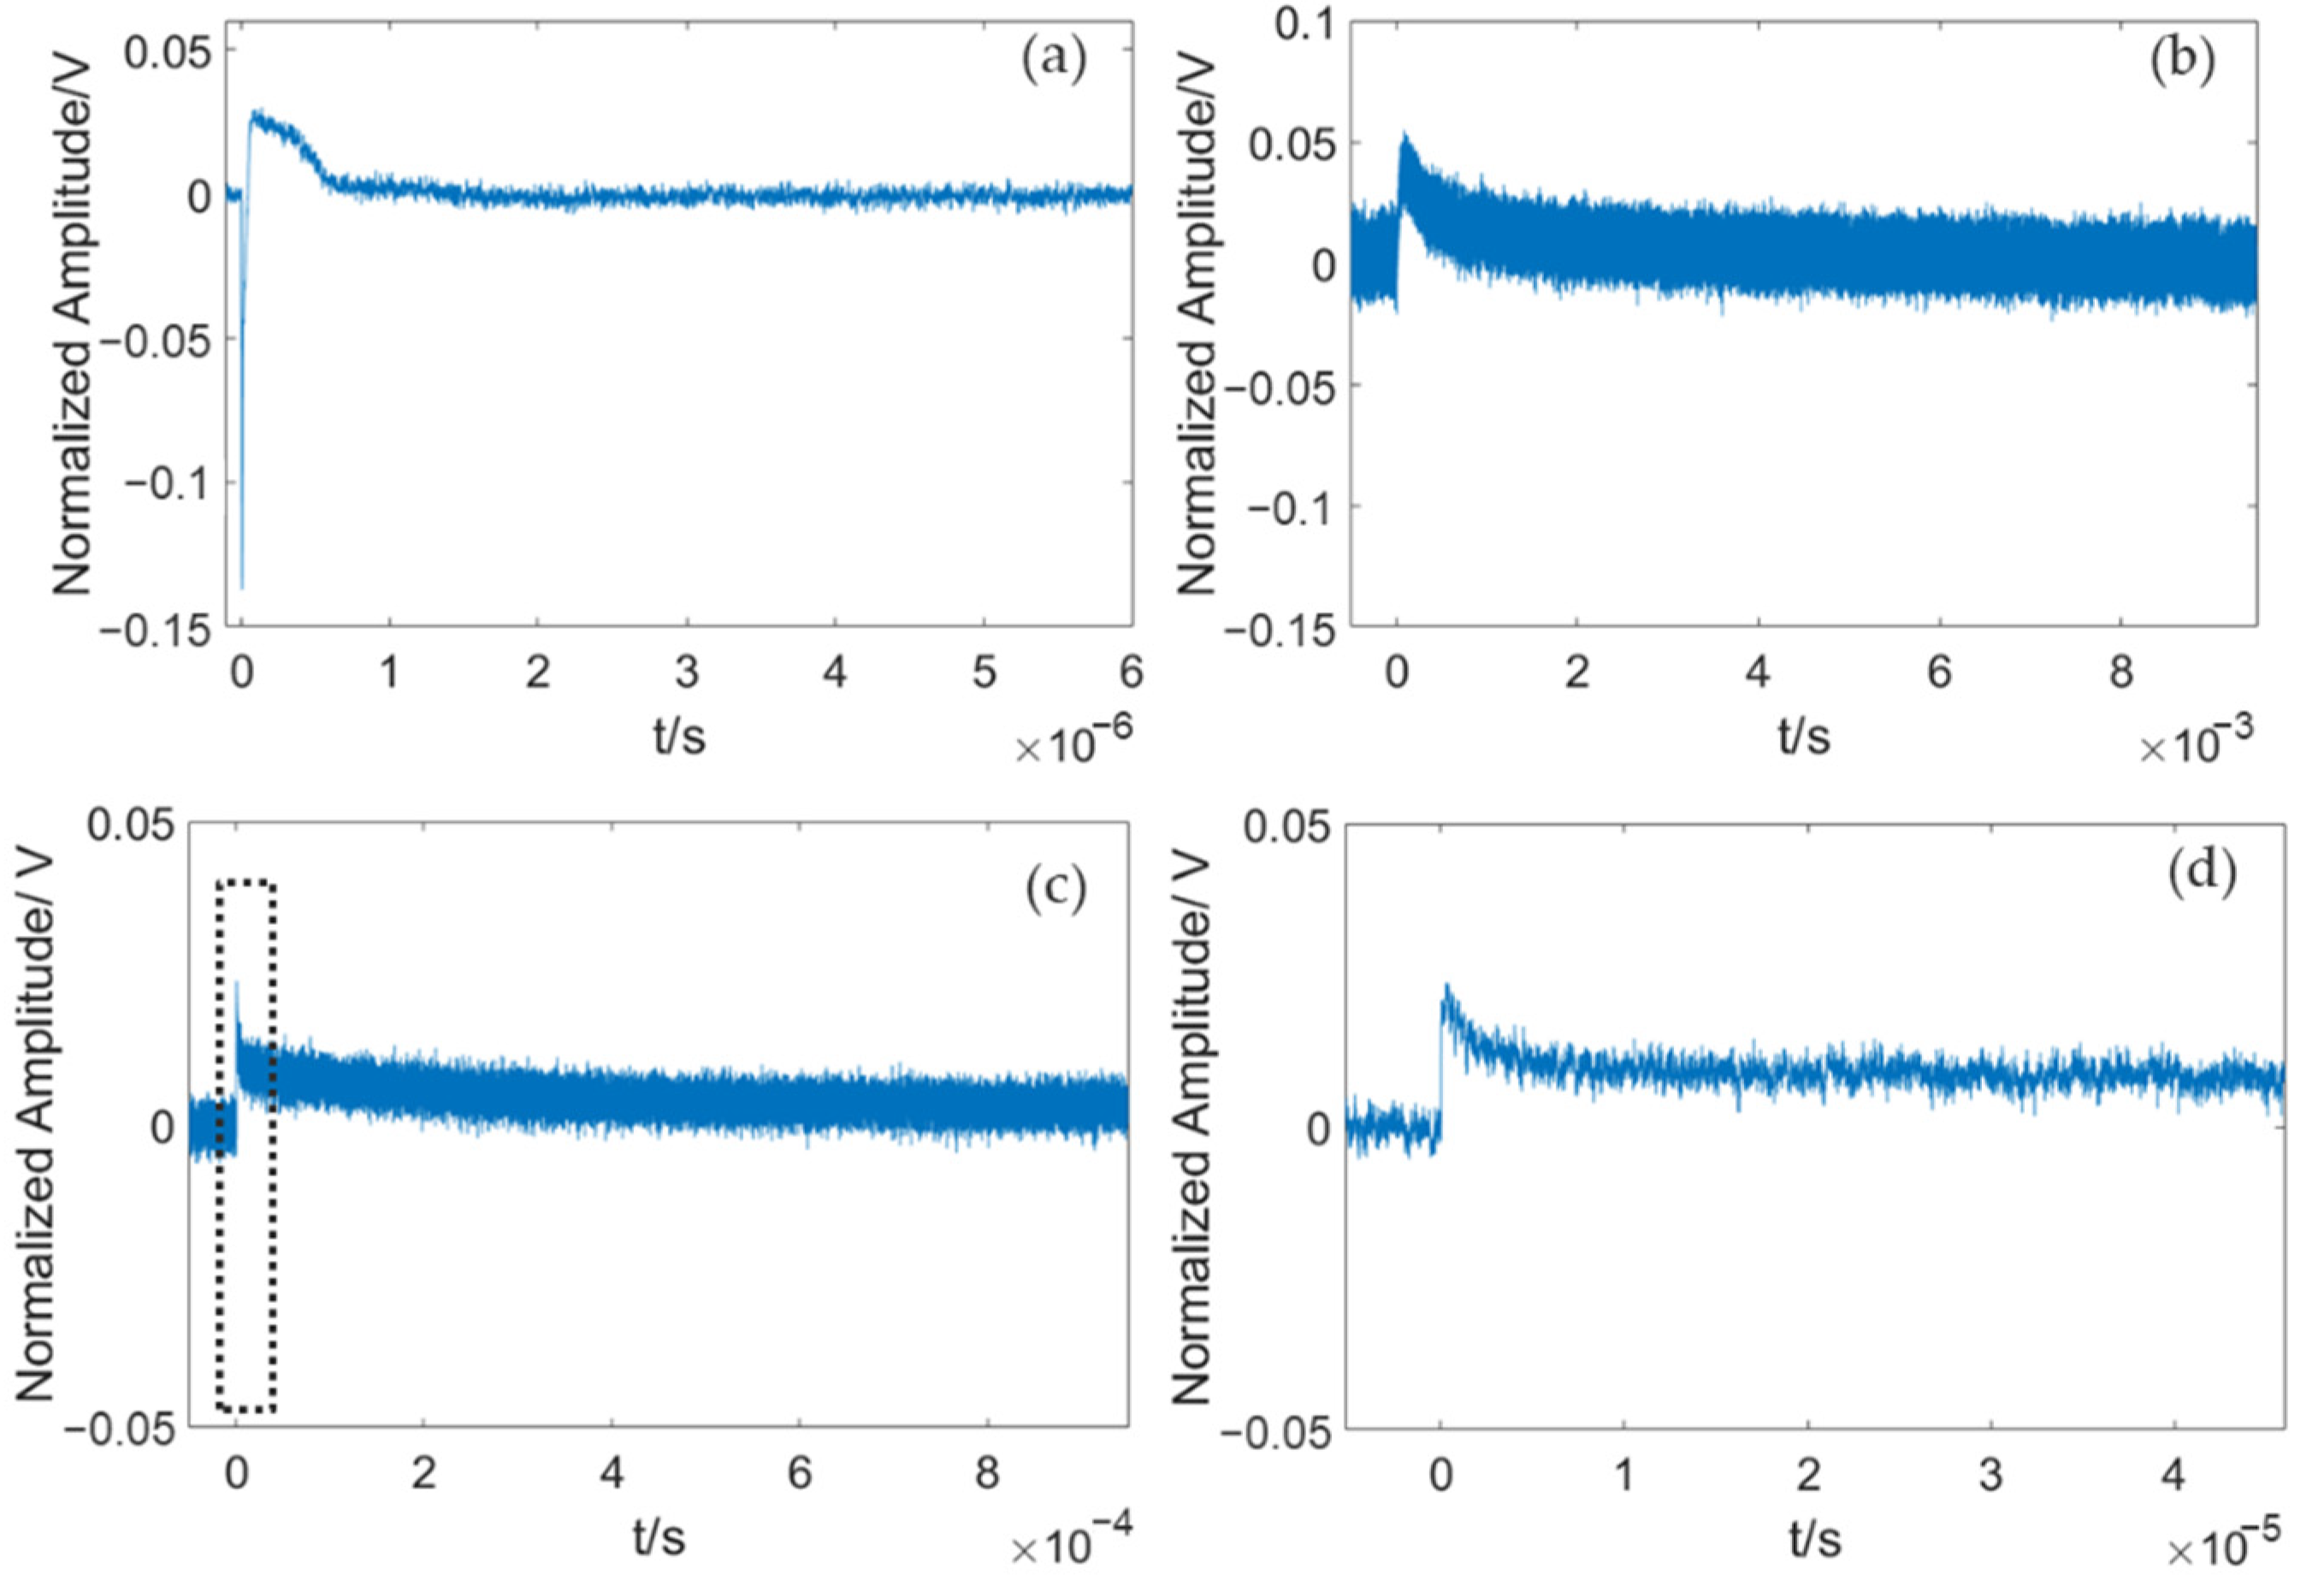
To verify the accuracy, experiments were carried out for different material interfaces with different material pairs. We conducted the experiments on the interface of the agarose gel and silicon. The results are shown in
Figure 9. The rapidly changing part of the curve is consistent with the results reported in the literature [
19], which is related to the perturbation of photoacoustic signals. There is a slow decline at the back end of the curve, which is caused by the photothermal phenomenon. As shown in
Figure 9, the pulse width of the pulsed laser was 5.8 ns. The maximum amplitude occurred at 4.16 ns from the time-domain signal of agarose gel and silicon interface and returned to a stable state at about 60 µs.
The same experimental results were also revealed in the interface of other material pairs, such as copper, aluminum, and carbon fiber. The thickness of agar covered above the material was the same, while the thicknesses of the rectangular copper sheet, rectangular aluminum sheet, and carbon fiber used in the experiments were 1 mm, 1 mm, and 7 µm, respectively.
Figure 10 shows the thermal cooling times with different delay times for the same pulse delay, which are all in the range of µs to ms. The cooling time of each interface was about 57 µs, 500 µs, and 20 ms for the interfaces between the agarose gel and copper, aluminum, or carbon fiber, respectively. As different materials have different thermal diffusion coefficients and thermal conductivity coefficients (
Table 1), different materials showed different thermal diffusion times, and the thicknesses of the materials are different, leading to different cooling times.
Under the irradiation of a nanosecond pulse laser, the generation time of the photoacoustic signal is generally within a nanosecond range, and the change in refractive index generated via the photoacoustic signal should also be within the nanosecond scale. However, due to the thermal cooling time, which reached a scale of a microsecond to a millisecond after laser-induced heating, the corresponding induced refractive index would also be in the corresponding order. Even if the thermally induced refractive index change was smaller than that induced by pressure, it could not be ignored in the heating zone.
Furthermore, different amounts of incident pulse laser energy excite different heat, pressure, and photoacoustic signal; therefore, the corresponding refractive index changes were different. As evident in
Figure 11, the incident pulse energy in (B) was half that of (A), and the time to reach a static steady state of (B) was about 3.1 ms, faster than that of 5 ms in (A).
The corresponding experimental results correspond to the simulation results, which showed that the refractive index change caused by heat cannot be ignored in the range of the pulse laser spot area.


 ,
, 


