1. Introduction
Deepwater pipe is the key equipment for the exploitation of offshore oil and gas resources and is the only channel for connecting the subsea wellhead/equipment to the surface floating body. Under the action of ocean currents, vortices are generated and alternately shed from the sides of the pipe, and periodic vortex shedding will produce periodic hydrodynamic force around the structure. When the frequency of hydrodynamic force is close to a certain order of the natural frequency of the riser, a vibration will be induced in the cross-flow (CF) and in-line (IL) directions in the riser, which is termed vortex-induced vibration (VIV). VIV can lead to severe fatigue damage to the riser. Therefore, an accurate prediction of VIV and the induced fatigue damage is of great significance for the design of the riser.
In order to study the force characteristics of VIV in the early stage, researchers extracted a rigid cylinder segment from a slender flexible riser based on strip theory and measured the VIV force acting on the cylinder segment synchronously by forcing the rigid cylinder segment to perform harmonic forced oscillation in a steady flow field. Gopalkrishnan [
1] of MIT and Aronsen [
2] of NTNU carried out unidirectional forced oscillation experiments in the CF and IL directions, respectively, in which the VIV forces in both the CF and IL directions were divided into the excitation force in the same phase with velocity and the added mass force in the same phase with acceleration, and the corresponding force coefficient was excitation coefficient and added mass coefficient. In the experiment, the rigid cylinder was forced to move according to different oscillation amplitudes and frequencies, the excitation force coefficients and added mass coefficients under the corresponding dimensionless amplitude and frequency were obtained, and the vortex-induced force coefficient libraries in the CF direction and IL direction were established. At present, the vortex-induced force coefficient models in the semi-empirical frequency-domain prediction software shear7 and VIVANA are widely used in the world, which are simplified from these two vortex-induced force coefficient libraries. However, for real marine flexible risers, VIV in the CF direction and IL direction exists simultaneously, and it has been shown that they are coupled with each other. This coupling exists in both vibration response and vortex-induced force [
3,
4]. In order to systematically study the vortex-induced force characteristics of the riser in the CF direction and IL direction under the coupling of VIV, Dahl [
5] carried out rigid cylindrical bidirectional forced oscillation experiments under different Reynolds numbers (Re), amplitudes in the CF direction, amplitude ratios in the CF and IL directions, dimensionless frequencies in the CF direction, frequency ratios in the CF and IL directions and displacement phase differences in the MIT towing tank. It was found that the force coefficients under the bidirectional coupling of VIV are closely related to the displacement phase difference in both directions.
The flow field of the rigid cylindrical segmental forced oscillation experiment/numerical simulations has significant two-dimensional characteristics. Meanwhile, in practice, when VIV occurs, the flow field of the marine slender flexible riser, especially steel catenary risers, flexible riser covered with buoyancy modules and helical strakes, has strong three-dimensional characteristics. Therefore, researchers proposed a tank model experiment based on the VIV of a slender flexible riser with three-dimensional flow field characteristics to invert the vortex-induced force on the flexible riser. The main idea of this method is that the response of the structure can be obtained by using the finite element method when the forces on the structure are known. Conversely, based on the idea of inverse analysis, if the response of the structure is known, the external forces causing this response can be obtained by inverting the response of the structure with the finite element method.
Based on this idea, Huarte [
6] obtained the hydrodynamic forces acting on the vertically tensioned pipe model under shear flow in the CF and IF directions by using the strain information measured in the experiment and combining the pipe finite element equations. Based on the state vector space equations of pipe finite element, Wu [
7] used the Kalman filtering and recursive least-squares method to remove the noise of the experimental measurement signals and analyzed the hydrodynamic forces in the CF direction of the riser axial distribution under shear flow. Wu [
7] inversed the transverse vortex-induced force characteristics of the flexible riser under shear flow and uniform flow through the further application of the inverse analysis method based on the optimal control theory. This analysis method is to find forces which can cause the structure to produce the response closest to the actual response on the premise of meeting the governing equations for dynamic response at all times. Because this method will not cause time delays when constructing hydrodynamic force, it is superior to the hydrodynamic analysis method based on the state vector space equations of pipe finite element. Song [
8] applied bandwidth filtering and the modal superposition method to reconstruct the single-frequency VIV response of a flexible riser under steady flow, and combined with the inverse finite element method, the vortex-induced forces and coefficients acting on each section of the riser were obtained. This method avoided the instability of load identification caused by the application of the optimization method. The identification coefficients of this method passed the “double blind” test with high accuracy. Using this method, Song [
8] found that the vortex-induced force coefficients of the flexible riser were inconsistent with those obtained by the unidirectional forced oscillation test. Fu [
9] and Zhang [
10] further extended this method to the identification of vortex-induced forces of the flexible riser with buoyancy modules, non-uniform structural characteristics and outer diameter under steady flow. The identification results show that the added mass coefficient of the bare pipe of the flexible riser with buoyancy modules is more than 10, which is much greater than the current specification value (1.0). Wu [
11] validated this finding by carrying out rigid cylindrical forced oscillation tests with buoyancy modules.
Buoyancy modules and helical strakes are very common auxiliary components on marine risers, and their hydrodynamic shapes are quite different from those of bare pipes, resulting in the VIV forces and the response characteristics under ocean currents of them being different from those of bare pipes. Currently, the research on VIV of risers with buoyancy modules and helical strakes at home and abroad mainly focuses on the study of VIV response characteristics. Exxon Mobil carried out a series of unidirectional VIV experiments [
12] on real-scale rigid bare cylinders and real-scale rigid cylinders with strakes; the results show that the VIV response after installing the suppression device could not be predicted with the existing VIV prediction method, but it was confirmed that the St number could predict vortex-shedding frequency. NDP also carried out a systematic VIV test of pipes with helical strakes at the MARINTEX tank in Norway [
13], using a pipe model with a length of 1400 D. Both uniform flow and shear flow fields were considered. The sizes of the helical strakes were 17.5 D/0.25 D and 5.0 D/0.14 D. The results show that the 17.5 D/0.25 D helical strake showed higher suppression efficiency in both uniform flow and shear flow, while the 5.0 D/0.14 D helical strake had lower suppression efficiency in uniform flow. In general, the current research is mainly aimed at the VIV response and fatigue characteristics of flexible risers only covered by buoyancy modules or helical strakes. The research on the VIV force characteristics of flexible risers covered by both buoyancy modules and helical strakes is still lacking.
This paper conducted a model test to investigate the vortex-induced force characteristics of flexible cylinders with buoyancy modules and strakes under uniform flow. The strain information caused by vortex-induced vibration at different cross-sections on the flexible cylinder was measured in the model test. Combined with the modal superposition method and inverse analysis method, the vortex-induced forces on the flexible cylinder were identified, including the excitation force in phase with velocity and added mass force in phase with acceleration. The accuracy of the identified forces was verified via a finite element analysis procedure. Then, the vortex-induced force characteristics were analyzed, and the influence of strakes on the VIF and energy distribution of flexible cylinders with buoyancy modules covered were investigated.
2. Model Test
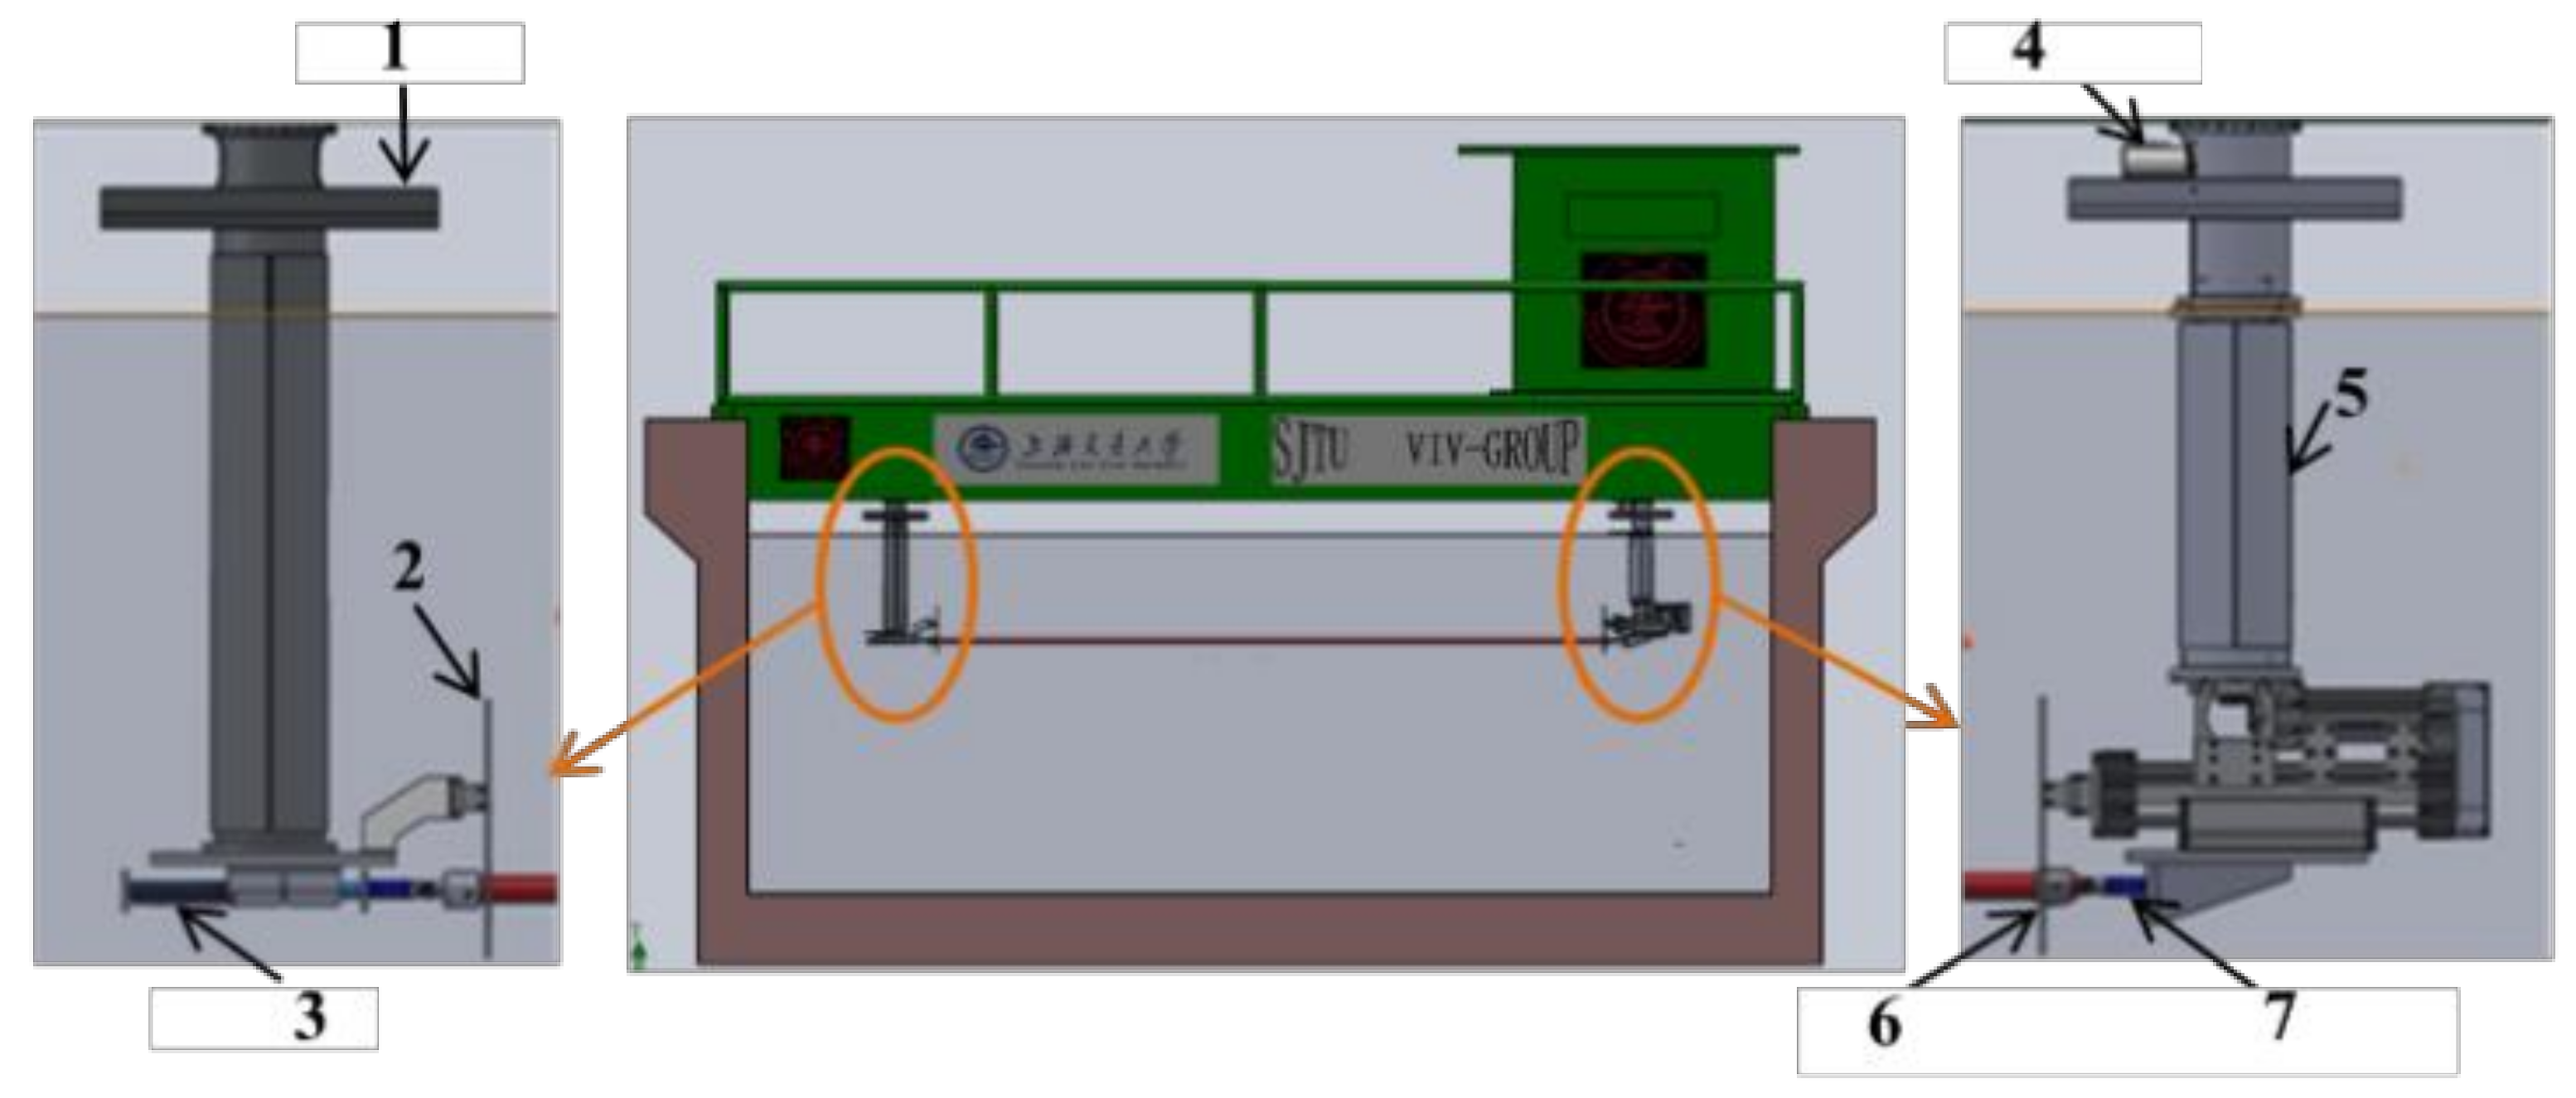
The model test of a flexible riser with buoyancy modules and helical strakes in steady flow was carried out in the towing tank of the Shanghai Ship and Shipping Research Institute (SSSRI). The towing tank is 192 m long, 10 m wide and 4.2 m deep. The test device was mainly composed of a trailer, pretension module and buffer module, as shown in
Figure 1. The pipe model was placed horizontally in the pool with its center 1.5 m away from the water surface. The ends of the pipe model were hinged with the pretension module and buffer module. The pretension module applies constant pretension to the pipe model, while the buffer module ensures that the pipe model can move along the axial direction. At the beginning of the test, the pipe model was placed horizontally in the towing tank, and then the trailer drove the pipe model to move forward at a constant speed in the towing tank so as to form a relatively uniform inflow as shown in
Figure 2. The accuracy of trailer speed was 0.1%. The experimental current speed ranged from 0.4 m/s to 2.0 m/s.
We used brass with good strength and corrosion resistance to simulate the bare pipe. Natural silica gel with great water tightness and low stiffness was selected to simulate the buoyancy modules (
Figure 3a). Rubber material was used to make the helical strakes model for its good coating (
Figure 3b). The main parameters of the pipe model are shown in
Table 1.
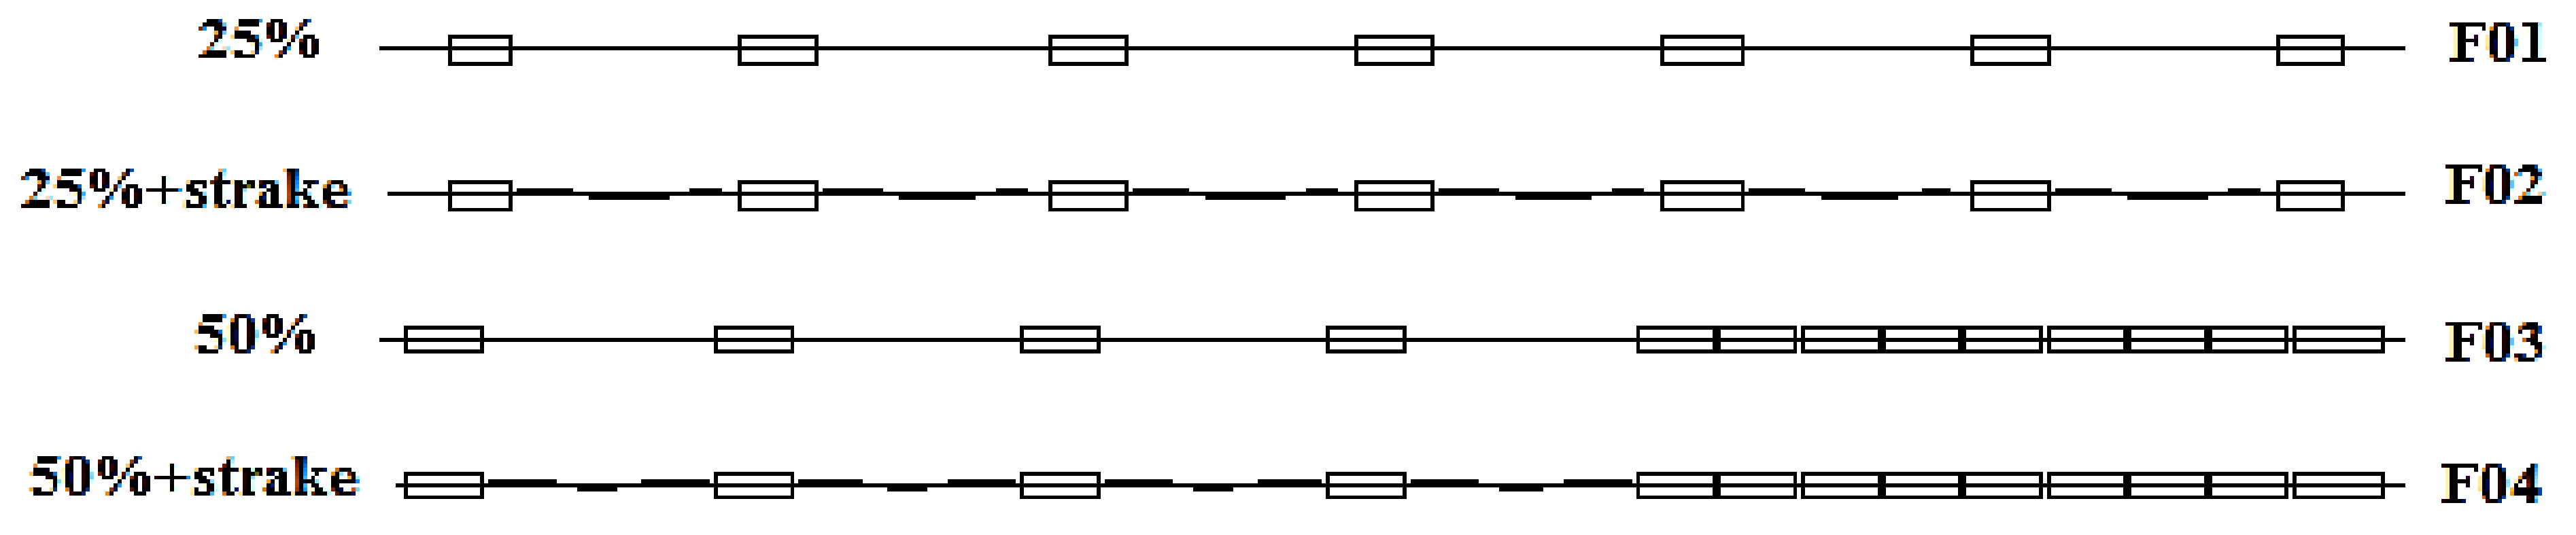
Four distribution forms (as shown in
Figure 4) were selected in this test, i.e., the uniform/non-uniform arrangement of buoyancy modules and with/without strakes. These four forms are shown as follows, numbered F01 to F04:
F01: 25% of buoyancy modules covered uniformly. The spacing of the buoyancy modules is 90 cm, and at both ends, modules are 26 cm away from the end of the pipe;
F02: 25% of buoyancy modules covered uniformly + 17.5 D/0.25 D strakes. The buoyancy modules are arranged the same as F01, but there are helical strakes in the bare pipe.
F03: 50% of buoyancy modules covered non-uniformly. The spacing of the buoyancy modules in the dense part is 90 cm, while in the sparse part, it is 2 cm. At both ends, modules are 9.5 cm away from the end of the pipe;
F04: 50% of buoyancy modules covered non-uniformly + 17.5 D/0.25 D strakes. The buoyancy modules are arranged the same as F03, but there are helical strakes in the bare pipe in the sparse part.
We used the fiber Bragg grating strain sensors to measure the strain response time history on the surface of the pipe model. Different from the traditional resistive sensors, several fiber Bragg grating sensors can be arranged on one fiber, which is more suitable for array and synchronous measurement. In addition, the fiber Bragg grating sensor also has the advantages of good anti-electromagnetic interference ability, small size, easy installation, low cost, waterproof quality and no loop. The sensors were respectively arranged in the four directions, CF1, CF2, IL1 and IL2, of the pipe model (as shown in
Figure 5). The strain information in the four directions of the model was measured. The sensors were evenly arranged, 25 in the IL direction and 19 in the CF direction. The number and spacing of the optical fiber measuring points mainly depended on the maximum modal order that the riser model may excite in the test. To avoid modal confusion when the vortex-induced vibration displacement is reconstructed by the modal analysis method, the number of strain measurement points should be larger than the maximum modal order that the riser model may excite. According to the published vortex-induced vibration test observations [
2,
14], the VIV excitation frequencies in the CF and IL directions satisfy the following relationship:
where
U is the flow velocity;
D is the outer diameter of the pipe;
fCF is the excitation frequency in the CF direction; and
fIL is the excitation frequency in the IL direction. Based on Equations (1) and (2), we can obtain the maximum potential excitation frequency in the CF and IL directions for this test. Then, according to the resonance characteristics of the vibration system, the natural frequencies and modes closest to the maximum potential excitation frequency are most likely to be excited. For this test, the highest possible modes excited by the riser models were the 7th order in the CF direction and the 14th order in the IL direction. At the same time, as the vortex-induced vibration responses of flexible cylinders under uniform flow may have traveling wave features, to avoid the problem that the vortex-induced vibration response cannot be accurately reconstructed due to an insufficient number of measuring points, it is necessary to reserve enough margins for measuring points.
During the process of collecting experimental data, the speed signal of the motion mechanism, the tension signal at the end of the riser, and the strain signal at different sections on the riser were collected synchronously, and the sampling frequency was 250 Hz.
4. Results and Discussion
In this section, we select the pipe (distribution form of F02 and F04 above) with 25% and 50% coverage of buoyancy modules and helical strakes under the velocity of 1.6 m/s as the analysis object and compare the hydrodynamic coefficients of flexible pipes without helical strakes (distribution forms of F01 and F03 above) to study the VIV response, vortex-induced force and coefficient distribution characteristics of pipes with buoyancy modules and helical strakes. Then, we analyze the total hydrodynamic force on the pipe and vortex-shedding energy before and after the installation of helical strakes, and the inhibition mechanism of the VIV response of the risers with buoyancy modules by the addition of helical strakes is explored in detail.
4.1. VIV Response Characteristics
As shown in
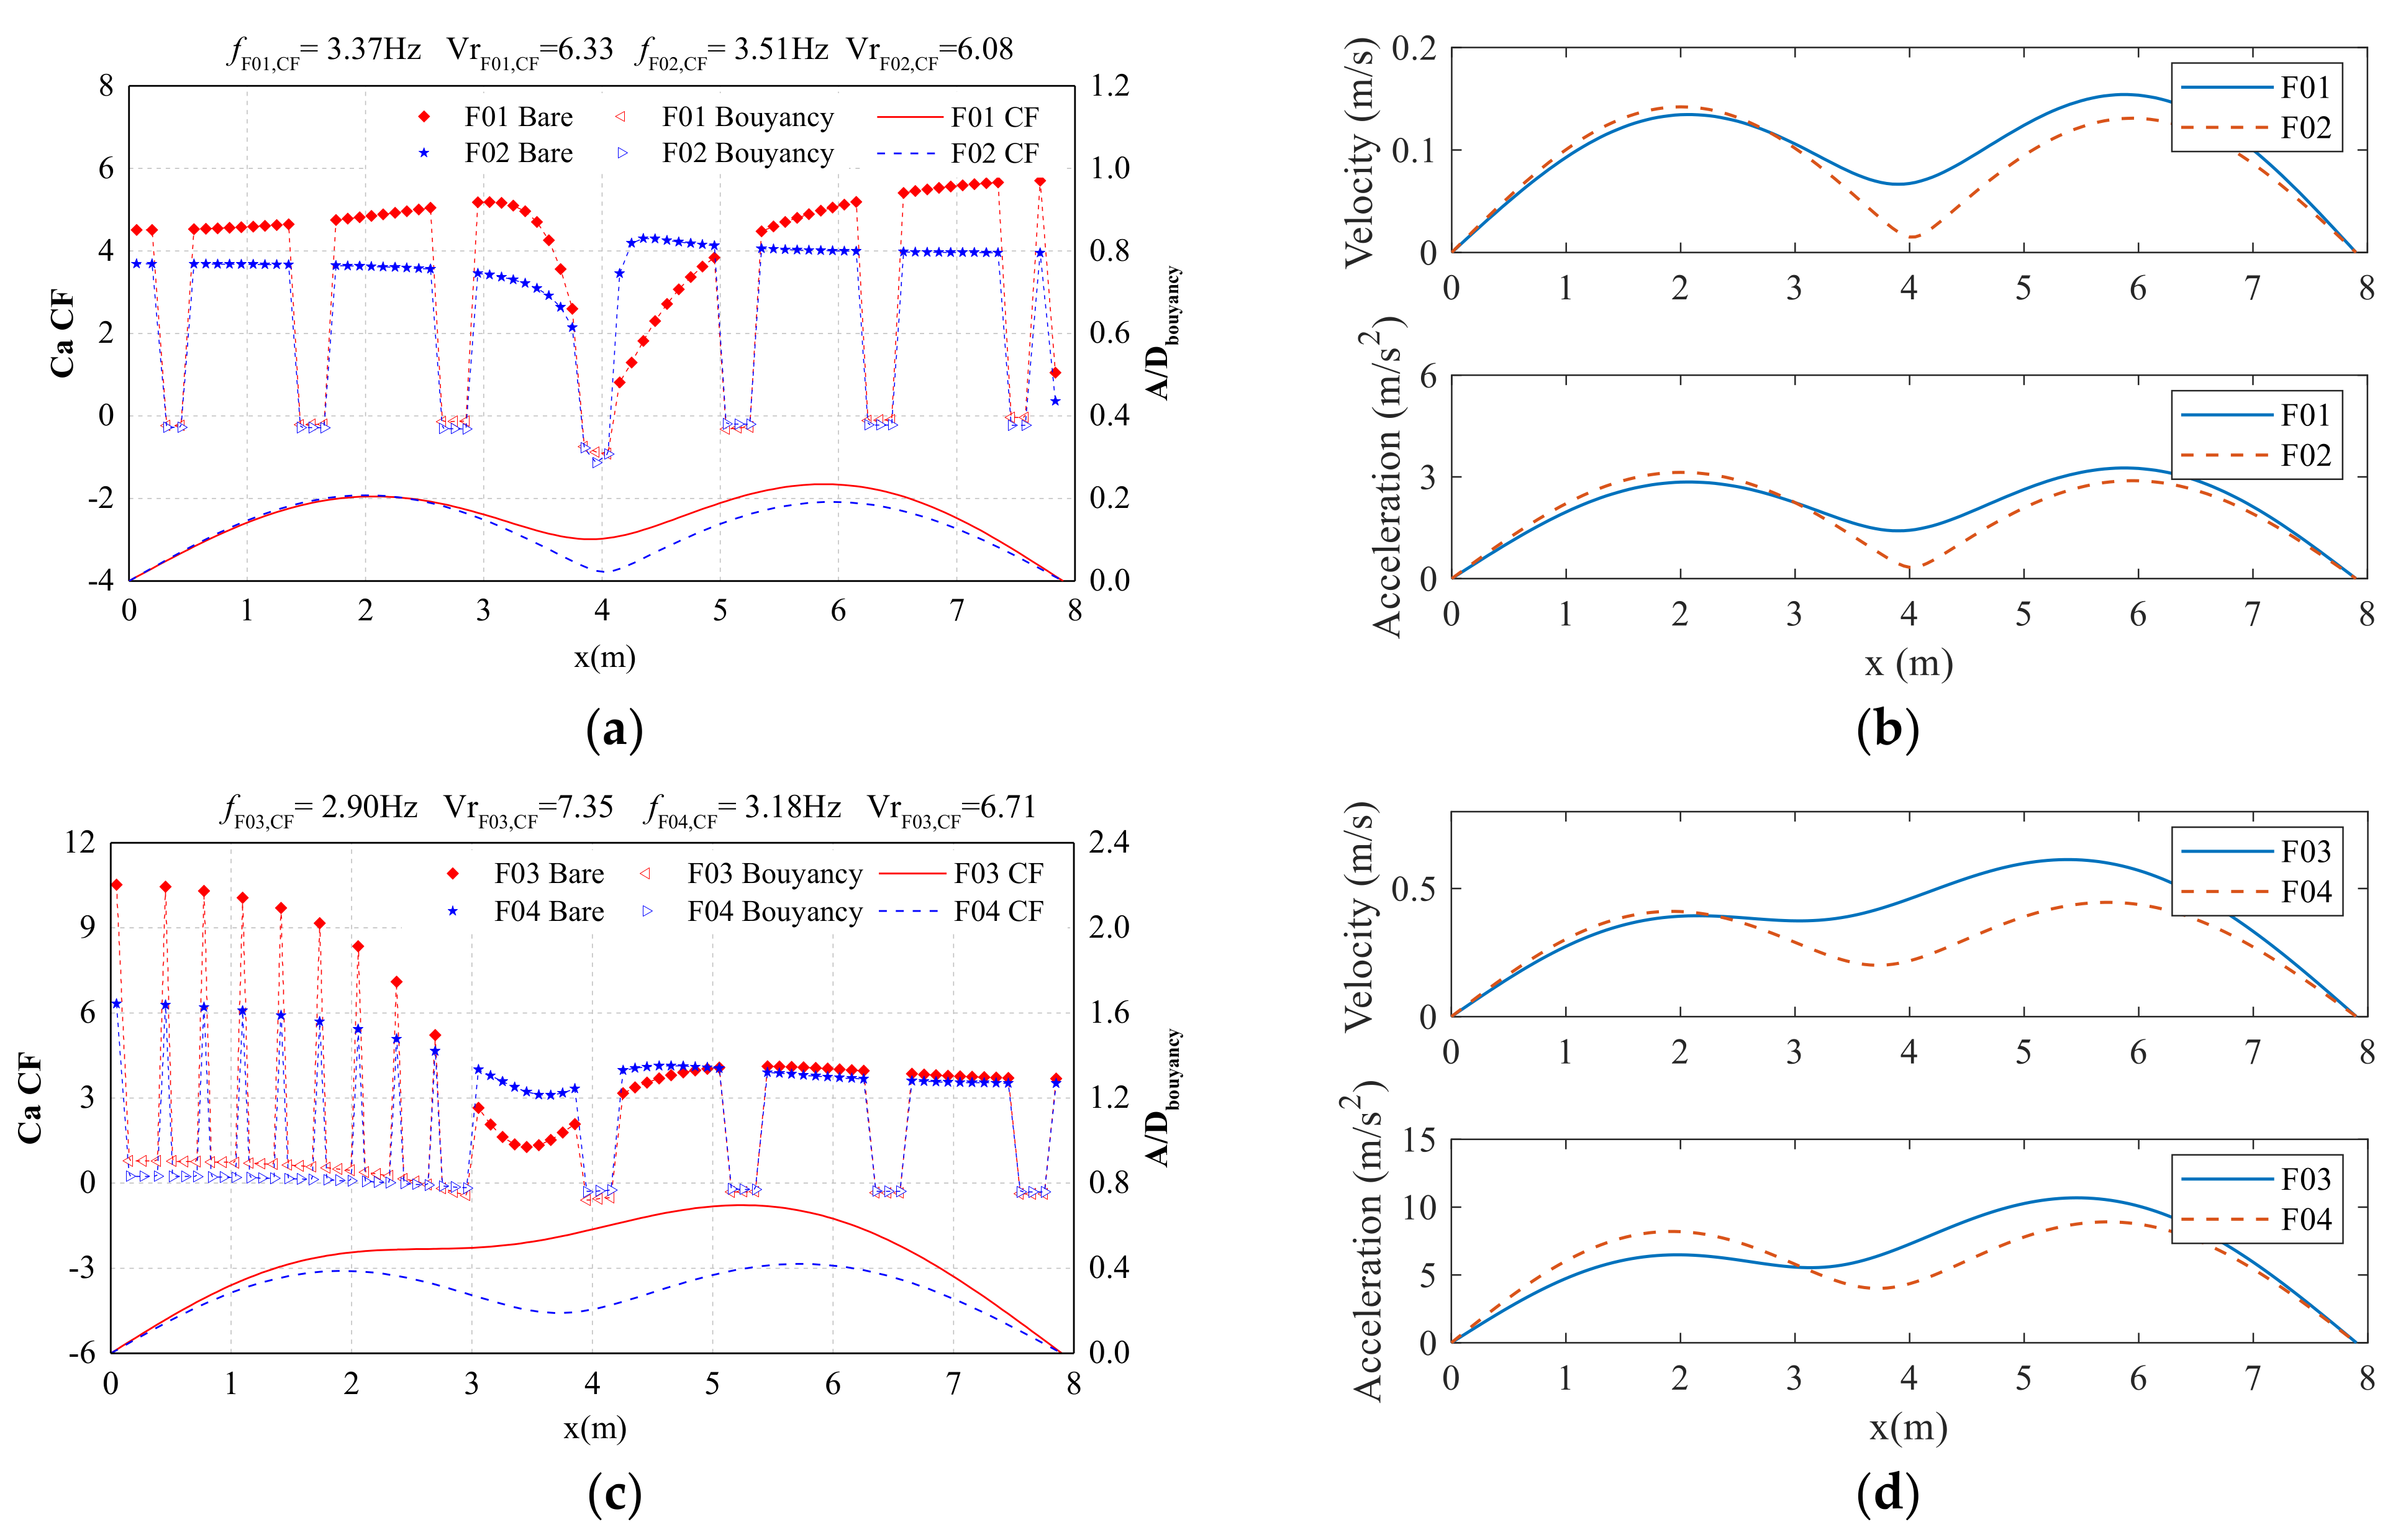
Figure 6, the VIV responses of the flexible riser with buoyancy modules have two or even more vibration frequencies under a uniform flow velocity of 1.6 m/s. The frequencies of the VIV response in the CF direction for the pipe model (F01) with uniform buoyancy coverage of 25% and no helical strakes are 9.72 Hz and 3.37 Hz. The two frequencies are close to vortex-shedding frequencies of the bare pipe and buoyancy modules, which can be regarded as generated by the vortex shedding of the bare pipe and buoyancy modules. In contrast, there is only one frequency component of 3.51 Hz for the pipe (F02) with helical strakes in the CF direction, which is very close to the vortex-shedding frequency of buoyancy modules. This indicates that helical strakes suppress the generation of stable vortex shedding in the bare pipe, resulting in the absence of the bare pipe vortex-shedding frequency component in the VIV response of the riser. Similarly, compared to the pipe (F03) with buoyancy coverage of 50% and no helical strake, the pipe (F04) with helical strakes has only a buoyancy module vortex excitation frequency of 3.18 Hz in the CF direction.
Figure 7 shows the axial distribution of the RMS value of VIV displacement calculated by the modal analysis method before and after the installation of helical strakes under the two forms of buoyancy coverage. It can be seen that the amplitude of the pipe displacement response decreases after covering helical strakes, but the decrease is limited. If the suppression efficiency is defined by the maximum reduction rate of the displacement standard deviation, for the pipe (F01) with uniform buoyancy coverage of 25%, the suppression efficiency of the VIV response is 39% in the CF direction after the installation of helical strakes. For the pipe (F03) with buoyancy coverage of 50%, the suppression efficiency of the VIV response is 42% in the CF direction after the installation of helical strakes, which is much smaller than that of the riser with full coverage of helical strakes in the literature. The reason may be that helical strakes only suppress the vortex-shedding frequency of bare pipes and have almost no influence on the vortex-shedding frequency of buoyancy modules, resulting in a large amplitude of the VIV response of the riser covering helical strakes and buoyancy modules.
To further investigate the suppression effect of the helical strakes on the VIV displacement, the displacement response under the vortex-shedding frequency of the buoyancy modules for the above four riser forms can be obtained by filtering. The RMS values of displacement response in the CF direction of each cross-section under buoyancy modules vortex-shedding frequency are shown in
Figure 8. It can be seen that the decrease in the CF direction of the riser displacement response is not obvious after the installation of helical strakes, which indicates that helical strakes have very little influence on the vortex-shedding of the buoyancy modules, and the main effect is to suppress the VIV response of the bare pipe. The main reason is that the helical fins of strakes can control the separation of the flow. The separation point is at the tip of the strake fin, which induces a three-dimensional flow behind the cylinder breaking the vortex coherence. This is in contrast with the bare cylinder, where the separation occurs uniformly along the span, and coherent vortex shedding is generated, causing a significant VIV amplitude.
4.2. The Added Mass and Its Coefficient Characteristics
Based on the above displacement response results, the added mass coefficient at each section of the riser was further calculated and identified, as shown in
Figure 9. It shows that:
(1) After buoyancy modules are covered, the added mass coefficients on buoyancy modules are much smaller than on the bare pipe. The added mass coefficient on the flexible riser with buoyancy modules has a “sawtooth” distribution along the pipe. The maximum added mass coefficient on the bare pipe is 10.0, and the added mass coefficient on the buoyancy modules even appears negative. This phenomenon may be due to the effect of fluid viscosity when VIV occurs and the outer diameter of the buoyancy module is much larger than that of the bare pipe, which leads to more added water attached to the part closer to the buoyancy module. When the adjacent buoyancy modules are closer and closer, there will be more and more added water. When the bare pipe’s outer diameter is used to calculate the added mass coefficient of the added water, the coefficient will be much larger than that of the bare pipe. The specific reasons can be further analyzed by fine simulation methods such as CFD.
(2) The helical strakes coverage has little effect on the added mass coefficient of the buoyancy modules and the bare pipe section. For the pipe with buoyancy coverage of 25%, the average added mass coefficient in both directions before and after the helical strakes coverage has little change. Before and after the helical strakes are covered, the average added mass coefficients on the bare pipe section in the CF direction are 3.66 and 3.77, respectively, and the average added mass coefficients of the buoyancy module section are −0.33 and −0.26, respectively. For the riser with an uneven buoyancy coverage of 50%, the average added mass coefficient of the densely covered part of buoyancy modules (0–3.005 m) changes from 3.72 to 3.62 after the helical strakes are covered. The average added mass coefficient of the sparsely covered part of buoyancy modules (3.005–7.9 m) remains at 0.02. This phenomenon shows that the added mass coefficient of the helical strakes can be approximated by the coefficient of bare pipe when predicting the VIV of covering buoyancy modules and helical strakes.
According to the above analysis, the added mass coefficient of the buoyancy modules is still much smaller than that of the bare pipe after covering helical strakes and generally presents a “sawtooth” distribution. Further calculation of the total mass at each section of the riser (
Figure 10) shows that the distribution of the total mass (structural mass plus added mass) along the length of the pipe of the buoyancy modules and bare pipe after covering helical strakes is similar to the riser without strakes, showing an overall continuous distribution, and the total mass varies less in the half-wavelength except near the displacement stagnation point. For the pipe with buoyancy coverage of 25%, helical strakes coverage has little effect on the total mass in the CF direction. The average total mass in the CF direction with and without helical strakes is 5.15 kg/m and 5.27 kg/m, respectively. For the pipe with uneven buoyancy coverage of 50%, the average total mass changes do not change much, 5.84 kg/m and 5.42 kg/m with and without helical strakes, respectively.
In general, the helical strakes coverage has little effect on the added mass coefficient of the riser with buoyancy modules at the same flow rate. Moreover, it can be seen that although riser displacement response decreases with the helical strakes coverage, the total mass and added mass coefficient of the riser change little. This phenomenon indicates that the riser displacement response of VIV has little effect on its added mass coefficient, which is consistent with the results of the rigid cylindrical forced oscillation test [
1,
2].
4.3. Excitation Force Coefficient Characteristics
The excitation coefficient and the RMS values of displacement of the riser model in the CF direction at the velocity of 1.6 m/s were obtained by using the vortex-induced force coefficient identification method, as shown in
Figure 11.
Figure 11a,b show the distribution of the excitation coefficient and the RMS value of displacement of the pipe model in the CF direction before and after the installation of helical strakes with 25% coverage of the buoyancy modules. It can be seen that after adding helical strakes, the distribution of the excitation coefficient in the CF direction along pipe length is essentially the same as that without helical strakes, and it only changes from the positive excitation region to the damping region near the ends. However, the excitation force coefficients in the CF direction are reduced after covering helical strakes, and the variation range of the excitation coefficients is reduced from [−0.25, 0.23] to [−0.039, 0.035]. The main reason for this change may be that the vortex-shedding frequency of buoyancy modules increases after covering helical strakes, resulting in a change in its corresponding reduced velocity, which is around 6. In the force coefficient library obtained from the forced oscillation of the previous rigid cylinder [
1], it can be seen that in the reduced velocity excitation range (5 to 8), the change in the reduced velocity has a great impact on the VIV force coefficient; especially near the reduced velocity of 6, the coefficient changes greatly.
Figure 11c,d show the distribution of the excitation coefficient and the RMS value of displacement of the pipe model in the CF direction before and after the installation of helical strakes with 50% coverage of the buoyancy modules. When buoyancy modules are 50% non-uniformly covered, the buoyancy modules are densely covered near the left side (from 0 m to 3.005 m). It can be seen from the figure that the excitation coefficients of this section are all positive without helical strakes, which is in the excitation area. Moreover, due to the effect of buoyancy modules, the bare pipe section in the CF direction which is close to part of the densely covered section (
Figure 11c) is also in the excitation area. After adding helical strakes, the excitation area on the riser decreases and the damping area increases, and the main changes occur in the densely arranged section of buoyancy modules and the adjacent bare pipe with helical strakes (the black solid line frame in
Figure 11c). The excitation coefficient of the part covered by the buoyancy module in this pipe section decreases, and the excitation coefficient of the bare pipe with helical strakes (the dotted line box in
Figure 11c) changes from positive excitation to negative excitation. This change is mainly due to the installation of helical strakes in the bare pipe, which weakens the vortex strength and even causes no symmetrical and stable vortices to be generated in the wake field, and the fluid acts as a damping effect on the riser. As shown in
Figure 11c,d, in the sparsely arranged section of buoyancy modules, compared with the excitation coefficient of the bare pipe without helical strakes, the negative excitation coefficient on the riser with helical strakes is further increased, indicating that the installation of strakes intensifies the damping effect of the fluid.
4.4. Energy Transfer Characteristics
Figure 12 and
Figure 13 show the distribution of vortex-shedding energy along the length of the pipe in the unit period of each section of the four riser forms F01, F02, F03 and F4 and the distribution of the sum of the vortex-shedding energy of the entire pipe at each frequency, where the latter is the sum of the vortex-shedding energy in the unit period at each section of the riser at each frequency multiplied by the length of the unit.
As can be seen from
Figure 12 and
Figure 13, for the pipe model (F01 and F02) with uniform buoyancy coverage of 25%, the amplitude of the vortex-shedding energy at each section of the pipe in the CF direction is greatly reduced after installing helical strakes, and the energy change range is reduced from −0.4 to 0.45 to −0.002 to 0.0035; for the pipe model (F04 and F05) with uniform buoyancy coverage of 50%, the vortex-shedding energy applied to each section of the pipe in the CF direction after installing helical strakes is in an order of magnitude. It can be seen from
Figure 12 and
Figure 13 that for the pipe model (F01 and F02) with uniform buoyancy coverage of 25%, the total vortex-shedding energy in the CF direction at the vortex-shedding frequency of buoyancy modules is essentially the same before and after the installation of helical strakes, which is consistent with the phenomenon that the VIV amplitudes of the two pipe models F01 and F02 are relatively close to each other at the vortex-shedding frequency of the buoyancy modules shown in
Figure 10a. For the pipe model (F03 and F04) with uniform buoyancy coverage of 50%, the total vortex-shedding energy at the vortex-shedding frequency of buoyancy modules is reduced after covering helical strakes, which is consistent with the decrease in the amplitude of the VIV at the vortex-shedding frequency of the buoyancy modules after covering helical strakes as shown in
Figure 10b. This shows that for a flexible riser, the amplitude of the VIV depends on the sum of the total vortex-shedding energy on the entire pipe, and the VIV excitation coefficient at each cross-section does not directly reflect the magnitude of the VIV amplitude.
In addition, it can be seen from the figure that the total vortex-shedding energy at the vortex-shedding frequency of the bare pipe is completely suppressed, which indicates that the reduction in the amplitude of the VIV response of the flexible riser with buoyancy modules after covering helical strakes (as shown in
Figure 9) is mainly due to the suppression of the VIV excitation of the bare pipe section.
5. Model Test Uncertainty Analysis
In order to analyze the uncertainty of the model test system, the sensors’ measurement accuracy was discussed first. Then, repeated tests of pipes with buoyancy modules and strakes were carried out to illustrate the stability of the test device system.
- (1)
Sensor measurement accuracy
In this experiment, fiber grating strain sensors and a force transducer were used to measure the vortex-induced vibration strain and forces at the end of pipe models. Among them, the measurement resolution of the fiber grating strain sensor is +/− 1με (micro-strain), which is about 0.5% of VIV strains; the resolution of the force transducer is +/− 0.5% of the measuring range. Both of the two sensors have satisfactory measurement accuracy.
- (2)
Repeated test result
To illustrate the stability of the test device system, we carried out repeated tests for randomly selected test cases.
Figure 14 presents the RMS value of VIV displacements for the F01 pipe model under a flow velocity of 2.0 m/s. As can be seen from the figure, the three test results are very close, within 5% differences. This shows that the repeatability of the test results is very high and the test system has very good stability.
In general, the uncertainty of this test system is small and within the acceptable range.


