Abstract
Experimental microdosimetry along with the microdosimetric kinetic (MK) model can be utilized to predict the biological effects of ions. To predict the relative biological effectiveness (RBE) of ions and the survival fraction (SF) of human salivary gland tumour (HSGc-C5) cells, microdosimetric quantities measured by a silicon-on-insulator (SOI) MicroPlus-mushroom microdosimeter along the spread-out Bragg peak (SOBP) delivered by pencil beam scanning of 4He, 12C, 16O, and 20Ne ions were used. The MK model parameters of HSGc-C5 cells were obtained from the best fit of the calculated SF for the different linear energy transfer (LET) of these ions and the formerly reported in vitro SF for the same LET and ions used for calculations. For a cube-shaped target of 10 × 10 × 6 cm3, treatment plans for 4He, 12C, 16O, and 20Ne ions were produced with proprietary treatment planning software (TPS) aiming for 10% SF of HSGc-C5 cells over the target volume and were delivered to a polymethyl methacrylate (PMMA) phantom. Afterwards, the saturation-corrected dose-mean lineal energy derived based on the measured microdosimetry spectra, along with the physical dose at various depths in PMMA phantoms, was used for the estimation of the SF, RBE, and RBE-weighted dose using the MK model. The predicted SF, RBE, and the RBE-weighted dose agreed with what was planned by the TPS within 3% at most depths for these ions.
1. Introduction
The use of ion beams to treat tumours is steadily increasing worldwide because of the unique physical characteristics of the beams, such as their depth–dose distribution, the so-called Bragg peak (BP), and their sharp lateral dose falloff. The physical properties of ion beams have been exploited in depth to deliver sufficient doses to tumours and to reduce doses to organs at risk [,,,,]. Meanwhile, in ion beam therapy, the biological effects of the beams, besides their physical properties, have to be considered, as the biological effects of ion beams vary with depth along the BP or spread-out Bragg peak (SOBP). In order to accurately estimate the biological effect of ion beams, reliable biological models have been developed, and the mixed beam model (i.e., the Kanai model), local effect model, and microdosimetric kinetic (MK) model have been introduced and used in clinical practice [,,,,].
The National Institute for Quantum and Radiological Science and Technology (QST) has recently announced a research project called the Quantum Scalpel to reduce the cost and size of heavy ion beam therapy systems as well as to improve clinical results for radioresistant tumours []. Multi-ion therapy is one of the main projects expected to achieve favourable treatment outcomes by optimizing the linear energy transfer (LET) distribution in addition to dose distribution using 4He-, 12C-, 16O-, and 20Ne-ion beams. Recent publications have confirmed the concept of multi-ion therapy through in silico studies and cell irradiation experiments [,,,]. Inaniwa et al. [] proved that the biological model developed for multi-ion therapy reproduced the survival fractions (SFs) of the human salivary gland tumour (HSGc-C5) and human pancreatic cancer cells exposed to these ions.
In ion beam therapy, one important issue is the prediction of biological effects by physical measurements. In particular, a silicon-on-insulator (SOI) microdosimeter and a MicroPlus probe developed at the Centre for Medical Radiation Physics (CMRP), University of Wollongong, would be useful for such measurements in conjunction with a dedicated biophysical model, i.e., the MK model. The SOI microdosimeter consists of an array of 3D micrometer-sized cylindrical silicon sensitive volumes (SVs) to imitate the sizes of cells [,]. The SOI microdosimeter measures the stochastic energy deposited for the primary or secondary charged particle in SVs [,], which enables the biological responses of ion beams to be estimated. This microdosimeter has been demonstrated to precisely measure the lineal energy spectra of passively scattered and scanned proton, carbon, nitrogen, and oxygen ions in [,] and [], respectively. In our previous work, we demonstrated that the biological effects of pancreatic cancer cells calculated by treatment planning software (TPS) can be well reproduced from the measured microdosimetric lineal energy spectra in conjunction with the MK model [].
In this study, as part of the initial phase of the Quantum Scalpel project, the SF, relative biological effectiveness (RBE), and RBE-weighted dose of HSGc-C5 cells irradiated independently in the SOBPs of 4He-, 12C-, 16O-, and 20Ne-ion scanning beams were predicted based on the measurements of microdosimetric spectra with the SOI MicroPlus-mushroom microdosimeter in conjunction with the MK model. This study demonstrated that the SOI MicroPlus-mushroom microdosimeter can be used to validate the biological effect across the target volume exposed independently to these beams calculated by the TPS.
2. Materials and Methods
2.1. MK Model Approach for Biological Effect Prediction
In the MK model approach [,,], employing the formalism as presented in previous work, e.g., [], we can predict the SF based on the linear-quadratic (LQ) model:
where S is the SF; α and β are the parameters of the LQ model; D is the measurable physical dose; is the beginning slope of the survival curve when LET = 0; rd and are the radius and density of the domain; is the dose-mean lineal energy defined by , where d(y) is the probability density of the absorbed dose with regard to lineal energy y. In order for the MK model to represent the saturation effect on the cell survival, Kase et al. [] suggested the saturation-corrected dose-mean lineal energy y*:
where f(y), y0, and Rn are the probability density of the y, saturation parameter, and radius of the cell nucleus, respectively. As discussed in Section 4, or y* is dependent on the size of the measured site. However, at a tissue-equivalent diameter ranging within 0.1–6 μm, the difference in y* was almost within the systematic and stochastic errors as discussed by Kase et al. [].
Applying the predicted SF based on Equations (1) and (3)–(5), we can calculate the RBE-weighted dose, namely, biological dose DBio, as []:
where αX = 0.252 Gy−1 and βX = 0.0474 Gy−2 are the LQ model parameters for the HSGc-C5 cells determined by 200 kVp X-ray exposure (published by []), which were adopted in the RBE calculation in this study. The RBE was then calculated as RBE = DBio⁄D.
2.2. Microdosimetry Spectra Measurements Utilizing the SOI MicroPlus-Mushroom Microdosimeter
An SOI MicroPlus-mushroom microdosimeter built upon a 3D cylindrical micron-sized SV array introduced by CMRP, University of Wollongong, Australia, was utilized in order to measure the microdosimetric lineal energy spectra [,,,]. The 3D mushroom microdosimeter had an array of 400 cylindrical SVs, and each had a diameter of 18 μm and a thickness of 10 μm. The SVs were connected in a matrix 20 × 20 SVs. All of them were connected via Al tracks as shown in Figure 1 of []. One track was connected to all n+ cores, and another track was connected to all p+ trenches. The 3D mushroom microdosimeter was plugged into a low-noise front-end device (also called the MicroPlus probe) developed at the CMRP, the output of which was fed to a shaping amplifier along with a shaping time of 1 μs []. Authors were not aimed for 2D spatial resolution in this research. All 400 cylindrical SVs were connected in parallel and fed to the input of a charge-sensitive preamplifier. The total data acquisition system included a MicroPlus probe with a shaper and an Amptek MCA 8000D multichannel analyser (MCA) connected to a laptop for MCA spectra visualization. For the conversion of MCA spectra to microdosimetry quantities, a software developed at CMRP was used. The low-level discriminator (LLD) of MCA was set to avoid any electromagnetic noise originating from the scanning magnet and robotic couch, which corresponded to an LLD of about ~50 keV (Si) for low gain and ~15 keV (Si) for medium gain. The experimental set up can be seen in Figure 1.
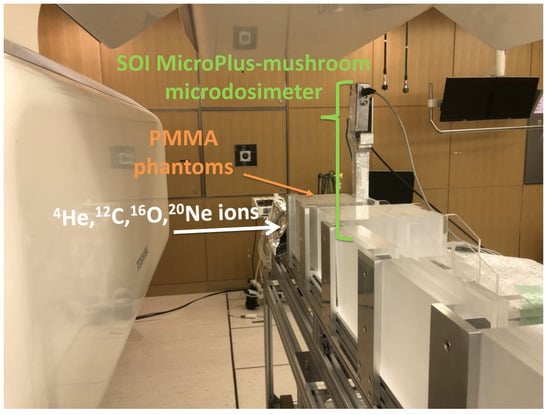
Figure 1.
Photo of the experimental set-up with the SOI MicroPlus-mushroom microdosimeter positioned vertically behind PMMA phantoms in the horizontal scanning-beam port at NIRS-HIMAC.
The lineal energy y was calculated based on the deposited energy ϵ using the following relationship: , where is the mean path length of an SV that is 10 μm []. Energy calibration for converting channel values to lineal energies was performed by irradiating the SOI MicroPlus-mushroom microdosimeter located behind a 10 mm thick polymethyl methacrylate (PMMA) phantom with a normally incident 170.5 MeV/u 4He-, 12C-, 16O-, and 20Ne-ion beams. The channel number corresponding to the centre of mass of the MCA peak was prescribed with energy deposited in the SV calculated by the Geant4-based Monte Carlo code [] under the same experimental conditions. Details of the Geant4-based Monte Carlo simulation are given in Section 2.3. The same procedure was carried out for both medium and low gains on the shaping amplifier and led to the linear regression line energy vs. the channel number used to build microdosimetry spectra. A scaling factor of 0.58 was then applied for conversion of the silicon microdosimetric spectra to tissue [,]. As the stopping power ratio varies over the therapeutic energy range, an uncertainty of ~1% exists relating to a scaling factor of 0.58 [,].
2.3. Monte Carlo Simulation in Geant4 for Energy Calibration
The geometries of the horizontal port reported in Figure 1 of [], including the vacuum pipe, main and sub dose monitors, position monitor, ripple filter, range shifter, and port cover, were reproduced in Geant4. The code was implemented to enable beam irradiation in Geant4 while reading the csv format of the irradiation information file line by line: the spot weight, the beam position at the position monitor, and the beam energy. Version 10.03 of Geant4 with patch 3 was utilized []. The physics lists implemented were G4EmStandardPhysics_option4, G4HadronElasticPhyics, G4RadioactiveDecayPhyics, G4 IonQMDPhysics, G4StopingPhyics, G4HadronPhysicsFTF_BIC, and G4DecayPhyics. Four hundred silicon cylinders of the size mentioned in Section 2.2 were placed behind a 10 mm PMMA slab in Geant4. The energy deposit, particle name, atomic number, and LET information were scored via a user-defined class when ions deposited energy in the silicon. In order for the particles to be accurately scored in silicon, the regionCutValue was set to 1 μm when the particle entered into the PMMA. As in the experiment mentioned in Section 2.2, 170.5 MeV/u 4He-, 12C-, 16O-, and 20Ne-ion beams were, respectively, irradiated. Figure A1 shows a typical example of the energy deposited to silicon by Geant4 and by the experiment when the PMMA phantom was irradiated with 170.5 MeV/u 12C ions. Backscattering contributions were not considered in the simulation separately. From the energy spectrum obtained from Geant4 and the experiment, the energy and channel information of the peak portions of each helium, carbon, oxygen, and neon ion were obtained through Gaussian fitting. Hence, energy calibration curves were obtained for low and medium gain, respectively (Figure A2).
2.4. MK Model Parameters for Human Salivary Gland Tumor Cells
For the determination of the MK model parameters for the HSGc-C5 cells, we used the microdosimetric spectra measured along the pristine BPs of 4He-, 12C-, 16O-, and 20Ne-ion beams, each with energies of 166, 313, 374, and 430 MeV/u, respectively, in conjunction with the measured SFs of the HSGc-C5 cells for the same ions with different LETs []. For the microdosimetric spectra measurements, these ion beams were normally incident to PMMA slabs to form a 10 × 10 cm irradiation field at a horizontal beam port of the HIMAC []. The SOI MicroPlus-mushroom microdosimeter was placed at the centre of the irradiation field behind PMMA phantoms of different thicknesses at which the SF of the cells was measured (Figure 1). The saturation-corrected dose-mean lineal energy y* values at each depth were calculated based on the measured microdosimetric spectra using Equation (4). Furthermore, absorbed doses of the ion beams behind PMMA slabs at which the cells were placed were measured using an Advanced Markus ionization chamber (IC) (34045, PTW Freiburg, Germany). Afterwards, the MK model parameters, α0, Rn, and rd, assuming β is constant and equal to βX = 0.0474 Gy−2 for the HSGc-C5 cells following the approach by [], were found by minimizing the variance between Scell and Sy* in Equation (7), where Scell is the measured SFs of the HSGc-C5 cells, and Sy* is the predicted SFs using obtained y* and Equations (1) and (3) at the corresponding depths in a PMMA phantom with the same LETs.
2.5. SOBP Beam Irradiation
A treatment plan for a cube-shaped target of 10 × 10 × 6 cm3 using scanning 4He-, 12C-, 16O-, and 20Ne-ion beams was made using proprietary TPS to attain a 10% SF for HSGc-C5 cells over the target. The method for calculating the biological effects by the TPS was well described by Inaniwa et al. []. It has been demonstrated that the planned SFs are in good agreement with the measured SFs of these ion beams []. The identical SOBP fields of the ion beams were delivered to the PMMA phantoms in a horizontal beam line of the HIMAC [,]. The minimum beam intensities of roughly 2 × 10⁷, 7 × 10⁶, 3 × 10⁶, and 2 × 10⁶ particles per second and per cm2 for 4He, 12C, 16O, and 20Ne ions, respectively, were fine-tuned to prevent pile-up effects in the microdosimeter []. The physical doses and microdosimetric lineal energy spectra were measured along the SOBPs of the ion beams at various depths in the PMMA phantoms. The SF, RBE, and RBE-weighted dose at each depth in the SOBP were predicted using the MK model with the model parameters determined as outlined in Section 2.4.
3. Results
Figure 2 displays the SFs of HSGc-C5 cells for different LETs (reported in []), as well as the survival curves calculated according to the MK model and using Equations (1) and (3) with determined MK model parameters for HSGc-C5 cells (α0 = 0.07 Gy−1, β = 0.0474 Gy−2, Rn = 6.6 μm, rd = 0.43 μm, and y0 = 255 keV/μm) and y* as described in Section 2.4.
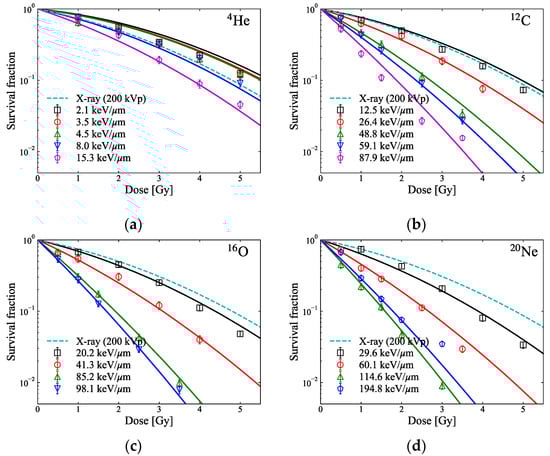
Figure 2.
In vitro survival fraction (markers) for HSGc-C5 cells for different LETs of pristine (a) 4He-, (b) 12C-, (c) 16O-, and (d) 20Ne-ion beams (reported in []) and the survival curves (solid lines) predicted by the measured dose and y* with the MK model parameters: α0 = 0.07 Gy−1, β = 0.0474 Gy−2, Rn = 6.6 μm, rd = 0.43 μm, and y0 = 255 keV/μm. The survival curves of HSGc-C5 cells from the 200 kVp X-ray exposure (reported by []) calculated by the LQ model (αX = 0.252 Gy−1, βX = 0.0474 Gy−2) are indicated by broken lines, respectively. The smallest values of the variance for 4He-, 12C-, 16O-, and 20Ne-ion beams calculated using Equation (7) are 0.16, 0.18, 0.05, and 0.16, respectively.
Figure 3a–d show the measured microdosimetric spectra across the SOBP of the ion beams at various depths in PMMA phantoms. Figure 4 shows the measured dose and the calculated and y* from the microdosimetric spectra along the SOBP of the ion beams measured in Figure 3.
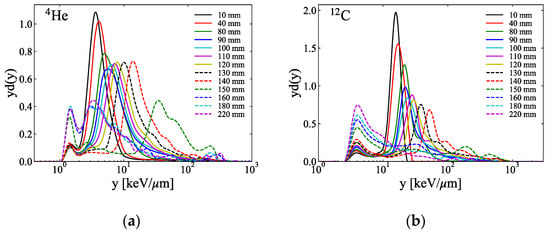
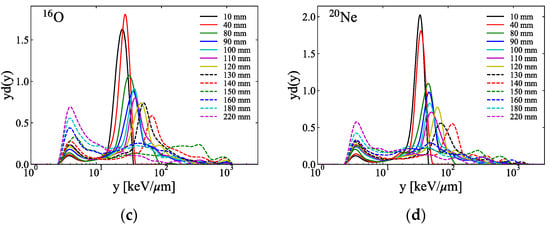
Figure 3.
Typical microdosimetric lineal energy spectra measured utilizing the SOI MicroPlus-mushroom microdosimeter at several depth levels in the PMMA phantoms of the SOBP of the (a) 4He-, (b) 12C-, (c) 16O-, and (d) 20Ne-ion beams (the y on the horizontal axis in each figure is the value in the tissue calculated using the conversion factor of 0.58 between the tissue and silicon [,]).
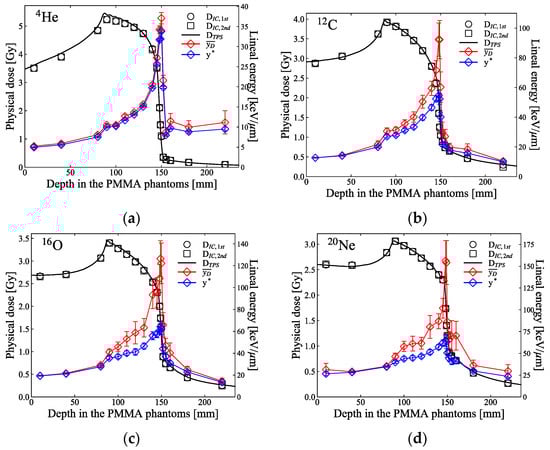
Figure 4.
Physical dose, , measured using the IC, and and y* calculated based on the microdosimetric lineal energy spectra displayed in Figure 3 at several depth levels in the PMMA phantoms along the SOBP of the (a) 4He-, (b) 12C-, (c) 16O-, and (d) 20Ne-ion beams. The physical dose was measured twice . The black solid lines are the physical doses planned by the TPS. Each error bar corresponds to the uncertainties of the linear energies evaluated using error propagation from the measured spectrum.
The black square markers in Figure 5 show the predicted SF for the HSGc-C5 cells, which were irradiated at various depth levels in PMMA phantoms across the SOBP of the ion beams. The SF values were calculated using the measured dose and y* presented in Figure 4. Apart from the plateau region and the distal part of the target region of 4He ions, the SFs predicted by the measured doses and the microdosimetric lineal energy spectra were consistent with the SFs predicted by the TPS. The averaged SFs over the SOBP region were 10.4 ± 1.4, 10.3 ± 1.4, 10.4 ± 0.8, and 10.5 ± 0.5% for the 4He-, 12C-, 16O-, and 20Ne-ion beams, respectively. The blue markers in Figure 5 indicate the predicted RBE at the same depth levels of the SOBP. The RBEs estimated at the middle of the target region (at 120 mm) were 0.98, 1.39, 1.58, and 1.71 for these ion beams, respectively. Except for the tail regions, the RBEs were very well aligned with the values planned by the TPS. Figure 6 shows the RBE-weighted dose planned by the TPS and the predicted biological dose from the measurements utilizing the SOI MicroPlus-mushroom microdosimeter toward these ion beams. Apart from the beginning distal part of the 4He-ion beam, the differences among the planned and the predicted biological doses were less than 3% across the target region. For the helium ion in Figure 6a, the biological dose is lower or close to the physical dose at a depth in a phantom almost until the middle of the SOBP, and this can be explained by Figure 2a, by comparing the SFs of helium ions and those of 200-kVp-X-ray beams, where helium ions with an LET of 4.5 keV/μm showed a higher SF than the X-rays.
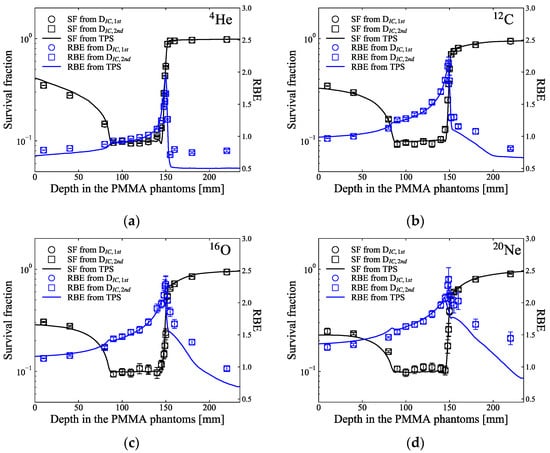
Figure 5.
The black markers indicate the predicted SF of HSGc-C5 cells along the SOBP of (a) 4He-, (b) 12C-, (c) 16O-, and (d) 20Ne-ion beams. Blue markers indicate the estimated RBE of the HSGc-C5 cells along the SOBP. The black and blue solid lines present the planned survival fraction and RBE, respectively. Each error bar corresponds to the uncertainties of the SF and RBE evaluated from the error in lineal energy using error propagation.
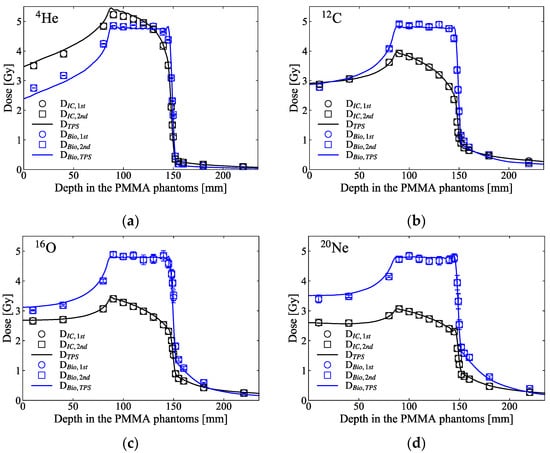
Figure 6.
The blue markers show the biological dose along the SOBP of (a) 4He-, (b) 12C-, (c) 16O-, and (d) 20Ne-ion beams, calculated by means of multiplication of the physical doses and the RBE presented in Figure 5. The black square markers are the measured dose presented in Figure 4. The black and blue solid lines indicate the planned physical and biological doses calculated by the TPS. Each error bar corresponds to the uncertainties of the biological dose evaluated from the error of lineal energy using error propagation.
4. Discussion
In this study, we demonstrated that the radiobiological effect of scanned 4He-, 12C-, 16O-, and 20Ne-ion beams in HSGc-C5 cells can be predicted based on the measured microdosimetric lineal energy spectra based on the MK model. The MK model parameters for HSG cells proposed by Kase et al. [], α0 = 0.13 Gy−1, β = 0.05 Gy−2, and Rn = 4.1 μm, have been known to estimate well the biological effects for HSG cells [,,,]. For the HSGc-C5 cells supplied from the same source, we obtained the MK parameters, which best predict the SF values for monoenergetic ion beams with different LETs. The Rn = 6.6 μm we determined is quite plausible, because the radius distribution of 390 HSG cells measured using a fluoro-microscope showed a Gaussian distribution ranging from 4.6 to 8.6 μm when cells were lightly sown []. However, the α0 = 0.07 Gy−1 we determined differs from α0 = 0.13 Gy−1 predicted by Kase et al. []. Inaniwa et al. [] mentioned that the radiosensitivity of HSGc-C5 cells might change from that of the HSG cells over time. That is, the αx for X-ray irradiation of HSG cells reported by Furusawa et al. [] was 0.331 Gy−1, but the αx for X-ray irradiation reported by Inaniwa et al. [] and used here was 0.252 Gy−1, which reflected an increased radioresistance to the X-rays. For this reason, α0 determined here is also considered to be smaller than α0 as described by [].
The MK model utilizes a constant β value regardless of the LET of the ions. It is known that the β value typically converges to 0 as the LET increases to a certain level, which depends on the type of cell line investigated and the ions utilized []. At a high LET, even if the predicted α value from the MK model agrees well with the fitted α value from in vitro cell data based upon the LQ model, the constant β value derived from the MK model will be greater than the β value derived from the LQ model, such that the MK model may be underestimating the SF at high LET as the dose per fraction is increased. Our previous study showed how much the survival curve predicted by the MK model for late-responding cells differed from the survival curve (in vitro cell data) fitted with α and β set as free parameters []. Meanwhile, HSGc-C5 cells used in this study have different radiation sensitivities, as they are early responding cells with a large α and small β for X-rays []. In this case, the accuracy of SF prediction due to the constant β in the MK model will be higher than in the case of late-responding cells. In particular, up to the 10% survival level as shown in Figure 7, there was no significant difference between the survival curves from the constant β compared to the survival curve fitted with α and β set as free parameters. Kase et al. [] mentioned that a change in β value might be required for higher doses when SF is less than 1%.
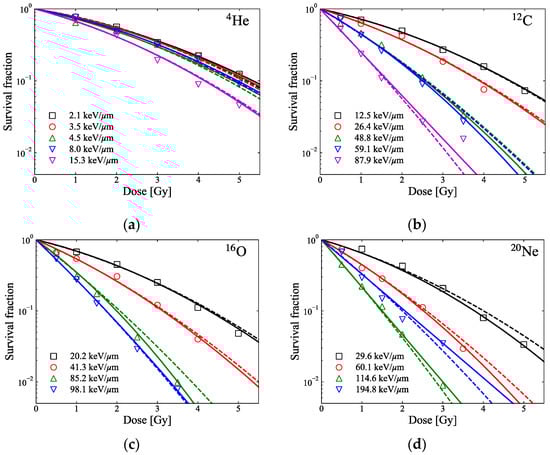
Figure 7.
Markers show reported in vitro SF of HSGc-C5 cells for different LETs of pristine (a) 4He-, (b) 12C-, (c) 16O-, and (d) 20Ne-ion beams []. The lines represent the fitted survival curves based on the LQ model (solid lines: curves fitted with α and β set as free parameters; broken lines: curves fitted with α set as a free parameter and the constant β = 0.0474 Gy−2).
It should be mentioned that MK model parameters for HSGc-C5 cells determined in this study are somewhat different from those of Inaniwa et al. [] for two reasons. First, the sensitive volume of the SOI MicroPlus-mushroom microdosimeter (a thickness of 10 μm and a diameter of 18 μm) is approximately the size of cell nucleus (~10 μm). The sensitive volume size of microdosimeter is higher than the domain size, which leads to different stochastic energy deposition spectra determined by the amorphous track structure model with an rd of 0.34 μm [], but a less affecting difference in lineal energy spectra, as calculated by TPS and measured by SOI MicroPlus-mushroom microdosimeter, and the corresponding values of y*. Second, the model used in the TPS predicting biological response is the stochastic MK (SMK) model [,,], which is an updated version of the MK model. The SMK model has been introduced because the MK model overestimates the biological effect at a high LET and a high dose. Although the biological effects at a relatively high LET or relatively high doses are not evaluated in this study (compared to Figure 3 in []), it can be seen that the MK model overestimates the biological effects at LET = 194.8 keV/μm in 20Ne ions in Figure 2d. Meanwhile, a solid-state detector that can measure the specific energy experimentally using the method of the SMK model has not yet been developed. The SMK model takes into account that a cell nucleus specific energy, zn, can be stochastically different while the MK model considers that zn is the same. The SMK model might benefit from having solid state microdosimeters with many independent mushrooms and ~0.5 μm domains inside of each mushroom and measuring zn independently in both the domain and the mushroom [].
We found that the RBE values predicted based on the measured dose and the microdosimetric lineal energy spectra are consistent with the values planned by the TPS except for the fragmentation tail regions (Figure 5). One of the probable reasons for the RBE inconsistency downstream of the SOBP is the setting of the low energy threshold value of the SOI detector used. The SOI MicroPlus-mushroom microdosimeter we used is suitable for measuring a lineal energy y higher than ~1 keV/μm for 4He ions (using medium gain) and ~2.2 keV/μm for 12C, 16O, and 20Ne ions (using low gain). In the fragmentation tail regions with many low LET particles below the energy threshold (see Figure 3), the measured y* values could be higher than the actual values. To overcome the single gain measurements with the SOI-based microdosimeter, Conte et al. [] introduced an extrapolation approach that can lower the energy threshold by linearly extrapolating the measured spectrum up to ~0.01 keV/μm. This extrapolation approach could be one possible solution and may yield better results, but their approach was not adopted in this study. In our Monte Carlo simulation, the deposited energy of the entire electrons absorbed in the cylindrical volume used in the measurement was calculated to be approximately ~20 keV (Si) (see Figure A1a). As mentioned in Section 2.2, since the LLD in our system is ~50 keV (Si) at low gain and ~15 keV (Si) at medium gain, the electron has no effect on the measurement result in 12C, 16O, and 20Ne ions, but there may be little effect in 4He ions.
One of the drawbacks of this study is that this study did not evaluate the effect of the size of the sensitive volume of the SOI microdosimeter. Different sizes of detectors result in different measured energies. Kase et al. [] showed that there was no significant difference in derived y* across carbon ion SOBP in their study using a spherically walled tissue-equivalent proportional counter (TEPC) with tissue-equivalent diameters ranging from 0.1 to 6 μm. The rd of 0.42 μm using a TEPC with a tissue-equivalent diameter of 1 μm obtained in their study matched well to the rd of 0.43 μm derived in our study, while the cylindrical SV of the SOI MicroPlus-mushroom microdosimeter was 18 μm in diameter and 10 μm thick. This supports the fact that the lineal energy spectra and derived match well to the obtained from measurements with the TEPC for the studied ions and their energies. This study justified the application of an SOI MicroPlus-mushroom microdosimeter for the verification of TPS based on the MK model.
5. Conclusions
We determined the MK model parameters α0, Rn, and rd by minimizing the variance between the reported in vitro SFs of HSGc-C5 cells exposed to monoenergetic 4He-, 12C-, 16O-, and 20Ne-ion beams and the calculated SF values based on the measured microdosimetric lineal energy spectra of these ion beams, when the β value obtained from 200 kVp X-rays SF studies was adopted. For the SOBP of 4He-, 12C-, 16O-, and 20Ne-ion scanning beams, planned by the TPS to attain a 10% SF of the HSGc-C5 cells over the target, the microdosimetric spectra were measured along the SOBP utilizing the SOI MicroPlus-mushroom microdosimeter. The SF of HSGc-C5 cells exposed to each SOBP of the beam was able to be estimated based on the measured doses and microdosimetric lineal energy spectra. Our result proved that the SOI MicroPlus-mushroom microdosimeter is capable of predicting the biological response of HSGc-C5 cells for each ion beam in conjunction with the y*-based MK model and can be used for RBE-related beam quality assurance in multi-ion therapy.
Author Contributions
Conceptualization, T.I.; methodology, T.I.; software, L.T.T., A.B.R., V.P. and T.I.; validation, S.H.L., K.M., S.Y., T.I. and M.S.; formal analysis, H.M., T.N., S.M. and R.K.; investigation, S.H.L. and T.I.; resources, M.S., A.K. and M.P.; data curation, A.B.R. and T.I.; writing—original draft preparation, S.H.L.; writing—review and editing, L.T.T., A.B.R. and T.I.; visualization, S.H.L.; supervision, T.I.; project administration, T.I., Y.I. and T.S.; funding acquisition, T.S. All authors have read and agreed to the published version of the manuscript.
Funding
This work was partially supported by JSPS KAKENHI, Grant Number JP20K16776.
Institutional Review Board Statement
Not applicable.
Informed Consent Statement
Not applicable.
Data Availability Statement
Not applicable.
Acknowledgments
We would like to thank the Accelerator Engineering Corporation for operating the HIMAC accelerator proficiently and for their passionate support. We thank the Australian Research Council (ARC) for the assistance of this project with a Discovery Project Grant “Development of radiation detectors to better understand ion interactions” (DP 170102273).
Conflicts of Interest
The authors declare no conflict of interest.
Appendix A

Figure A1.
(a) Geant4-simulated spectrum of energy deposition in a silicon cylinder 18 μm in diameter and 10 μm thick located behind 10 mm PMMA and irradiated with a 170.5 MeV/u 12C-ion beam (contribution from a direct C ion beam and from fragments with mass atomic number 1 to 10 are colour coded). (b) Gaussian fitting (red line) of the carbon peak in a spectrum in (a). (c) Energy-deposited spectrum from a 12C-ion beam of the same energy measured by the SOI MicroPlus-mushroom microdosimeter with low gain settings when located behind 10 mm PMMA (Gaussian fitting (red line) of the carbon portion is shown.).

Figure A2.
Energy calibration curves of (a) low gain and (b) medium gain. Standard deviation representing Gaussian fitting errors are included. Note that, at low gain, only ions other than 4He ions are shown because 4He ions with an energy of 170.5 MeV/u are not measurable at low gain for the LLD setting used.
References
- Lyman, J.T.; Howard, J. Biological research facilities and dosimetry. In Biological and Medical Research with Accelerated Heavy Ions at the BEVALAC, 1974–1977; LBL Report 5610; Elam, S., Ed.; Lawrence Berkley Laboratory, University of California: Los Angeles, CA, USA, 1977; pp. 26–35. [Google Scholar]
- Blakely, E.A.; Tobias, C.A.; Ngo, F.Q.H.; Curtis, S.B. Physical and cellular radiobiological properties of heavy ions in relation to cancer therapy applications. In Biological and Medical Research with Accelerated Heavy Ions at the BEVALAC, 1977–1980; LBL report 11220; Pirruccello, M.C., Tobias, C.A., Eds.; Lawrence Berkley Laboratory: Berkeley, CA, USA; University of California: Los Angeles, CA, USA, 1980; pp. 73–86. [Google Scholar]
- Kanai, T.; Furusawa, Y.; Fukutsu, K.; Itsukaichi, H.; Eguchi-Kasai, K.; Ohara, H. Irradiation of mixed beam and design of spread-out Bragg peak for heavy-ion radiotherapy. Radiat. Res. 1997, 147, 78–85. [Google Scholar] [CrossRef] [PubMed]
- Krämer, M.; Jäkel, O.; Haberer, T.; Kraft, G.; Schardt, D.; Weber, U. Treatment planning for heavy-ion radiotherapy: Physical beam model and dose optimization. Phys. Med. Biol. 2000, 45, 3299–3317. [Google Scholar] [CrossRef] [PubMed]
- Furukawa, T.; Inaniwa, T.; Sato, S.; Shirai, T.; Takei, Y.; Takeshita, E.; Mizushima, K.; Iwata, Y.; Himukai, T.; Mori, S.; et al. Performance of the NIRS fast scanning system for heavy-ion radiotherapy. Med. Phys. 2010, 37, 5672–5682. [Google Scholar] [CrossRef] [PubMed]
- Scholz, M.; Kellerer, A.M.; Kraft-Weyrather, W.; Kraft, G. Computation of cell survival in heavy ion beams for therapy—The model and its approximation. Rad. Environ. Biophys. 1997, 36, 59–66. [Google Scholar] [CrossRef]
- Kanai, T.; Endo, M.; Minohara, S.; Miyahara, N.; Koyama-Ito, H. Biophysical characteristics of HIMAC clinical irradiation system for heavy-ion radiation therapy. Int. J. Radiat. Oncol. Biol. Phys. 1999, 44, 201–210. [Google Scholar] [CrossRef]
- Kase, Y.; Kanai, T.; Matsumoto, Y.; Furusawa, Y.; Okamoto, H.; Asaba, T.; Sakama, M.; Shinoda, H. Microdosimetric measurements and estimation of human cell survival for heavy-ion beams. Radiat. Res. 2006, 166, 629–638. [Google Scholar] [CrossRef] [PubMed]
- Inaniwa, T.; Furukawa, T.; Kase, Y.; Matsufuji, N.; Toshito, T.; Matsumoto, Y.; Furusawa, Y.; Noda, K. Treatment planning for a scanned carbon ion beam with a modified microdosimetric kinetic model. Phys. Med. Biol. 2010, 55, 6721–6737. [Google Scholar] [CrossRef] [PubMed]
- Inaniwa, T.; Kanematsu, N.; Matsufuji, N.; Kanai, T.; Shirai, T.; Noda, K.; Tsuji, H.; Kamada, T.; Tsujii, H. Reformulation of a clinical-dose system for carbon-ion radiotherapy treatment planning at the National Institute of Radiological Sciences. Phys. Med. Biol. 2015, 60, 3271–3286. [Google Scholar] [CrossRef]
- Quantum Scalpel Project. Available online: https://www.qst.go.jp/site/innovative-project-english/ (accessed on 13 May 2022).
- Inaniwa, T.; Kanematsu, N.; Noda, K.; Kamada, T. Treatment planning of intensity modulated composite particle therapy with dose and linear energy transfer optimization. Phys. Med. Biol. 2017, 62, 5180–5197. [Google Scholar] [CrossRef]
- Inaniwa, T.; Kanematsu, N. Adaptation of stochastic microdosimetric kinetic model for charged-particle therapy treatment planning. Phys. Med. Biol. 2018, 63, 095011. [Google Scholar] [CrossRef]
- Inaniwa, T.; Lee, S.H.; Mizushima, K.; Sakata, D.; Iwata, Y.; Kanematsu, N.; Shirai, T. Nuclear-interaction correction for patient dose calculations in treatment planning of helium-, carbon-, oxygen-, and neon-ion beams. Phys. Med. Biol. 2020, 65, 025004. [Google Scholar] [CrossRef] [PubMed]
- Inaniwa, T.; Suzuki, M.; Lee, S.H.; Mizushima, K.; Iwata, Y.; Kanematsu, N.; Shirai, T. Experimental validation of stochastic microdosimetric kinetic model for multi-ion therapy treatment planning with helium-, carbon-, oxygen-, and neon-ion beams. Phys. Med. Biol. 2020, 65, 045005. [Google Scholar] [CrossRef] [PubMed]
- Rosenfeld, A.B. Novel detectors for silicon based microdosimetry, their concepts and applications. Nucl. Instrum. Methods Phys. Res. Sect. A 2016, 809, 156–170. [Google Scholar] [CrossRef]
- Tran, L.T.; Chartier, L.; Bolst, D.; Pogossov, A.; Guatelli, S.; Petasecca, M.; Rosenfeld, A.B. Characterization of proton pencil beam scanning and passive beam using a high spatial resolution solid-state microdosimeter. Med. Phys. 2017, 44, 6085–6095. [Google Scholar] [CrossRef]
- Gómez, F.; Fleta, C.; Esteban, S.; Quirion, D.; Pellegrini, G.; Lozano, M.; Prezado, Y.; Santos, M.D.; Guardiola, C.; Montarou, M.; et al. Measurement of carbon ion microdosimetric distributions with ultrathin 3D silicon diodes. Phys. Med. Biol. 2016, 61, 4036–4047. [Google Scholar] [CrossRef]
- Guardiola, C.; Bachiller-Perea, D.; Prieto-Pena, J.; Jiménez-Ramos, M.C.; López, J.G.; Esnault, C.; Fleta, C.; Quirion, D.; Gómez, F. Microdosimetry in low energy proton beam at therapeutic-equivalent fluence rate with silicon 3D-cylindrical microdetectors. Phys. Med. Biol. 2021, 66, 114001. [Google Scholar] [CrossRef]
- Tran, L.T.; Bolst, D.; Guatelli, S.; Biasi, G.; Fazzi, A.; Sagia, E.; Prokopovich, D.A.; Reinhard, M.I.; Keat, Y.C.; Petasecca, M.; et al. High spatial resolution microdosimetry with monolithic Delta E-E detector on C-12 beam: Monte Carlo simulations and experiment. Nucl. Instrum. Methods Phys. Res. Sect. A 2018, 887, 70–80. [Google Scholar] [CrossRef]
- Tran, L.T.; Bolst, D.; Guatelli, S.; Pogossov, A.; Petasecca, M.; Lerch, M.L.F.; Rosenfeld, A.B. The relative biological effectiveness for carbon, nitrogen, and oxygen ion beams using passive and scanning techniques evaluated with fully 3D silicon microdosimeters. Med. Phys. 2018, 45, 2299–2308. [Google Scholar] [CrossRef]
- Lee, S.H.; Mizushima, K.; Kohno, R.; Iwata, Y.; Yonai, S.; Shirai, T.; Pan, V.A.; Bolst, D.; Tran, L.T.; Rosenfeld, A.B.; et al. Estimating the biological effects of helium, carbon, oxygen, and neon ion beams using 3D silicon microdosimeters. Phys. Med. Biol. 2021, 66, 045017. [Google Scholar] [CrossRef]
- Hawkins, R.B. A statistical theory of cell killing by radiation of varying linear energy transfer. Radiat. Res. 1994, 140, 366–374. [Google Scholar] [CrossRef]
- Hawkins, R.B. A microdosimetric-kinetic model of cell death from exposure to ionizing radiation of any LET, with experimental and clinical applications. Int. J. Radiat. Biol. 1996, 69, 739–755. [Google Scholar] [CrossRef] [PubMed]
- Hawkins, R.B. A microdosimetric-kinetic theory of the dependence of the RBE for cell death on LET. Med. Phys. 1998, 25, 1157–1170. [Google Scholar] [CrossRef] [PubMed]
- Tran, L.T.; Chartier, L.; Bolst, D.; Davis, J.; Prokopovich, D.A.; Pogossov, A.; Guatelli, S.; Reinhard, M.I.; Petasecca, M.; Lerch, M.L.; et al. In-field and out-of-file application in 12C ion therapy using fully 3D silicon microdosimeters. Radiat. Meas. 2018, 115, 55–59. [Google Scholar] [CrossRef]
- Peracchi, S.; James, B.; Pagani, F.; Pan, V.; Vohradsky, J.; Bolst, D.; Prokopovich, A.; Guatelli, S.; Petasecca, M.; Lerch, M.L.F.; et al. Radiation Shielding Evaluation of Spacecraft Walls Against Heavy Ions Using Microdosimetry. IEEE Trans. Nucl. Sci. 2020, 68, 897–905. [Google Scholar] [CrossRef]
- Agostinelli, S.; Allison, J.; Amako, K.A.; Apostolakis, J.; Araujo, H.; Arce, P.; Asai, M.; Axen, D.; Banerjee, S.; Barrand, G.J.N.I.; et al. Geant4—A simulation toolkit. Nucl. Instrum. Methods Phys. Res. Sect. A 2003, 506, 250–303. [Google Scholar] [CrossRef]
- Bolst, D.; Guatelli, S.; Tran, L.T.; Rosenfeld, A.B. Optimisation of the design of SOI microdosimeters for hadron therapy quality assurance. Phys. Med. Biol. 2018, 63, 215007. [Google Scholar] [CrossRef] [PubMed]
- Bolst, D.; Guatelli, S.; Tran, L.T.; Chartier, L.; Lerch, M.L.; Matsufuji, N.; Rosenfeld, A.B. Correction factors to convert microdosimetry measurements in silicon to tissue in 12C ion therapy. Phys. Med. Biol. 2017, 62, 2055. [Google Scholar] [CrossRef]
- Bolst, D.; Guatelli, S.; Tran, L.T.; Rosenfeld, A.B. The impact of sensitive volume thickness for silicon on insulator microdosimeters in hadron therapy. Phys. Med. Biol. 2020, 65, 035004. [Google Scholar] [CrossRef]
- Inaniwa, T.; Furukawa, T.; Kanematsu, N.; Mori, S.; Mizushima, K.; Sato, S.; Toshito, T.; Shirai, T.; Noda, K. Evaluation of hybrid depth scanning for carbon-ion radiotherapy. Med. Phys. 2012, 39, 2820–2825. [Google Scholar] [CrossRef]
- Kase, Y.; Himukai, T.; Nagano, A.; Tameshige, Y.; Minohara, S.; Matsufuji, N.; Mizoe, J.; Fossati, P.; Hasegawa, A.; Kanai, T. Preliminary calculation of RBE-weighted dose distribution for cerebral radionecrosis in carbon-ion treatment planning. J. Radiat. Res. 2011, 52, 789–796. [Google Scholar] [CrossRef][Green Version]
- Burigo, L.; Pshenichnov, I.; Mishustin, I.; Bleicher, M. Comparative study of dose distributions and cell survival fractions for 1H, 4He, 12C and 16O beams using Geant4 and Microdosimetric Kinetic model. Phys. Med. Biol. 2015, 60, 3313–3331. [Google Scholar] [CrossRef] [PubMed]
- Furusawa, Y.; Fukutsu, K.; Aoki, M.; Itsukaichi, H.; Eguchi-Kasai, K.; Ohara, H.; Yatagai, F.; Kanai, T.; Ando, K. Inactivation of aerobic and hypoxic cells from three different cell lines by accelerated 3He-, 12C- and 20Ne-ion beams. Radiat. Res. 2000, 154, 485–496. [Google Scholar] [CrossRef]
- Manganaro, L.; Russo, G.; Cirio, R.; Dalmasso, F.; Giordanengo, S.; Monaco, V.; Muraro, S.; Sacchi, R.; Vignati, A.; Attili, A. A Monte Carlo approach to the microdosimetric kinetic model to account for dose rate time structure effects in ion beam therapy with application in treatment planning simulations. Med. Phys. 2017, 44, 1577–1589. [Google Scholar] [CrossRef] [PubMed]
- Kase, Y.; Kanai, T.; Matsufuji, N.; Furusawa, Y.; Elsässer, T.; Scholz, M. Biophysical calculation of cell survival probabilities using amorphous track structure models for heavy-ion irradiation. Phys. Med. Biol. 2007, 53, 37–59. [Google Scholar] [CrossRef]
- Guardiola, C.; Fleta, C.; Quirion, D.; Pellegrini, G.; Gómez, F. Silicon 3D microdetectors for microdosimetry in hadron therapy. Micromachines 2020, 11, 1053. [Google Scholar] [CrossRef]
- Conte, V.; Agosteo, S.; Bianchi, A.; Bolst, D.; Bortot, D.; Catalano, R.; Cirrone, G.A.P.; Colautti, P.; Cuttone, G.; Guatelli, S.; et al. Microdosimetry of a therapeutic proton beam with a mini-TEPC and a MicroPlus-Bridge detector for RBE assessment. Phys. Med. Biol. 2020, 65, 245018. [Google Scholar] [CrossRef]
Publisher’s Note: MDPI stays neutral with regard to jurisdictional claims in published maps and institutional affiliations. |
© 2022 by the authors. Licensee MDPI, Basel, Switzerland. This article is an open access article distributed under the terms and conditions of the Creative Commons Attribution (CC BY) license (https://creativecommons.org/licenses/by/4.0/).