
A SkSP-R Plan under the Assumption of Gompertz Distribution


Abstract
:1. Introduction
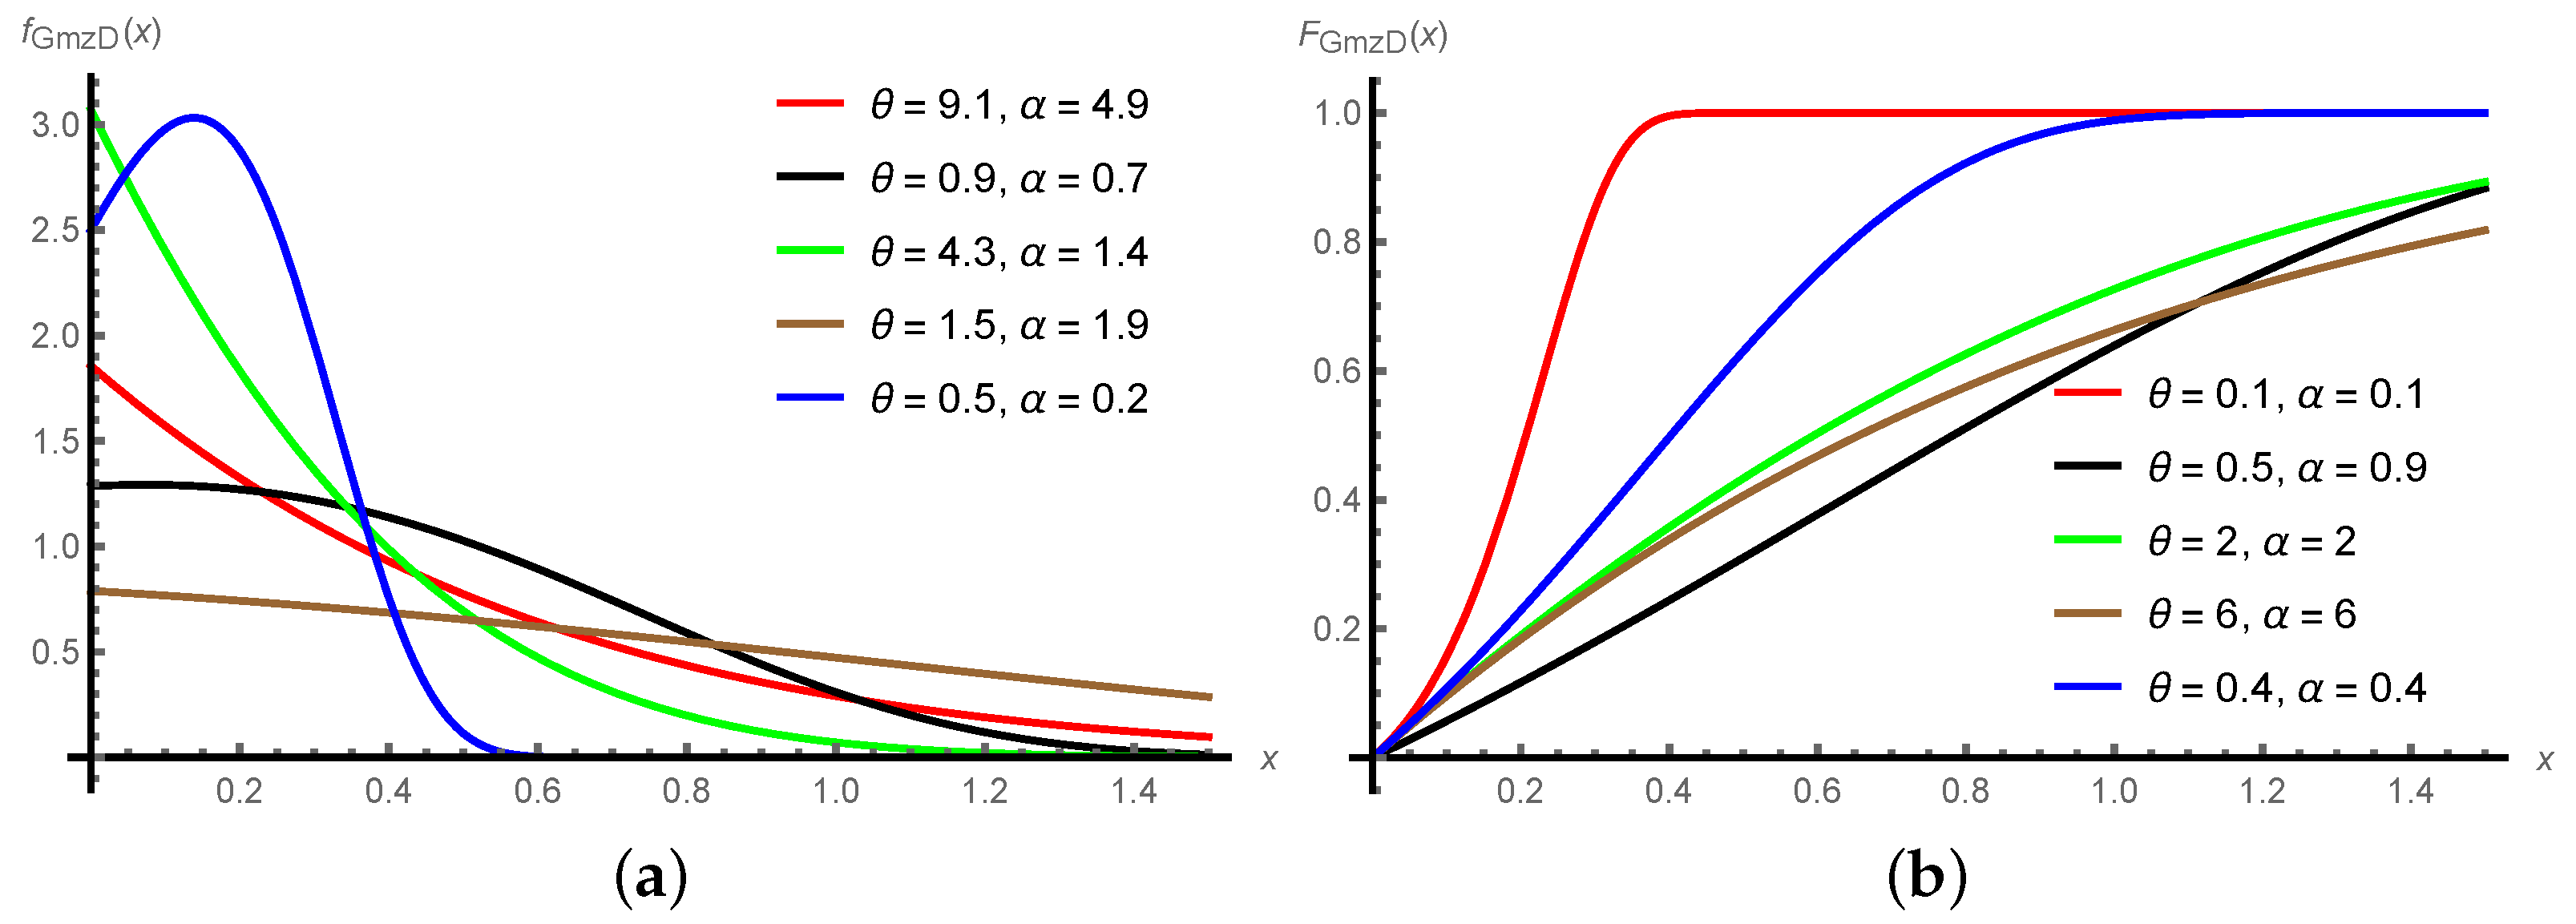
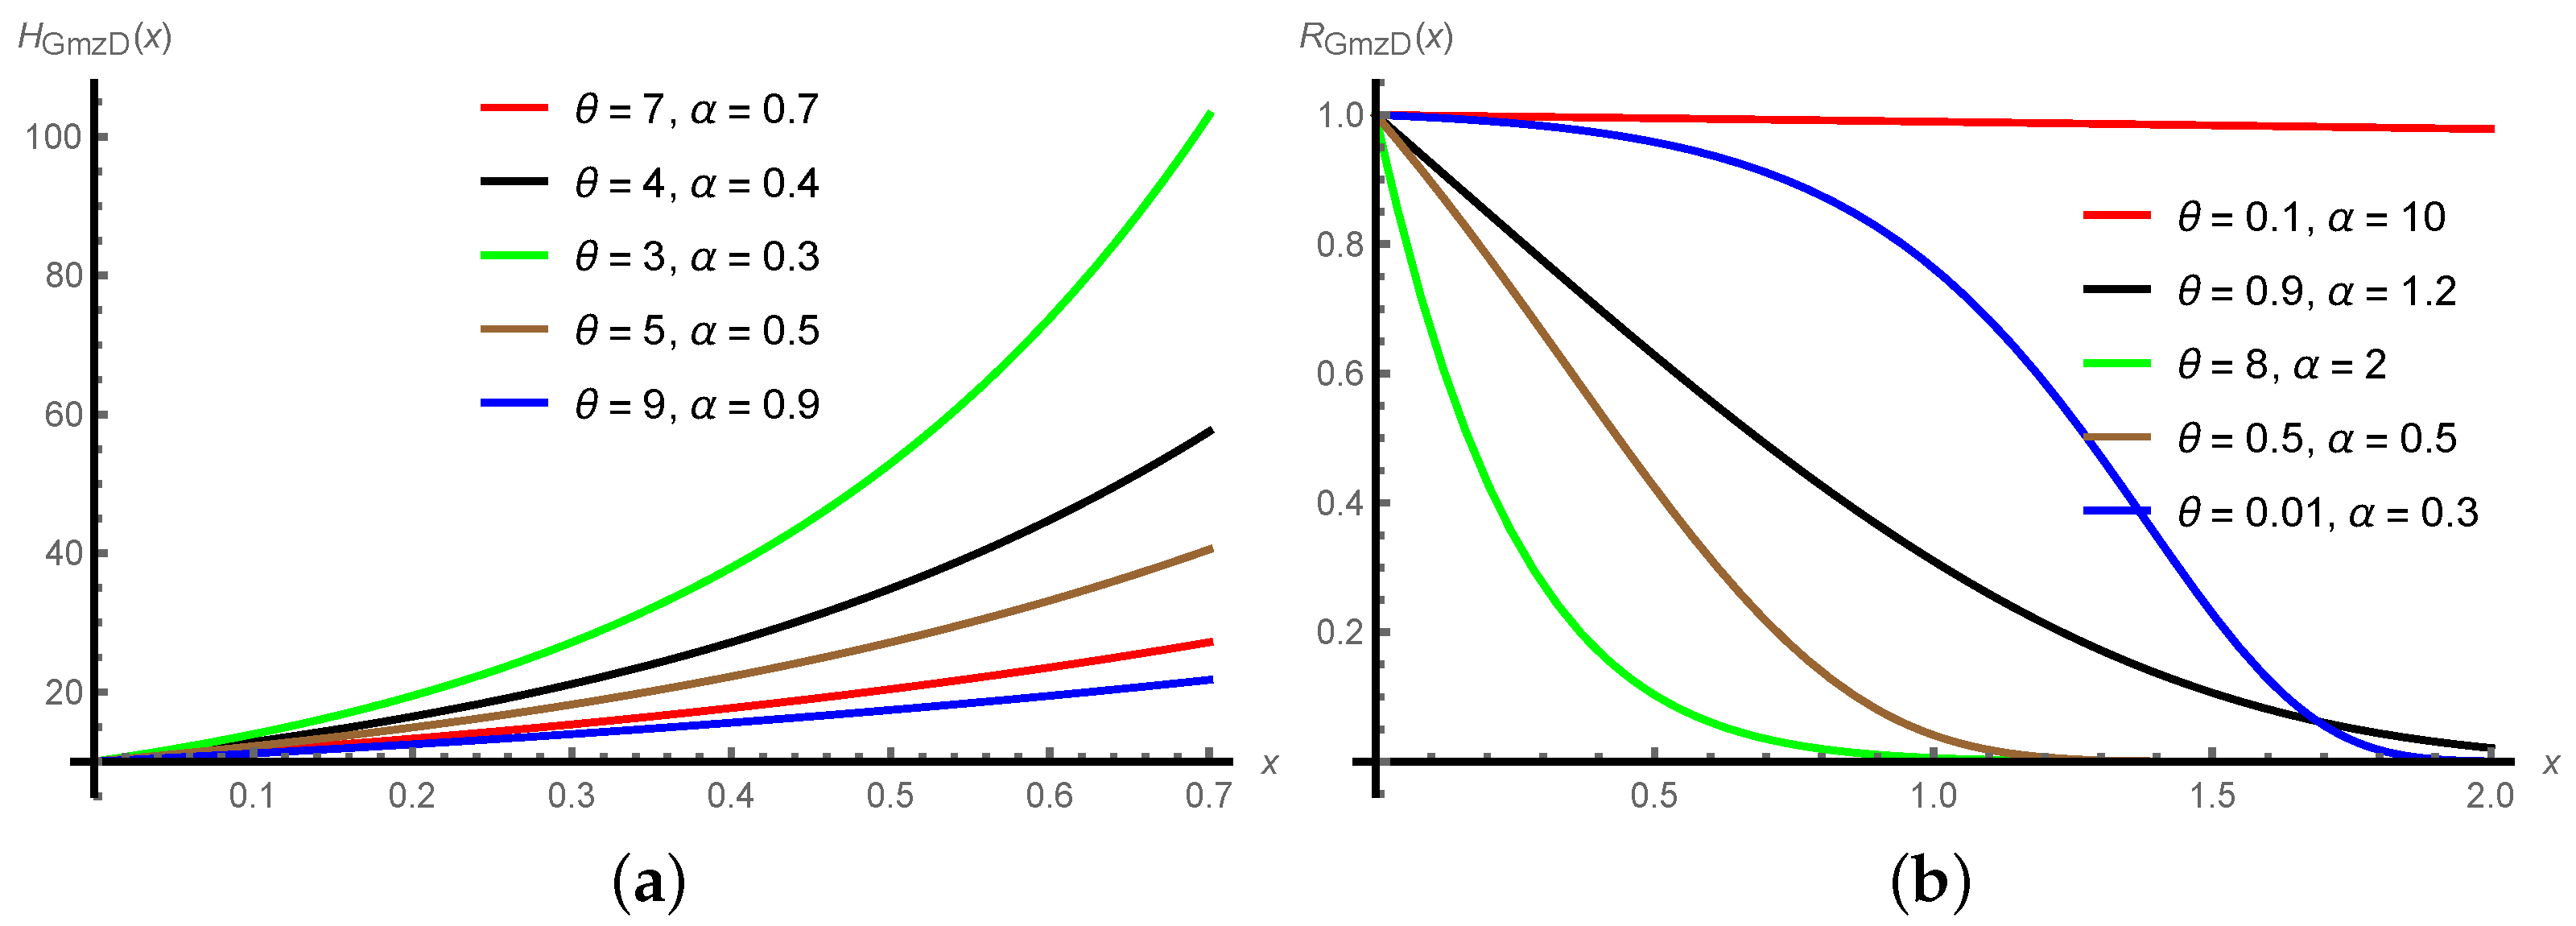
2. Gompertz Distribution
3. Design of the SkSP-R Plan for GmzD
- 1.
- Begin with the normal inspection using the reference plan, and then place n items on test for prefixed time . Notice and count the number of sample items that failed before the experiment duration, say, d. If , then accept the lot and reject it if .
- 2.
- Stop the normal inspection and utilize the skipping inspection (SI) if i successive units are accepted under normal inspection based on time truncated life tests.
- 3.
- Within SI, inspect only a fraction f of lots that is randomly selected. SI is continued until a sampled lot is rejected.
- 4.
- If a lot is not accepted after k consecutively sampled lots have been accepted, then the resampling procedure is employed for the immediate next lot as given below (Step 5).
- 5.
- Within the resampling technique, conduct the inspection based on the reference plan and continue SI if the lot is accepted. If the lot is not accepted, resampling is performed m times and the lot is rejected if it has not accepted on st resubmission.
- 6.
- If a lot is not accepted based on resampling scheme, then directly revert to the normal inspection (Step 1).
- 7.
- Remove or correct all the nonconforming units found with conforming units in the rejected lots.
4. Description of Tables
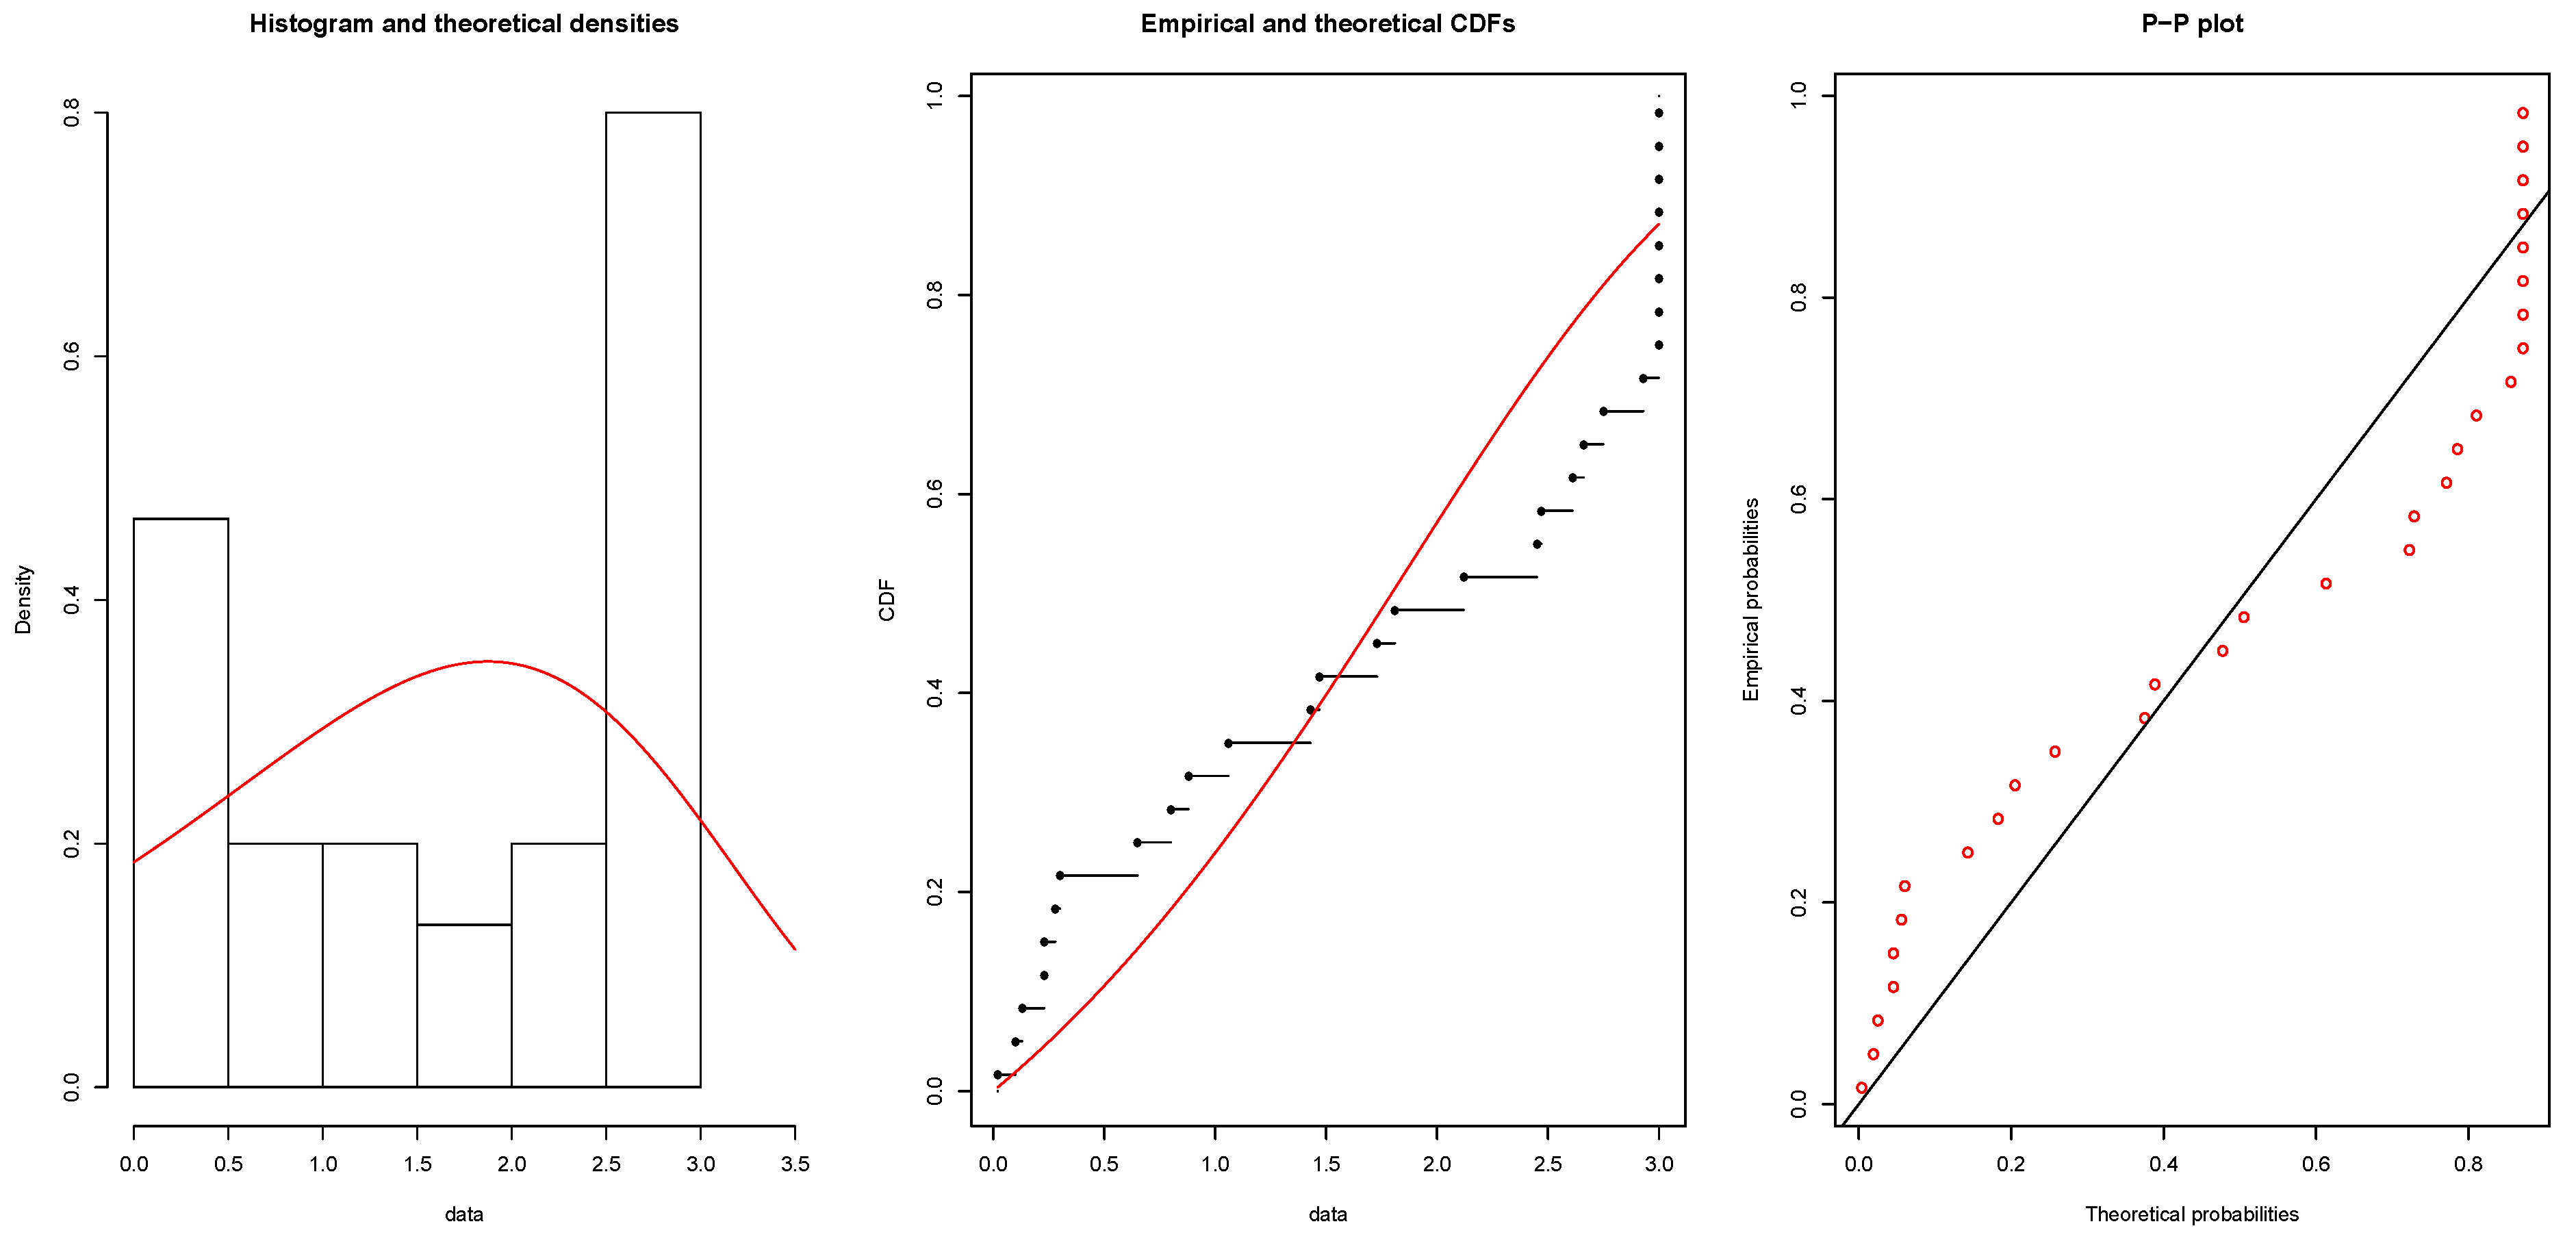
5. Real Life Examples
- 1.
- Start normal inspection and put items on test for prefixed time . Detect and count the number of sample items that failed before the experiment duration, say, , and . Hence, accept the lot.
- 2.
- When , consecutive lots are not rejected under normal inspection based on time truncated life test; end the normal inspection and follow SI.
- 3.
- Throughout SI, test only a fraction of lots chosen at random. SI is continued up to a point where a sampled lot is rejected.
- 4.
- After , where a lot is rejected, consecutively sampled lots are accepted; hence, utilize the resampling method for the immediate next lot as in Step 5.
- 5.
- In the resampling technique, perform the inspection based on a reference plan. If the lot is not rejected, then keep SI. If the lot is not accepted, resampling is formed for times and the lot is rejected if it is not accepted on st resubmission.
- 6.
- If a lot is not accepted on resampling scheme, then immediately proceed to the normal inspection provided in Step 1.
- 7.
- Remove or correct all the nonconforming items found with asserting units in the rejected lots.
- 1.
- Start normal inspection and put items on the test for prefixed time . Detect and count the number of sample items which failed before the experiment duration, say, , and . Thus, we accept the lot.
- 2.
- When , consecutive lots are accepted under normal inspection based on time truncated life test, and the normal inspection is discontinued. A switch to the skipping inspection is made.
- 3.
- During the skipping inspection, inspect only a fraction of lots selected at random. The skipping inspection is continued until a sampled lot is rejected.
- 4.
- If the lot is rejected after , consecutively sampled lots are accepted; then, proceed to the resampling procedure for the immediate next lot as in Step 5 provided below.
- 5.
- During resampling procedure, perform the inspection using the reference plan. If the lot is accepted, then continue the skipping inspection. Upon the non-acceptance of the lot, resampling is performed for times and the lot is rejected if it has not been accepted on st resubmission.
- 6.
- If a lot is rejected on resampling scheme, then immediately revert to the normal inspection in Step 1.
- 7.
- Remove or correct all nonconforming units found with conforming units in the rejected lots.
6. Conclusions
Author Contributions
Funding
Data Availability Statement
Acknowledgments
Conflicts of Interest
References
- Gupta, S.S.; Groll, P.A. Gamma distribution in acceptance sampling based on life test. J. Am. Stat. Assoc. 1961, 56, 942–970. [Google Scholar] [CrossRef]
- Gupta, S.S. Life test sampling plans for normal and lognormal distributions. Technometrics 1962, 4, 151–175. [Google Scholar] [CrossRef]
- Baklizi, A.; EL Masri, A.E.K. Acceptance sampling plan based on truncated life tests in the Birnbaum Saunders model. Risk Anal. 2004, 24, 1453–1457. [Google Scholar] [CrossRef] [PubMed]
- Rosaiah, K.; Kantam, R.R.L. Acceptance sampling plan based on the inverse Rayleigh distribution. Econ. Qual. Control 2005, 20, 77–286. [Google Scholar] [CrossRef]
- Tsai, T.R.; Wu, S.J. Acceptance sampling plan based on truncated life tests for generalized Rayleigh distribution. J. Appl. Stat. 2006, 33, 595–600. [Google Scholar] [CrossRef]
- Balakrishnan, N.; Lieiva, V.; Lopez, J. Acceptance sampling plan from truncated life tests based on generalized Birnbaum Saunders distribution. Commun. Stat.-Simul. Comput. 2007, 34, 799–809. [Google Scholar] [CrossRef]
- Aslam, M.; Kundu, D.; Ahmed, M. Time truncated acceptance sampling plans for generalized exponential distribution. J. Appl. Stat. 2010, 37, 555–566. [Google Scholar] [CrossRef]
- Al-Omari, A.I. Time truncated acceptance sampling plans for generalized inverted exponential distribution. Electron. J. Appl. Stat. Anal. 2015, 8, 1–12. [Google Scholar]
- Tripathi, H.; Saha, M.; Alha, V. An application of time truncated single acceptance sampling inspection plan based on generalized half-normal distribution. Ann. Data Sci. 2020. [Google Scholar] [CrossRef]
- Saha, M.; Tripathi, H.; Dey, S. Single and double acceptance sampling plans for truncated life tests based on transmuted Rayleigh distribution. J. Ind. Prod. Eng. 2021, 38, 356–368. [Google Scholar] [CrossRef]
- Govindaraju, K.; Lai, C.D. A modified ChSP-1 chain sampling plan, MChSP-1,with very small sample sizes. Am. J. Math. Manag. Sci. 1998, 18, 343–358. [Google Scholar] [CrossRef]
- Govindaraju, K.; Subramani, K. Selection of chain sampling plans ChSP-1 and ChSP-(0,1) for given acceptable quality level and limiting quality level. Am. J. Math. Manag. Sci. 1993, 13, 123–136. [Google Scholar]
- Rao, G.S. Double acceptance sampling plan based on truncated life tests for Marshall-Olkin Extended exponential distribution. Austrian J. Stat. 2011, 40, 169–176. [Google Scholar] [CrossRef]
- Rao, G.S. A Group Acceptance Sampling Plans for Lifetimes Following a Marshall-Olkin Extended Exponential Distribution. Appl. Appl. Math. Int. J. 2011, 6, 592–601. [Google Scholar]
- Gui, W. Double acceptance sampling plan for truncated life tests based on Maxwell distribution. Am. J. Math. Manag. Sci. 2014, 33, 98–109. [Google Scholar] [CrossRef]
- Gui, W.; Xu, M. Double acceptance sampling plan based on truncated life tests for half exponential power distribution. Stat. Methodol. 2015, 27, 123–131. [Google Scholar] [CrossRef]
- Al-Omari, A.I.; Amjad, D.; Fatima, S.G. Double acceptance sampling Plan for time-truncated life tests based on half-normal distribution. Econ. Qual. Control. 2016, 31, 93–99. [Google Scholar]
- Al-Omari, A.I. Acceptance sampling plans based on truncated life tests for Sushila distribution. J. Math. Fundam. Sci. 2018, 50, 72–83. [Google Scholar] [CrossRef] [Green Version]
- Al-Omari, A.I.; Zamanzade, E. Double Acceptance Sampling Plan for time truncated life Tests based on transmuted generalized inverse weibull distribution. J. Stat. Appl. Probab. 2017, 6, 1–6. [Google Scholar] [CrossRef]
- Hu, M.; Gui, W. Acceptance sampling plans based on truncated life tests for Burr type X distribution. J. Stat. Manag. Syst. 2018, 21, 323–336. [Google Scholar] [CrossRef]
- Aslam, M.; Jun, C.H.; Ahmad, M. A Group sampling plan based on truncated life test for gamma distributed items. Pak. J. Stat. 2009, 25, 333–340. [Google Scholar]
- Aslam, M.; Jun, C.H.; Ahmad, M. New acceptance sampling plans based on life tests for Birnbaum–Saunders distribution. J. Appl. Stat. 2011, 81, 461–470. [Google Scholar] [CrossRef]
- Aslam, M.; Azam, M.; Lio, Y.; Jun, C.H. Two-Stage group acceptance sampling plan for Burr type X percentiles. J. Test. Eval. 2013, 41, 525–533. [Google Scholar] [CrossRef]
- Singh, S.; Tripathi, Y.M. Acceptance sampling plans for inverse Weibull distribution based on truncated life test. Life Cycle Reliab. Saf. Eng. 2017, 6, 169–178. [Google Scholar] [CrossRef] [Green Version]
- Kanaparthi, R.; Rao, G.S.; Kalyani, K.; Sivakumar, D.C.U. Group acceptance sampling plans for lifetimes following an odds exponential log logistic distribution. Sri Lankan J. Appl. Stat. 2016, 17, 201–216. [Google Scholar] [CrossRef] [Green Version]
- Tripathi, H.; Al-Omari, A.I.; Saha, M.; Mali, A. Time truncated life tests for new attribute sampling inspection plan and its applications. J. Ind. Prod. Eng. 2021b, 293–305. [CrossRef]
- Tripathi, H.; Al-Omari, A.I.; Saha, M.; Alanzi, A.R. Improved attribute chain sampling plan for Darna distribution. Comput. Syst. Sci. Eng. 2021, 38, 381–392. [Google Scholar] [CrossRef]
- Tripathi, H.; Saha, M.; Dey, S. A new approach of time truncated chain sampling inspection plan and its applications. Int. J. Syst. Assur. Eng. Manag. 2022. [Google Scholar] [CrossRef]
- Tripathi, H.; Dey, S.; Saha, M. Double and group acceptance sampling plan for truncated life test based on inverse log-logistic distribution. J. Appl. Stat. 2021, 48, 1227–1242. [Google Scholar] [CrossRef]
- Balamurali, S.; Aslam, M.; Jun, C.-H. A new system of skip-lot sampling including resampling. Sci. World J. 2014, 2014, 192412. [Google Scholar] [CrossRef]
- Balamurali, S.; Usha, M. Optimal designing of variables chain sampling plan by minimizing the average sample number. Int. J. Manuf. Eng. 2013, 2013, 751807. [Google Scholar] [CrossRef]
- Meeker, W.Q.; Escobar, L.A. Statistical Methods for Reliability Data; John Wiley and Sons: Hoboken, NJ, USA, 1988. [Google Scholar]
- Smith, R.L.; Naylor, J.C. A Comparison of Maximum Likelihood and Bayesian Estimators for the Three-Parameter Weibull Distribution. J. R. Stat. Soc. Ser. C (Appl. Stat.) 1987, 36, 358–369. [Google Scholar] [CrossRef]
- Al-Nasser, D.A.; Al-Omari, A.I. MiniMax ranked set sampling. Rev. Investig. Oper. 2018, 39, 560–570. [Google Scholar]
- Zamanzade, E.; Al-Omari, A.I. New ranked set sampling for estimating the population mean and variance. Hacet. J. Math. Stat. 2016, 45, 1891–1905. [Google Scholar] [CrossRef]
- Haq, A.; Brown, J.; Moltchanova, E.; Al-Omari, A.I. Paired double ranked set sampling. Commun. Stat.-Theory Methods 2016, 45, 2873–2889. [Google Scholar] [CrossRef]


| n | c | i | f | k | ASN | n | c | i | f | k | ASN | ||||
|---|---|---|---|---|---|---|---|---|---|---|---|---|---|---|---|
| 0.25 | 2 | 34 | 10 | 2 | 1 | 24 | 10 | 2 | 1 | ||||||
| 3 | 31 | 9 | 2 | 1 | 22 | 9 | 2 | 1 | |||||||
| 4 | 28 | 8 | 2 | 1 | 19 | 8 | 2 | 1 | |||||||
| 5 | 24 | 7 | 2 | 1 | 17 | 7 | 2 | 1 | |||||||
| 6 | 21 | 6 | 2 | 1 | 15 | 6 | 2 | 1 | |||||||
| 7 | 18 | 5 | 2 | 1 | 13 | 5 | 2 | 1 | |||||||
| 8 | 15 | 4 | 2 | 1 | 11 | 4 | 2 | 1 | |||||||
| 0.10 | 2 | 68 | 18 | 2 | 1 | 47 | 18 | 2 | 1 | ||||||
| 3 | 64 | 17 | 2 | 1 | 45 | 17 | 2 | 1 | |||||||
| 4 | 61 | 16 | 2 | 1 | 42 | 16 | 2 | 1 | |||||||
| 5 | 58 | 15 | 2 | 1 | 40 | 15 | 2 | 1 | |||||||
| 6 | 54 | 14 | 2 | 1 | 38 | 14 | 2 | 1 | |||||||
| 7 | 51 | 13 | 2 | 1 | 35 | 13 | 2 | 1 | |||||||
| 8 | 48 | 12 | 2 | 1 | 33 | 12 | 2 | 1 | |||||||
| 0.05 | 2 | 114 | 30 | 2 | 1 | 79 | 30 | 2 | 1 | ||||||
| 3 | 110 | 29 | 2 | 1 | 76 | 29 | 2 | 1 | |||||||
| 4 | 107 | 28 | 2 | 1 | 74 | 28 | 2 | 1 | |||||||
| 5 | 104 | 27 | 2 | 1 | 72 | 27 | 2 | 1 | |||||||
| 6 | 100 | 26 | 2 | 1 | 69 | 26 | 2 | 1 | |||||||
| 7 | 97 | 25 | 2 | 1 | 67 | 25 | 2 | 1 | |||||||
| 8 | 93 | 24 | 2 | 1 | 65 | 24 | 2 | 1 | |||||||
| 0.01 | 2 | 154 | 38 | 2 | 1 | 106 | 38 | 2 | 1 | ||||||
| 3 | 151 | 37 | 2 | 1 | 104 | 37 | 2 | 1 | |||||||
| 4 | 147 | 36 | 2 | 1 | 101 | 36 | 2 | 1 | |||||||
| 5 | 144 | 35 | 2 | 1 | 99 | 35 | 2 | 1 | |||||||
| 6 | 140 | 34 | 2 | 1 | 97 | 34 | 2 | 1 | |||||||
| 7 | 137 | 33 | 2 | 1 | 94 | 33 | 2 | 1 | |||||||
| 8 | 133 | 32 | 2 | 1 | 92 | 32 | 2 | 1 | |||||||
| n | c | i | f | k | ASN | n | c | i | f | k | ASN | ||||
|---|---|---|---|---|---|---|---|---|---|---|---|---|---|---|---|
| 2 | 32 | 10 | 2 | 1 | 23 | 10 | 2 | 1 | |||||||
| 3 | 29 | 9 | 2 | 1 | 21 | 9 | 2 | 1 | |||||||
| 4 | 26 | 8 | 2 | 1 | 19 | 8 | 2 | 1 | |||||||
| 5 | 23 | 7 | 2 | 1 | 17 | 7 | 2 | 1 | |||||||
| 6 | 20 | 6 | 2 | 1 | 15 | 6 | 2 | 1 | |||||||
| 7 | 17 | 5 | 2 | 1 | 12 | 5 | 2 | 1 | |||||||
| 8 | 14 | 4 | 2 | 1 | 10 | 4 | 2 | 1 | |||||||
| 2 | 64 | 18 | 2 | 1 | 45 | 18 | 2 | 1 | |||||||
| 3 | 61 | 17 | 2 | 1 | 43 | 17 | 2 | 1 | |||||||
| 4 | 58 | 16 | 2 | 1 | 41 | 16 | 2 | 1 | |||||||
| 5 | 55 | 15 | 2 | 1 | 39 | 15 | 2 | 1 | |||||||
| 6 | 52 | 14 | 2 | 1 | 36 | 14 | 2 | 1 | |||||||
| 7 | 48 | 13 | 2 | 1 | 34 | 13 | 2 | 1 | |||||||
| 8 | 45 | 12 | 2 | 1 | 32 | 12 | 2 | 1 | |||||||
| 2 | 108 | 30 | 2 | 1 | 76 | 30 | 2 | 1 | |||||||
| 3 | 105 | 29 | 2 | 1 | 74 | 29 | 2 | 1 | |||||||
| 4 | 102 | 28 | 2 | 1 | 72 | 28 | 2 | 1 | |||||||
| 5 | 99 | 27 | 2 | 1 | 69 | 27 | 2 | 1 | |||||||
| 6 | 95 | 26 | 2 | 1 | 67 | 26 | 2 | 1 | |||||||
| 7 | 92 | 25 | 2 | 1 | 65 | 25 | 2 | 1 | |||||||
| 8 | 89 | 24 | 2 | 1 | 62 | 24 | 2 | 1 | |||||||
| 2 | 147 | 38 | 2 | 1 | 103 | 38 | 2 | 1 | |||||||
| 3 | 143 | 37 | 2 | 1 | 100 | 37 | 2 | 1 | |||||||
| 4 | 140 | 36 | 2 | 1 | 98 | 36 | 2 | 1 | |||||||
| 5 | 137 | 35 | 2 | 1 | 95 | 35 | 2 | 1 | |||||||
| 6 | 133 | 34 | 2 | 1 | 93 | 34 | 2 | 1 | |||||||
| 7 | 130 | 33 | 2 | 1 | 91 | 33 | 2 | 1 | |||||||
| 8 | 127 | 32 | 2 | 1 | 88 | 32 | 2 | 1 | |||||||
| n | c | i | f | k | ASN | n | c | i | f | k | ASN | ||||
|---|---|---|---|---|---|---|---|---|---|---|---|---|---|---|---|
| 2 | 31 | 10 | 2 | 1 | 23 | 10 | 2 | 1 | |||||||
| 3 | 28 | 9 | 2 | 1 | 21 | 9 | 2 | 1 | |||||||
| 4 | 26 | 8 | 2 | 1 | 18 | 8 | 2 | 1 | |||||||
| 5 | 23 | 7 | 2 | 1 | 16 | 7 | 2 | 1 | |||||||
| 6 | 20 | 6 | 2 | 1 | 14 | 6 | 2 | 1 | |||||||
| 7 | 17 | 5 | 2 | 1 | 12 | 5 | 2 | 1 | |||||||
| 8 | 14 | 4 | 2 | 1 | 10 | 4 | 2 | 1 | |||||||
| 2 | 63 | 18 | 2 | 1 | 45 | 18 | 2 | 1 | |||||||
| 3 | 60 | 17 | 2 | 1 | 42 | 17 | 2 | 1 | |||||||
| 4 | 56 | 16 | 2 | 1 | 40 | 16 | 2 | 1 | |||||||
| 5 | 53 | 15 | 2 | 1 | 38 | 15 | 2 | 1 | |||||||
| 6 | 50 | 14 | 2 | 1 | 36 | 14 | 2 | 1 | |||||||
| 7 | 47 | 13 | 2 | 1 | 33 | 13 | 2 | 1 | |||||||
| 8 | 44 | 12 | 2 | 1 | 31 | 12 | 2 | 1 | |||||||
| 2 | 105 | 30 | 2 | 1 | 75 | 30 | 2 | 1 | |||||||
| 3 | 102 | 29 | 2 | 1 | 72 | 29 | 2 | 1 | |||||||
| 4 | 99 | 28 | 2 | 1 | 70 | 28 | 2 | 1 | |||||||
| 5 | 96 | 27 | 2 | 1 | 68 | 27 | 2 | 1 | |||||||
| 6 | 93 | 26 | 2 | 1 | 66 | 26 | 2 | 1 | |||||||
| 7 | 90 | 25 | 2 | 1 | 63 | 25 | 2 | 1 | |||||||
| 8 | 86 | 24 | 2 | 1 | 61 | 24 | 2 | 1 | |||||||
| 2 | 142 | 38 | 2 | 1 | 100 | 38 | 2 | 1 | |||||||
| 3 | 139 | 37 | 2 | 1 | 98 | 37 | 2 | 1 | |||||||
| 4 | 136 | 36 | 2 | 1 | 96 | 36 | 2 | 1 | |||||||
| 5 | 133 | 35 | 2 | 1 | 94 | 35 | 2 | 1 | |||||||
| 6 | 130 | 34 | 2 | 1 | 92 | 34 | 2 | 1 | |||||||
| 7 | 126 | 33 | 2 | 1 | 89 | 33 | 2 | 1 | |||||||
| 8 | 123 | 32 | 2 | 1 | 87 | 32 | 2 | 1 | |||||||
| n | c | i | f | k | ASN | n | c | i | f | k | ASN | ||||
|---|---|---|---|---|---|---|---|---|---|---|---|---|---|---|---|
| 2 | 31 | 10 | 2 | 1 | 22 | 10 | 2 | 1 | |||||||
| 3 | 28 | 9 | 2 | 1 | 20 | 9 | 2 | 1 | |||||||
| 4 | 25 | 8 | 2 | 1 | 18 | 8 | 2 | 1 | |||||||
| 5 | 22 | 7 | 2 | 1 | 16 | 7 | 2 | 1 | |||||||
| 6 | 19 | 6 | 2 | 1 | 14 | 6 | 2 | 1 | |||||||
| 7 | 17 | 5 | 2 | 1 | 12 | 5 | 2 | 1 | |||||||
| 8 | 14 | 4 | 2 | 1 | 10 | 4 | 2 | 1 | |||||||
| 2 | 61 | 18 | 2 | 1 | 44 | 18 | 2 | 1 | |||||||
| 3 | 58 | 17 | 2 | 1 | 42 | 17 | 2 | 1 | |||||||
| 4 | 55 | 16 | 2 | 1 | 40 | 16 | 2 | 1 | |||||||
| 5 | 52 | 15 | 2 | 1 | 37 | 15 | 2 | 1 | |||||||
| 6 | 49 | 14 | 2 | 1 | 35 | 14 | 2 | 1 | |||||||
| 7 | 46 | 13 | 2 | 1 | 33 | 13 | 2 | 1 | |||||||
| 8 | 43 | 12 | 2 | 1 | 31 | 12 | 2 | 1 | |||||||
| 2 | 103 | 30 | 2 | 1 | 74 | 30 | 2 | 1 | |||||||
| 3 | 100 | 29 | 2 | 1 | 71 | 29 | 2 | 1 | |||||||
| 4 | 97 | 28 | 2 | 1 | 69 | 28 | 2 | 1 | |||||||
| 5 | 94 | 27 | 2 | 1 | 67 | 27 | 2 | 1 | |||||||
| 6 | 91 | 26 | 2 | 1 | 65 | 26 | 2 | 1 | |||||||
| 7 | 88 | 25 | 2 | 1 | 63 | 25 | 2 | 1 | |||||||
| 8 | 85 | 24 | 2 | 1 | 60 | 24 | 2 | 1 | |||||||
| 2 | 140 | 38 | 2 | 1 | 99 | 38 | 2 | 1 | |||||||
| 3 | 137 | 37 | 2 | 1 | 97 | 37 | 2 | 1 | |||||||
| 4 | 133 | 36 | 2 | 1 | 93 | 36 | 2 | 1 | |||||||
| 5 | 130 | 35 | 2 | 1 | 92 | 35 | 2 | 1 | |||||||
| 6 | 127 | 34 | 2 | 1 | 90 | 34 | 2 | 1 | |||||||
| 7 | 124 | 33 | 2 | 1 | 88 | 33 | 2 | 1 | |||||||
| 8 | 121 | 32 | 2 | 1 | 85 | 32 | 2 | 1 | |||||||
| Data | Minimum | Median | Mean | Maximum | CS | CK | ||
|---|---|---|---|---|---|---|---|---|
| I | 0.020 | 0.688 | 1.965 | 1.770 | 2.983 | 3.000 | −0.2840467 | 1.453664 |
| II | 0.550 | 1.375 | 1.590 | 1.507 | 1.685 | 2.240 | −0.8999263 | 3.923761 |
| Data | Estimates | L-L | AIC | BIC | KS Value | p-Value |
|---|---|---|---|---|---|---|
| I | ||||||
| II |
Publisher’s Note: MDPI stays neutral with regard to jurisdictional claims in published maps and institutional affiliations. |
© 2022 by the authors. Licensee MDPI, Basel, Switzerland. This article is an open access article distributed under the terms and conditions of the Creative Commons Attribution (CC BY) license (https://creativecommons.org/licenses/by/4.0/).
Share and Cite
Tripathi, H.; Al-Omari, A.I.; Alomani, G.A. A SkSP-R Plan under the Assumption of Gompertz Distribution. Appl. Sci. 2022, 12, 6131. https://doi.org/10.3390/app12126131
Tripathi H, Al-Omari AI, Alomani GA. A SkSP-R Plan under the Assumption of Gompertz Distribution. Applied Sciences. 2022; 12(12):6131. https://doi.org/10.3390/app12126131
Chicago/Turabian StyleTripathi, Harsh, Amer Ibrahim Al-Omari, and Ghadah A. Alomani. 2022. "A SkSP-R Plan under the Assumption of Gompertz Distribution" Applied Sciences 12, no. 12: 6131. https://doi.org/10.3390/app12126131
APA StyleTripathi, H., Al-Omari, A. I., & Alomani, G. A. (2022). A SkSP-R Plan under the Assumption of Gompertz Distribution. Applied Sciences, 12(12), 6131. https://doi.org/10.3390/app12126131