Article

Agreement of the Discrepancy Index Obtained Using Digital and Manual Techniques—A Comparative Study

by
Nestor A. Burgos-Arcega
,
Rogelio J. Scougall-Vilchis
,
Adriana A. Morales-Valenzuela
,
Wael Hegazy-Hassan
,
Edith Lara-Carrillo
,
Víctor H. Toral-Rizo
,
Ulises Velázquez-Enríquez
and
Elias N. Salmerón-Valdés
*
Center for Research and Advanced Studies in Dentistry, School of Dentistry, Autonomous University of Mexico State, 50130 Toluca, Estado de México, Mexico
*
Author to whom correspondence should be addressed.
Appl. Sci. 2022, 12(12), 6105; https://doi.org/10.3390/app12126105
Submission received: 6 May 2022 / Revised: 10 June 2022 / Accepted: 15 June 2022 / Published: 16 June 2022
(This article belongs to the Topic Medical Image Analysis)

Abstract

:
The discrepancy index evaluates the complexity of the initial orthodontic diagnosis. The objective is to compare whether there is a difference in the final discrepancy index score of the American Board of Orthodontics (ABO) when obtained using digital and manual techniques. Fifty-six initial orthodontic records in a digital and physical format were included (28 each) in 2022 at the Center for Research and Advanced Studies in Dentistry. For the digital measurements, iTero and TRIOS 3 intraoral scanners were used, along with Insignia software and cephalometric tracing with Dolphin Imaging software. Manual measurements were obtained in dental casts using the ruler indicated for the previously mentioned discrepancy index, in addition to conventional cephalometric tracing. Student’s t-test did not show statistically significant differences between the digital and manual techniques, with final discrepancy index scores of 24.61 (13.34) and 24.86 (14.14), respectively (p = 0.769). Cohen’s kappa index showed very good agreement between both categorical measurements (kappa value = 1.00, p = 0.001). The Bland–Altman method demonstrated a good agreement between continuous measurements obtained by both techniques with a bias of 0.2500 (superior limit of agreement =9.0092988, inferior limit of agreement = −8.5092988). Excellent agreement was observed in obtaining the discrepancy index through digital technique (Intraoral scanning and digital records) and manual technique (conventional records).

1. Introduction

The initial orthodontic diagnosis is essential for correct preventive or corrective treatment, and a wrong diagnosis can lead to a longer treatment or have unforeseen results [1]. The use of appropriate tools for the initial diagnosis allows for appropriate planning and treatment evaluation [2]. Indices and instruments are available to allow the orthodontist to perform evaluations at the beginning of treatment and for completed cases [3].
Standardization of diagnoses is important, as reliable records of the measurements are made; the ability to compare accurate data with unalterable records will facilitate the evaluation during and after treatment and allow to recognize and correct failures. For an orthodontic diagnosis, photographs, radiographs and study models are necessary. Study models in particular are a fundamental piece of the initial diagnosis. However, usually taking the physical form of plaster models, these have the major disadvantage of requiring space for storage, in addition to carrying the risk of being fractured, becoming degraded, or being misplaced. For these reasons, digital records and models offer an excellent alternative for orthodontic treatment [4].
At present, digital records are obtained via intraoral scanning of the patient [5,6]. This type of dental record has become increasingly popular and is being used frequently. Digital records eliminate the storage problems and risk of damage that characterize plaster models; additionally, they improve comprehensive patient care because they can be shared more easily with other dentists who are caring for the patient [7].
Digital records can be visualized and used with various specialized computer programs to develop and analyze different indices that facilitate diagnosis and decision-making in orthodontic treatment [8].
The accuracy of digitally obtained orthodontic indices and measurements has been questioned. Previous studies have compared the accuracy of various digital measurements obtained with different devices [9,10]. However, most studies have been limited to analyzing or comparing only one type of diagnostic record, such as study models or cephalometry. Additionally, it is necessary to know the reliability, reproducibility and precision of digitally obtained measurements compared to manually obtained ones. The discrepancy index developed by the American Board of Orthodontics (ABO) evaluates the complexity of the initial evaluation, based on the measurement of the obtained observations through standardized orthodontic pre-treatments that include dental cast, cephalometric measurements and panoramic radiography, which allow a precise evaluation for the clinical condition of the patient, providing an objective and quantifiable list of the most important disorders. For each disorder, a numerical value is assigned; the highest the value of the discrepancy index, the more complex and challenging orthodontic treatment becomes [11,12,13,14]. The objective of this study is to determine whether there is a difference in the final ABO discrepancy index score when it is obtained using digital versus manual measurements.

2. Materials and Methods

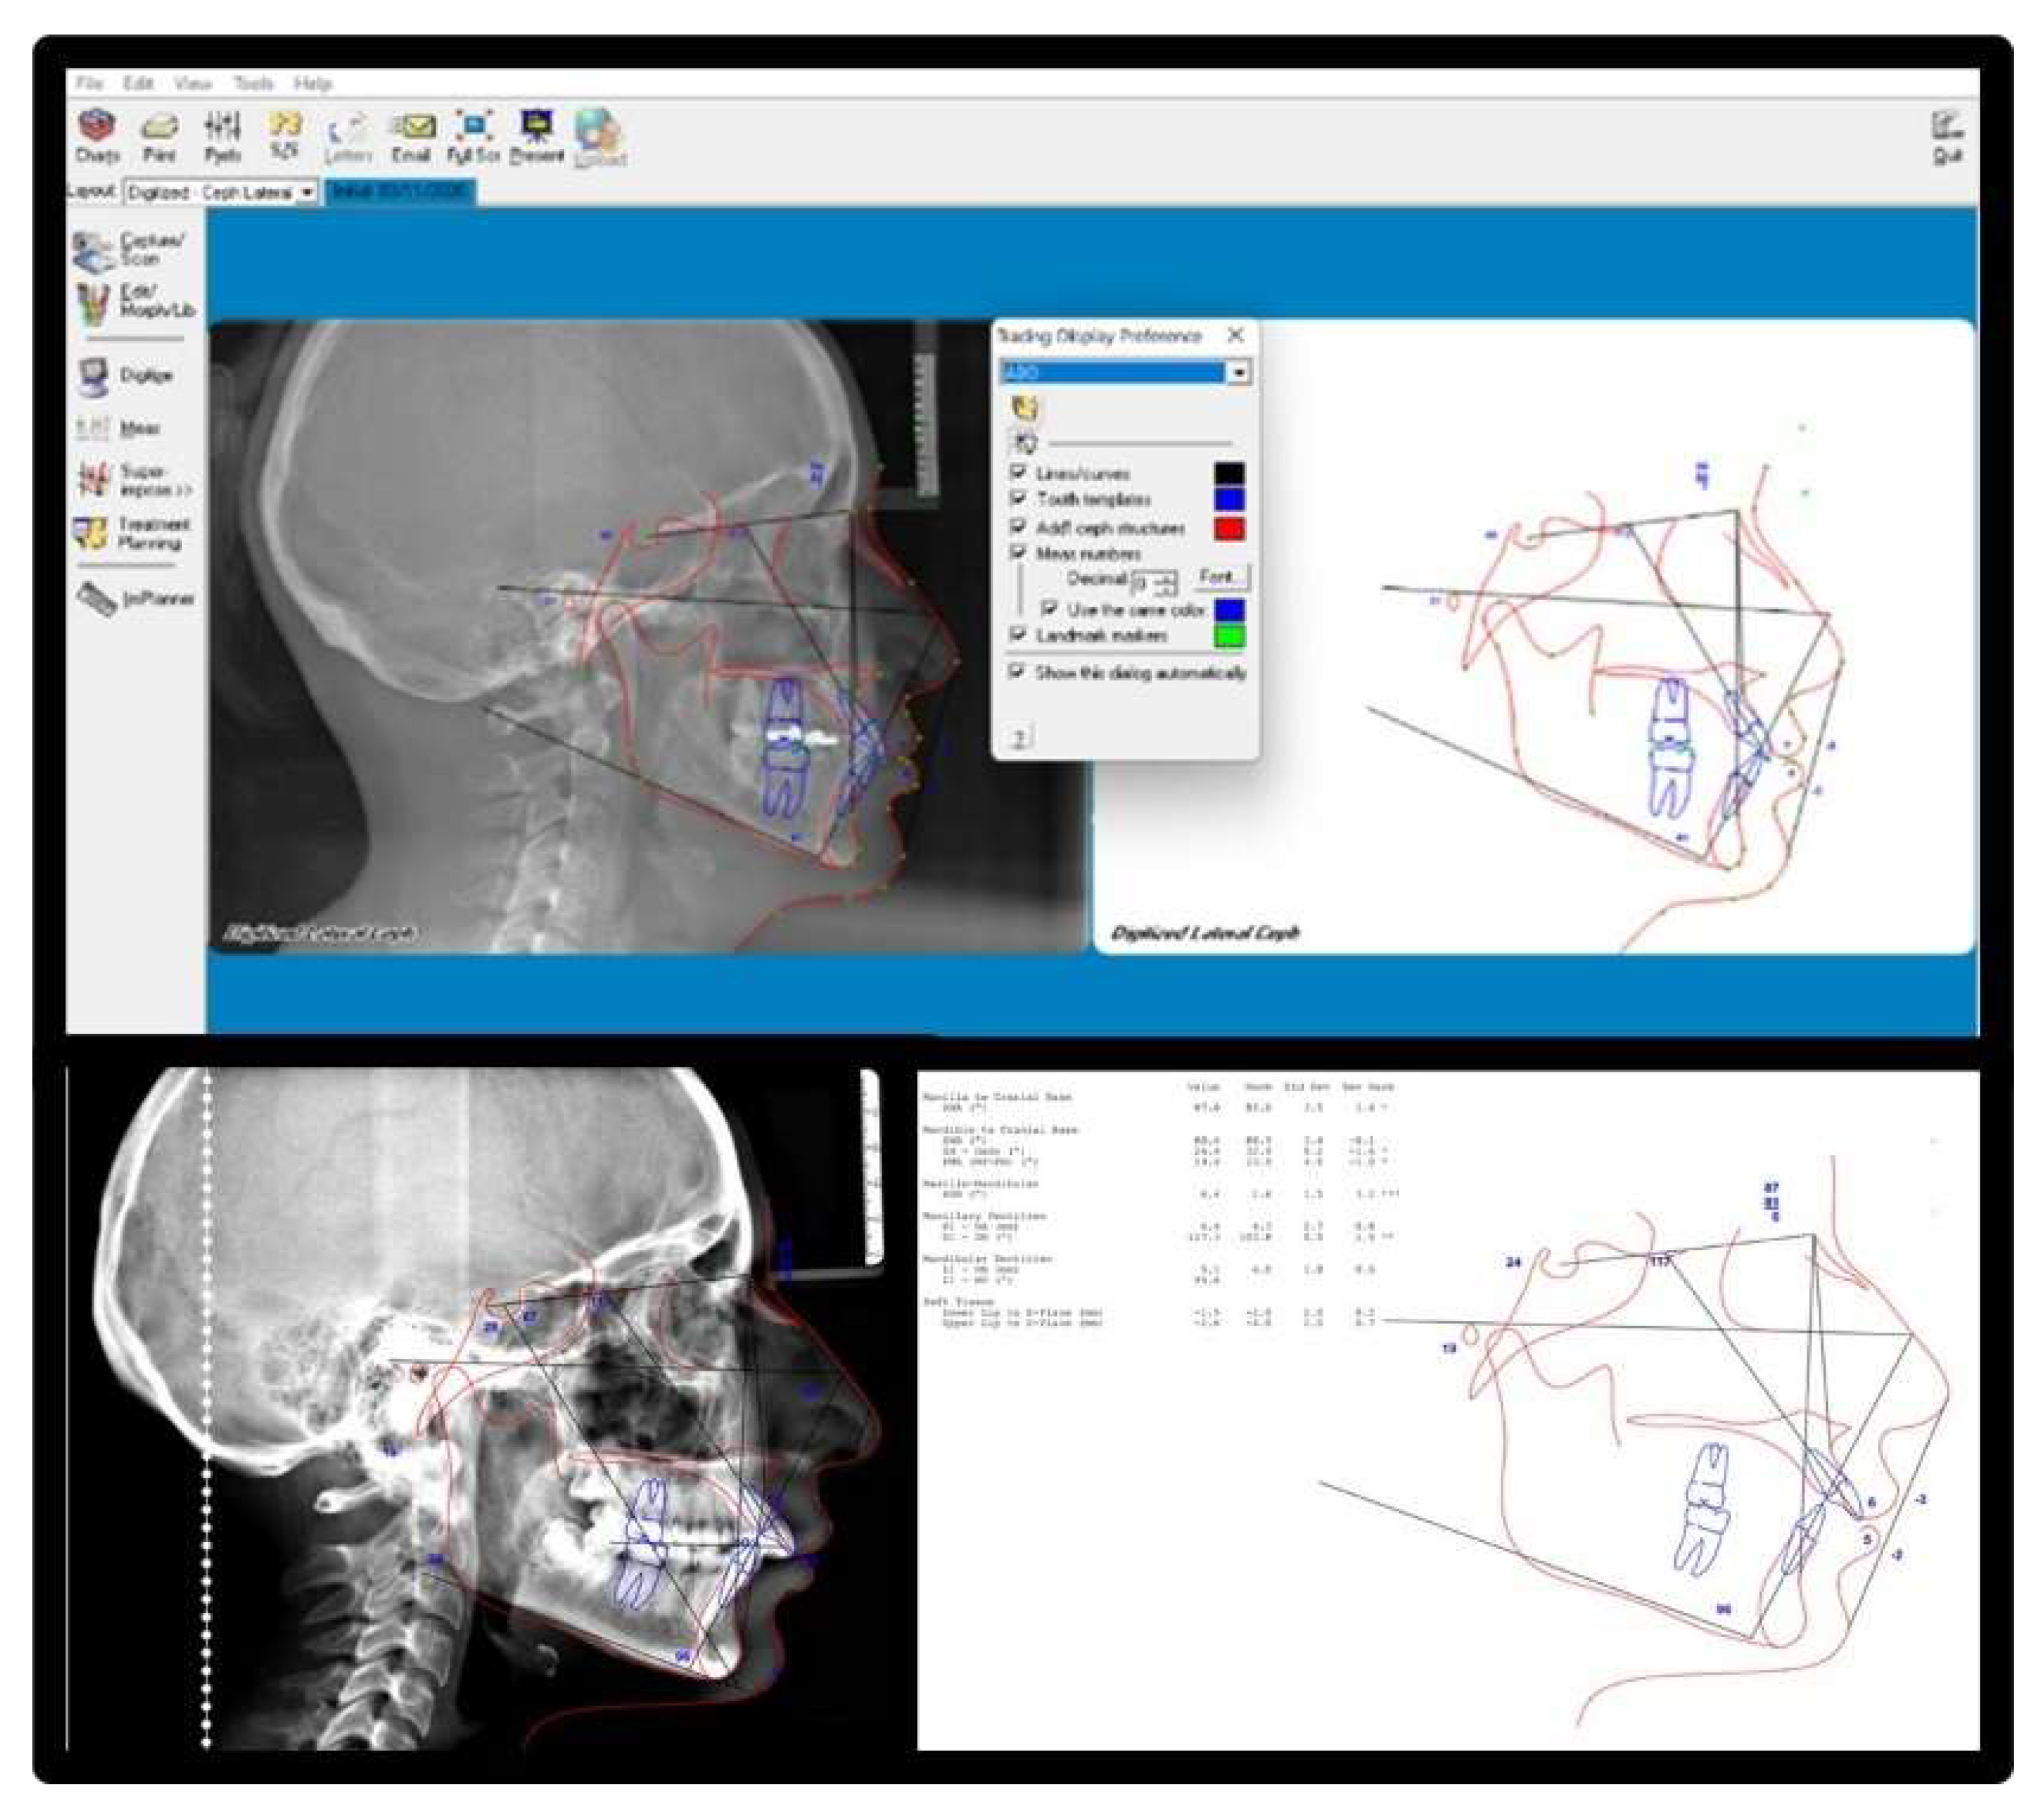
This paper addresses the agreement between digital and manual technique used to evaluate the complexity of orthodontic treatment through a cross-sectional study that was carried out on 28 patients who were recruited from February 2021 to May 2022 and scheduled for orthodontic treatment at the Faculty of Dentistry, at the Autonomous University of Mexico State. The patients were randomly chosen regardless of their malocclusion type or sex and gave their informed consent. The sample consisted of 28 initial orthodontic records in a digital format and 28 physical records for the same patients, and was equally evaluated. All protocols were approved by the bioethics committee of the Center for Research and Advanced Studies in Dentistry (CEICIEAO-2021-005). Digital records were obtained from a single dental office and included digital photographs, panoramic and lateral radiography of the skull, cone–beam tomography and intraoral scans obtained with iTero® (Align Technology, Tempe, AZ, USA) and TRIOS 3® (3Shape, Copenhagen, Denmark) and cephalometric tracing was performed in the Dolphin Imaging® program (Patterson Dental, Los Angeles, CA, USA). The physical records included printed photographs, printed panoramic and lateral skull radiographs, dental casts and manual cephalometric tracing. These records were secured to make an orthodontic diagnosis and thus obtaining the discrepancy index. Regarding the digital measurement, files corresponding to the intraoral scanning, cone–beam tomography, digital photographs, and radiographs were uploaded to the Ormco Digital® platform (Ormco, Brea, CA, USA). Subsequently, the company sent a treatment plan to be visualized with the Insignia® program (Ormco, Brea, CA, USA). The discrepancy index was obtained using the tools of the Digicast® section (Ormco, Brea, CA, USA) of the same program, and the 3D measurements were performed using this program (Figure 1). Cephalometric tracing was performed with the Dolphin Imaging® program, version 9.0 (Figure 2), and ABO tracing was predefined by the program based on the following cephalometric landmarks: ANB angle (A point–nasion–B point), SN-MP angle (sella–nasion–mandibular plane) and 1 ¯ to MP (lower incisor to mandibular plane). Photographs, digital radiographs and cone–beam tomography were used to score the section “other”.
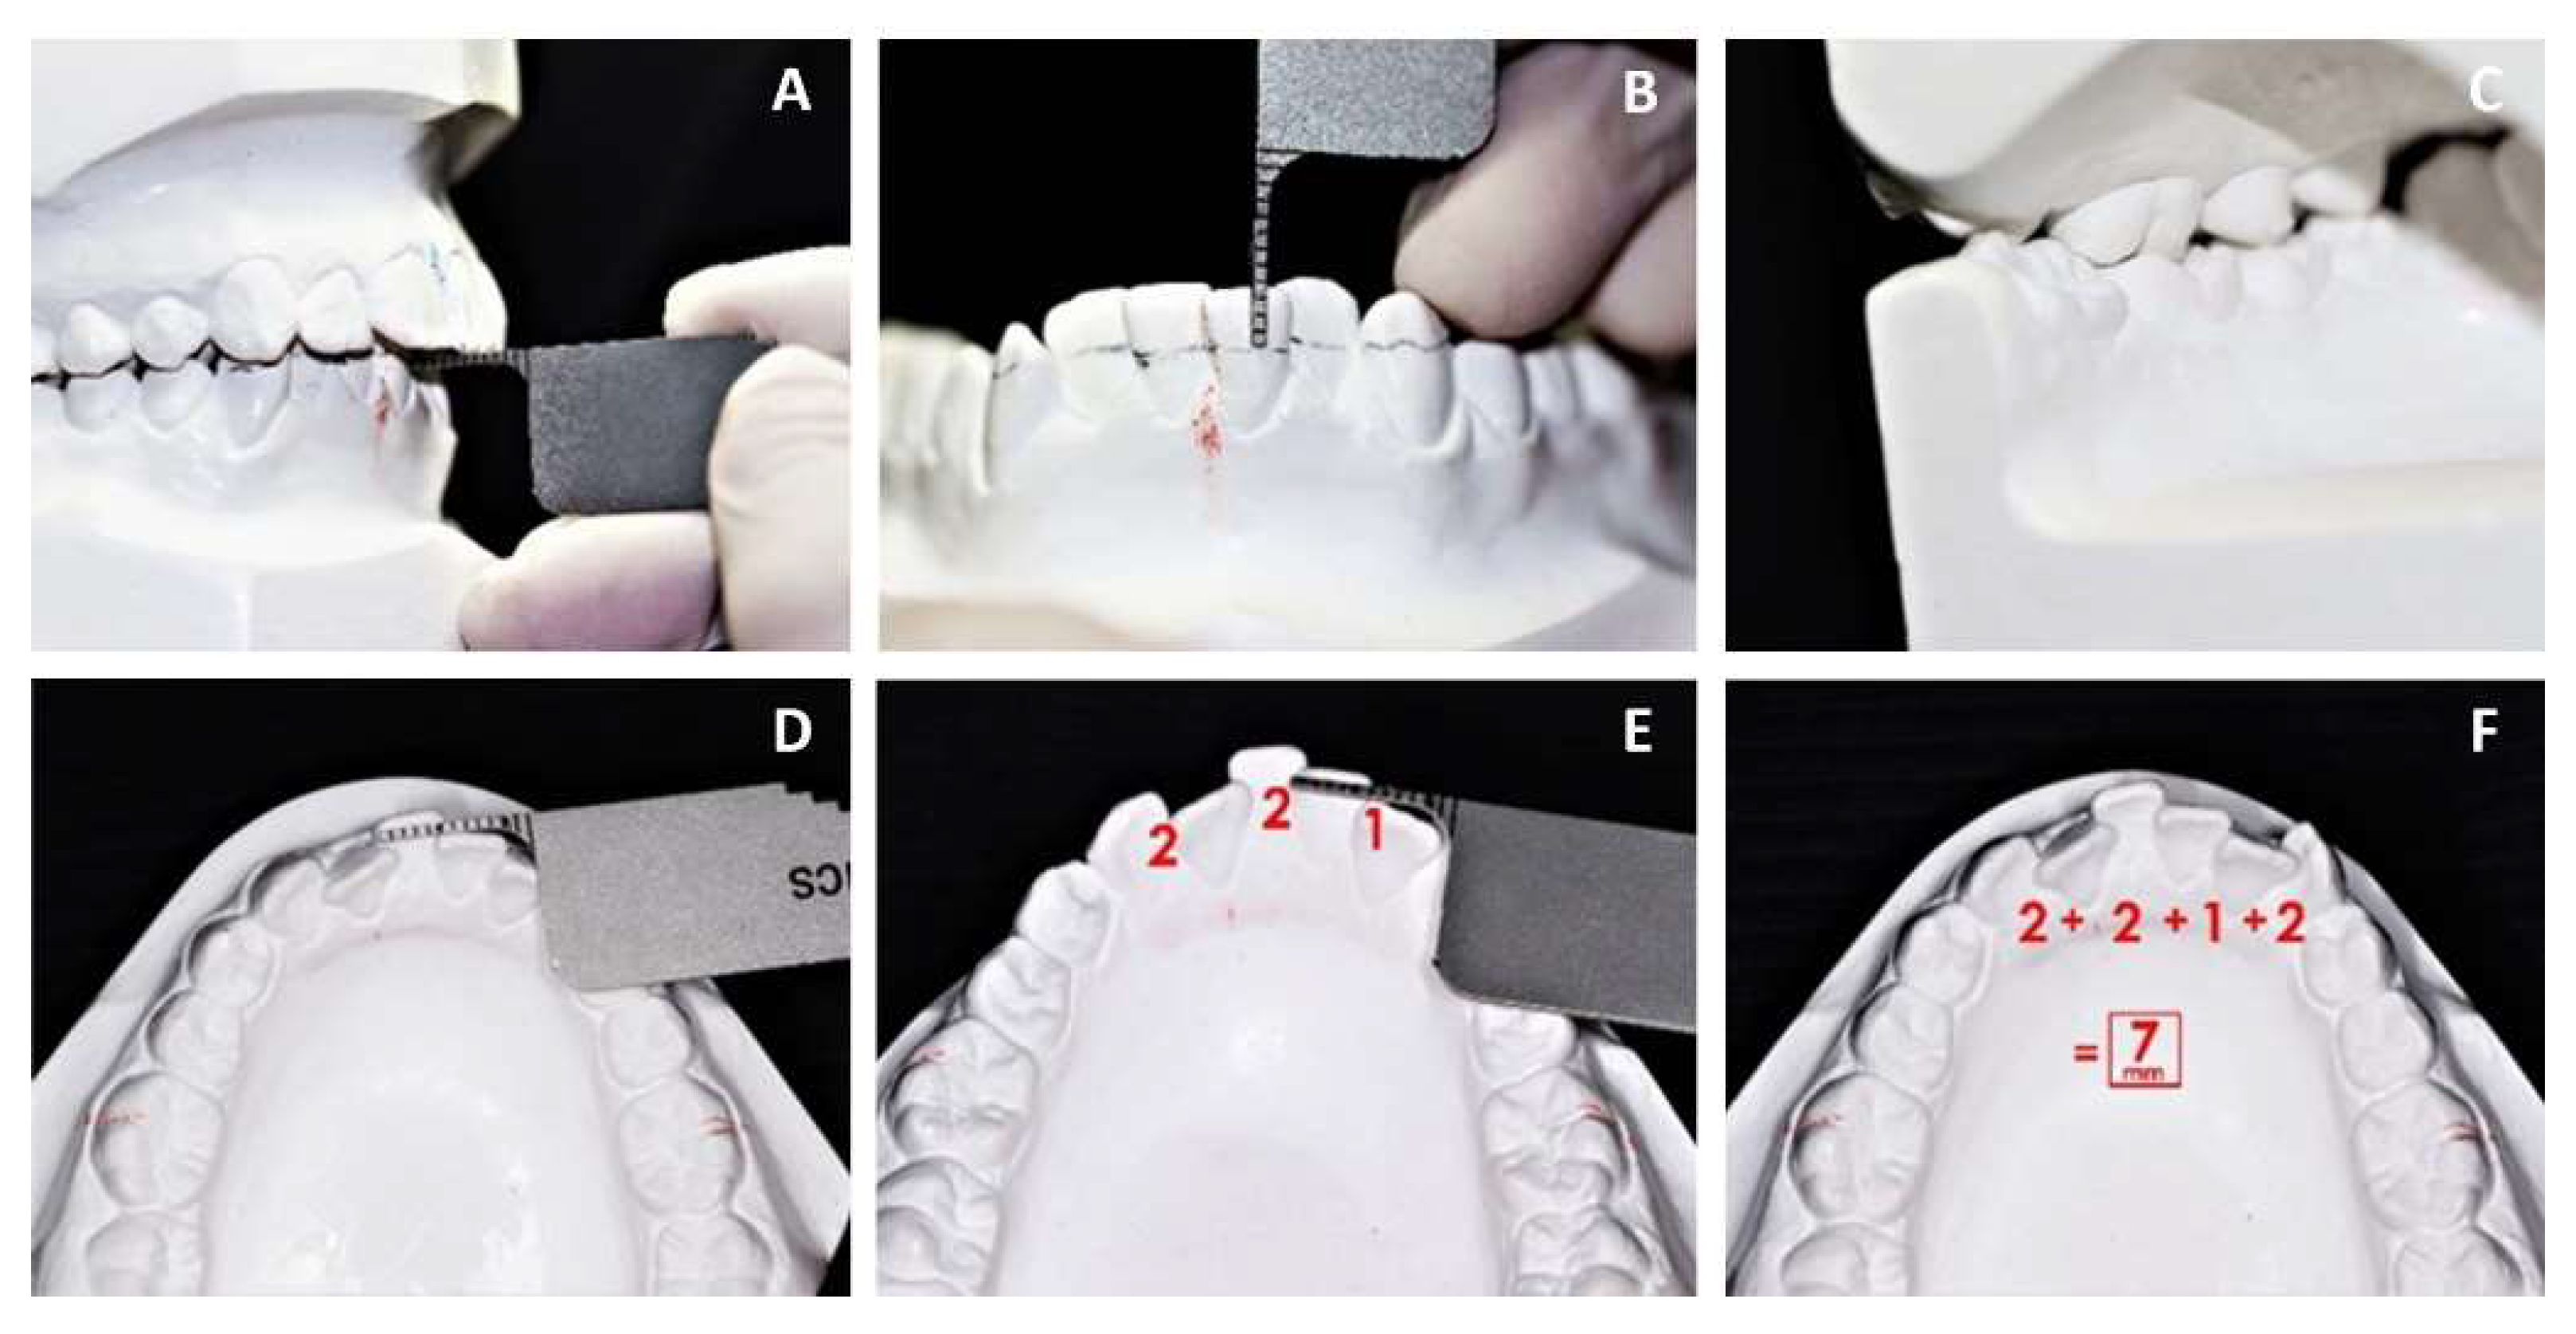
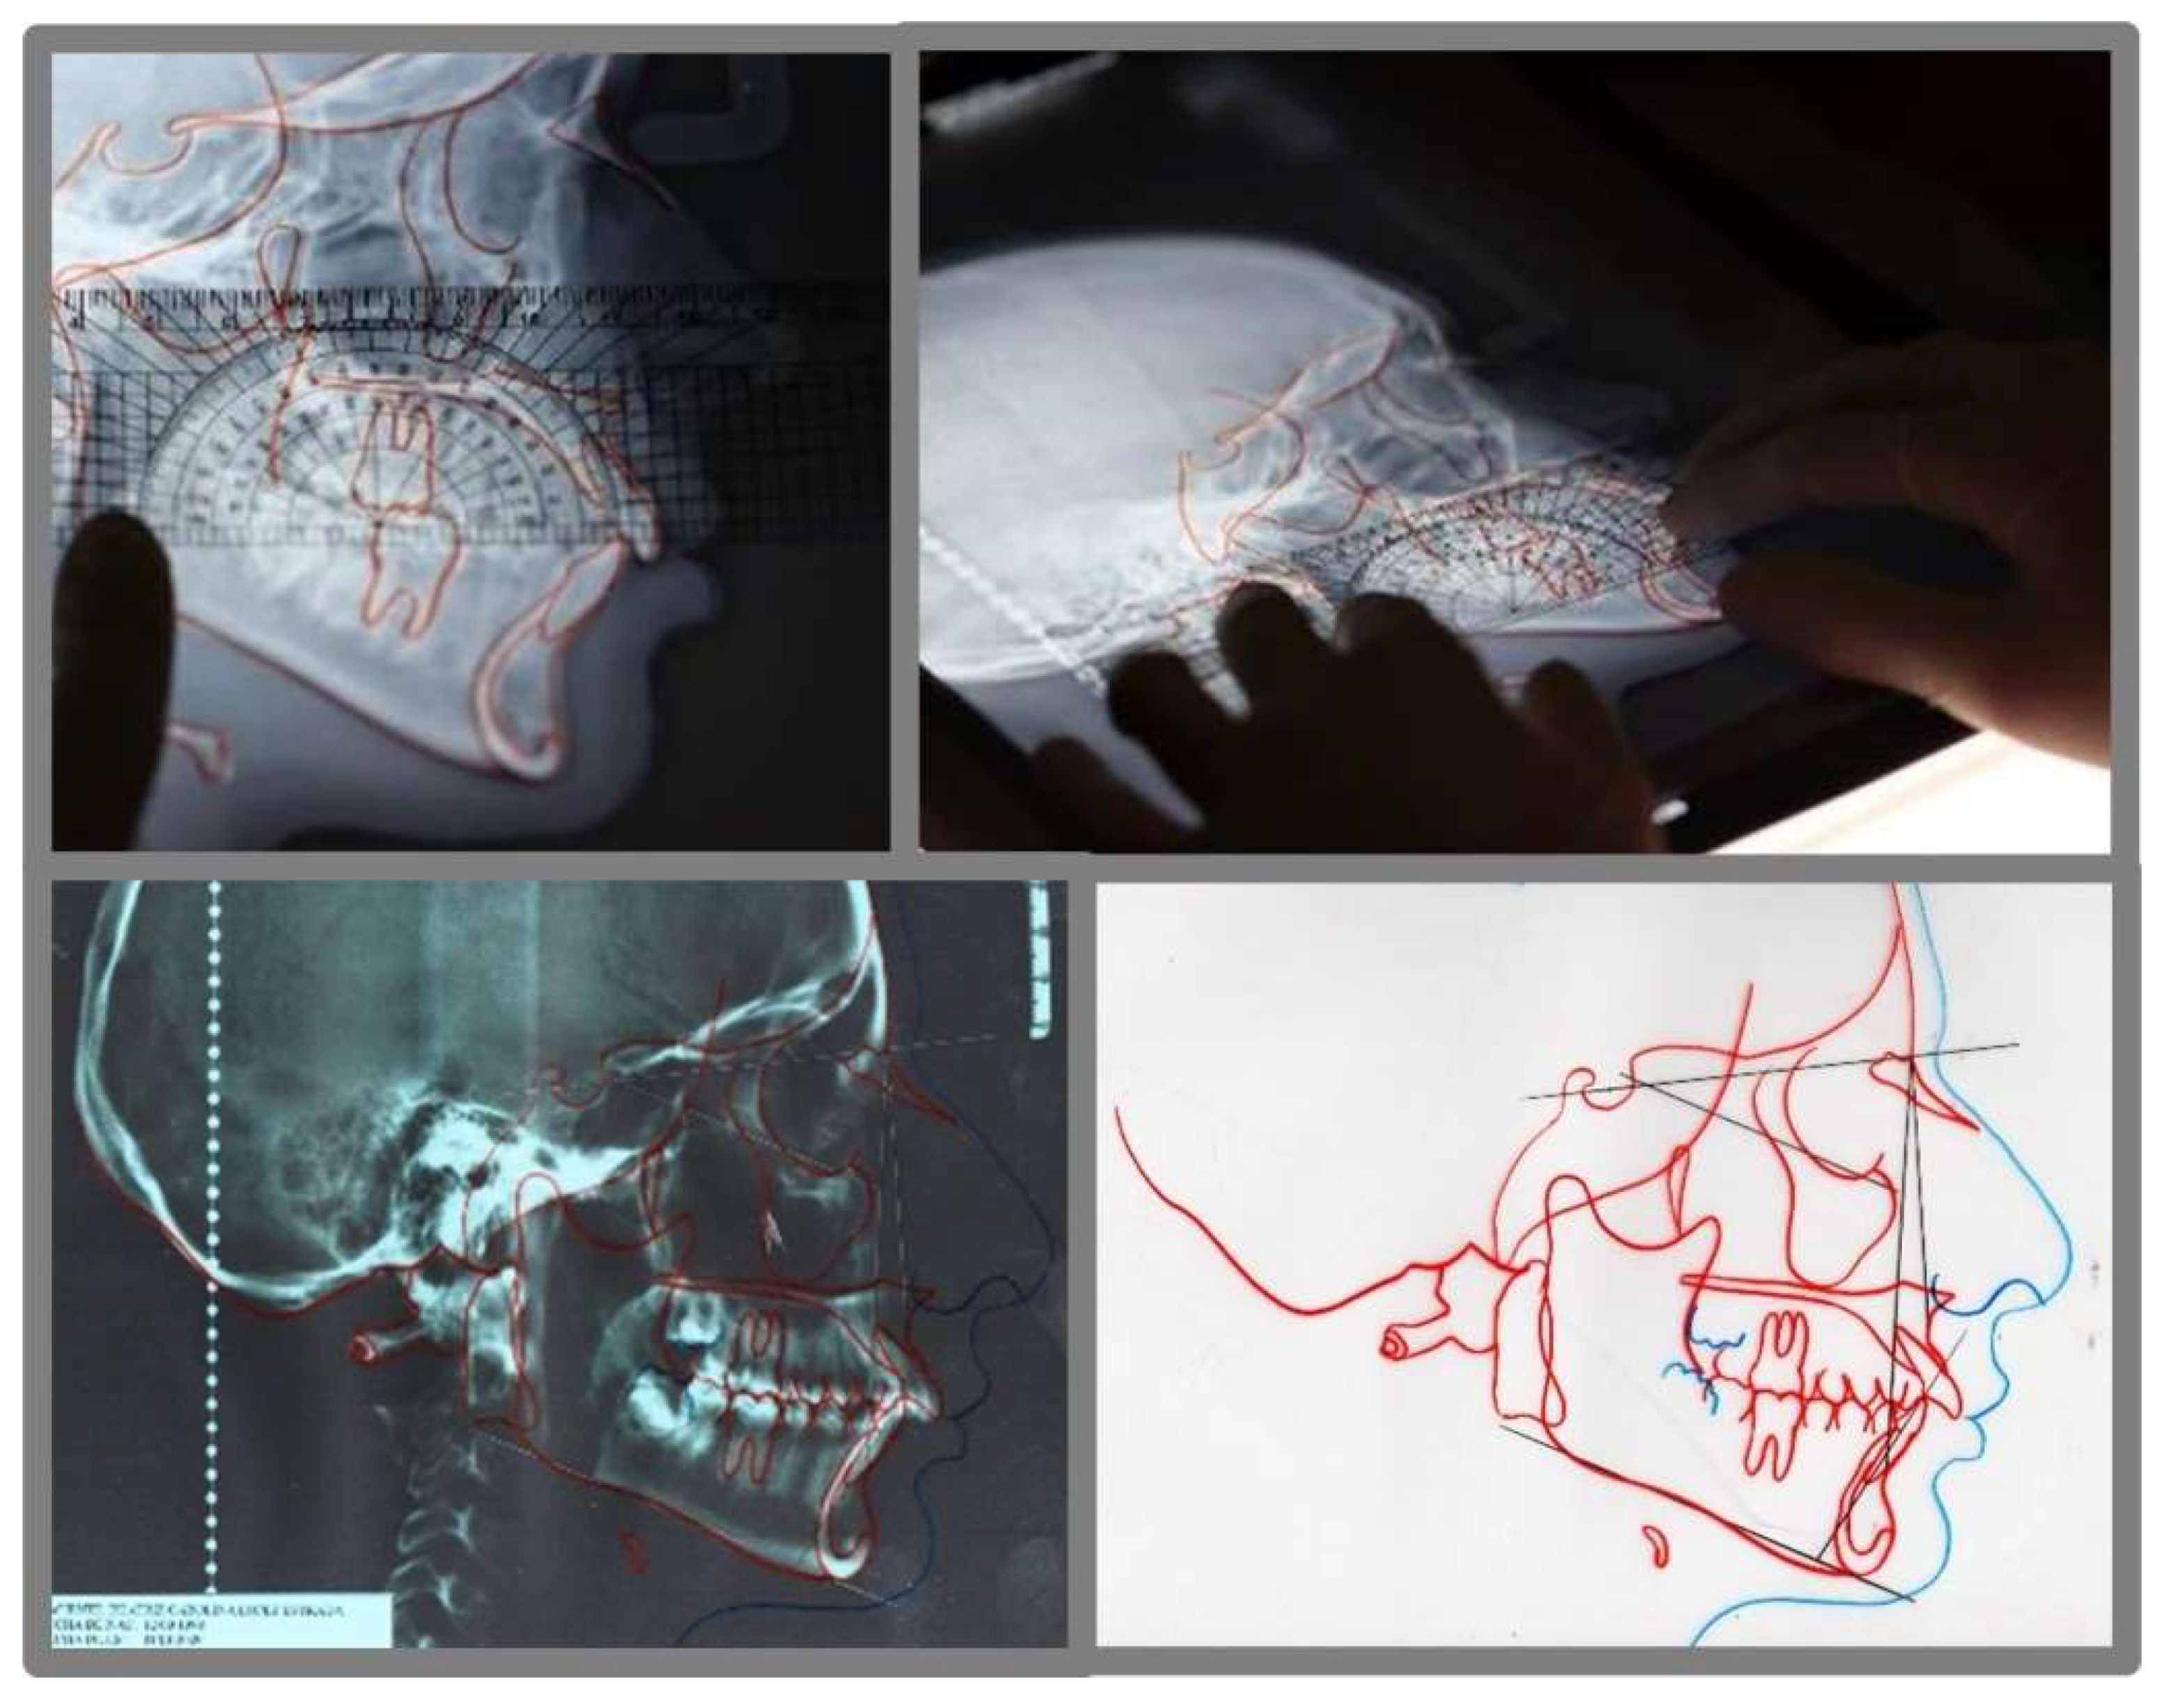
Manual measurements were performed with the ABO calibrated ruler, which is specially designed to determine the discrepancy index (Figure 3). Appropriately, cut study models were used and were placed on a flat surface and in maximum intercuspation for analysis. Concerning cephalometry, a lateral skull radiograph was used; the radiograph was traced on paper using a negatoscope to determine the ANB angle, SN-MP angle and 1 ¯ to MP angle (Figure 4). Printed photographs and radiographs were used to score the “other” section.
The discrepancy index was measured according to the instructions published on the website https://www.americanboardortho.com, last updated on 3 August 2015 and accessed June 2020. The sections that were evaluated to obtain the final discrepancy index score and the techniques used to complete its various sections are shown in Table 1.

2.1. Interrater and Intrarater Reliability

Interrater and intrarater reliability were evaluated by selecting seven casts randomly. Intrarater reliability was completed by a primary investigator by manually measuring dental casts for all target disorders and summing the points awarded for the total DI scores twice, separated by a 2-week interval. Digital models corresponding to the same seven casts were measured and scored twice by the primary investigator using Insignia and Dolphin Imaging software for cephalometric tracing. Interrater reliability was achieved with a second examiner (R.J.S.V.). The same seven casts were sent to the second examiner, who manually measured all target disorders and computed the total DI scores digitally using the same software mentioned above.
After the reliability testing, the primary investigator measured 28 sets of the initial study models manually and digitally according to the same guidelines as described in the initial reliability testing. The accuracy of the digital DI scores was compared with the manual scores from the plaster casts.

2.2. Statistical Analysis

The data collected were processed using IBM SPSS statistical software (Version 25, IBM Corporation, New York, NY, USA). The intraclass correlation coefficient was performed to calculate Interrater and Intrarater reliability. The normality of the data was verified with the Shapiro–Wilk test. Student’s t-test was used to identify statistically significant differences between the final discrepancy index score obtained using digital versus manual techniques and for the scores of the 10 sections that comprise this index. p values ≤ 0.05 were considered significant. Kappa coefficient tests were also used to evaluate the concordance of the categorical measurements obtained from the instrument. The Bland–Altman method was used to determine the agreement of continuous measurements obtained from the final discrepancy index score using digital versus manual techniques.

3. Results

The results of intrarater reliability for the primary investigator, assessed with the intraclass correlation coefficient (ICC) showed repeated measurements with excellent agreement ICC ≥ 90 for all sections evaluated in discrepancy index except for the Buccal posterior crossbite section that was determined digitally (Table 2). Regarding interrater reliability, an excellent agreement was observed between the first and the second reviewer for all manual and digital sections of the discrepancy index, except for the Buccal posterior crossbite digital measurement (Table 3).
The analyzed data showed a normal distribution using the Shapiro–Wilk test (Table 4), and accordingly, the data were analyzed using parametric statistical tests.
The final score discrepancy index scores were classified as follows: mild (1–10), moderate (11–20), complex (21–30) and very complex (+31) according to the American Board of Orthodontics, clinical examination guide [14,15]. Table 5 shows the final discrepancy index score categorizations that were obtained using digital versus manual techniques for the 28 cases that were analyzed in this study. Discrepancies were observed for only one case.
To determine the categorical concordance of the different measurement techniques (digital and manual), the cases were grouped into two categories: simple treatment (mild and moderate) and complex treatment (complex and very complex). The 28 case studies included 12 simple and 16 complex cases (Table 5). High reliability was demonstrated by the Cohen kappa index, with a p value of 0.001 and a kappa value of 1.00, which corresponds to almost perfect agreement (0.80–1.00) according to the Landis and Koch scale.
Table 6 shows the average, standard deviation and Student’s t-test results for the final discrepancy index scores obtained digitally and manually and for the different sections that comprise the index. No statistically significant differences between the digital and manual approaches were observed for either the discrepancy index or any of the sections that comprise it; consequently, both techniques yielded very similar results.
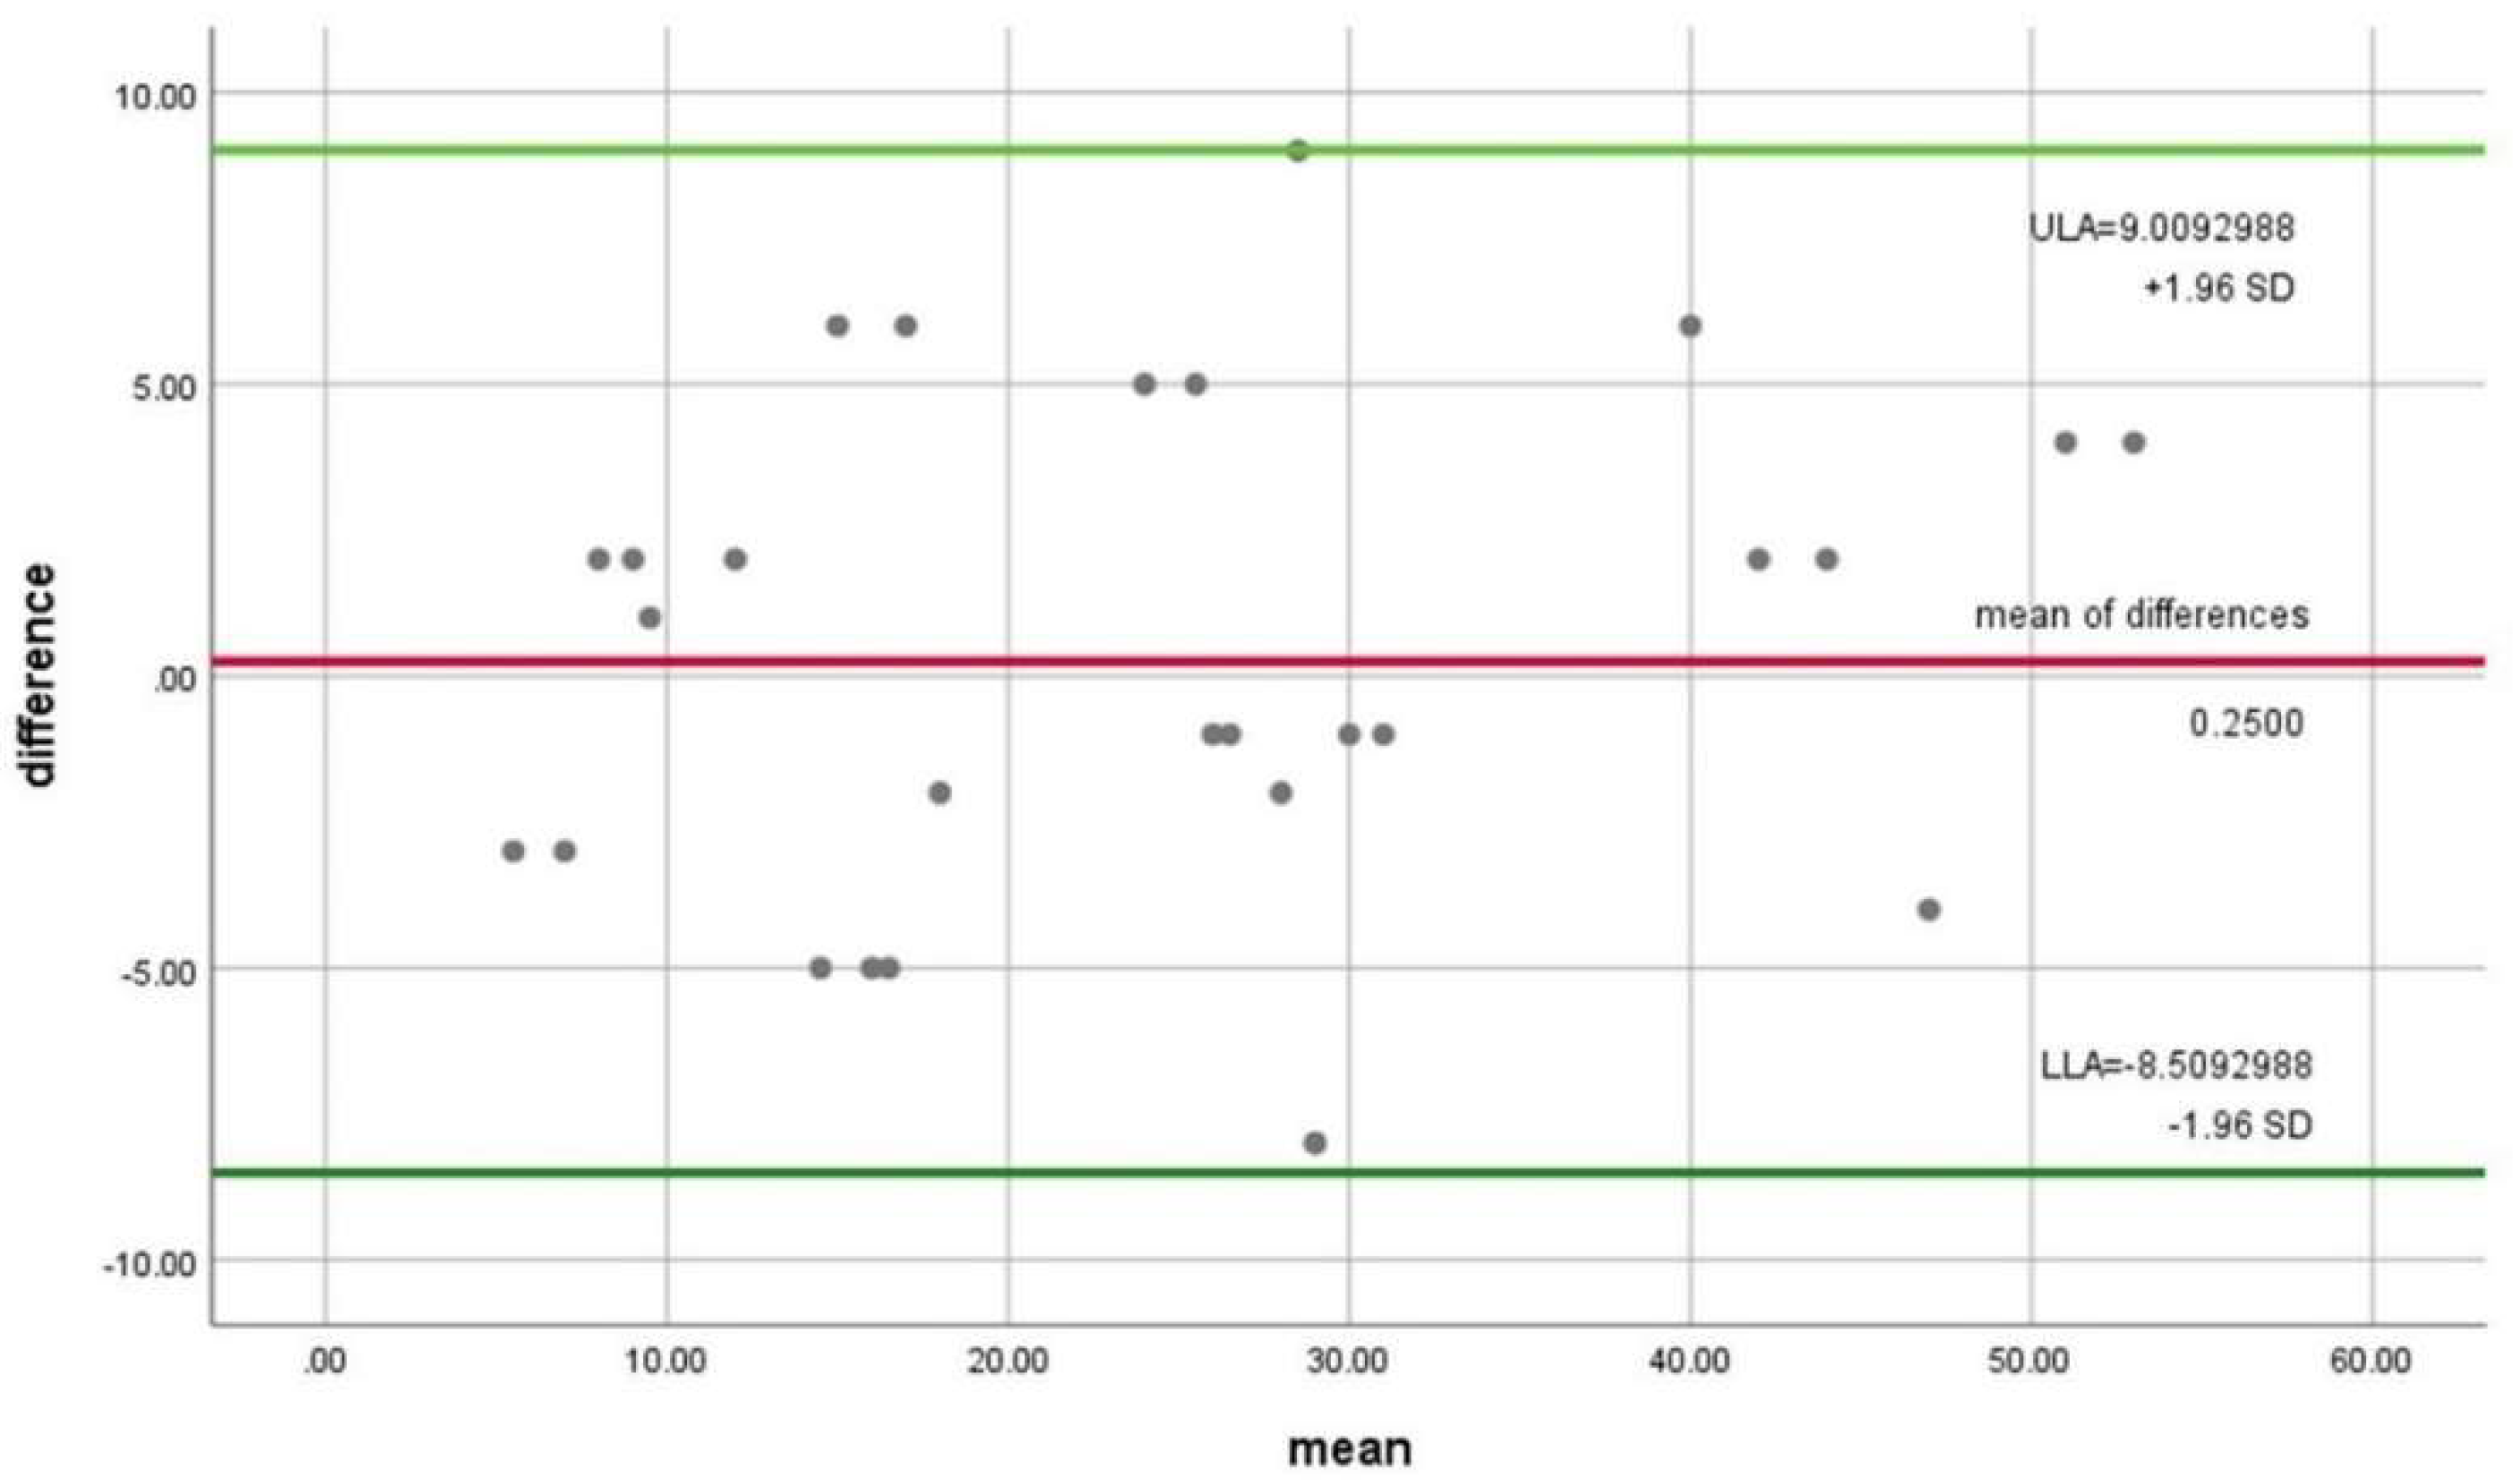
The Bland–Altman method was used to determine the agreement between continuous measurements obtained by digital and manual techniques. Table 7 shows the results of the Bland–Altman analysis with a low bias (0.2500), corresponding to the mean of the differences between both techniques. Similarly, the 95% limits of agreement (9.0092988 and −8.5092988 for the upper and lower limit respectively) can be observed.
The Bland–Altman plot (Figure 5) shows the difference scores of the two measurements against the mean for each subject, showing the 95% limits (upper limit of agreement “ULA” and lower limit of agreement “LLA”), which include 95% of differences between the two measurements for both methods, that resulted in a good agreement.

4. Discussion

When making an orthodontic diagnosis, it is advisable to consider the three main types of records that can be obtained from a patient (photographs, radiographs and study models) to obtain a clearer conceptualization of the initial diagnosis. Different indices have been developed to evaluate the complexity, which is focused on measuring the effort and skill to treat a patient; the main indices used in the orthodontic treatment are the Peer Assessment Rating index (PAR), the Index of Complexity, Outcome and Need (ICON) and the American Board of Orthodontics Discrepancy Index (ABO-DI), which is used in this study [16]. Previous studies have compared the different indices mentioned above with the objective of determining which is more accurate. However, most of these indices were based on a single type of diagnostic record (mainly dental casts) and did not take into account records such as radiographs and photographs [17,18]. Unlike these investigations mentioned previously, the ABO discrepancy index that was analyzed in this study considered these three elements together to obtain a more objective diagnosis, providing a broader picture of the diagnosis and treatment alternatives. ABO-DI has demonstrated excellent accuracy, even though it has been related in different studies to other factors involved in the orthodontic treatment such as the quality of life, the length of time required for orthodontic treatment and the comparison of results from different orthodontic treatment techniques [19,20,21,22].
In terms of photographs, some authors suggest that they are essential to orthodontic diagnosis and offer advantages such as documentation, treatment acceptance, collaboration and case follow-up [23]. Currently, the indices based on the analysis of photographs can be used to determine the need for orthodontic treatment [24,25]. Horriat et al., 2022 evaluated the agreement between the American Board of Orthodontics Objective Grading System (OGS) and the Peer Assessment Rating (PAR) applied to intraoral photographs and dental casts. A good to excellent inter and intrarater agreement were determined by an ICC, and regarding the ratings on dental casts and photographs, they concluded that the ABO discrepancy index method was more reliable [26]. In our study, interrater and intrarater reliability was also evaluated with an ICC higher than 0.90, which corresponds to an almost perfect agreement according to the Cohen kappa index and Landis and Koch scale.
On the other hand, in this study, photographs and scanned digital images allowed to virtually analyze the study models, as well, calculating the discrepancy index, and the results supported the similar diagnostic accuracy of digital images and dental casts.
Radiographs are another diagnostic element that has been widely studied, especially in terms of lateral skull imaging, which is used to determine the patient’s cephalometrics [27]. Farooq et al., 2016 compared the information obtained by using digital cephalometry with that obtained using conventional or manual cephalometric measurements in 50 patients and found that most of the measurements were equally accurate [28]. These results agree with those of this study since the cephalometric measurements obtained through specialized software and those obtained manually did not differ significantly.
Regarding the complexity of cases determined with ABO-DI, in our study 57.1% and 57.2% of participants for digital and manual techniques, respectively, had complex to very complex cases, which did not show any statistical difference regarding the different summaries used for measuring the discrepancy index between both techniques. Unlike our results, a recent study reported that 32% of participants had a high complexity case and no statistical differences in the discrepancy index between study groups (girls and boys) were observed [20].
Dental casts are the gold standard for orthodontic diagnosis. Some studies have evaluated the precision of different orthodontic measurements obtained from dental casts and 3D-printed casts [29]. However, a limitation of these studies is the use of a tabletop scanner to obtain 3D images of scanned dental casts because this method introduces the risk of replicating errors that may be present in the original casts; therefore, it is necessary to consider alternative methods for obtaining these records. The intraoral scanner is a key piece of equipment in the transition toward the digital development of diagnoses and treatment plans.
The precision and reliability of intraoral scanners have been evaluated in several studies by comparing their results with those obtained using conventional dental casts. The results obtained from intraoral scans appear to be reliable and accurate compared to those obtained from conventional impressions, with the additional advantage of eliminating the need for impression materials and increasing the personalization of treatment [30,31,32]. Yilmaz et al. 2019 evaluated the accuracy of measurements obtained with the TRIOS intraoral scanner and the 3 Shape OrthoAnalyzer software, compared with measurements obtained on conventional plaster models. No statistically significant difference between groups was observed. Although statistically significant differences were observed for the time needed to perform the analysis, being shorter with digital models [33]. Nevertheless, previous studies reported errors in measurements for occlusocervical mesiodistal and intercanine and intermolar widths with intraoral scanners when compared with their 3D printed counterparts and the conventional casts [34]. However, these errors are considered within the clinically acceptable level, and in this study, the agreement between intraoral scanners and conventional casts was considered a good agreement. Studies have reported on the accuracy and efficacy of intraoral scanners for the orthodontic purpose to provide clinically useful information [35]. The TRIOS intraoral scanner has demonstrated better precision when compared with other intraoral scanners such as Carestream CS3600 and Sirona Omnicam [36,37]. On the other hand, iTero showed better results than the extraoral scanner, Ortho Insight 3D, and similar reliability to the intraoral scanner, Lythos [38].
Regarding different scanning systems, studies have noted that there are no significant differences between digital models obtained through intraoral scanning and those obtained by scanning conventional dental casts based on impressions [39,40,41]. Other authors claim that when few measurements are obtained, intraoral scanning can be more accurate than scans of dental casts [42]. In the development of this study, two intraoral scanners were used to obtain the digital models to control possible bias and directly obtain oral anatomy records for each patient. These devices proved to be a reliable alternative for diagnosing and planning orthodontic treatment as no statistically significant differences were observed between the ABO discrepancy index scores that were obtained digitally and those obtained using conventional plaster models.
With respect to the different indices or analyses that provide a final score based on more than one type of diagnostic record, some studies have compared the analysis of digital models with the manual analysis of 3D printed models using ABO’s objective classification system for dental models and panoramic radiographs. These studies reported that the scores obtained using digital analysis were significantly higher than those obtained using manual analysis, especially for the alignment and rotation sections [43]. Such findings are inconsistent with those of our study, which found no difference between the scores based on manual measurements of plaster models and those obtained using the digital technique. This difference may be explained by the use of 3D printed models, which can differ from the original dimensions in a patient’s dental records [29]. A study developed in 2015 by Dragstrem et al. compared the discrepancy index between plaster and digital models using the software Ortho Insight 3D reporting a difference of 2.71 points between both techniques, whereas in our study, a difference of 0.25 was observed, which indicates the necessity to constantly assess the digital diagnostic systems considering the pace of technological developments suggests that in the future, these differences will be imperceptible, and the results of this study could be a sample for the aforesaid technological advances. In addition, conferring future research in which various digital diagnostic systems can be compared, such as the Ortho Insight 3D and Dolphin Imaging systems used in our study [44].
Some limitations were encountered during the present study. Digital diagnostic methodology is considered expensive for most the patients; consequently, a reduced number of samples were obtained. Meanwhile, a considerable decrease in the patient number was observed due to the COVID-19 pandemic. However, the sample number was considered adequate, confirmed by the normality test, showing a normal distribution (Table 2).

5. Conclusions

We conclude that high reliability was demonstrated by the Cohen kappa index, which corresponds to an almost perfect agreement according to Landis and Koch scale. As well, establishing that intraoral scanning and digital orthodontic records are as efficient as conventional records and offer a viable alternative that allows orthodontists to perform adequate diagnosis and treatment planning. Additionally, the advantages of digital measurement should be considered; these include the elimination of storage problems and the risk of fracture associated with dental casts and the possibility of sharing radiographs and digital records with other dental health professionals to provide comprehensive patient care.

Author Contributions

Conceptualization, N.A.B.-A. and E.N.S.-V.; methodology, N.A.B.-A. and U.V.-E.; formal analysis, E.N.S.-V.; writing—original draft, E.N.S.-V.; project administration, E.N.S.-V.; visualization, R.J.S.-V. and W.H.-H.; supervision, R.J.S.-V.; software, A.A.M.-V.; validation, A.A.M.-V. and V.H.T.-R.; data curation, E.L.-C. and U.V.-E.; resources E.L.-C.; investigation, N.A.B.-A. and V.H.T.-R.; writing—review and editing, W.H.-H. and E.N.S.-V. All authors have read and agreed to the published version of the manuscript.

Funding

This research received no external funding.

Institutional Review Board Statement

The study was conducted in accordance with the Declaration of Helsinki and approved by the bioethics committee of the Center for Research and Advanced Studies in Dentistry (CEICIEAO-2021-005), School of Dentistry, Autonomous University of Mexico State for studies involving humans.

Informed Consent Statement

Informed consent was obtained from all subjects involved in the study. Written informed consent has been obtained from the patient to publish this paper.

Data Availability Statement

Not applicable.

Conflicts of Interest

The authors declare no conflict of interest.

References

  1. Barreto, G.M.; Feitosa, H.O. Iatrogenics in Orthodontics and Its Challenges. Dental Press J. Orthod. 2016, 21, 114–125. [Google Scholar] [CrossRef] [Green Version]
  2. Khandakji, M.N.; Ghafari, J.G. Evaluation of Commonly Used Occlusal Indices in Determining Orthodontic Treatment Need. Eur. J. Orthod. 2020, 42, 107–114. [Google Scholar] [CrossRef]
  3. Kwak, J.H.; Chen, E. An Overview of the American Board of Orthodontics Certification Process. APOS Trends Orthod. 2018, 8, 14–20. [Google Scholar] [CrossRef]
  4. Rossini, G.; Parrini, S.; Castroflorio, T.; Deregibus, A.; Debernardi, C.L. Diagnostic Accuracy and Measurement Sensitivity of Digital Models for Orthodontic Purposes: A Systematic Review. Am. J. Orthod. Dentofac. Orthop. 2016, 149, 161–170. [Google Scholar] [CrossRef]
  5. Camardella, L.T.; Vilella, O.V.; van Hezel, M.M.; Breuning, K.H. Genauigkeit von Stereolitographisch Gedruckten Digitalen Modellen Im Vergleich Zu Gipsmodellen. J. Orofac. Orthop. 2017, 78, 394–402. [Google Scholar] [CrossRef]
  6. Kihara, H.; Hatakeyama, W.; Komine, F.; Takafuji, K.; Takahashi, T.; Yokota, J.; Oriso, K.; Kondo, H. Accuracy and Practicality of Intraoral Scanner in Dentistry: A Literature Review. J. Prosthodont. Res. 2020, 64, 109–113. [Google Scholar] [CrossRef]
  7. Mangano, F.; Gandolfi, A.; Luongo, G.; Logozzo, S. Intraoral Scanners in Dentistry: A Review of the Current Literature. BMC Oral Health 2017, 17, 149. [Google Scholar] [CrossRef] [Green Version]
  8. Bohner, L.; Gamba, D.D.; Hanisch, M.; Marcio, B.S.; Tortamano Neto, P.; Laganá, D.C.; Sesma, N. Accuracy of Digital Technologies for the Scanning of Facial, Skeletal, and Intraoral Tissues: A Systematic Review. J. Prosthet. Dent. 2019, 121, 246–251. [Google Scholar] [CrossRef]
  9. Park, S.H.; Byun, S.H.; Oh, S.H.; Lee, H.L.; Kim, J.W.; Yang, B.E.; Park, I.Y. Evaluation of the Reliability, Reproducibility and Validity of Digital Orthodontic Measurements Based on Various Digital Models among Young Patients. J. Clin. Med. 2020, 9, 2728. [Google Scholar] [CrossRef]
  10. Sun, L.J.; Lee, J.S.; Choo, H.H.; Hwang, H.S.; Lee, K.M. Reproducibility of an Intraoral Scanner: A Comparison between In-Vivo and Ex-Vivo Scans. Am. J. Orthod. Dentofac. Orthop. 2018, 154, 305–310. [Google Scholar] [CrossRef] [Green Version]
  11. Brown, M.W.; Koroluk, L.; Ko, C.C.; Zhang, K.; Chen, M.; Nguyen, T. Effectiveness and Efficiency of a CAD/CAM Orthodontic Bracket System. Am. J. Orthod. Dentofac. Orthop. 2015, 148, 1067–1074. [Google Scholar] [CrossRef] [Green Version]
  12. Schafer, S.M.; Maupome, G.; Eckert, G.J.; Roberts, W.E. Discrepancy Index Relative to Age, Sex, and the Probability of Completing Treatment by One Resident in a 2-Year Graduate Orthodontics Program. Am. J. Orthod. Dentofac. Orthop. 2011, 139, 70–73. [Google Scholar] [CrossRef]
  13. Alsaeed, S.A.; Kennedy, D.B.; Aleksejuniene, J.; Yen, E.H.; Pliska, B.T.; Flanagan, D.C. Outcomes of Orthodontic Treatment Performed by Individual Orthodontists vs 2 Orthodontists Collaborating on Treatment. Am. J. Orthod. Dentofac. Orthop. 2020, 158, 59–67. [Google Scholar] [CrossRef]
  14. Cangialosi, T.J.; Riolo, M.L.; Owens, S.E.; Dykhouse, V.J.; Moffitt, A.H.; Grubb, J.E.; Greco, P.M.; English, J.D.; James, R.D. The ABO Discrepancy Index: A Measure of Case Complexity. Am. J. Orthod. Dentofac. Orthop. 2004, 125, 270–278. [Google Scholar] [CrossRef]
  15. American Board of Orthodontics. The ABO Discrepancy Index (DI) A Measure of Case Complexity. J. World Fed. Orthodont. 2016, 11, 270–278. [Google Scholar]
  16. Plaza, S.P.; Aponte, C.M.; Bejarano, S.R.; Martínez, Y.J.; Serna, S.; Barbosa-Liz, D.M. Relationship between the Dental Aesthetic Index and Discrepancy Index. J. Orthod. 2020, 47, 213–222. [Google Scholar] [CrossRef]
  17. Liu, S.; Oh, H.; Chambers, D.W.; Baumrind, S.; Xu, T. Validity of the American Board of Orthodontics Discrepancy Index and the Peer Assessment Rating Index for Comprehensive Evaluation of Malocclusion Severity. Orthod. Craniofacial Res. 2017, 20, 140–145. [Google Scholar] [CrossRef]
  18. Azeem, M.; Ahmad, A.; ul Haq, A. Orthodontic Treatment; orthodontic treatment need at Faisalabad Medical University and de’Montmorency College of Dentistry. Prof. Med. J. 2018, 25, 1013–1017. [Google Scholar] [CrossRef]
  19. Parrish, L.D.; Roberts, W.E.; Maupome, G.; Stewart, K.T.; Bandy, R.W.; Kula, K.S. The Relationship between the ABO Discrepancy Index and Treatment Duration in a Graduate Orthodontic Clinic. Angle Orthod. 2011, 81, 192–197. [Google Scholar] [CrossRef]
  20. Swan, M.; Tabbaa, S.; Buschang, P.; Toubouti, Y.; Bashir, R. Correlation between Adolescent Orthodontic Quality of Life and ABO Discrepancy Index in an Orthodontic Treatment-Seeking Population: A Cross-Sectional Study. J. Orthod. 2021, 48, 360–370. [Google Scholar] [CrossRef]
  21. Vu, C.Q.; Roberts, W.E.; Hartsfield, J.K.; Ofner, S. Treatment Complexity Index for Assessing the Relationship of Treatment Duration and Outcomes in a Graduate Orthodontics Clinic. Am. J. Orthod. Dentofacial Orthop. 2008, 133, 9.e1–13. [Google Scholar] [CrossRef]
  22. Ata-Ali, F.; Ata-Ali, J.; Lanuza-Garcia, A.; Ferrer-Molina, M.; Melo, M.; Plasencia, E. Clinical Outcomes of Lingual Fully Customized vs Labial Straight Wire Systems: Assessment Based on American Board of Orthodontics Criteria. J. Orofac. Orthop. 2021, 82, 13–22. [Google Scholar] [CrossRef]
  23. Wagner, D.J. A Beginning Guide for Dental Photography: A Simplified Introduction for Esthetic Dentistry. Dent. Clin. North Am. 2020, 64, 669–696. [Google Scholar] [CrossRef]
  24. de Oliveira Meira, A.C.L.; Custodio, W.; Vedovello Filho, M.; Borges, T.M.; de Marcelo, M.; Santamaria, M.; Vedovello, S.A.S. How Is Orthodontic Treatment Need Associated with Perceived Esthetic Impact of Malocclusion in Adolescents? Am. J. Orthod. Dentofac. Orthop. 2020, 158, 668–673. [Google Scholar] [CrossRef]
  25. López, M.F.C.; Rojo, M.F.G.; Rojo, J.F.G.; García, A.R.R. Comparación de Los Índices ICON y El Componente Estético Del IOTN Para Determinar La Necesidad de Tratamiento Ortodóncico. Rev. Mex. Ortod. 2017, 5, 11–14. [Google Scholar] [CrossRef]
  26. Horriat, M.; Bailey, N.; Atout, B.; Santos, P.B.; de Sa Leitao Pinheiro, F.H. American Board of Orthodontics (ABO) Discrepancy Index and Peer Assessment Rating (PAR) Index with Models versus Photographs. J. World Fed. Orthod. 2022, 11, 83–89. [Google Scholar] [CrossRef]
  27. Kunz, F.; Stellzig-Eisenhauer, A.; Zeman, F.; Boldt, J. Artificial Intelligence in Orthodontics: Evaluation of a Fully Automated Cephalometric Analysis Using a Customized Convolutional Neural Network. J. Orofac. Orthop. 2020, 81, 52–68. [Google Scholar] [CrossRef]
  28. Farooq, M.U. Assessing the Reliability of Digitalized Cephalometric Analysis in Comparison with Manual Cephalometric Analysis. J. Clin. Diagn. Res. 2016, 10, 20–23. [Google Scholar] [CrossRef]
  29. Koretsi, V.; Kirschbauer, C.; Proff, P.; Kirschneck, C. Reliability and Intra-Examiner Agreement of Orthodontic Model Analysis with a Digital Caliper on Plaster and Printed Dental Models. Clin. Oral Investig. 2019, 23, 3387–3396. [Google Scholar] [CrossRef]
  30. Aragón, M.L.C.; Pontes, L.F.; Bichara, L.M.; Flores-Mir, C.; Normando, D. Validity and Reliability of Intraoral Scanners Compared to Conventional Gypsum Models Measurements: A Systematic Review. Eur. J. Orthod. 2016, 38, 429–434. [Google Scholar] [CrossRef]
  31. Jheon, A.H.; Oberoi, S.; Solem, R.C.; Kapila, S. Moving towards Precision Orthodontics: An Evolving Paradigm Shift in the Planning and Delivery of Customized Orthodontic Therapy. Orthod. Craniofac. Res. 2017, 20, 106–113. [Google Scholar] [CrossRef]
  32. Rajshekar, M.; Julian, R.; Williams, A.M.; Tennant, M.; Forrest, A.; Walsh, L.J.; Wilson, G.; Blizzard, L. The Reliability and Validity of Measurements of Human Dental Casts Made by an Intra-Oral 3D Scanner, with Conventional Hand-Held Digital Callipers as the Comparison Measure. Forensic Sci. Int. 2017, 278, 198–204. [Google Scholar] [CrossRef]
  33. Yılmaz, H.; Özlü, F.Ç.; Karadeniz, C.; Karadeniz, E.İ. Efficiency and Accuracy of Three-Dimensional Models Versus Dental Casts: A Clinical Study. Turk. J. Orthod. 2019, 32, 214–218. [Google Scholar] [CrossRef]
  34. Ellakany, P.; Al-Harbi, F.; El Tantawi, M.; Mohsen, C. Evaluation of the Accuracy of Digital and 3D-Printed Casts Compared with Conventional Stone Casts. J. Prosthet. Dent. 2022, 127, 438–444. [Google Scholar] [CrossRef]
  35. Jedliński, M.; Mazur, M.; Grocholewicz, K.; Janiszewska-Olszowska, J. 3D Scanners in Orthodontics-Current Knowledge and Future Perspectives-A Systematic Review. Int. J. Environ. Res. Public Health 2021, 18, 1121. [Google Scholar] [CrossRef]
  36. Song, J.; Kim, M. Accuracy on Scanned Images of Full Arch Models with Orthodontic Brackets by Various Intraoral Scanners in the Presence of Artificial Saliva. Biomed Res. Int. 2020, 2020, 2920804. [Google Scholar] [CrossRef] [Green Version]
  37. Winkler, J.; Gkantidis, N. Trueness and Precision of Intraoral Scanners in the Maxillary Dental Arch: An In Vivo Analysis. Sci. Rep. 2020, 10, 1172. [Google Scholar] [CrossRef] [Green Version]
  38. Jacob, H.B.; Wyatt, G.D.; Buschang, P.H. Reliability and Validity of Intraoral and Extraoral Scanners. Prog. Orthod. 2015, 16, 38. [Google Scholar] [CrossRef] [Green Version]
  39. Burzynski, J.A.; Firestone, A.R.; Beck, F.M.; Fields, H.W.; Deguchi, T. Comparison of Digital Intraoral Scanners and Alginate Impressions: Time and Patient Satisfaction. Am. J. Orthod. Dentofac. Orthop. 2018, 153, 534–541. [Google Scholar] [CrossRef]
  40. Ko, H.C.; Liu, W.; Hou, D.; Torkan, S.; Spiekerman, C.; Huang, G.J. Agreement of Treatment Recommendations Based on Digital vs Plaster Dental Models. Am. J. Orthod. Dentofac. Orthop. 2019, 155, 135–142. [Google Scholar] [CrossRef] [Green Version]
  41. Gül Amuk, N.; Karsli, E.; Kurt, G. Comparison of Dental Measurements between Conventional Plaster Models, Digital Models Obtained by Impression Scanning and Plaster Model Scanning. Int. Orthod. 2019, 17, 151–158. [Google Scholar] [CrossRef] [PubMed]
  42. Tomita, Y.; Uechi, J.; Konno, M.; Sasamoto, S.; Iijima, M.; Mizoguchi, I. Accuracy of Digital Models Generated by Conventional Impression/Plaster-Model Methods and Intraoral Scanning. Dent. Mater. J. 2018, 37, 628–633. [Google Scholar] [CrossRef] [PubMed] [Green Version]
  43. Scott, J.D.; English, J.D.; Cozad, B.E.; Borders, C.L.; Harris, L.M.; Moon, A.L.; Kasper, F.K. Comparison of Automated Grading of Digital Orthodontic Models and Hand Grading of 3-Dimensionally Printed Models. Am. J. Orthod. Dentofac. Orthop. 2019, 155, 886–890. [Google Scholar] [CrossRef] [PubMed] [Green Version]
  44. Dragstrem, K.; Galang-Boquiren, M.T.S.; Obrez, A.; Costa Viana, M.G.; Grubb, J.E.; Kusnoto, B. Accuracy of Digital American Board of Orthodontics Discrepancy Index Measurements. Am. J. Orthod. Dentofac. Orthop. 2015, 148, 60–66. [Google Scholar] [CrossRef]
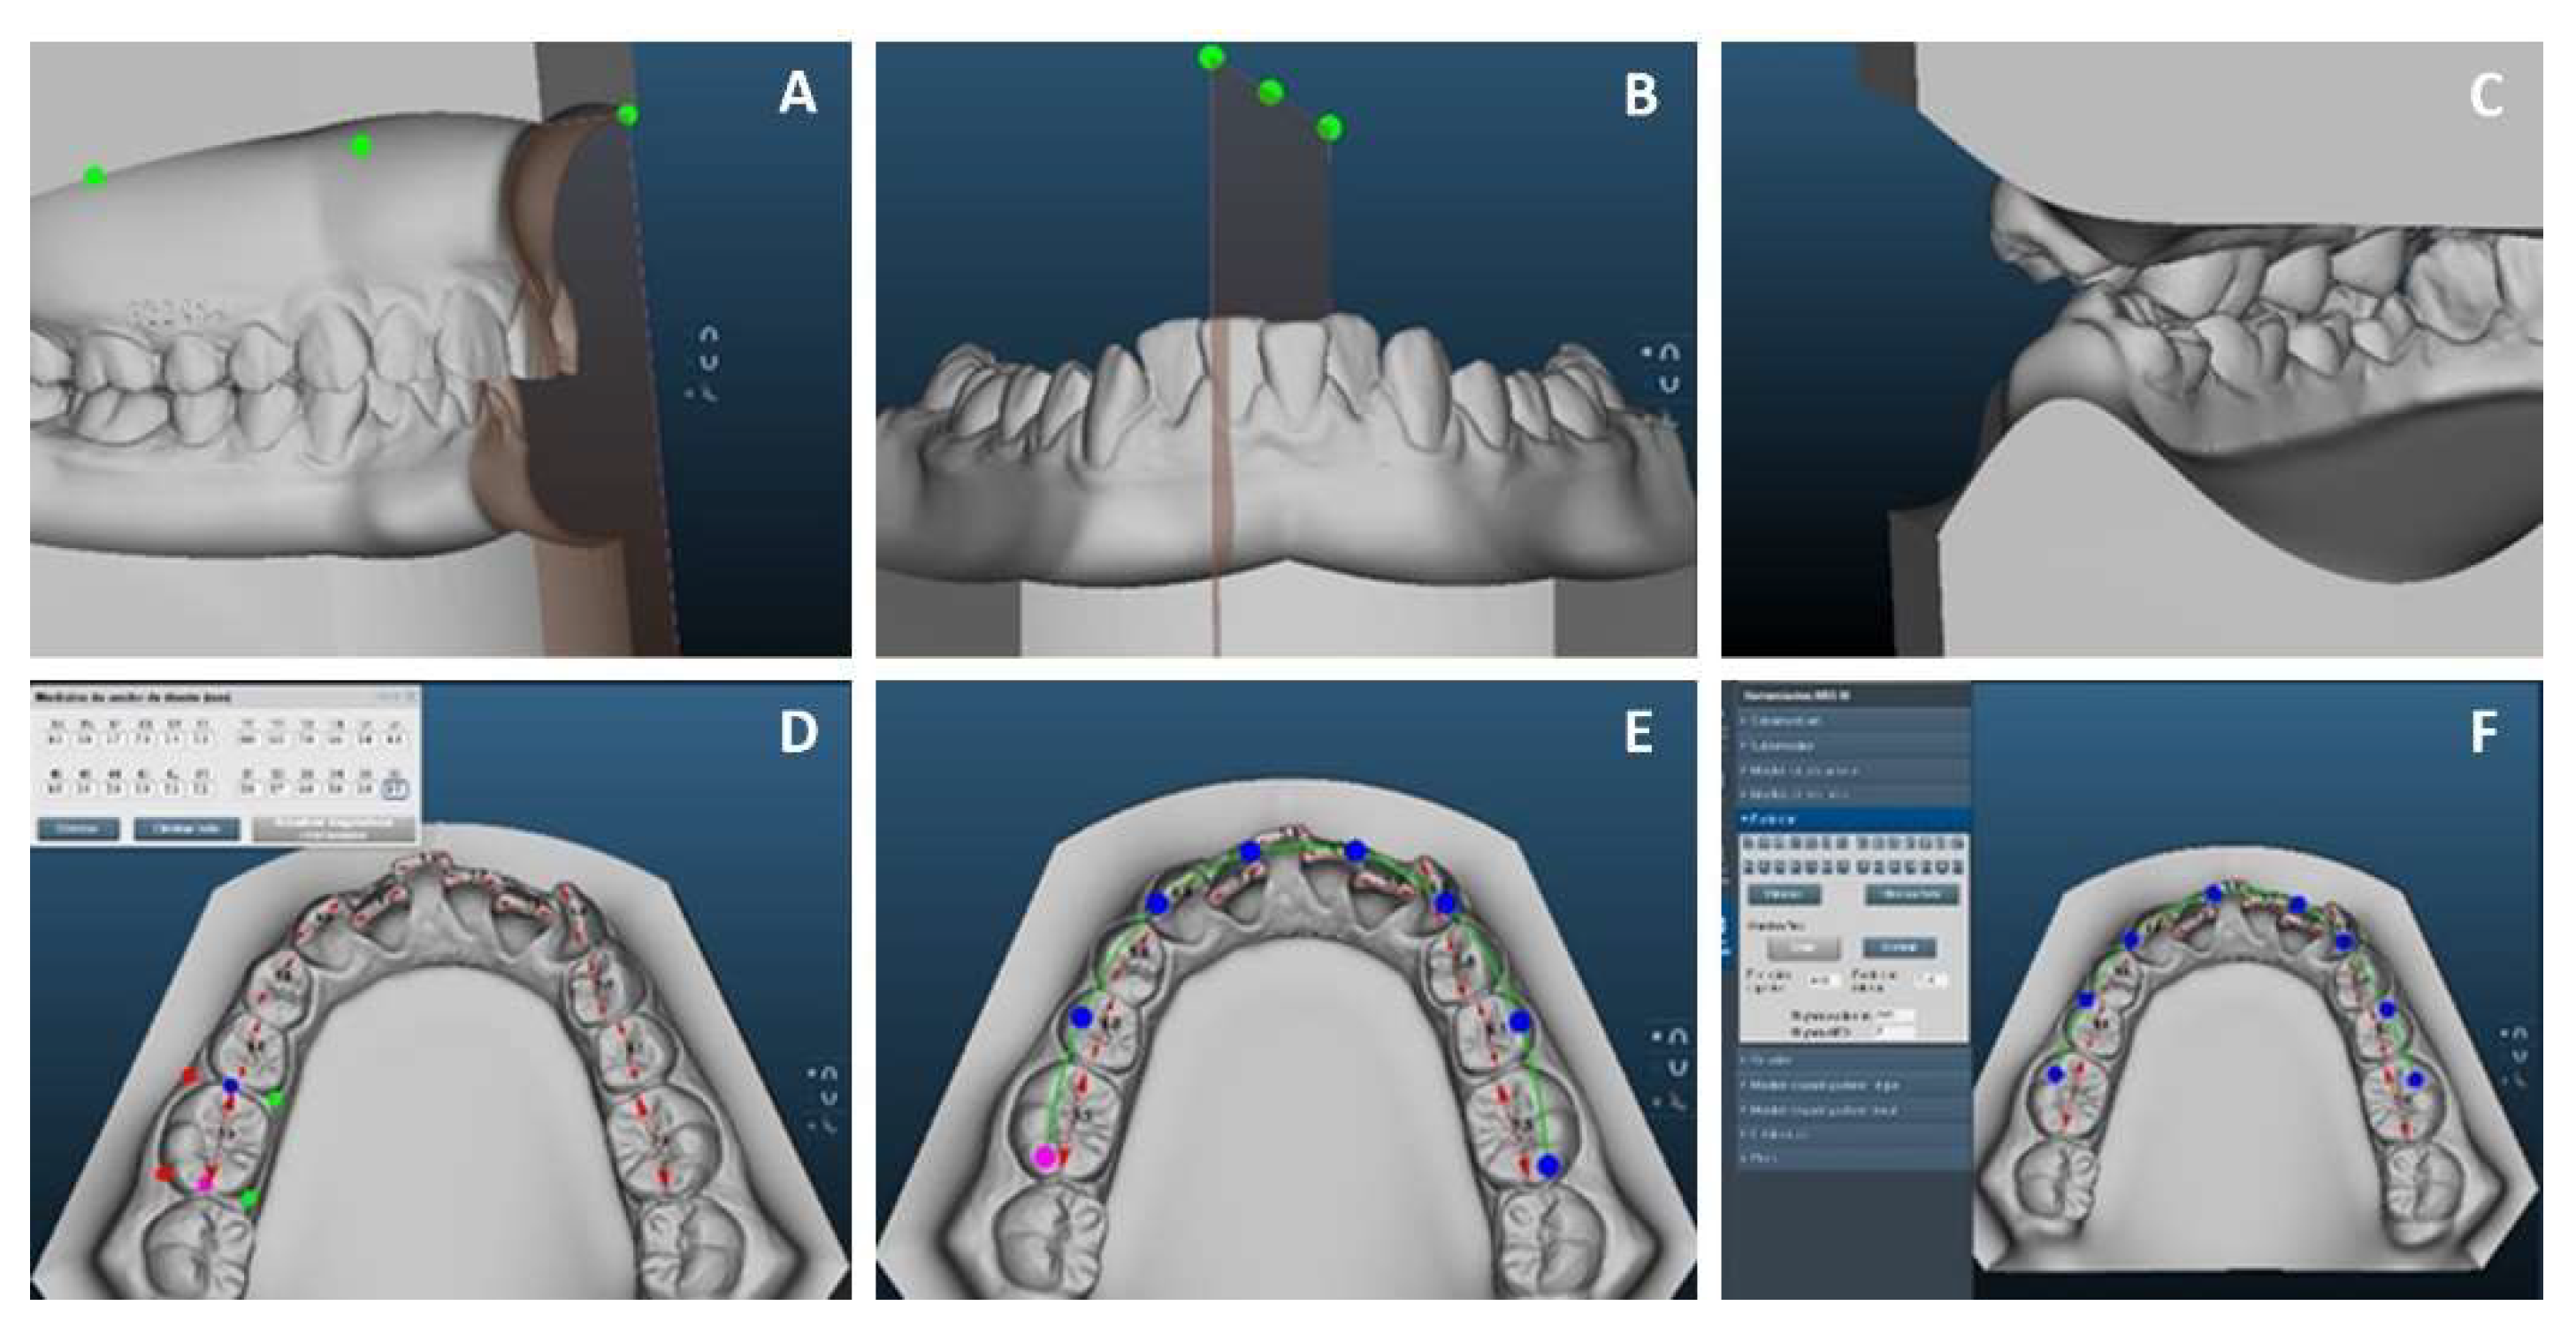
Figure 1. (A,B) Digital overjet and overbite measurement. (C) Posterior view of buccal posterior crossbite for digital measurement. (D) Tooth width measurement in Digicast®. (E) Preparation of the ideal arch to determine the required space. (F) Digicast® section to digitally measure crowding.
Applsci 12 06105 g001
Figure 2. Digital tracing with the Dolphin Imaging Software 9.0.
Applsci 12 06105 g002
Figure 3. (A,B) Manual overjet and overbite measurement. (C) Posterior view of buccal posterior crossbite for manual measurement. (DF) Manual measurement of crowding.
Applsci 12 06105 g003
Figure 4. Manual tracing using printed radiograph and tracing ruler.
Applsci 12 06105 g004
Figure 5. Bland-Altman plot of agreement between results obtained from discrepancy index by digital and manual technique in the 28 study patients.
Applsci 12 06105 g005
Table 1. The discrepancy index score procedure.
SectionDiagnostic ElementsMeasurement Technique
The final discrepancy index scoreSum of the different sectionsThe points obtained for each section of the discrepancy index were added.
OverjetDigital/dental castsMeasured from the buccal surface of the most lingualized lower tooth to the middle of the incisal edge of the most vestibularized upper tooth.
(Figure 1A and Figure 3A)
OverbiteDigital/dental castsMeasured from the incisal edge of the upper tooth to the incisal edge of the lower central or lateral tooth. (Figure 1B and Figure 3B)
Anterior open biteDigital/dental castsMeasured from canine to canine, taking into account a ratio of ≥0 mm.
Lateral open biteDigital/dental castsEach maxillary posterior tooth was measured at a ratio of ≥0.5.
CrowdingMost crowded archThe most crowded arch was measured from the mesial contact point of the right first molar to the mesial contact point of the left first molar. (Figure 1D–F and Figure 3D–F)
Occlusal relationshipDigital/dental castsThe molar angle classification was used for each side of the model.
Lingual posterior crossbiteDigital/dental castsEach maxillary posterior tooth was measured where the maxillary buccal cusp is >0 mm lingual to the buccal cusp tip of the opposing tooth.
Buccal posterior crossbiteDigital/dental castsEach maxillary posterior tooth was measured where the maxillary palatal cusp is >0 mm buccal to the buccal cusp of the opposing tooth.
(Figure 1C and Figure 3C)
CephalometricsDigital and printed radiographsANB, SN-MP and 1 ¯ to MP angles.
OtherModels, radiographs, photographsOther conditions, which increase treatment complexity.
Table 2. Intrarater reliability test.
CategoryMean (SD) PR1Mean (SD) PR2CI 95% ILCI 95% SLCaICC
Manual Technique
Overjet2.57 (1.39)2.71 (1.38)0.9030.9970.9810.981 *
Overbite1.43 (1.39)1.29 (1.38)0.9030.9970.9810.981 *
Anterior open bite1.57 (3.04)1.43 (2.99)0.9800.9990.9960.996 *
Lateral open bite0.57 (1.51)0.43 (1.13)0.8960.9960.9800.980 *
Crowding3.14 (2.03)3.00 (2.00)0.9550.9980.9910.991 *
Occlusal relationship2.57 (1.90)2.43 (1.61)0.9410.9980.9880.988 *
Lingual posterior crossbite1.29 (1.49)1.43 (1.61)0.9240.9970.9850.985 *
Buccal posterior crossbite0.29 (0.75)0.43 (1.13)0.7950.9930.9600.960 *
Cephalometrics11.57 (9.65)11.29 (9.23)0.9951.0000.9990.999 *
Other4.29 (3.20)4.14 (3.07)0.9810.9990.9960.996 *
Final discrepancy index score29.29 (14.45)28.57 (13.90)0.9881.0000.9990.998 *
Digital Technique
Overjet3.14 (1.95)2.86 (1.67)0.9510.8760.9960.978 *
Overbite1.00 (1.29)1.14 (1.46)0.9020.9970.9810.981 *
Anterior open bite1.00 (1.91)0.86 (1.57)0.9400.9980.9880.988 *
Lateral open bite0.57 (1.51)0.71 (1.89)0.9370.9980.9880.988 *
Crowding3.14 (2.03)3.00 (2.00)0.9550.9980.9910.991 *
Occlusal relationship2.29 (1.79)2.43 (1.81)0.9430.9980.9890.989 *
Lingual posterior crossbite1.14 (1.21)1.29 (1.38)0.8900.9960.9780.978 *
Buccal posterior crossbite0.14 (0.378)0.29 (0.756)0.4300.9800.8890.889
Cephalometrics10.43 (9.41)10.29 (9.26)0.9981.0001.0001.000 *
Other3.43 (3.15)3.29 (3.09)0.9810.9990.9960.996 *
Final discrepancy index score26.99 (16.22)26.14 (15.76)0.9961.0000.9990.999 *
ICC: intraclass correlation coefficient, SD: standard deviation, CI: 95% confidence interval, IL: inferior limit, SL: superior limit, Ca: Cronbach’s alpha, *: CIC ≥ 0.90 corresponding to an excellent reliability, PR1: primary review first measurement PR2: primary review two weeks later.
Table 3. Interrater reliability test.
CategoryMean (SD) PRMean (SD) R2CI 95% ILCI 95% SLCaICC
Manual Technique
Overjet2.57 (1.39)2.29 (1.25)0.7690.9930.9650.958 *
Overbite1.43 (1.39)1.57 (1.61)0.9190.9970.9840.984 *
Anterior open bite1.57 (3.04)1.43 (2.69)0.9780.9990.9960.996 *
Lateral open bite0.57 (1.51)0.43 (1.13)0.8960.9960.9800.980 *
Crowding3.14 (2.03)3.00 (1.63)0.8190.9940.9670.964 *
Occlusal relationship2.57 (1.90)2.57 (1.61)0.8600.9960.9730.976 *
Lingual posterior crossbite1.29 (1.49)1.14 (1.21)0.9000.9970.9800.980 *
Buccal posterior crossbite0.29 (0.75)0.43 (1.13)0.7950.9930.9600.960 *
Cephalometrics11.57 (9.65)11.57 (9.05)0.9861.0000.9970.998 *
Other4.29 (3.20)4.00 (3.16)0.9590.9990.9940.993 *
Final discrepancy index score29.29 (14.45)28.14 (13.85)0.9660.9990.9980.996 *
Digital Technique
Overjet3.14 (1.95)3.00 (1.91)0.9510.9980.9900.990 *
Overbite1.00 (1.29)1.14 (1.57)0.9100.9970.9820.982 *
Anterior open bite1.00 (1.91)1.14 (2.03)0.9530.9980.9910.991 *
Lateral open bite0.57 (1.51)0.71 (1.89)0.9370.9980.9880.988 *
Crowding3.14 (2.03)3.14 (1.67)0.8750.9960.9750.979 *
Occlusal relationship2.29 (1.79)2.29 (1.49)0.8390.9950.9690.973 *
Lingual posterior crossbite1.14 (1.21)1.14 (1.21)0.6860.9910.9400.948 *
Buccal posterior crossbite0.14 (0.37)0.29 (0.75)0.4300.9800.8890.889
Cephalometrics10.43 (9.41)10.43 (9.64)0.9951.0000.9990.999 *
Other3.43 (3.15)3.43 (3.20)0.9580.9990.9920.993 *
Final discrepancy index score26.99 (16.22)26.71 (16.03)0.9961.0001.0001.000 *
ICC: intraclass correlation coefficient, SD: standard deviation, CI: 95% confidence interval, IL: inferior limit, SL: superior limit, Ca: Cronbach’s alpha, *: CIC ≥ 0.90 corresponding to an excellent reliability, PR: primary review first measurement R2: second reviewer 2.
Table 4. Shapiro–Wilk normality test.
StatisticFreedom Degreep Value
0.162280.098
0.094280.084
Table 5. Categorization of the discrepancy index according to complexity.
CategoryDigital MeasurementManual Measurement
Mild (S)5 (17.9%)5 (17.8%)
Moderate (S)7 (25.0%)7 (25.0%)
Complex (C)9 (32.1%)8 (28.6%)
Very complex (C)7 (25.0%)8 (28.6%)
Total12(S) + 16(C) = 28 (100%)12(S) + 16(C) = 28 (100%)
(S): simple treatment, (C): complex treatment.
Table 6. Student’s t test comparing the results obtained using digital and manual techniques.
ABO Discrepancy IndexMean (SD)
Digital
Mean (SD)
Manual
tp-Value
Total discrepancy index score24.61 (13.34)24.86 (14.14)0.2960.769
Overjet2.21 (2.21)1.75 (1.91)−1.720.097
Overbite0.61 (1.44)0.79 (1.52)1.5440.134
Anterior open bite1.25 (1.50)1.82 (2.76)−1.3840.178
Lateral open bite1.00 (2.27)0.93 (1.99)0.5700.573
Crowding3.00 (2.09)2.96 (2.21)0.1070.916
Occlusal relationship2.14 (1.79)2.14 (1.71)0.0001.000
Lingual posterior crossbite0.75 (1.11)0.89 (1.25)−2.1210.063
Buccal posterior crossbite0.00 (0.00)0.07 (0.37)−1.0000.326
Cephalometrics10.29 (8.77)9.79 (8.92)0.7060.486
Other2.86 (2.83)3.71 (3.47)−2.2130.066
p ≤ 0.05 (significant differences), SD: standard deviation.
Table 7. Bland–Altman analysis.
Mean Digital TechniqueMean Manual TechniqueMean of
Differences (Bias)
Standard
Deviation
95% Limits of Agreement
Superior/Lower
Regression Beta Valuep-Value
24.6124.860.25004.469039.0092988−8.50929880.600.355
Publisher’s Note: MDPI stays neutral with regard to jurisdictional claims in published maps and institutional affiliations.