1. Introduction
Intensive work in the field of self-driving has marked the last few years. There are already concrete results and progress, but they are still in the domain of pilot projects, mostly supervised by development teams. In addition to the phrase self-driving (vehicles), this paper is permeated by the terms driverless (vehicles) and autonomous (vehicles), all as synonyms. The biggest challenge of autonomous driving systems is safety.
The development of smart railway infrastructure systems and the contribution to the field of autonomous train movement are the main tasks of SMART2 project. SMART2 provides an obstacle detection (OD) and track intrusion detection (TID) system as well as a trackside (TS) and airborne OD and TID (OD&TID) system [
1]. The study presented in this paper is part of a study conducted as part of the SMART2 project. The paper aims to present the proposed algorithm for signal detection and present the overall concept, methods, and results.
This paper combines research from several important scientific fields. It proposes a novel algorithm based on combination of deep neural networks (DNNs), namely, convolutional neural networks (CNNs) and traditional image processing by computer vision (CV) for detection of relevant signals in railways.
Self-driving in general relies on several important points. The first is environmental perception, based on a number of camera sensors (forward-, side-, and rear-facing cameras), as well as other sensors, such as LIDARs) or radars. This approach ensures that the vehicle can see objects 360 degrees around it (hardware), and from them identify objects of importance for driving (usually AI-based software). The second point is precise localization, where the vehicle should know exactly its own position. The third point is the path you need to take to reach your desired destination. Finally, the fourth point is control. The presented refers to self-driving vehicles in general, regardless of whether they are cars or trains. As the entire self-driving vehicle industry is a novelty, changes are taking place almost on a monthly basis. Some of these changes can very often be of a substantial nature.
Many authors have written on the topic of autonomous driving in recent years, but it is noticeable that much more scientific work and commercial efforts are focused on the autonomous automotive industry compared to the railway. Common to both branches is the detection of signals, which differ from each other, but the principles of shape detection are basically the same.
The state of the art, including modern “connected” trains and autonomous trains based on AI technology, is discussed in [
2]. The author observed the broader concept of the entire railway network and its autonomous operation, referring to the concept of full automation, but emphasizing the importance of reliability and safety. Another recent study [
3] addresses the implications of autonomous vehicles, with a deeper overview of railway at suburban stations. There is also a lot of discussion here about the railway network and the impact of future autonomous vehicles on it and its change in accordance with that impact. Article [
4] also deals with autonomous railways but focuses on the detection of the objects present on railways. The paper presents the feature-enhanced single-shot detector and feature transfer block of FB-Net to ensure real-time object detection performance. For their automatic object detection system, they used CNNs and conducted processing via a graphical processing unit (GPU). Their driving system is mainly aimed at detecting objects in the shunting mode of the train at a speed less than 45 km/h. The proposed algorithm achieves an average accuracy of 0.895, while it is able to process 38 frames per second in real time. An important task of the noted paper was to improve the detection of small objects while maintaining high accuracy of detection. Gilbert et al. [
5] applied autonomous visual railway track inspection to detect robust fasteners. For their research, they used a histogram of oriented gradient characteristics and a combination of linear support vector machine (SVM) classifiers. In paper [
6], the authors dealt with detection of objects on railways by using modified YOLO v5 to detect 3D objects. Along with this method, they also introduced their new virtual dataset based on the GTAV video game for road and rail environments, filling a gap in rail datasets for detecting and localizing 3D objects. Image-plane homographs for obstacle detection and object distance estimation from a thermal camera are improved using an AI approach in paper [
7]. Paper [
8] presents an improved edge detection method which deals with blurred images in railways. The authors proposed a blur detection algorithm in order to save computational time by processing images with sufficient quality only. The used dataset [
8] consisted of 2180 images made by different types of cameras in a real-world environment. Authors compared the proposed method with state-of-the-art methods (FFT method, Laplacian method, Canny method). Generally, AI-based systems [
4,
6] in combination with traditional CV systems [
8,
9] can be used for the detection of objects on the railway environment. In paper [
10], irregularity of contact wire as well as influence on interactions of high-speed pantograph and chain networks are discussed. Aydin İ. et al. [
11] proposed a new Hough-based computer vision method for controlling the contact force in the domain of a pantograph–catenary system.
However, AI and CV have extremely wide applications in industry and science. Railway is just one example of the successful application of these algorithms. The following papers present the application of AI and computer vision in different areas. Chenarlogh et al. [
12,
13] proposed a four-stream 3D CNNs model for recognition of human action, using limited data. Authors used handcrafted features, optical flow, and gradients in horizontal and vertical directions. Roshani et al. [
14] used group method of data handling (GMDH) and neural networks in order to increase measuring precision of a simple photon-attenuation-based two-phase flowmeter. Dizaji et al. [
15] implemented fuzzy logic for active control of the robot manipulator trajectory within and after the impulsive loading caused by collision. Mahmood et al. [
16] used machine learning techniques for gas sensing systems. Modeling and predictive analysis in this paper are based on kNN, ANN, decision trees, random forests, and SVM approach.
Situations where there are multiple tracks and signals visible are a challenge for accurate detection. There have been cases where multiple tracks/signals have caused problems for humans when driving trains. Drivers perceived the wrong green light, which did not refer to their track. Such errors could lead to a direct train collision. The system proposed by this paper aims to solve the problem of detecting the correct track and signal in a situation where there are more of them in front of the train.
Furthermore, with the current level of technology, it is possible to translate many standard railway systems into intelligent ones. The problems that can arise here are safety and certification. A common approach to command and control system (CCS) device certification involves reaching the required SIL (safety integrity level). Certification of systems containing AI for SIL level 4 can be an issue [
17], thus fostering other approaches which would enable the certification process, such as use of traditional CV and explainable artificial intelligence (XAI).
As already noted, the paper proposes a novel algorithm for light signal detection in railways. The rail track is detected by traditional CV algorithms, while the light signals are detected by a YOLO CNN. The combination of these two algorithms has formed an integrated system for the detection of rails and signals on the railway, a novel system that aims to detect both the rails and the relevant signals. This approach ensures that the AI system is “aware” of which route a signal belongs to, which solves the problem of detection of relevant signals along the train route, especially in multitrack scenarios which are characteristic to stations and marshaling yards.
2. Methods
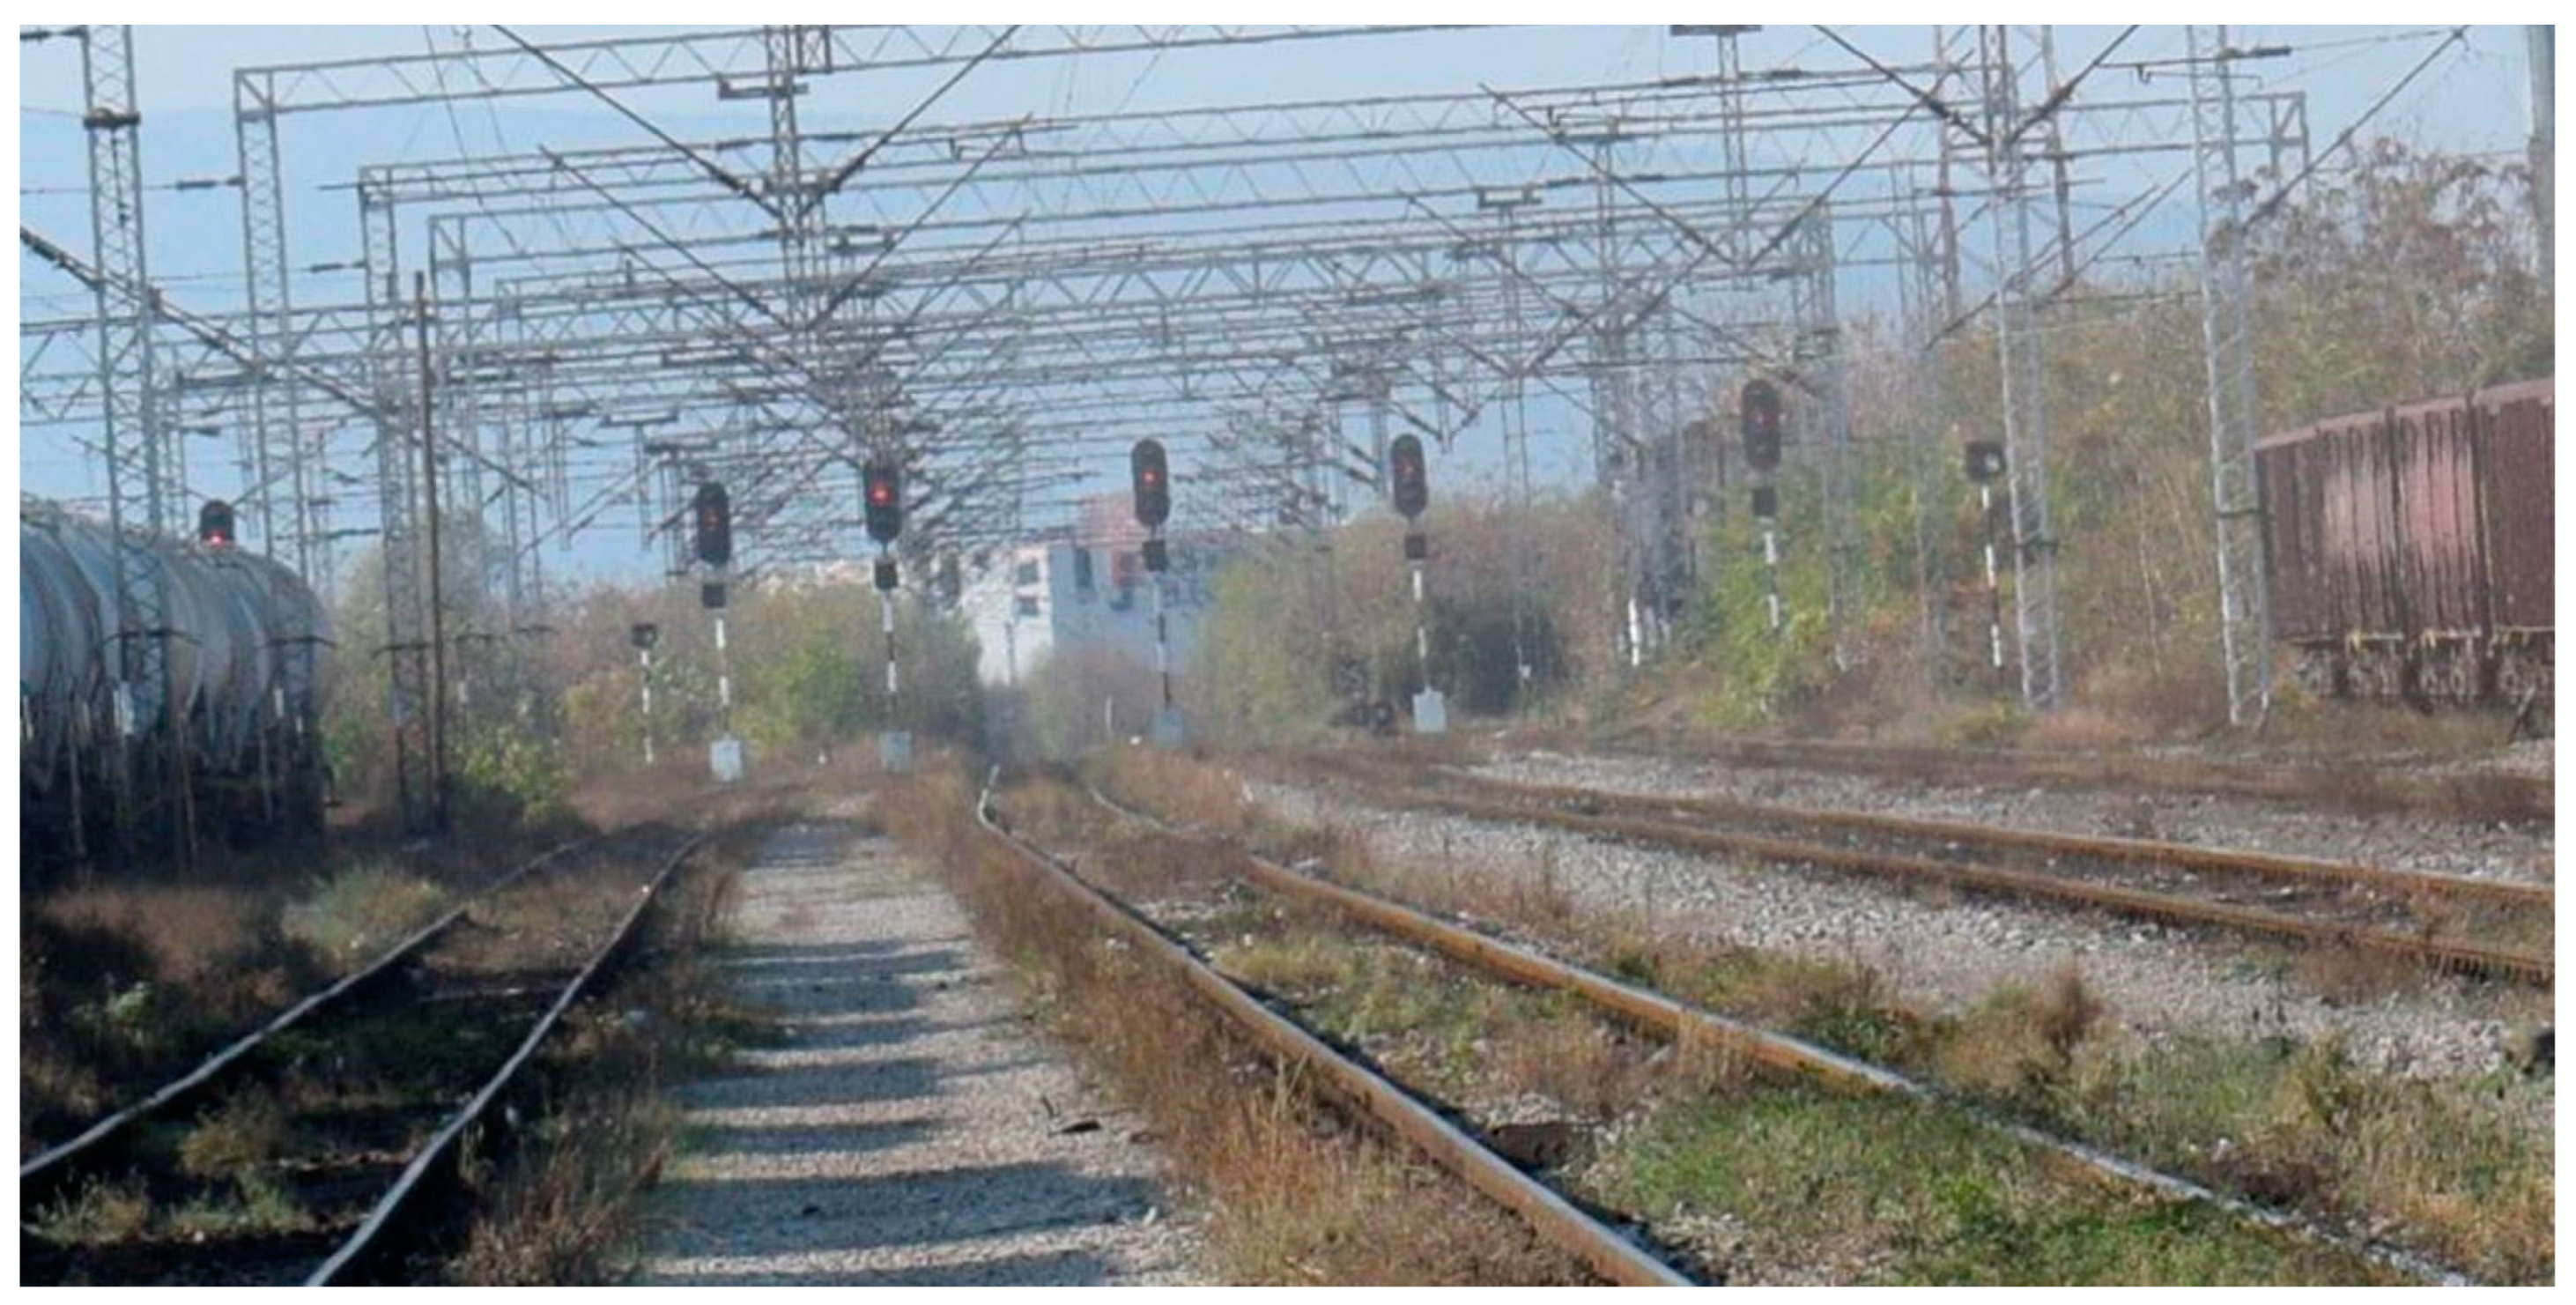
In order to increase the reliability of the detection of railway signals and increase the capability for certification of the system for detection of signals, an integrated system for detection of rails and signals on the railway is proposed, which is based on a combination of CV algorithm (Canny and Hough method) and CNNs–YOLO v5 algorithms. The CV algorithm detects rail lines and thus the route on which the train is moving, and CNN detects the actual signal. The system should detect that the signal is relevant for the train which is true only if the signal is directly next to the track on the right side in the direction of motion or directly above the track. This is especially important in environments where multiple tracks and signals are visible from the frontal train profile, as shown in
Figure 1. If the signal detection is not related to the track the train is moving on, the system can falsely detect the signal which is not relevant to itself and proceed to the section where its presence is not allowed, ultimately leading to collision with some other train. The signal and track detection are thus an integrated package which ensures that the AI system is “aware” of which route the signal belongs to.
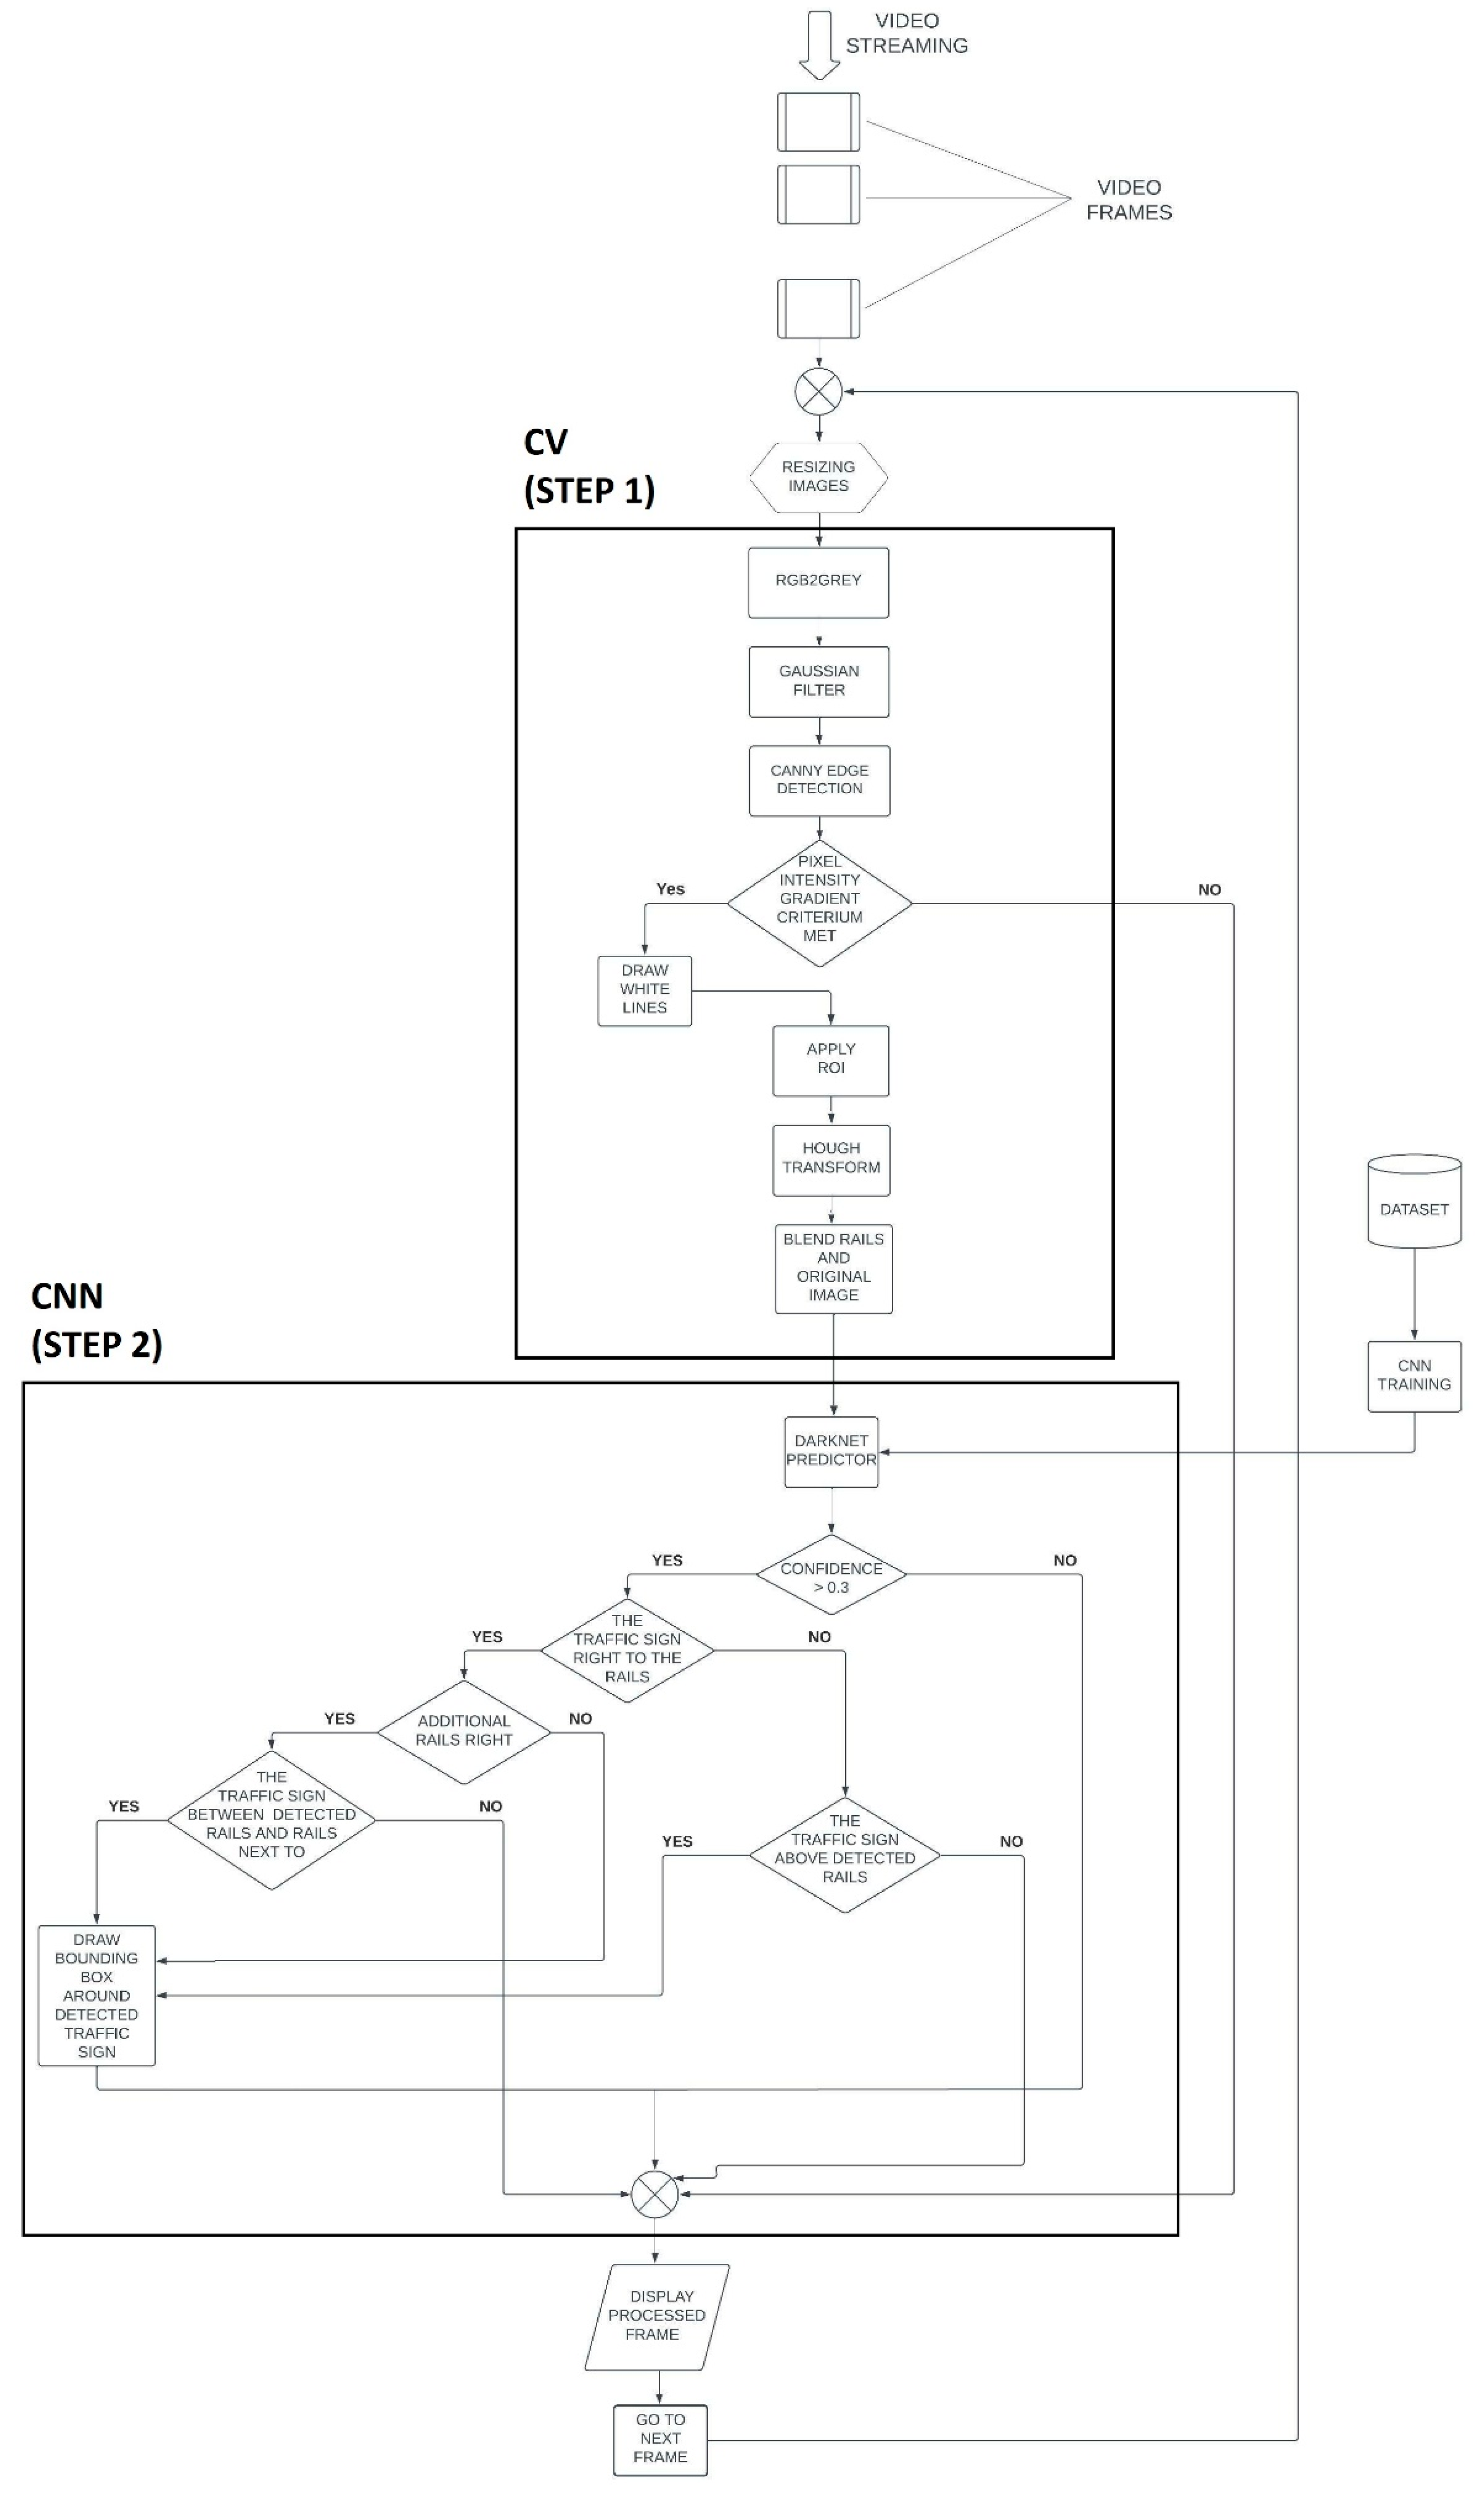
The system for detection of rails and signals on the railway is explained schematically by a flow chart, as shown in
Figure 2. The proposed algorithm allows single images, series of images, and real-time video from an RGB camera. The input data for the proposed algorithm undergo a resize process, due to the easier processing that should follow and the unloading of computer resources. The images are at first processed by CV algorithm consisting of two parts—Canny edge detection and Hough transform. The input images are subject to transformation that will prepare them for further processing. First, the color changes from 3 channels to 1—the image from RGB becomes grayscale. Then, a Gaussian filter is applied, which performs averaging the pixel intensity. Only then is the Canny edge detection process applied, where lines are drawn on the image with a series of white pixels corresponding to rails. The “If” statement defines that if the gradient reaches the defined upper threshold, a line is drawn. In addition, if the gradient value is between the upper and lower thresholds and is directly related to a series of strong gradients, lines are drawn. After the applied ROI, Hough transformation follows, where, after fusing the original image and the image with identified rails, output data are obtained, i.e., processed frames with detected rails, which continue to flow through the process and enter step 2—CNN. The detected rail track is overlaid on the resized RGB image. The image processed in this way enters a previously trained system whose goal is signal detection. Darknet is a framework of the YOLO algorithm based on deep learning. The first method of selection is to check the confidence of the detection for each frame—the confidence value must be at least 0.3 in order for the system to continue the process. If the mentioned confidence is reached, the next condition for signal detection is that the system has already drawn the rails, and that the signal is located near it, more precisely, on its right side or above the track. If the signal is placed on the right side, it is considered relevant if there is no track further right or the signal is placed up to the next track on the right side. As the final output, if all the conditions are met, the system displays the processed data; more precisely, it detects the railway infrastructure in an image, video, or in real time.
3. Rail Track Detection Based on Approach of Computer Vision
The rails can go straight or curved and can intersect with each other at switches. Concrete and wooden sleepers, vegetation, and other influencing factors that may affect the accuracy of detection should also be considered. This chapter will address the topic of the application of CV, including image processing, for the purpose of more accurate detection of rails.
The entire process of CV applied in this paper can be divided into two subunits: edge detection and Hough transform, using a similar approach to Wang et al. [
18]. In order to implement the edge detection algorithms for finding rails in images, videos, and in real time, it was necessary to perform several operations with images. The images (.jpg format) were first loaded in the algorithm and returned as multi-dimensional matrices with filled pixel intensity values belonging to the image.
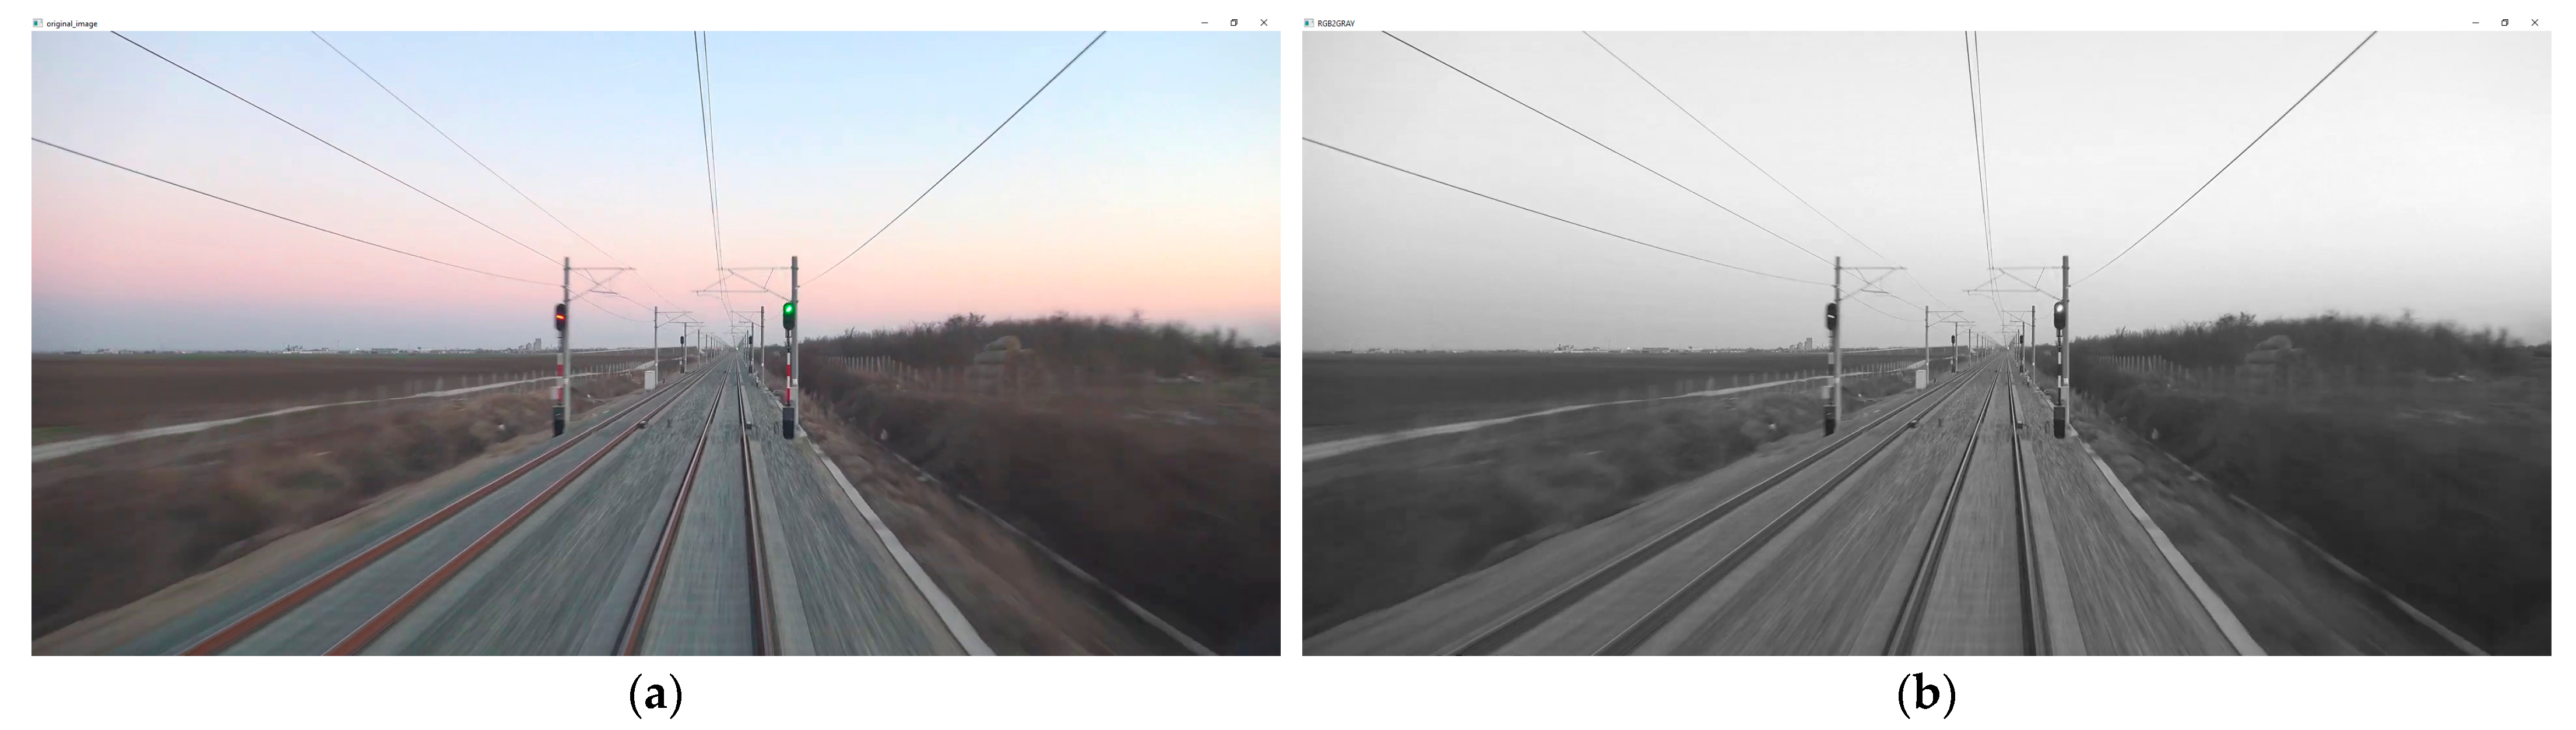
Figure 3a shows the original image, which will undergo the necessary transformations, as described below. From a human point of view, the image can be defined as a 2D projection of the 3D world on the retina. Mathematically speaking, an image is a matrix of light, where the intensity of light at a point represents the value of a pixel in a matrix cell. In order to carry out further processing more efficiently, the conversion of the red, green, blue (RGB) image to grayscale followed. Grayscale images have only one channel, which makes them much simpler and more convenient to process. Thus, the switch from three channels to only one channel was performed, with a range of pixel values from 0 to 255, where a higher pixel value represents a cell with more light.
Figure 3b shows the first step in the CV algorithm that was performed to prepare the image for detection.
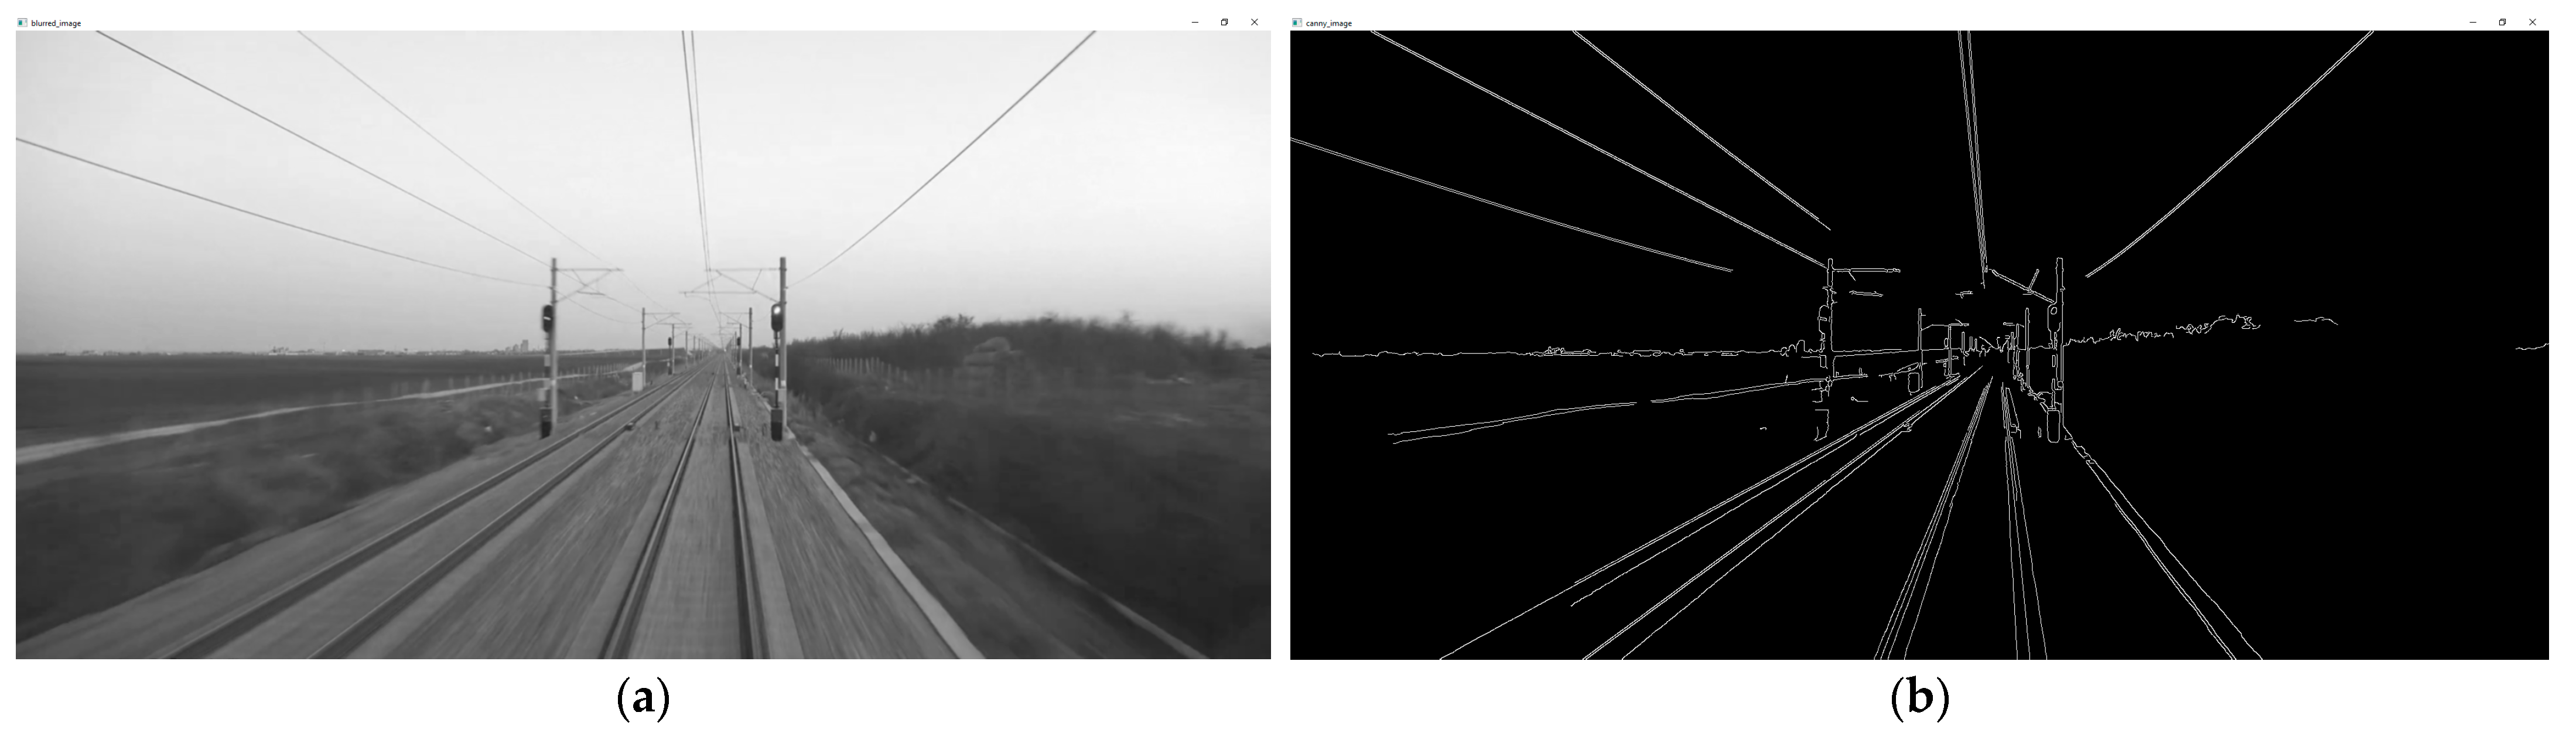
The next step in the CV algorithm was noise reduction by application of Gaussian filter.
Figure 4a shows a blurred variant of the grayscale image. Noise can confuse the process, as it can create false edges. This procedure was used to average the pixel intensity values using a Gaussian distribution kernel (dimensions 5 × 5). The filter passes through the whole image, starting from the coordinate origin and smoothing the pixel values. This procedure can also be considered as optional since the next step in the CV algorithm (Canny edge detection) encompass noise reduction by filtering.
The rapid change in brightness between the rails and the rest of the image is the reason why it was decided to apply the multi-step Canny edge detection algorithm presented. The application of the Canny edge method in railways has been considered in an number of papers [
19,
20,
21,
22,
23]. The dimensions of the images on which the detection is performed are 1920 × 1080 pixels, and the number of channels is one (after processing). Rapid changes in brightness, defined by the Cany edge detection algorithm, are presented in the form of derivative by both directions (x and y):
Each edge represents a sudden change in pixel intensity. A small derivative is a small change in intensity, while a large derivative is a large change. Comparing
Figure 3a,b, it can be concluded that wherever objects and/or surroundings intersect, edges are separated. By calling Canny (conducting derivative in both directions), one actually calculates the gradients in both directions of the image. The white edges drawn in
Figure 3b represent the strongest gradient. They are drawn as a series of white pixels. Since the gradient was larger than the upper defined threshold, the edges were accepted. The defined pixel intensity of the upper threshold was 150. All the edges that were below the lower defined threshold (in this case: 50) were not drawn—black space. The ratio between the thresholds was 3:1, finally defined by trial and error. Values between the thresholds are accepted only if the region is directly connected to the edge of strong intensity. Calibration of parameters can be performed depending on the input data, and it is a desirable part of the process [
24]. As we can see in
Figure 3b, the Canny method gave very good results; the edges of interest were identified. However, in order to single out only the track on which the train is moving (on which the camera is located), the method of separating the region of interest (ROI) was used. Array of the position follows:
After defining the ROI, the so-called image masking was performed. The pixel values are transferred to the binary domain (values 0 and 1). The idea behind it all is to merge the Canny image and the masked image, so that only the gradient region of interest remains. It is extremely important here that the images to be merged are of the same dimensions, because pixels are added together so that only pixels with a value of 1 are drawn. This procedure completed the first phase of the CV algorithm—the edges were isolated using the Canny edge detection method.
The second phase of the CV algorithm—Hough transform—refers to rail track detection based on the results obtained using the Canny algorithm. Song et al. [
25] proposed the Hough-transform-based Canny (HT-Canny) algorithm for edge detection. The HT-Canny algorithm can more efficiently detect the low-intensity edge compared to traditional algorithms. For instance, Maire et al. [
26] used a similar approach with Hough transform to that presented in this paper to detect railway tracks.
By switching from the Cartesian coordinate system to the parametric (m, b), i.e., by mapping the lines from image space to points on the parametric space, as well as the points from image space to the lines on the parametric space, a Hough space was obtained. A “grid” was used to determine the points with the largest number of intersecting lines. The number of cells in this grid is stellate, so that the most optimal parameter is found, in order to obtain the best possible detection results. The cells with the largest number of cross-sections formed the best fit lines.
There are several arguments in Hough transform’s statement that are of paramount importance. The resolution of the Hough accumulator array (previously referred to in the text as a grid) filled with votes in each bin (previously mentioned as cell) represents a distinct value of r and Θ. These parameters define the size of the bins:
Proved by trial-and-error method, the larger the bins, the worse the accuracy at the detection points. The smaller they are, the greater the accuracy of line detection, but it should not be exaggerated as it can lead to lower accuracy, as well as to the use of too many computer resources and, therefore, time. Finally, a precision of 2 pixels for r was taken, accompanied by 1° precision, π/180° (in radians) for Θ.
Two additional essential parameters also used:
Figure 5 shows the results of the Hough transform for different input images.
Additional research is necessary to optimize the CV algorithm for fast processing in the real-time system and increase of precision in the parts where the railway has curves or intersects with other tracks.
Figure 6 shows the same track detail with initial Hough transform parameters (a) and with optimized set of parameters (b).
Figure 6a shows certain detection errors that have been corrected by correcting parameters and optimizing the system, as shown in
Figure 6b.
4. YOLO v5 and Convolutional Neural Networks Approach in Railway Signal Detection
In the last few years, numerous authors have dealt with the application of CNNs for the purpose of recognizing traffic signs. Liu et al. [
27] used YOLO v5 with balanced feature pyramid in order to detect traffic signs. According to the authors, one of the biggest challenges is the complex surroundings of traffic signs, as well as the small dimensions of the signal. They proposed an improved algorithm and presented comparison of the results obtained by the classic YOLO v5 and their proposed algorithm. Zhang et al. [
28] applied YOLO v3 for detection of the small traffic signs. They proposed a new detection scheme—MAS_YOLOv3 for detection in real time. Measured detection speed of the algorithm they presented was 23.81 frames per second (FPS) and mean average precision (mAP) was 86%. YOLO algorithm in general was presented by Redmon et al. in [
29]. This algorithm, based on convolutional neural networks, has received a new version year after year. Already YOLO v2 was able to detect over 9000 different objects and had higher speed and precision than the first version [
30]. The current version of YOLO is v5. YOLO is characterized by exceptional speed, and compared to other state of the art algorithms, this is definitely a comparative advantage. With newer versions, the accuracy is significantly improved compared to the original version of the algorithm.
In a broader sense, convolutional neural networks, as well as deep neural networks, belong to artificial neural networks and are associated with the term artificial intelligence. CNNs consist of one or more convolutional layers and optionally one or more fully connected layers [
31].
The algorithm that will be described in this paper, used for the purpose of detecting signals on railways, employs YOLO v5. This algorithm is trained to recognize the green light next to the track on which the train is currently moving and which is relevant for the train. The convolutional neural network is trained with input images of 1920 × 1080 pixels. To save time and computer resources, the training was performed through Google Colab using graphical processing unit (GPU). Three custom datasets were used consisting of about 150, 500, and 1000 relevant images. The images were labeled with objects of interest (signals, and contact line masts) for the railway environment. The YOLO algorithm uses the Darknet as a framework, which was compiled using graphics cards. Training of a network with dataset of 150 images lasted 3 h 46 min, training of a network with dataset of 500 images lasted about 7.5 h, while training of a network of with dataset of 1000 images lasted around 12 h. Unlike classical neural networks, which are fully connected, CNNs are characterized by a larger number of layers for detecting the essential features of the input data. CNNs usually work with 2D structures, while in recent times they have shown good results with 3D structures. The output is characterized by the appearance of bounding boxes around the detected objects. Above each bounding box is the name of the class and the percentage value by which the algorithm tells us how certain it is that what is inside the bounding box really belongs to that class.
Dataset
Having an adequate set of data is extremely important for the quality of the detection and its accuracy. It is widely known that it is necessary to have as much data as possible to train the network, but the quality of input data is also as important as the number of data. In this paper, three neural networks with datasets of 150, 500, and 1000 images were trained. Datasets consist of images that are created in different conditions. Some of the images were made at the Popovac marshalling yard, near Nis. The other part of the image is created based on 4K videos [
32] of the Novi Sad–Belgrade and Belgrade–Novi Sad route on the Serbian Railway, by automatic frame extraction. An automatic generator was created, so it extracts a new image (.jpg format) every 50, 25, or 10 frames for the mentioned datasets, respectively. The dimensions of the images created in this way are 1920 × 1080 pixels.
Conditions for creating a dataset:
Camera position—train front (according to real need for future testing);
Regime of daily recording (dawn and dusk) and night images;
No precipitation;
The speed of the train: up to 200 km/h.
In accordance with the Rulebook on Types of Signals, Signal Markings and Markings on Railways in Serbia, Article 16 [
33], the signal shown in
Figure 5 represents
The signal is represented by a green, calm light and we assigned it a “green_light” class (as shown in
Figure 7). The same goes for day and night signs and belongs to the group of signal signs that are indicated by the main signals.
Since it is extremely important that the system recognizes signals accurately, both from greater distances and up close, the network had to be trained with data containing images with different distances between the camera and the signal.
Selected photos will be displayed on the following image sets:
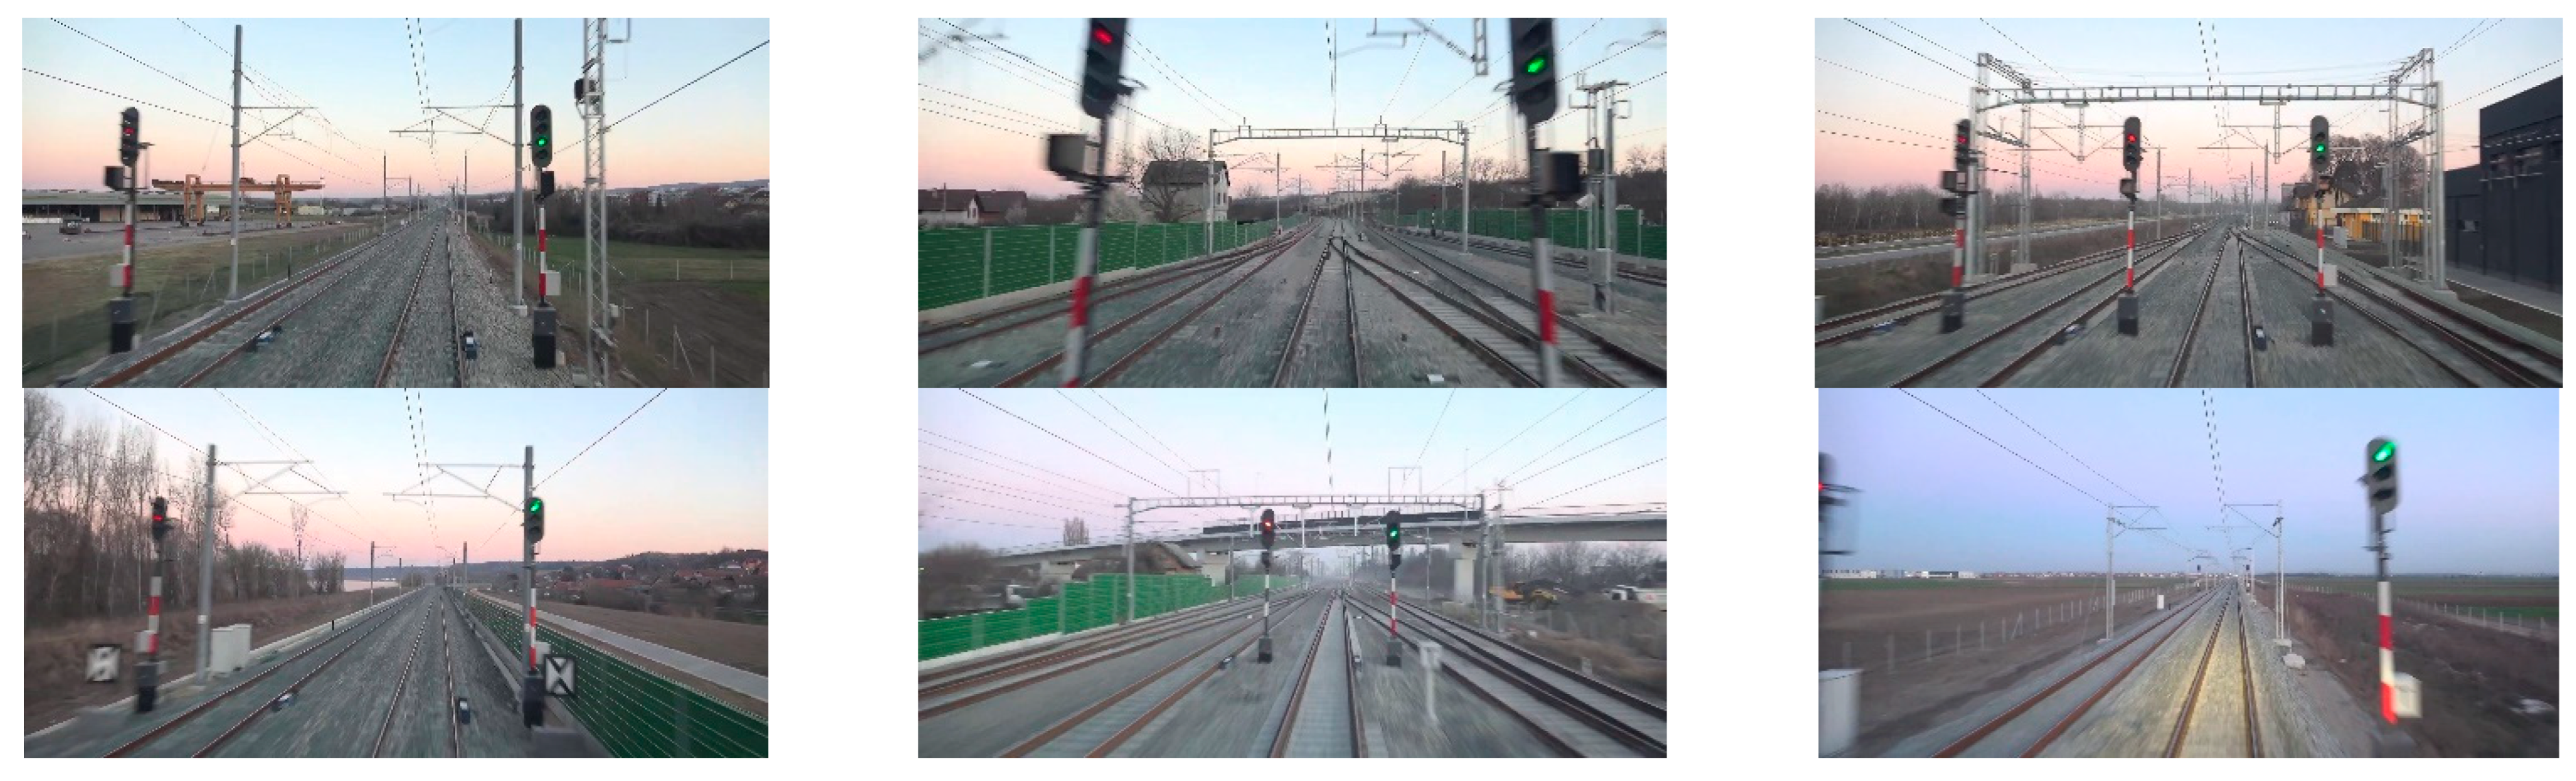
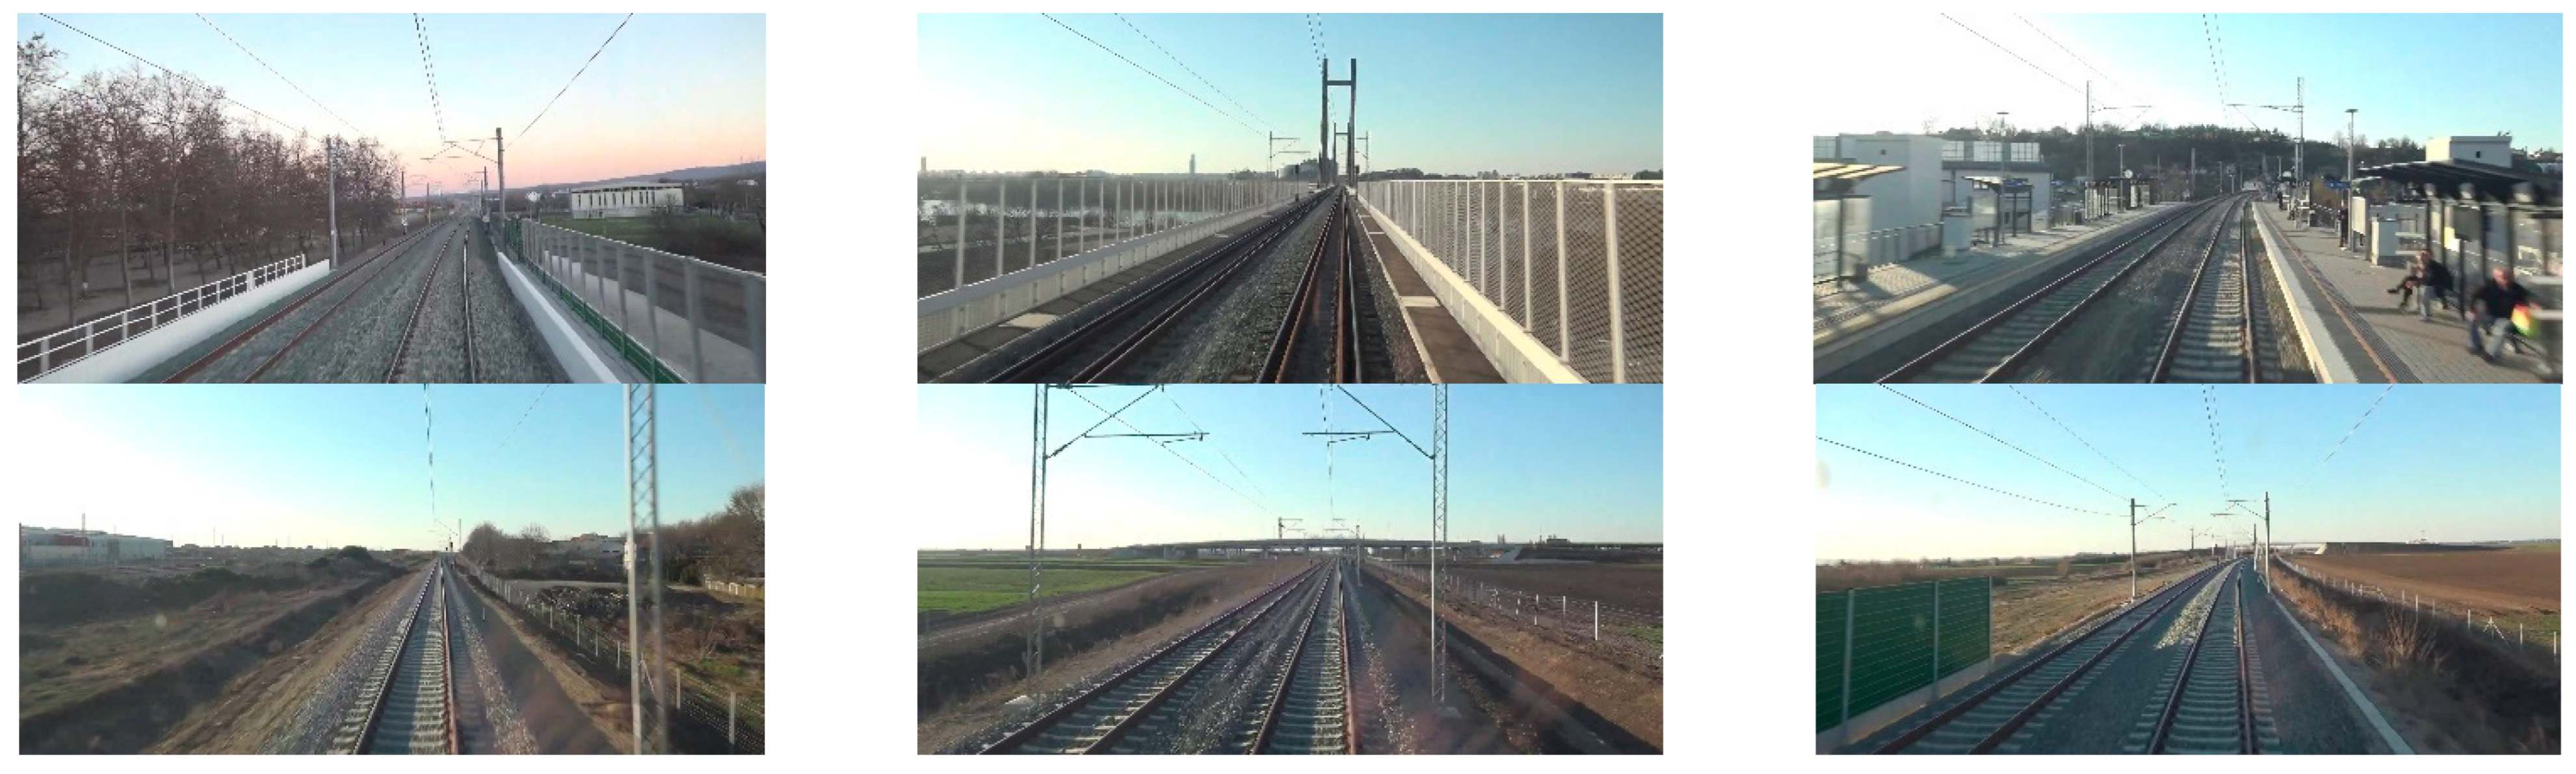
Signal at a distance closer than 25 m from the camera—daily mode (
Figure 8);
Signal at a distance of more than 75 m—daily mode (
Figure 9);
Signal at a distance closer than 25 m from the camera—night mode (
Figure 10).
The highest percentage of images that make up this dataset was taken in daylight, just before evening, at a distance of over 70 m camera–signal (about 30%). The lowest percentage of images in this dataset are night images from a distance (about 5%). For this reason, this dataset can be enriched with even better data and cover both day and night modes, paying special attention to distance.
After the dataset was collected, further processing of the images followed and their preparation performed so that they could be adequately used to train the network. By labeling the dataset, image by image, the “green_light” class was assigned to specific regions, as shown in
Figure 5.
The process of so-called labeling of the dataset resulted in arrays (vectors) with data on which class the labeled object belongs to, its position in relation to the coordinate origin, and its dimensions. These are normalized values, translated into values between 0 and 1. The generated vector after labeling the image shown in
Figure 11b is
Since contact line mast detection was also performed, the labeling process for the dataset was performed accordingly. Most of the images are labeled in which the contact line mast is directly in front of the camera, because they are the most relevant for detecting the correct route. The contact line mast located far behind is neglected.
5. Results and Discussion
The obtained results of implementation of the YOLO algorithm based on CNNs were applied to images, videos, and real-time camera. Bounding box is an indicator of the detected object—green light signal. Above the bounding box is the class name and the reliability of class prediction in %. The algorithm is trained with input data that contain images of different distances from the target object.
Figure 12 shows a test image. The system recognized and positioned the railway signal in test image. There is a special set of images with which the system is not trained, and these images are used to test the reliability of detection. The reliability of the selected image in
Figure 12 is as high as 99.67%.
Figure 13 shows the same image, this time tested through a neural network trained with 500 input images. As can be seen in the figure, the reliability is even higher than in the previous figure—99.71%.
A comparison was made between the detection reliability of the three neural networks, and the results are shown in
Table 1.
Better detection results were expected with a dataset of 500 images compared to a dataset of 150 images. That is in the largest percentage and it turned out to be an accurate statement. There are a number of images where a set of 150 images cannot detect the signal at all, even if it does exist in the image. However, a network trained in a set of 500 images finds such objects with a reliability of over 80%. In the highest percentage, the reliability between the two datasets differs by 10–20%. There have been several cases where the network trained with a set of 150 images gave better results. That phenomenon has been explained by the fact that the larger dataset is trained mostly with images from greater distances, where it gives excellent results. Such exceptions occurred with a few tested images from smaller distances. As expected, the network trained with a set of 1000 images gave the highest reliability.
Figure 14 shows a graph of mean reliability for all three trained networks, tested on the sample from
Table 1.
The visual results of the proposed method presented in Chapter 2 of this paper can be seen in
Figure 15. It is a combination of a rail track detection system, implemented by traditional CV, and a signal detection, implemented with the help of CNNs. These two systems are connected in a common system for detection of rail track and signals on the railway, which, in addition to detecting the mentioned railway objects, provides high reliability by the fact that if the detected signal is not located next to the detected rails, it will be considered as not relevant and will not be presented as detected on the screen. The point of the interconnection between the rails and the signal is that the signal must come from the right side in relation to the predefined point on the rail and have its end limit on the imaginary y axis. Furthermore, existence of track on the right side is also checked as the signal must be placed before the right track (if it exists). This excludes from the whole range the possibility of detecting a signal that is not in the direction of the train’s movement. The horizon must be taken into account, and the reference point on the rail must be adequately determined, so that there is no error in detection. However, this part of the algorithm is adaptable, which is an additional feature that provides high reliability.
The main direction of further research is the creation of a holistic system for the detection of railway objects. The presented research contributes to the ultimate research goal, which will be reflected in the extremely high reliability of detection, as well as capability to be certified according to required SIL level. The holistic system for the detection of railway objects will be based on the multiple parallel connections between CV and CNNs detectors, with inclusion of a railway digital map containing the positions of all infrastructure elements. The parallel connection between CV and CNNs detecting the same objects and with comparison with digital map will give greater reliability in object detection.
The reliability of the entire system can be increased by introducing a digital map of the infrastructure, but also by detecting overhead systems—catenary rail lines and contact line mast. Detection of catenary line was also performed by the Canny–Hough algorithm, while the contact line masts were detected by CNNs. The results are shown in
Figure 16 and
Figure 17. The reliability of the detection of the contact line mast is as high as 99.9% in certain cases.
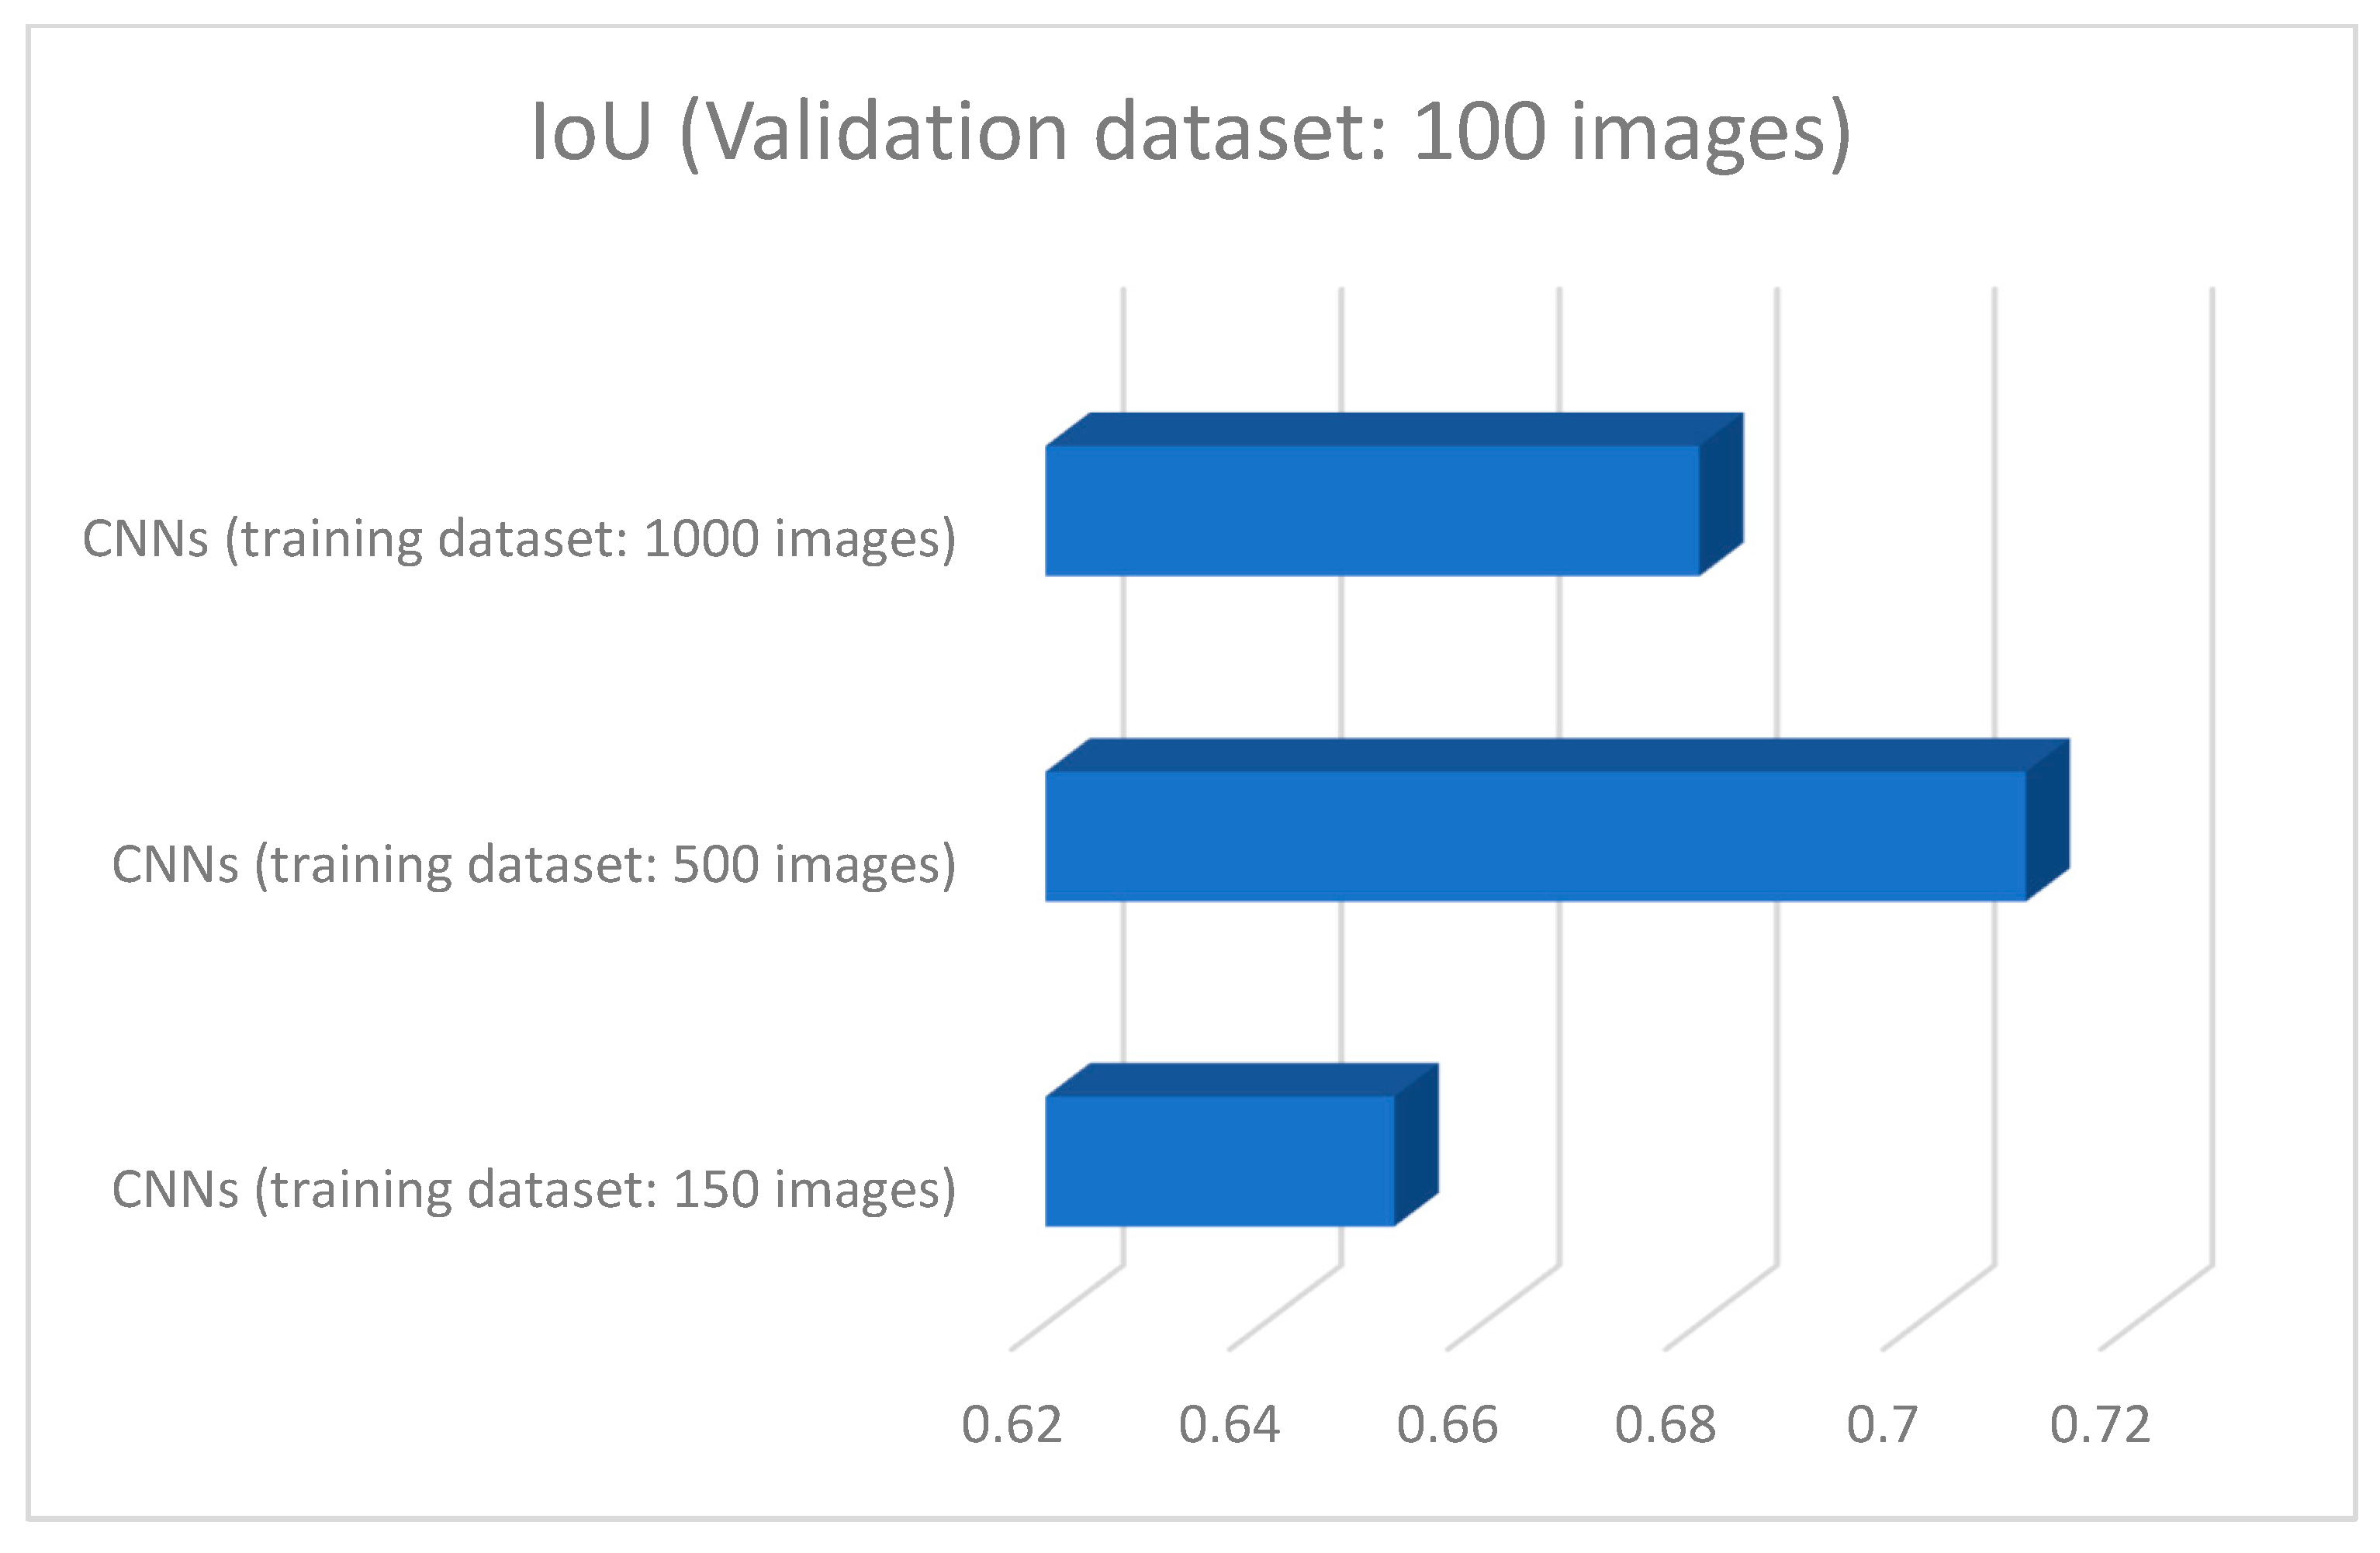
Metric evaluation of an algorithm is an important item in the final assessment of its efficiency. The intersection over union (IoU) method was used. For that purpose, a separate validation dataset was formed in the size of 101 unique input images, which did not previously serve as training data.
The parameters that appear here are the position of the center of the label in relation to the coordinate origin as well as height and width of the label. The same parameters are necessary for the prediction bounding box.
Figure 18a shows the IoU value (0.652) obtained for CNNs 150 images. This value can be classified as a good result.
Figure 19 represents a chart with IoU values obtained for CNNs 150, CNNs 500, and CNNs 1000. The reason why the IoU in
Figure 19 is slightly higher for CNNs dataset 500, compared to CNNs dataset 1000, is that the second dataset contains a large number of images from a greater distance.
Ye et al. [
34] calculated the intersection over union for railway object detection. They presented a ratio between IoU and mean average precision (mAP). In order to reach a compromise in the accuracy of the location and the accuracy of the detection, they set the IOU below 0.55 in practical application.
In this paper, average precision was also calculated, based on the number of true positives—TPs (predicted as positive and were correct) and false positives—FPs (predicted as positive but were incorrect). The calculated value is 0.89. The authors [
34] presented a table with values for average precision of a few different methods, and it was in the range between 0.86 to 0.89, which is also the case with the results obtained in this paper.
To calculate recall, in addition to TP, false negatives (failed to predict an object that was there) are needed. The calculated value for recall is 0.76.
The presented method functions almost in real time with a 30 FPS video. Currently, the fastest trains pass at approximately 150 m/s which means that the image will be taken approximately every 5 m which is a small distance compared to the required distance at which signals should be detected (>800 m). Current processing lag is 0.27 s which is sufficient for speeds up to 200 km/h (train passes ≈ 55 m/s) and more than enough for freight trains for which the system is ultimately developed (speed up to 160 km/h). The processing lag can be smaller and FPS can be higher with stronger hardware if necessary.
6. Conclusions
The global aim of the research is to contribute to the area of autonomous train movement, but also to intelligent detection of traffic signs and signals in general since the developed algorithm is widely applicable. The presented paper deals with a topic which, in addition to the fact that significant results already exist, is still in its infancy and which will be developed in the future and reach its full potential. As already pointed out in the paper, the biggest challenge in this area, in addition to the implementation itself, is the reliability and possibility of certification of developed systems, given that these are intelligent, and artificially controlled vehicles that need to move, travel, and participate autonomously on the railway. The main contribution of this paper should be the proposed system for detection of rail track and signals on the railway based on the integrated Hough–YOLO method. This system is based on the integration of traditional CV and AI into a single system of higher reliability and greater potential for possible certification. The connection between the detected rails and the signals next to them (on the right side) makes a hybrid system that provides the ability to be upgraded by including more signals and railway objects in a complex network of detection and subsequent decision-making based on the artificial intelligence.
The current limitations of this paper relate to the size of the dataset used to train the CNNs, as well as the number of classes the system can detect. Future aspects of research on this topic relate primarily to the quantitative and qualitative improvement of the dataset by which CNNs will be trained, which will directly further improve the reliability of detection. Monitoring changes in detection reliability as the camera approaches the signal and introducing more and more classes will be applied.
The validation metric method used was intersection over union (IoU). The results for all three networks were around 0.7. Calculated value of average precision was 0.89 and for recall, 0.76.
The main direction of further research is the creation of a holistic system for the detection of railway objects. The holistic system for the detection of railway objects will be based on the multiple parallel connections between CV and CNNs detectors, with inclusion of railway digital maps containing the positions of all infrastructure elements.
Author Contributions
Conceptualization, A.D.P. and M.B.; methodology, A.D.P., M.B. and G.A.; Python implementation, A.D.P. and G.A.; validation, M.B. and M.S.; formal analysis, D.S. and A.M.; investigation, A.D.P. and D.R.; resources, A.D.P. and D.S.; data curation, writing—original draft preparation, A.D.P.; writing—review and editing, A.D.P., M.B. and M.S.; visualization, A.D.P. and D.R.; supervision, M.B., D.S. and A.M.; project administration, A.D.P. and D.S.; funding acquisition, M.B., A.M. and M.S. All authors have read and agreed to the published version of the manuscript.
Funding
The authors disclosed the receipt of the following financial support for the research, authorship, and/or publication of this article: This research received funding from the Shift2Rail Joint Undertaking under the European Union’s Horizon 2020 research and innovation program under Grant Agreement No. 881784.
Institutional Review Board Statement
Not applicable.
Informed Consent Statement
Not applicable.
Data Availability Statement
Not applicable.
Acknowledgments
Special thanks to the Serbian Railways Infrastructure, and Serbia Cargo for the support in conducting the SMART2 OD field tests, as well as Dušan Vujović (YouTube channel dulevoz) for providing images adapted in this paper and for dataset creation.
Conflicts of Interest
The authors declare no conflict of interest.
References
- SMART2 Project. Available online: https://smart2rail-project.net/ (accessed on 18 May 2022).
- Fantechi, A. Connected or Autonomous Trains? In Proceedings of the Reliability, Safety, and Security of Railway Systems. Modelling, Analysis, Verification, and Certification, Third International Conference, RSSRail 2019, Lille, France, 4–6 June 2019. [Google Scholar] [CrossRef]
- Lawrie, I.; Stone, J.; Woodcock, I. Assessing the Spatial Implications of Autonomous Vehicles as Feeders to Railway Stations in Suburban Melbourne. Urban Policy Res. 2020, 38, 357–368. [Google Scholar] [CrossRef]
- Ye, T.; Zhang, Z.; Zhang, X.; Zhou, F. Autonomous Railway Traffic Object Detection Using Feature-Enhanced Single-Shot Detector. IEEE Access 2020, 8, 145182–145193. [Google Scholar] [CrossRef]
- Gibert, X.; Patel, V.M.; Chellappa, R. Robust fastener detection for autonomous visual railway track inspection. In Proceedings of the 2015 IEEE Winter Conference on Applications of Computer Vision (WACV), Waikoloa Beach, HI, USA, 5–9 January 2015. [Google Scholar] [CrossRef]
- Mauri, A.; Khemmar, R.; Decoux, B.; Haddad, M.; Boutteau, R. Lightweight convolutional neural network for real-time 3D object detection in road and railway environments. J. Real-Time Image Processing 2022, 19, 499–516. [Google Scholar] [CrossRef]
- Ćirić, I.; Pavlović, M.; Banić, M.; Simonović, M.; Nikolić, V. AI Powered Obstacle Distance Estimation for Onboard Autonomous Train Operation. Teh. Vjesn. 2022, 29, 611–619. [Google Scholar] [CrossRef]
- Perić, S.; Milojković, M.; Stan, S.-D.; Banić, M.; Antić, D. Dealing with Low Quality Images in Railway Obstacle Detection System. Appl. Sci. 2022, 12, 3041. [Google Scholar] [CrossRef]
- Karakose, M.; Yaman, O.; Baygin, M.; Murat, K.; Akin, E. A new computer vision based method for rail track detection and fault diagnosis in railways. Int. J. Mech. Eng. Robot. Res. 2017, 6, 22–27. [Google Scholar] [CrossRef]
- Song, Y.; Liu, Z.; Rønnquist, A.; Nåvik, P.; Liu, Z. Contact Wire Irregularity Stochastics and Effect on High-Speed Railway Pantograph–Catenary Interactions. IEEE Trans. Instrum. Meas. 2020, 69, 8196–8206. [Google Scholar] [CrossRef]
- Aydin, İ.; Karaköse, E.; Karaköse, M.; Gençoğlu, M.T.; Akın, E. A new computer vision approach for active pantograph control. In Proceedings of the 2013 IEEE INISTA, Albena, Bulgaria, 19–21 June 2013; pp. 1–5. [Google Scholar] [CrossRef]
- Chenarlogh, V.A.; Razzazi, F.; Mohammadyahya, N. A Multi-View Human Action Recognition System in Limited Data Case using Multi-Stream CNN. In Proceedings of the 2019 5th Iranian Conference on Signal Processing and Intelligent Systems (ICSPIS), Shahrood, Iran, 18–19 December 2019. [Google Scholar] [CrossRef]
- Chenarlogh, V.A.; Razzazi, F. Multi-stream 3D CNN structure for human action recognition trained by limited data. IET Comput. Vis. 2018, 13, 338–344. [Google Scholar] [CrossRef]
- Roshani, M.; Sattari, A.M.; Ali, M.J.P.; Roshani, H.G.; Nazemi, B.; Corniani, E.; Nazemi, E. Application of GMDH neural network technique to improve measuring precision of a simplified photon attenuation based two-phase flowmeter. Flow Meas. Instrum. 2020, 75, 101804. [Google Scholar] [CrossRef]
- Dizaji, M.R.; Yazdi, M.R.H.; Shirzi, M.A.; Gharehnazifam, Z. Fuzzy supervisory assisted impedance control to reduce collision impact. In Proceedings of the 2014 Second RSI/ISM International Conference on Robotics and Mechatronics (ICRoM), Tehran, Iran, 15–17 October 2014. [Google Scholar] [CrossRef]
- Mahmood, L.; Bahroun, Z.; Ghommem, M.; Alshraideh, H. Assessment and performance analysis of Machine learning techniques for gas sensing E-nose systems. Facta Univ. Ser. Mech. Eng. 2022. [Google Scholar] [CrossRef]
- Rosić, S.; Stamenković, D.; Banić, M.; Simonović, M.; Ristić-Durrant, D.; Ulianov, C. Analysis of the Safety Level of Obstacle Detection in Autonomous Railway Vehicles. Acta Polytech. Hung. 2022, 1, 187–205. [Google Scholar] [CrossRef]
- Wang, X.; Li, B.; Geng, Q. Runway detection and tracking for unmanned aerial vehicle based on an improved canny edge detection algorithm. In Proceedings of the 2012 4th International Conference on Intelligent Human-Machine Systems and Cybernetics, Nanchang, China, 26–27 August 2012. [Google Scholar] [CrossRef]
- Ma, Q.D.Y.; Ma, Z.; Ji, C.; Yin, K.; Zhu, T.; Bian, C. Artificial Object Edge Detection Based on Enhanced Canny Algorithm for High-Speed Railway Apparatus Identification. In Proceedings of the 2017 10th International Congress on Image and Signal Processing, BioMedical Engineering and Informatics (CISP-BMEI), Shanghai, China, 14–16 October 2017. [Google Scholar] [CrossRef]
- Karakose, M.; Yaman, O.; Murat, K.; Akin, E. A New Approach for Condition Monitoring and Detection of Rail Components and Rail Track in Railway. Int. J. Comput. Intell. Syst. 2018, 11, 830–845. [Google Scholar] [CrossRef]
- Pavlović, M.; Nikolić, V.; Simonović, M.; Mitrović, V.; Ćirić, I. Edge detection parameter optimization based on the genetic algorithm for rail track detection. Facta Univ. Ser. Mech. Eng. 2019, 17, 333–344. [Google Scholar] [CrossRef]
- Shah, A.A.; Chowdhry, B.S.; Memon, T.D.; Kalwar, I.H.; Andrew Ware, J. Real time identification of railway track surface faults using canny edge detector and 2D discrete wavelet transform. Ann. Emerg. Technol. Comput. 2020, 4, 53–60. [Google Scholar] [CrossRef]
- Cai, L.; Ma, Y.; Yuan, T.; Wang, H.; Xu, T. An Application of Canny Edge Detection Algorithm to Rail Thermal Image Fault Detection. J. Comput. Commun. 2015, 3, 19–24. [Google Scholar] [CrossRef][Green Version]
- Xu, Z.; Baojie, X.; Guoxin, W. Canny edge detection based on Open CV. In Proceedings of the 2017 IEEE 13th International Conference on Electronic Measurement & Instruments, Yangzhou, China, 22–27 October 2017. [Google Scholar] [CrossRef]
- Song, R.; Zhang, Z.; Liu, H. Edge connection based Canny edge detection algorithm. J. Inf. Hiding Multimed. Signal Processing 2017, 8, 740–747. [Google Scholar] [CrossRef]
- Maire, F.; Bigdeli, A. Obstacle-free range determination for rail track maintenance vehicles. In Proceedings of the 11th International Conference on Control, Automation, Robotics and Vision, ICARCV, Singapore, 7–10 December 2010. [Google Scholar] [CrossRef]
- Jiang, L.; Liu, H.; Zhu, H.; Zhang, G. Improved YOLO v5 with balanced feature pyramid and attention module for traffic sign detection. In Proceedings of the MATEC Web of Conferences, Les Ulis, France, 12 January 2022. [Google Scholar] [CrossRef]
- Zhang, H.; Qin, L.; Li, J.; Guo, Y.; Zhou, Y.; Zhang, J.; Xu, Z. Real-Time Detection Method for Small Traffic Signs Based on Yolov3. IEEE Access 2020, 8, 64145–64156. [Google Scholar] [CrossRef]
- Redmon, J.; Divvala, S.; Girshick, R.; Farhadi, A. You Only Look Once: Unified, Real-Time Object Detection. In Proceedings of the IEEE Conference Computer Vision Pattern Recognition (CVPR), Las Vegas, NV, USA, 27–30 June 2016. [Google Scholar] [CrossRef]
- Redmon, J.; Farhadi, A. YOLO9000: Better, Faster, Stronger. In Proceedings of the 2017 IEEE Conference on Computer Vision and Pattern Recognition (CVPR), Honolulu, HI, USA, 21–26 July 2017. [Google Scholar] [CrossRef]
- Gu, J.; Wang, Z.; Kuen, J.; Ma, L.; Shahroudy, A.; Shuai, B.; Liu, T.; Wang, X.; Wang, L.; Wang, G.; et al. Recent Advances in Convolutional Neural Networks. Pattern Recognit. 2018, 77, 354–377. [Google Scholar] [CrossRef]
- Available online: https://www.youtube.com/watch?v=z5st8T-bPJo (accessed on 27 April 2022).
- Rulebook on Types of Signals, Signal Markings and Markings on Railways. Available online: http://www.podaci.net/dodaci/SCG/P-vssoop03v2051_Pravilnik.htm (accessed on 27 April 2022).
- Ye, T.; Wang, B.; Song, P.; Li, J. Automatic Railway Traffic Object Detection System Using Feature Fusion Refine Neural Network under Shunting Mode. Sensors 2018, 18, 1916. [Google Scholar] [CrossRef] [PubMed]
Figure 1.
Railway infrastructure—multiple tracks and signals along the train path.
Figure 1.
Railway infrastructure—multiple tracks and signals along the train path.
Figure 2.
Flow chart—System for detection of rails and signals on the railway.
Figure 2.
Flow chart—System for detection of rails and signals on the railway.
Figure 3.
Railway infrastructure (Novi Sad–Belgrade route). (a) Original image; (b) grayscale image.
Figure 3.
Railway infrastructure (Novi Sad–Belgrade route). (a) Original image; (b) grayscale image.
Figure 4.
Image processing. (a) Blurred image; (b) Canny image.
Figure 4.
Image processing. (a) Blurred image; (b) Canny image.
Figure 5.
Hough transform, detected track of the train route marked by blue lines. (a) Two rail tracks; (b) three rail tracks.
Figure 5.
Hough transform, detected track of the train route marked by blue lines. (a) Two rail tracks; (b) three rail tracks.
Figure 6.
Hough transform. (a) Initial set of the parameters. (b) Adjusted set of the parameters.
Figure 6.
Hough transform. (a) Initial set of the parameters. (b) Adjusted set of the parameters.
Figure 7.
Green sign, both day and night sign; signal on the left: free to pass, expect free to pass or careful; middle and signal on the right: free to pass.
Figure 7.
Green sign, both day and night sign; signal on the left: free to pass, expect free to pass or careful; middle and signal on the right: free to pass.
Figure 8.
Selected examples of daily images—before evening (closer than 25 m from the camera). Adapted with permission from [
32].
Figure 8.
Selected examples of daily images—before evening (closer than 25 m from the camera). Adapted with permission from [
32].
Figure 9.
Selected examples of daily images—morning (more than 75 m from the cameraSdapted with permission from [
32].
Figure 9.
Selected examples of daily images—morning (more than 75 m from the cameraSdapted with permission from [
32].
Figure 10.
Selected examples of night images plus tunnel (closer than 25 m from the camera). Adapted with permission from [
32].
Figure 10.
Selected examples of night images plus tunnel (closer than 25 m from the camera). Adapted with permission from [
32].
Figure 11.
Labeled images—Rectangle method. (a) Signal relatively far from the camera; (b) signal relatively close to the camera.
Figure 11.
Labeled images—Rectangle method. (a) Signal relatively far from the camera; (b) signal relatively close to the camera.
Figure 12.
Signal detection—bounding box, class, and system reliability (dataset 150).
Figure 12.
Signal detection—bounding box, class, and system reliability (dataset 150).
Figure 13.
Signal detection—bounding box, class, and system reliability (dataset 500).
Figure 13.
Signal detection—bounding box, class, and system reliability (dataset 500).
Figure 14.
Graph of mean reliability for all three trained networks.
Figure 14.
Graph of mean reliability for all three trained networks.
Figure 15.
System for detection of rail track and signals on the railway based on integrated Hough–YOLO method (a) Signal relatively close from the camera; (b) signal relatively far to the camera..
Figure 15.
System for detection of rail track and signals on the railway based on integrated Hough–YOLO method (a) Signal relatively close from the camera; (b) signal relatively far to the camera..
Figure 16.
Overhead system detection—catenary rail lines and contact line mast—test image 1.
Figure 16.
Overhead system detection—catenary rail lines and contact line mast—test image 1.
Figure 17.
Overhead system detection—catenary rail lines and contact line mast—test image 2.
Figure 17.
Overhead system detection—catenary rail lines and contact line mast—test image 2.
Figure 18.
Intersection over union. (a) Average IoU of validation dataset. (b) Labeled bounding box—blue; predicted bounding box—green.
Figure 18.
Intersection over union. (a) Average IoU of validation dataset. (b) Labeled bounding box—blue; predicted bounding box—green.
Figure 19.
Intersection over union (CNNs 150, CNNs 500, and CNNs 1000).
Figure 19.
Intersection over union (CNNs 150, CNNs 500, and CNNs 1000).
Table 1.
Comparison of the algorithm reliability between CNNs (dataset 150 images), CNNs (dataset 500 images), and CNNs (dataset 1000 images).
Table 1.
Comparison of the algorithm reliability between CNNs (dataset 150 images), CNNs (dataset 500 images), and CNNs (dataset 1000 images).
| Test Image | CNNs (Dataset 150) | CNNs (Dataset 500) | CNNs (Dataset 1000) |
|---|
| 11,700 | No detection | 83.2% | 85.3% |
| 20,950 | 81.98% | 89.75% | 92.75% |
| 21,650 | 99.67% | 99.71% | 99.71% |
| 25,550 | 78.96% | 66.08% | 91.5% |
| Signal 41 | 88.7% | 58.67% | 97% |
| test1 | 78.15% | 87.08% | 87.09% |
| 26,300 | 67.08% | 99.1% | 99.1% |
| 26,325 | No detection | 83.72% | 84% |
| 28,675 | 88.51% | 91.65% | 94% |
| Publisher’s Note: MDPI stays neutral with regard to jurisdictional claims in published maps and institutional affiliations. |
© 2022 by the authors. Licensee MDPI, Basel, Switzerland. This article is an open access article distributed under the terms and conditions of the Creative Commons Attribution (CC BY) license (https://creativecommons.org/licenses/by/4.0/).


 ,
, 


