Article

Machine Learning-Powered Rainfall-Based Landslide Predictions in Hong Kong—An Exploratory Study

by
Helen Wai Ming Li
*,
Frankie Leung Chak Lo
,
Thomas Kwok Chi Wong
and
Raymond Wai Man Cheung
Geotechnical Engineering Office, Civil Engineering and Development Department, Government of HKSAR, Hong Kong SAR, China
*
Author to whom correspondence should be addressed.
Appl. Sci. 2022, 12(12), 6017; https://doi.org/10.3390/app12126017
Submission received: 14 April 2022 / Revised: 10 June 2022 / Accepted: 10 June 2022 / Published: 13 June 2022
(This article belongs to the Special Issue Machine Learning for Landslide Susceptibility)

Abstract

:
Practical landslide predictions are instrumental to effective landslide risk management. Recently, the use of machine learning (ML) has become a promising alternative means for landslide predictions. This paper discusses the recent progress of a pilot study of ML-powered rainfall-based natural terrain landslide susceptibility analysis in Hong Kong. This study is different to other similar studies in that: (1) data sampling commonly used to deal with an imbalanced dataset is not adopted, and (2) the incorporation of domain knowledge on landslide characteristics for the development of physically meaningful ML models. The results are found to be promising, with the achieved ROC AUC up to 91.5% based on the testing data. The resolution of the susceptibility map is enhanced by approximately three orders of magnitude further than the introduction of additional features critically selected with feature engineering and based on domain knowledge and past experiences.

1. Introduction

Hong Kong is a metropolitan city of approximately 1100 km2 in size, supporting a population of over seven million. Its land comprises hilly terrain with some 63% of the land steeper than 15° and over 30% steeper than 30°. As a result, there is a high concentration of population and infrastructural developments near natural hillsides and man-made slopes, which are susceptible to landslides under heavy rainstorms. This urban setting thus calls for the continual development of the landslide risk management system of the city, which has been managed by the Geotechnical Engineering Office (GEO) since 1977 [1].
Over the past 40 years, the GEO has been progressively establishing, maintaining, and enhancing inventories of territory-wide landslide-related data of high resolutions in both spatial and temporal terms. Examples include a comprehensive inventory of historical landslides, a LiDAR-based digital terrain model for the territory, and real-time 1-min interval rainfall records through a dense network of rain gauges over the territory (about one rain gauge per 10 km2). These high-quality data have been used to support the development of practical landslide prediction models, which are instrumental to effective landslide risk management. The landslide prediction models have been used for landslide susceptibility mapping [2] and landslip early warning [3] in Hong Kong. Historically, these models were developed mainly based on data-driven analyses using a conventional statistical approach.
Recently, taking advantage of the versatility of machine learning (ML) techniques and the wealth of landslide-related data collated over the years, the GEO has been exploring the application of ML algorithms to landslide predictions. As an exploratory study, an ML-powered natural terrain landslide susceptibility analysis has been initiated. Details of the study, which is an expansion on the study discussed in Li et al. (2022) [4], are presented in this paper.

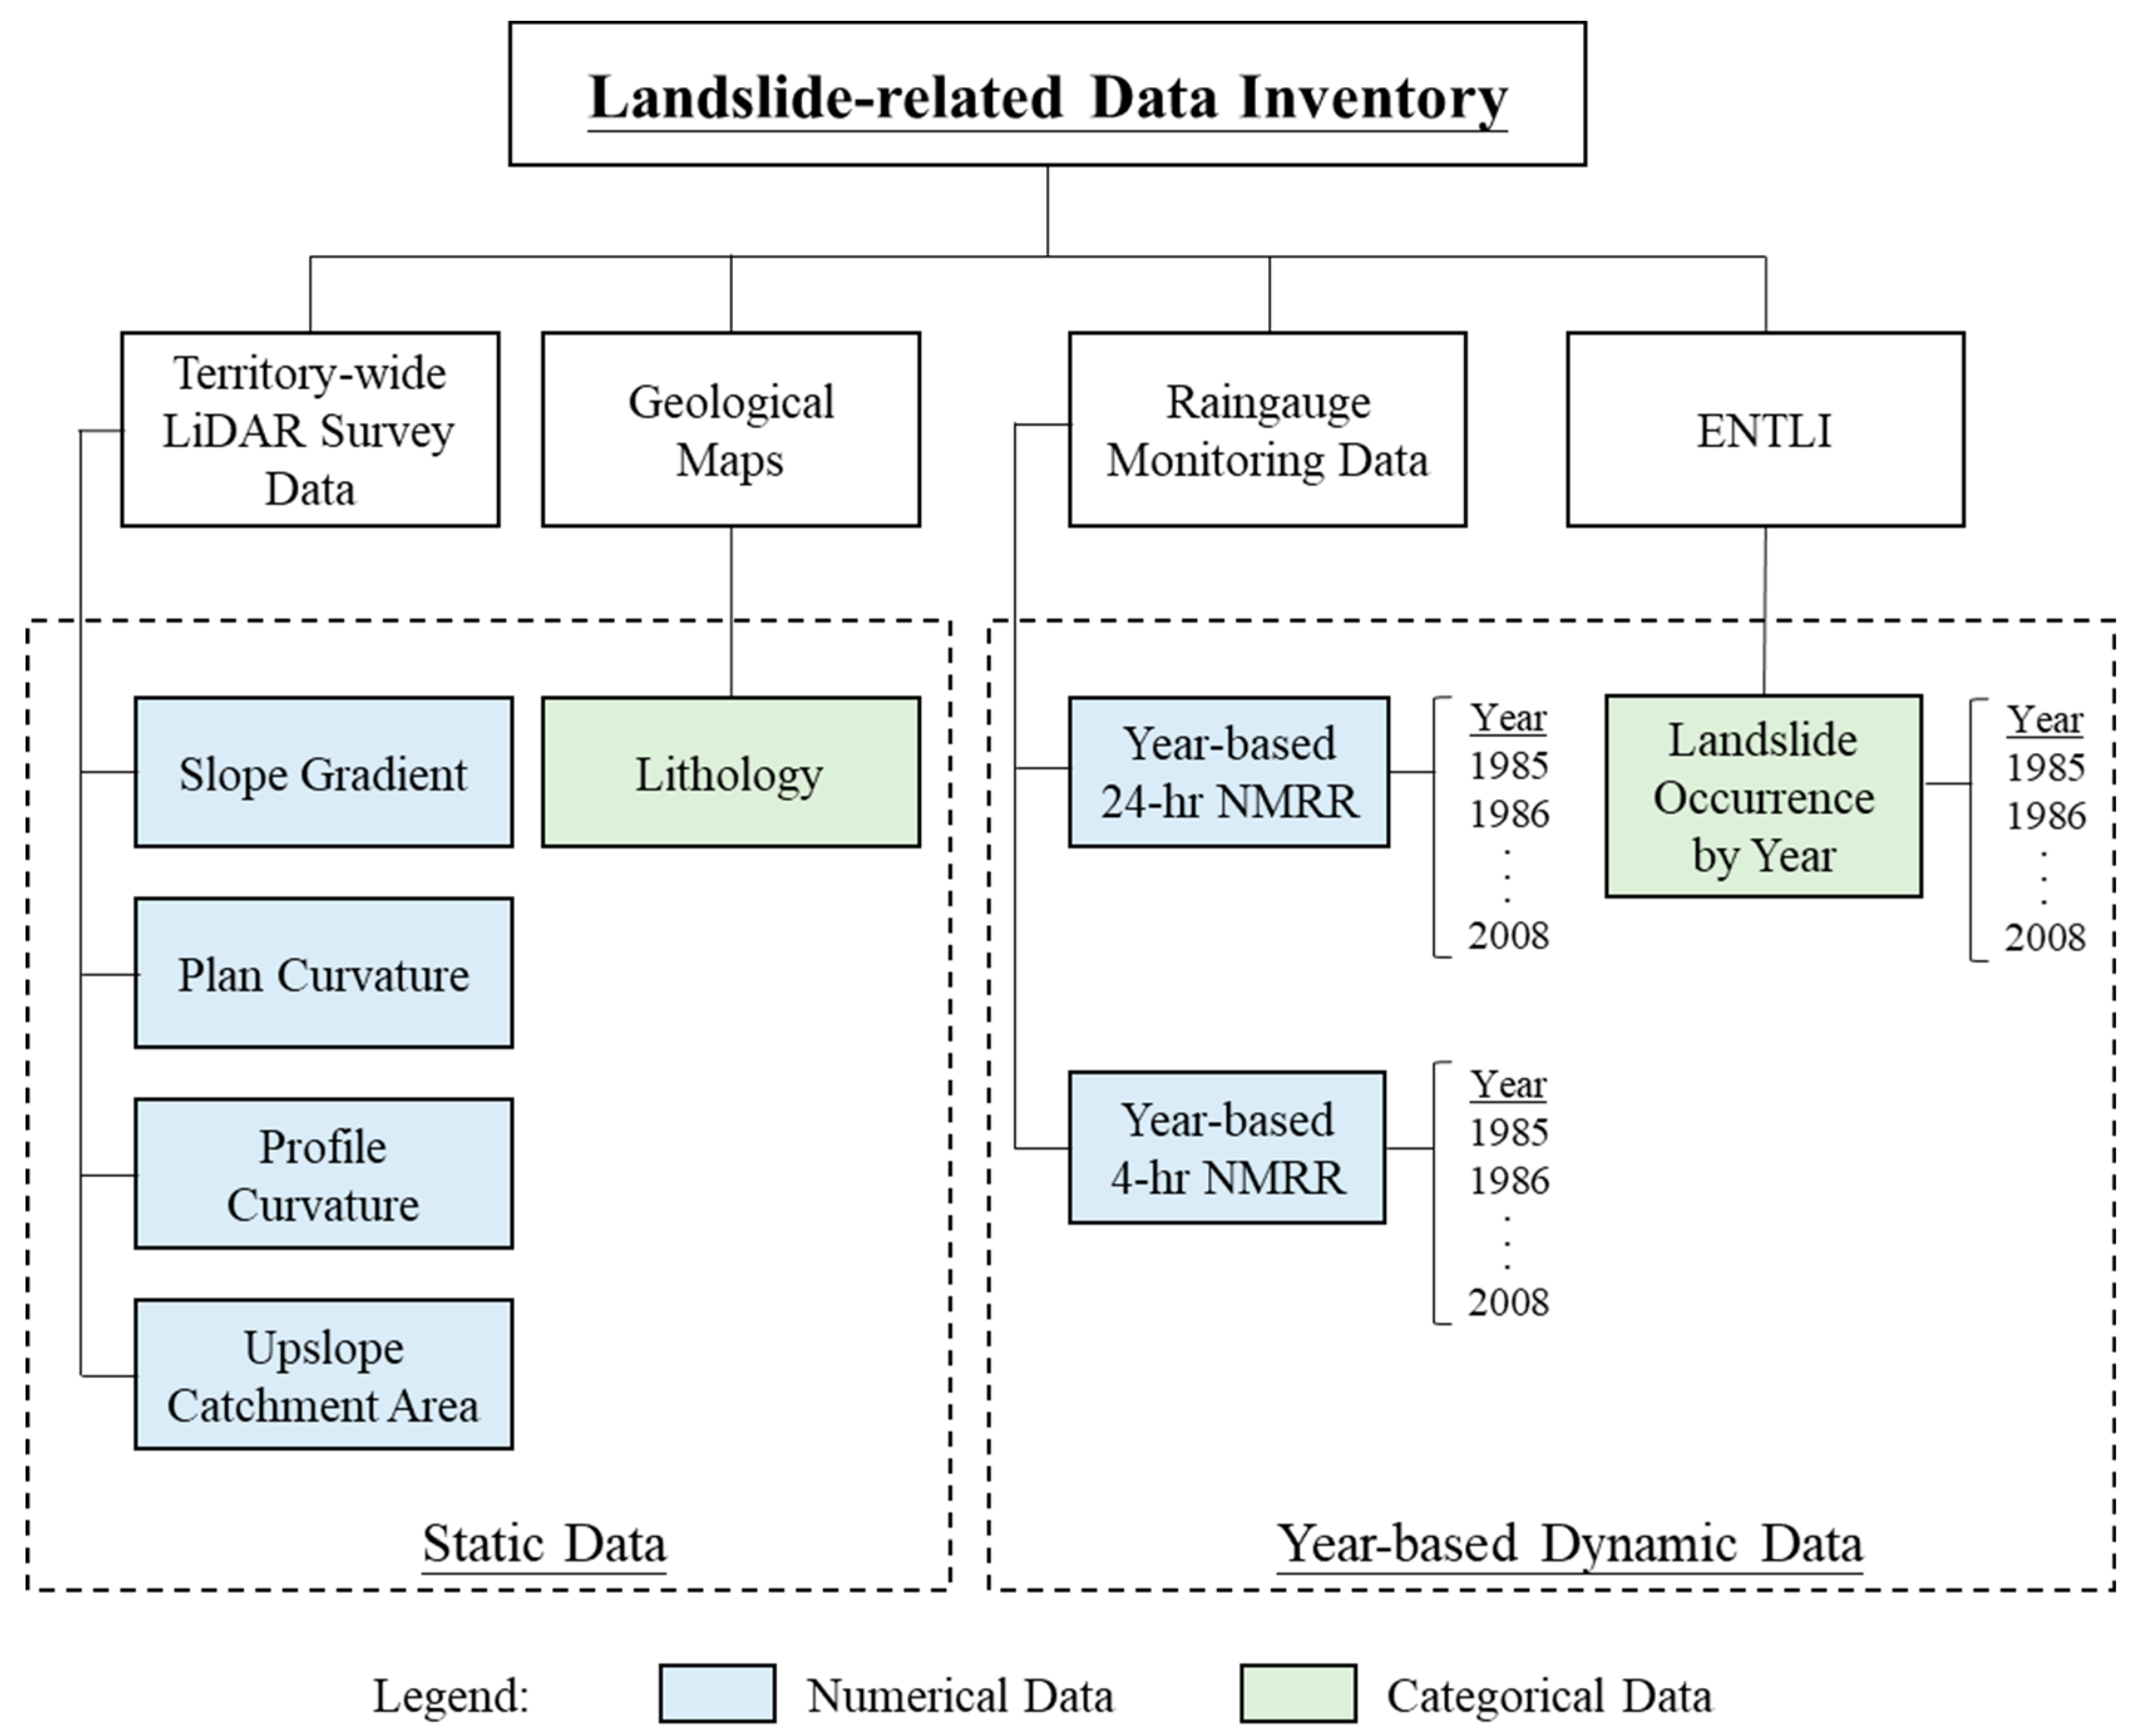
2. Landslide-Related Data Inventory in Hong Kong

Data are a fundamental component to forming a landslide prediction model. The GEO has been collecting a spectrum of landslide-related data in Hong Kong over the past 40 years. Several geotechnical data inventories have been formed, maintained, and continually enhanced in light of technological advancements (e.g., improved instrumentation and data acquisition technology). Depending on the nature and purpose of the landslide prediction model, a pertinent database is identified for feature engineering and the data are used to construct, train, or evaluate the machine learning models (see Figure 1). The data inventories considered in this pilot study are briefly described in the following figure.

2.1. Enhanced Natural Terrain Landslide Inventory (ENTLI)

Landslides can occur on natural hillsides and remote areas without affecting the public. Therefore, there should be several landslides not being reported to the GEO, including those that occurred before 1984. Since the mid-1990s, the GEO has been maintaining a comprehensive territory-wide Geographic Information System (GIS)-based inventory of natural terrain landslides, which are identified from aerial photograph interpretation. High-flight aerial photographs that were taken at a height of 2400 m or above since 1945 were initially used for the creation of this landslide inventory, referred to as the Natural Terrain Landslide Inventory (NTLI), in 1997. Over 30,000 recent and relict landslides were recorded in the NTLI [5]. In 2007, the NTLI was replaced by the Enhanced Natural Terrain Landslide Inventory (ENTLI) to incorporate the results from the mapping of historical natural terrain landslides using both low-flight (taken at less than 2400 m altitude) and high-flight aerial photographs such that missing or mis-identified historical landslides as a result of the limited resolution and temporal coverage of the high-flight aerial photographs would be reduced. Figure 2a shows the spatial distribution of relict and recent natural terrain landslides as recorded in ENTLI until 2019. The ENTLI provides important data and is widely used for studies of territory-wide and site-specific natural terrain landslide hazards.

2.2. Rainfall

The occurrence of landslides in Hong Kong is closely correlated with the rainfall intensity and duration. In this regard, the GEO has been operating an extensive network of automatic rain gauge stations to collect real-time rainfall data, which have also been used for operating the Landslip Warning System [4]. Currently, there are 121 automatic rain gauge stations in the network, which covers the whole territory of Hong Kong with an average density of one rain gauge per 10 km2 (Figure 2b). The rainfall data of each GEO rain gauge are transmitted to a cloud platform at 1 min intervals through dual-active mobile networks. The system has been continuously enhanced by the state-of-the-art of the Internet-of-Things technology, to provide more accurate and reliable rainfall monitoring data over the territory of Hong Kong. With the data, spatial and temporal distributions of rainfall with different durations for a given rainstorm can be readily determined for subsequent analyses.

2.3. Airborne Light Detection and Ranging (LiDAR) Survey

Another key factor governing landslide susceptibility is the terrain condition. To acquire such geospatial information, the GEO carried out the first airborne Light Detection and Ranging (LiDAR) survey for the whole territory of Hong Kong in 2010 [6]. The multi-return LiDAR survey technique could overcome the problem of the views being obscured by dense vegetation, thereby obtaining the ‘bare-earth’ profile of the city and identifying geomorphological features such as landslide scars and debris trails more accurately. A 0.5 m-grid digital terrain model (DTM) was developed using the survey results (Figure 2c). Recently, in 2020, another LiDAR survey with point cloud density enhanced from 4 points/m2 to 16 points/m2 was completed, which could generate an even higher resolution DTM model. This high resolution DTM could be resampled into different grid sizes or converted into numerous types of topographic information with the use of GIS applications to serve different purposes. Examples of topographic information include slope gradient, aspect, plan curvature, profile curvature, topographic position index, and upslope catchment areas. These are essential data for landslide susceptibility mapping of an extensive area.

2.4. Geological Map

For years, the GEO has been undertaking extensive geological studies for Hong Kong. The geological data are well-documented to facilitate the planning and land use management of the city. Among others, fifteen 1:20,000-scale geological maps accompanied by six geological memoirs covering the entire territory of Hong Kong were prepared in the 1980s with reference to a large amount of available borehole data, tunnel logs, cut slope exposures, and geophysical survey records. As such, these geological maps are more detailed than the regional geological maps of other national surveys [7]. These maps have been further updated since 2003 to incorporate new geological information and the latest knowledge advancements. The updated maps were fully digitized and implemented on a GIS platform such that geological enquiries and geological data modelling could be carried out efficiently. An extract of the geological map is shown in Figure 2d.

3. The Pilot Study—ML-Powered Natural Terrain Landslide Susceptibility Analysis

3.1. Background

A landslide-prone area may exist on a hillside even though it is not evident from historical landslides. As a large proportion of the land area in Hong Kong consists of natural hillsides, it is of interest to provide an account of the spatial likelihood of landslide occurrence with due consideration of the different local terrain and environmental attributes in a territory-wide sense. Landslide susceptibility mapping can provide a broad categorization of landslide frequency and susceptibility for the zoning of terrains. In practice, depending on the resolution and reliability of the susceptibility mapping, the results can be applied to predicting the number of natural terrain landslides in a rainstorm and undertaking qualitative or quantitative risk assessment [8].
In Hong Kong, natural terrain landslide susceptibility analyses were undertaken at different scales and levels of detail. Table 1 summarizes the details of some notable studies, which can be classified as (a) the conventional statistical approach and (b) the machine learning (ML)-based approach. These approaches are briefly described as follows.
(1)
Conventional statistical approach: Evans & King (1998) [9] undertook the first landslide susceptibility analysis for the whole natural terrain of Hong Kong. The historical landslides observed from aerial photographs, together with the slope angle and lithology, were considered. The result provided five susceptibility classes differentiated by one order of magnitude in terms of landslide frequency (0.1 to 1 no. of landslide/km2/year). Subsequently, in cognizance of the rainfall’s effects on the landslides, Ko & Lo (2016) [2] proposed an updated, higher-resolution, and territory-wide natural terrain landslide susceptibility model by considering rainfall intensity as an additional conditioning factor. Year-based rainfall intensities were adopted. An enhanced resolution of the landslide and terrain data were also used. This updated landslide susceptibility model achieved an overall four to five orders of magnitude in terms of landslide density (no./km2).
(2)
Machine learning (ML)-based approach: Dai & Lee (2002) [10] adopted the logistic multiple regression method to categorize the relative landslide susceptibility of the natural terrain on an outlying island of Hong Kong. Recently, Ng et al. (2021) [11] carried out a territory-wide spatiotemporal modelling of rainfall-induced natural terrain landslides with ML and deep learning algorithms considering storm-based data. Both of these studies adopted grid-based analysis, which is by far the most commonly adopted mapping unit for statistically-based landslide susceptibility analysis [12]. Wang et al. (2021a) [13] performed an AI-based territory-wide landslide susceptibility analysis of Hong Kong with an object-based method. Object units of 30 m × 30 m formed of 2 m × 2 m grids were considered. These ML-based studies have proven to be powerful in learning the association between landslide occurrences and the set of conditioning factors in a mathematical manner.
As the conventional statistical approach requires the grouping of data and predefining correlations manually for curve-fitting, the resolution of the analysis is limited and the undertaking of a non-linear multivariate analysis is difficult. Hence, ML techniques become a popular means to model complex landslide problems and a promising predictive performance has been yielded [14]. In light of this, the GEO has recently commenced a pilot study to explore the potential improvements that can be brought to the natural terrain landslide susceptibility model with ML. This study is different from the aforementioned studies in that:
(a)
Data sampling commonly used in previous studies to deal with an imbalanced dataset is not adopted. This helps improve the resolution of the landslide susceptibility maps (see more details in Section 3.3);
(b)
A new feature selection framework has been proposed in this study for identifying features with physical significance to landslide occurrences in the ML model development (see more details in Section 3.5) to ensure domain knowledge on landslide characteristics, which is often lacking in previous studies, is duly considered for the development of physically meaningful ML models.
This pilot study is carried out based on the previous work by Ko & Lo (2016) [2]. Year-based analyses with landslide and conditioning factors and data covering the same period from year 1985 to 2008 were considered. The overall workflow of this study is illustrated in Figure 3. Each step will be discussed in sequence in the following.

3.2. The Study Area

The study area comprises the natural terrain areas of the Lantau Island, as well as those of the adjacent outlying islands as indicated in Figure 4. It covers about one-fifth of the natural hillsides of Hong Kong (about 130 km2 out of 660 km2). Over 30% of the study area is steeper than 30°, with the elevation varying from sea level to 930 m above sea level. The study area is mainly underlain by volcanic and intrusive rock, with a small area of sedimentary rock. According to the ENTLI, there were over 6100 recent natural terrain landslides recorded within the study area. The study area experienced severely intense rainfalls in 1993 and 2008, with the 24-h maximum rolling rainfall measurements of over 500 mm and 600 mm, respectively. The rainstorm on 7 June 2008 alone resulted in about 2500 natural terrain landslides. Given the high variabilities in the terrain-related and rainfall data available within the pilot study area, as well as its rich history of past landslides, it is considered as an appropriate study area providing plentiful data for the pilot study.

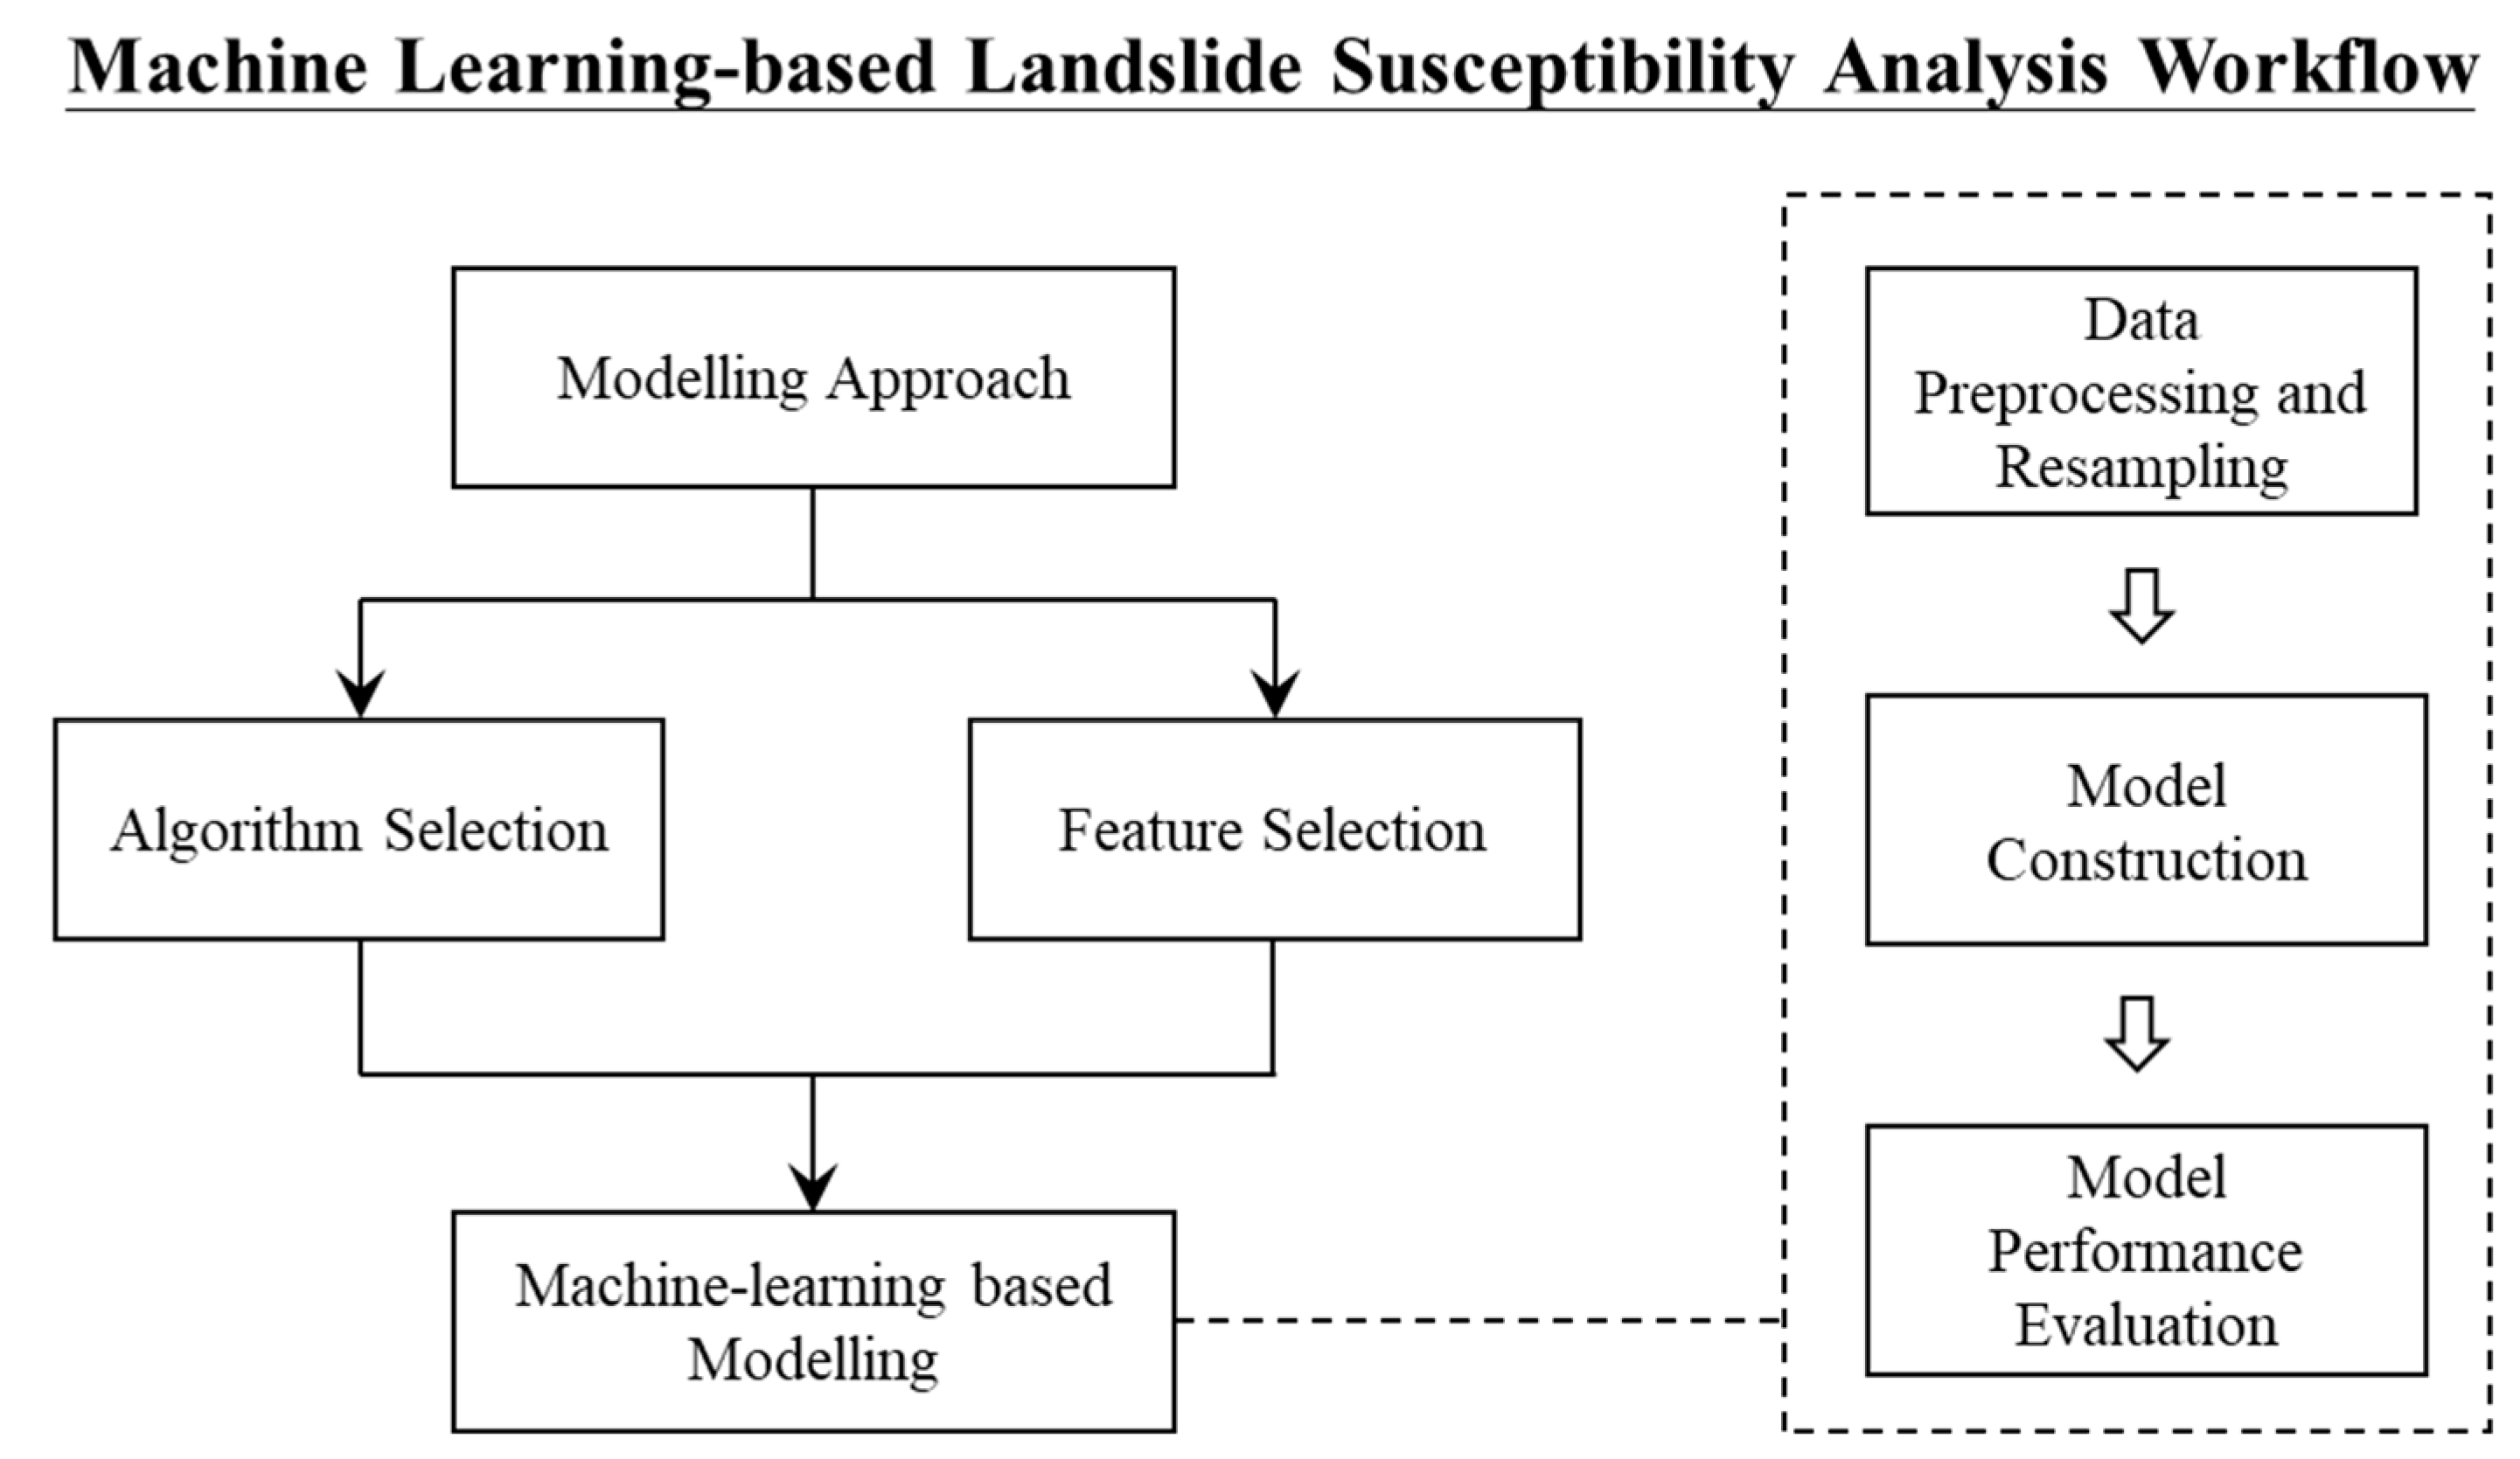
3.3. The Modelling Approach

The landslide susceptibility analysis in this pilot study was treated as a grid-based binary classification problem in machine learning, with year-based data adopted. A grid size of 5 m × 5 m is considered, which is consistent with Ko & Lo (2016) [2]. Reichenbach et al. (2018) [12] remarked that a grid-based approach is the most common type of mapping unit for landslide susceptibility modelling, which has also been adopted by many others [14].
One of the major challenges commonly encountered in applying binary classification in landslide susceptibility analyses is the sample bias due to the highly imbalanced dataset, as there is always a scarce proportion of positive value grids (grids with landslide crowns identified) within a study area. The ratio of positive value to negative value grids in the dataset for the study area is in the order of 1:30,000. Such an imbalance can cause a model to be biased towards classifying the susceptible area as safe (i.e., negative value), jeopardizing the accuracy of the minority class prediction. Ma et al. (2021) [15] outlined three typical solutions for overcoming this problem, out of which the data-level technique was commonly adopted in previous studies [10,11,16,17]. This method involves a selection of a 1:1 ratio (or other ratio as appropriate) of landsliding data points to non-landsliding data. However, Reichenbach et al. (2018) [12] remarked that such a sampling strategy may prove acceptable only if multiple random selections are performed to evaluate the effects of the sampling and to investigate the natural variability and the uncertainty introduced by the sampling, which is, however, seldom performed. On the other hand, sampling of the data would bias the predicted probabilities of a classifier and lead to a significant over prediction of landslide susceptibility without proper calibration. As the predicted probabilities of the classifier cannot give a realistic indication of the susceptibility, the predicted probability of landslide occurrence of the grids is usually reclassified to yield landslide susceptibility maps with finite classes (and thus limited resolution) of susceptibility.
In view of the above, this pilot study adopted an alternative approach to handle an imbalanced dataset. Under this approach, while the analysis was still handled as a binary classification problem, no data sampling was applied to avoid biasing the predicted probabilities of a classifier. Instead of taking the classes as predicted by the binary ML classifier (i.e., with or without landslides) directly, the predicted probability of the positive class is taken as the modelling result such that the effect of a sample bias can be avoided. Since the predicted probabilities of the classifier are not biased by data sampling, the predicted probability of the positive class could be taken as a proxy to the landslide probability without calibration. A similar approach was adopted in Xiao & Zhang (2021) [18] for forecasting the number of man-made slope failures in response to rainstorms with a machine learning technique for a slope-based analysis.

3.4. Algorithm Selection

So far, a wide range of conventional ML and deep learning (e.g., neural networks) algorithms have been developed for classification and regression purposes. They have been used in various landslide studies, yet there is still no consensus on an “optimal” algorithm nor a single “best” algorithm [14]. While Ma et al. (2020) [15] considered the use of ML methods in landslide predictions achieve satisfactory performance in general, the use of ensemble learners constructed from a set of base learners was recommended. Merghadi et al. (2020) [19] reviewed various ML methods for landslide susceptibility studies and suggested that tree-based ensemble algorithms achieve excellent results compared to others. Among the tree-based ensemble algorithms, the Random Forest algorithm was identified to offer robust performance for accurate landslide susceptibility mapping with only a small number of adjustments required before training the model. On the other hand, conventional ML algorithms are preferable to deep learning algorithms for structured data as the latter often work as black-box models which jeopardize the interpretability of the models.
In this pilot study, the ML algorithms were selected based on the following key factors.
  • Interpretability of the algorithms: how easy is it to explain the results from the input data, or to understand the patterns that models use to link to the training datasets (Ma et al., 2021). This factor is essential for detecting bias and debugging the models. The model predictions should also be explainable using our professional knowledge (domain knowledge) on landslides.
  • Balance between bias and variances: whether the algorithm can form a predictive model that is generalized enough to give consistent yet accurate forward predictions. Algorithms which are prone to overfitting should be avoided as a result.
  • Suitability for handling correlated features: the ability of an algorithm to handle correlated features provides additional flexibility in the selection of features and is thus preferable.
  • Computational efficiency: the time and computational effort spent on the study.
With reference to the above considerations, three tree-based ML algorithms, namely: Decision Tree [20], Random Forest [21], and XGBoost [22] were identified and adopted in this study. Table 2 provides a brief description of these ML algorithms.

3.5. Feature Selection

Feature selection is the process of reducing the dimensionality of input variables and creating summary measures to encapsulate the information in the entire dataset. Domain knowledge is used in the process to extract the characteristics and attributes from the raw data. Reichenbach (2018) [12] summarized the conditioning factors or features adopted in landslide susceptibility models, which were published in 565 articles from 1983 to 2016. In total, about 600 features were used, with 2–22 input variables adopted in a single model. While the study remarked that the use of morphology related features is particularly effective in predicting the spatial distribution of landslides, it also pointed out that some of the adopted features lack a physical correlation with landslide occurrence (e.g., aspect and elevation). The study recommended that more time should be spent on understanding the known or inferred role of the features in determining landslide susceptibility. In addition, redundant or irrelevant factors may create noise, decreasing the overall predictive capability of the models [15]. It suggested that in the process of seeking the proper parameters and threshold of each feature, conventional feature engineering involves a substantial amount of prior knowledge that should be carried out.
In view of the above, a new feature selection framework which ensures the quality, and the statistical and physical relevance of the features identified for inclusion in the ML models was proposed in this study, as deliberated in the following.

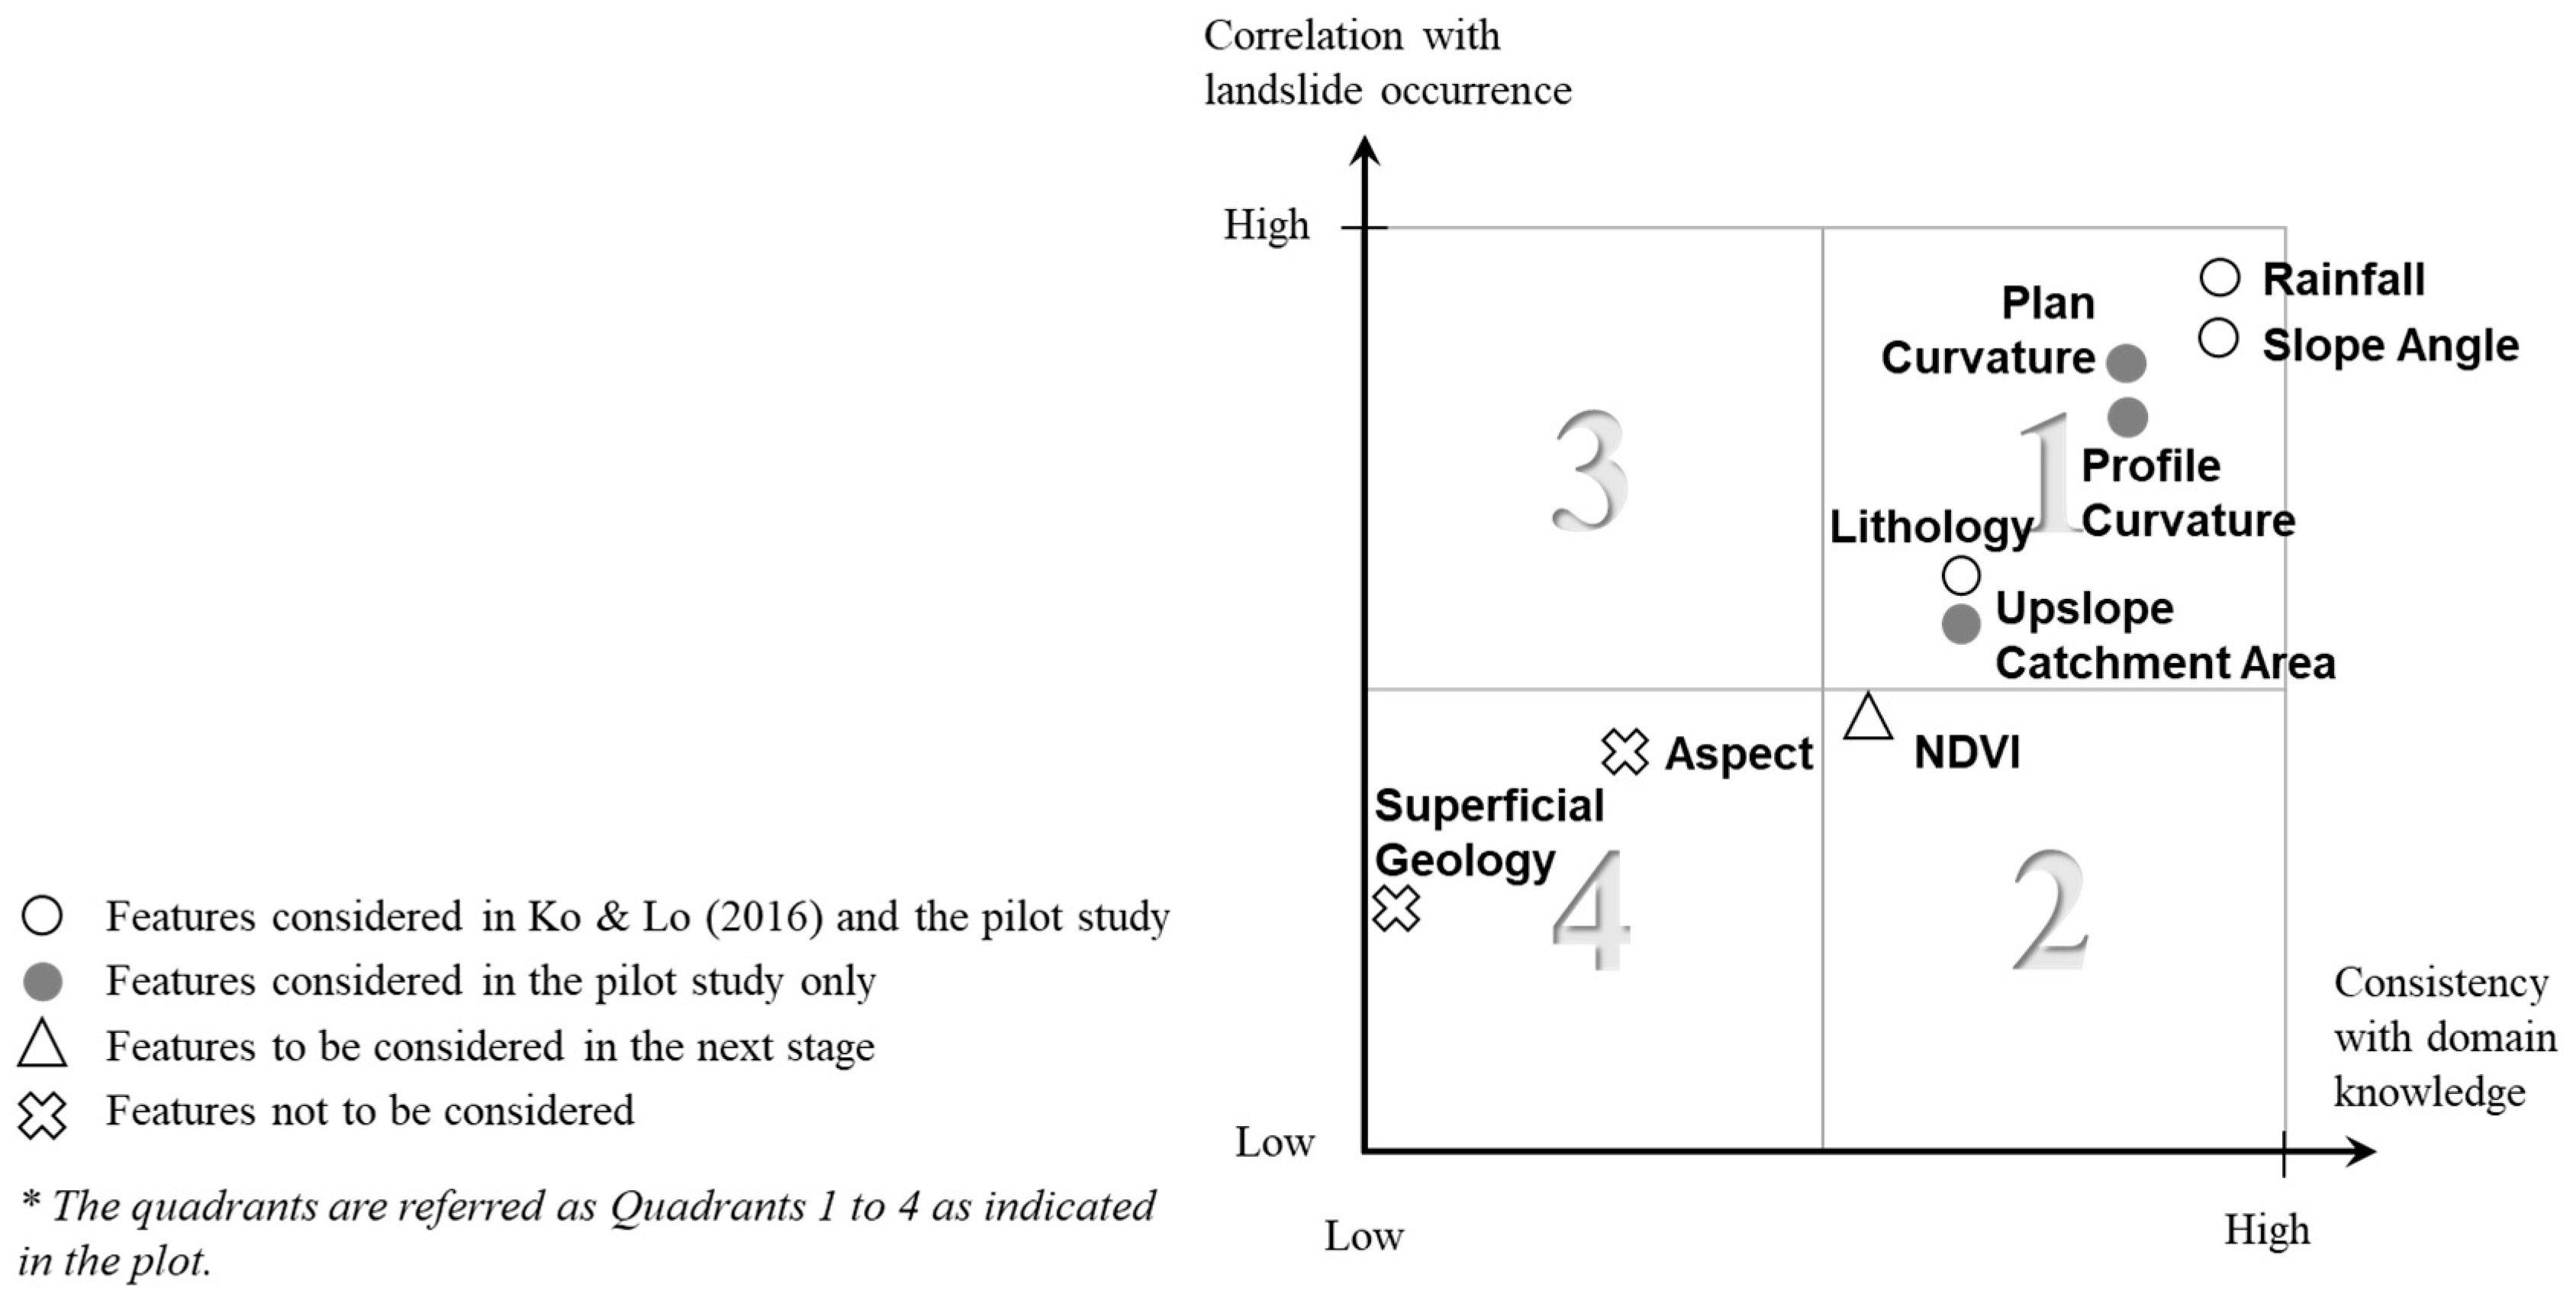
3.5.1. The Feature Selection Framework

Potential features were assessed for inclusion using the following criteria:
  • Criterion (i): the quality of feature datasets;
  • Criterion (ii): the statistical correlation between a feature and the landslide occurrence;
  • Criterion (iii): the consistency of the above correlation with the domain knowledge on landslide susceptibility.
Criterion (i) refers to the spatial and temporal coverage and resolution of the feature data, as well as the accuracy of the data. Good quality of the features datasets is considered crucial to ensuring that the correct data are used in training the ML model, such that the forward predictions made by the model will not be adversely affected by the quality of the training data.
Criteria (ii) and (iii) ensure the identified features are statistically and physically relevant to landslide susceptibility. As mentioned above, expert knowledge plays a significant role in enhancing the performance of machine learning models as it makes the models more explainable and contributes to the preprocessing of training data to overcome data imbalance and noise problems [14,15]. By reviewing the consistency of the observed correlation in Criterion (ii) against the existing engineering knowledge, Criterion (iii) allows for the incorporation of domain knowledge, experience and expert judgment on landslide susceptibility into the ML model.
In this pilot study, a feature selection priority matrix shown in Figure 5 was created for assessment against Criteria (ii) and (iii). Features that fall within the top right-hand quadrant (Quadrant 1) would have a higher priority of being included in the landslide susceptibility models in the pilot study, followed by those falling in the bottom right-hand quadrant (Quadrant 2). Features found in the top or bottom left-hand quadrants (Quadrants 3 and 4) reveal statistical correlations with landslide occurrence that do not tally with the existing engineering knowledge and should be thoroughly reviewed before inclusion.
The statistical correlation of the features to landslide occurrence (i.e., vertical axis of the feature selection priority matrix in Figure 5) was assessed by means of descriptive analytics. This allows for a preliminary appreciation and understanding of the available data. Figure 6 shows the correlations of the potential features with the density of past landslide occurrences (no./km2) using territory-wide data of Hong Kong. The distributions of the area against the categorized features are included in the plots for information. Detailed descriptions about these features and their correlation with landslide occurrence are discussed in the next Section.

3.5.2. The Selection Outcome

Table 3 summarizes the potential features and their results in an assessment against the feature selection framework. Two feature sets (FS1 & FS2) are distinguished. FS2 comprises all features considered in this study. FS1 comprises the same set of features considered in Ko & Lo (2016) [2] and is grouped here for an ease of comparison for the later examination of the degree of improvement due to additional features in FS2.
The features selected for this study and the details of their assessment against Criteria (i), (ii), and (iii) are summarized in Table 4. Those features that are not selected are described in Table 5. In brief, all selected features indicate strong statistical correlations with landslide susceptibility that are consistent with domain knowledge on landslide occurrences (i.e., fall within Quadrant 1 of the feature selection priority matrix in Figure 5). In addition, they are available with high-quality data in the GEO’s comprehensive landslide-related data inventories discussed in Section 2 above.

3.5.3. Landslide Data

For a landslide susceptibility analysis treated as a binary classification problem, landslide occurrence is the variable to be predicted by the ML models (i.e., dependent variable). In this study, landslide data as recorded in the ENTLI (see Section 2.3) was adopted. As compared with the reported landslides or field-mapped landslides which are commonly adopted in the landslide susceptibility studies by others, landslide data based on the ENTLI provided a more complete picture of landslide occurrence over the study area in the past which was not biased by the accessibility of the landslide locations. On the other hand, the temporal resolution of the data was limited by the frequencies of aerial photography. A year-based landslide susceptibility study was considered as a result.
In forming the landslide dataset, grids containing the crowns of the landslides were identified as the landsliding area and denoted as ‘1′ in the dataset. The remaining grids were considered as non-landsliding area and denoted as ‘0′ in the dataset. The identification of landsliding and non-landsliding grids were undertaken on a yearly basis from year 1985 to 2008.

3.6. The Machine Learning-Based Modelling

The discussion in this section is divided into three sub-steps: (1) data preprocessing and resampling, (2) model construction, and (3) model performance evaluation as illustrated in Figure 3.

3.6.1. Preprocessing and Resampling of Data

With the grid-based approach in the pilot study, the entire pilot study area was discretized into about 5.2 M numbers of 5 m × 5 m grids, each of which contains 24 years (year 1985 to 2008) of rainfall and landslide data on top of the other selected features (see Figure 7). Under the adopted approach, most of the data in the grids were used for either the construction or the evaluation of the machine learning models. Given the amount of data to be handled, the model construction and evaluation work of this pilot study were carried out on a web-service platform using the python programming language.
Data preprocessing refers to the preparation of data for model construction. Key actions include the cleansing of data, the encoding of categorical data, and the resampling of data for model training and evaluation. Data cleansing forms part of the feature engineering work, which involves the removal of null or undesirable data from the dataset to ensure only representative and unbiased data are fed into the models. For instance, data associated with rainfall intensities greater than 0.18 for 4-h normalized maximum rolling rainfall (NMRR) or beyond the range of 0.025–0.3 for 24-h NMRR were removed since only a very small portion of the pilot study area (about 0.3% from year 1985 to 2008) had encountered these extreme rainfall intensities in rare events, such that the associated data would not be representative enough for incorporation. The data points associated with the extreme values of the plan and profile curvatures were discarded for a similar reason. The only categorical data involved in the pilot study, the lithological data, was encoded with one-hot encoding for processing in the ML algorithms.
The resampling of the dataset along with the modelling is illustrated in Figure 8. The dataset was resampled into a training dataset, a validation dataset, and a testing dataset. The testing dataset for evaluating the models’ performance comprised (1) all the data from years 1993 and 2007, and (2) 10% of the data randomly selected from the remaining 22 years in a stratified manner. Stratified random sampling is a commonly adopted sampling technique in which the data are divided into smaller groups or strata and are then randomly selected from each of the strata by the same proportion. The data were stratified based on landslide occurrences in the pilot study such that the ratio of landsliding to non-landsliding data in each of the datasets could be maintained.
The two sets of testing data are referred to as Testing Data 1 (TD1) and Testing Data 2 (TD2). While TD2 pertained to the type of testing data commonly adopted in other similar studies, TD1 comprised data that possess unseen rainfall patterns during the model construction such that it served as a more stringent test of the models’ ability to make forward predictions. Of note, the intensity of rainfall in the year 1993 is one of the highest among the 24 years, whilst that in year 2007 is a moderate one. The remaining data served as the input datasets for the ML model construction as discussed in the next section.

3.6.2. Model Construction

Construction of the ML model mainly involves the optimization, or tuning, of the hyperparameters. Hyperparameters are parameters that control the learning process of a ML model, the optimal set of hyperparameters to be used varies by case as it is dependent on the algorithm and the dataset involved. Tehrani et al. (2021) [14] remarked that hyperparameter tuning plays a significant role in the performance and the predictive ability of an ML model. The tuning of hyperparameters is a process of trial and error, which can be done either systematically (e.g., grid search) or randomly. In this pilot study, the performances of each set of the hyperparameters considered were assessed by a five-fold cross-validation with the input dataset. The cross-validation technique reduces the bias and variance introduced by the random partitioning of the input dataset [19], a five-fold cross validation involved the key steps below.
  • Shuffling of the input dataset in a random manner.
  • Splitting of the shuffled dataset into nine groups in a stratified manner.
  • From (2), the selection of seven groups of the split data as a training dataset to fit the model.
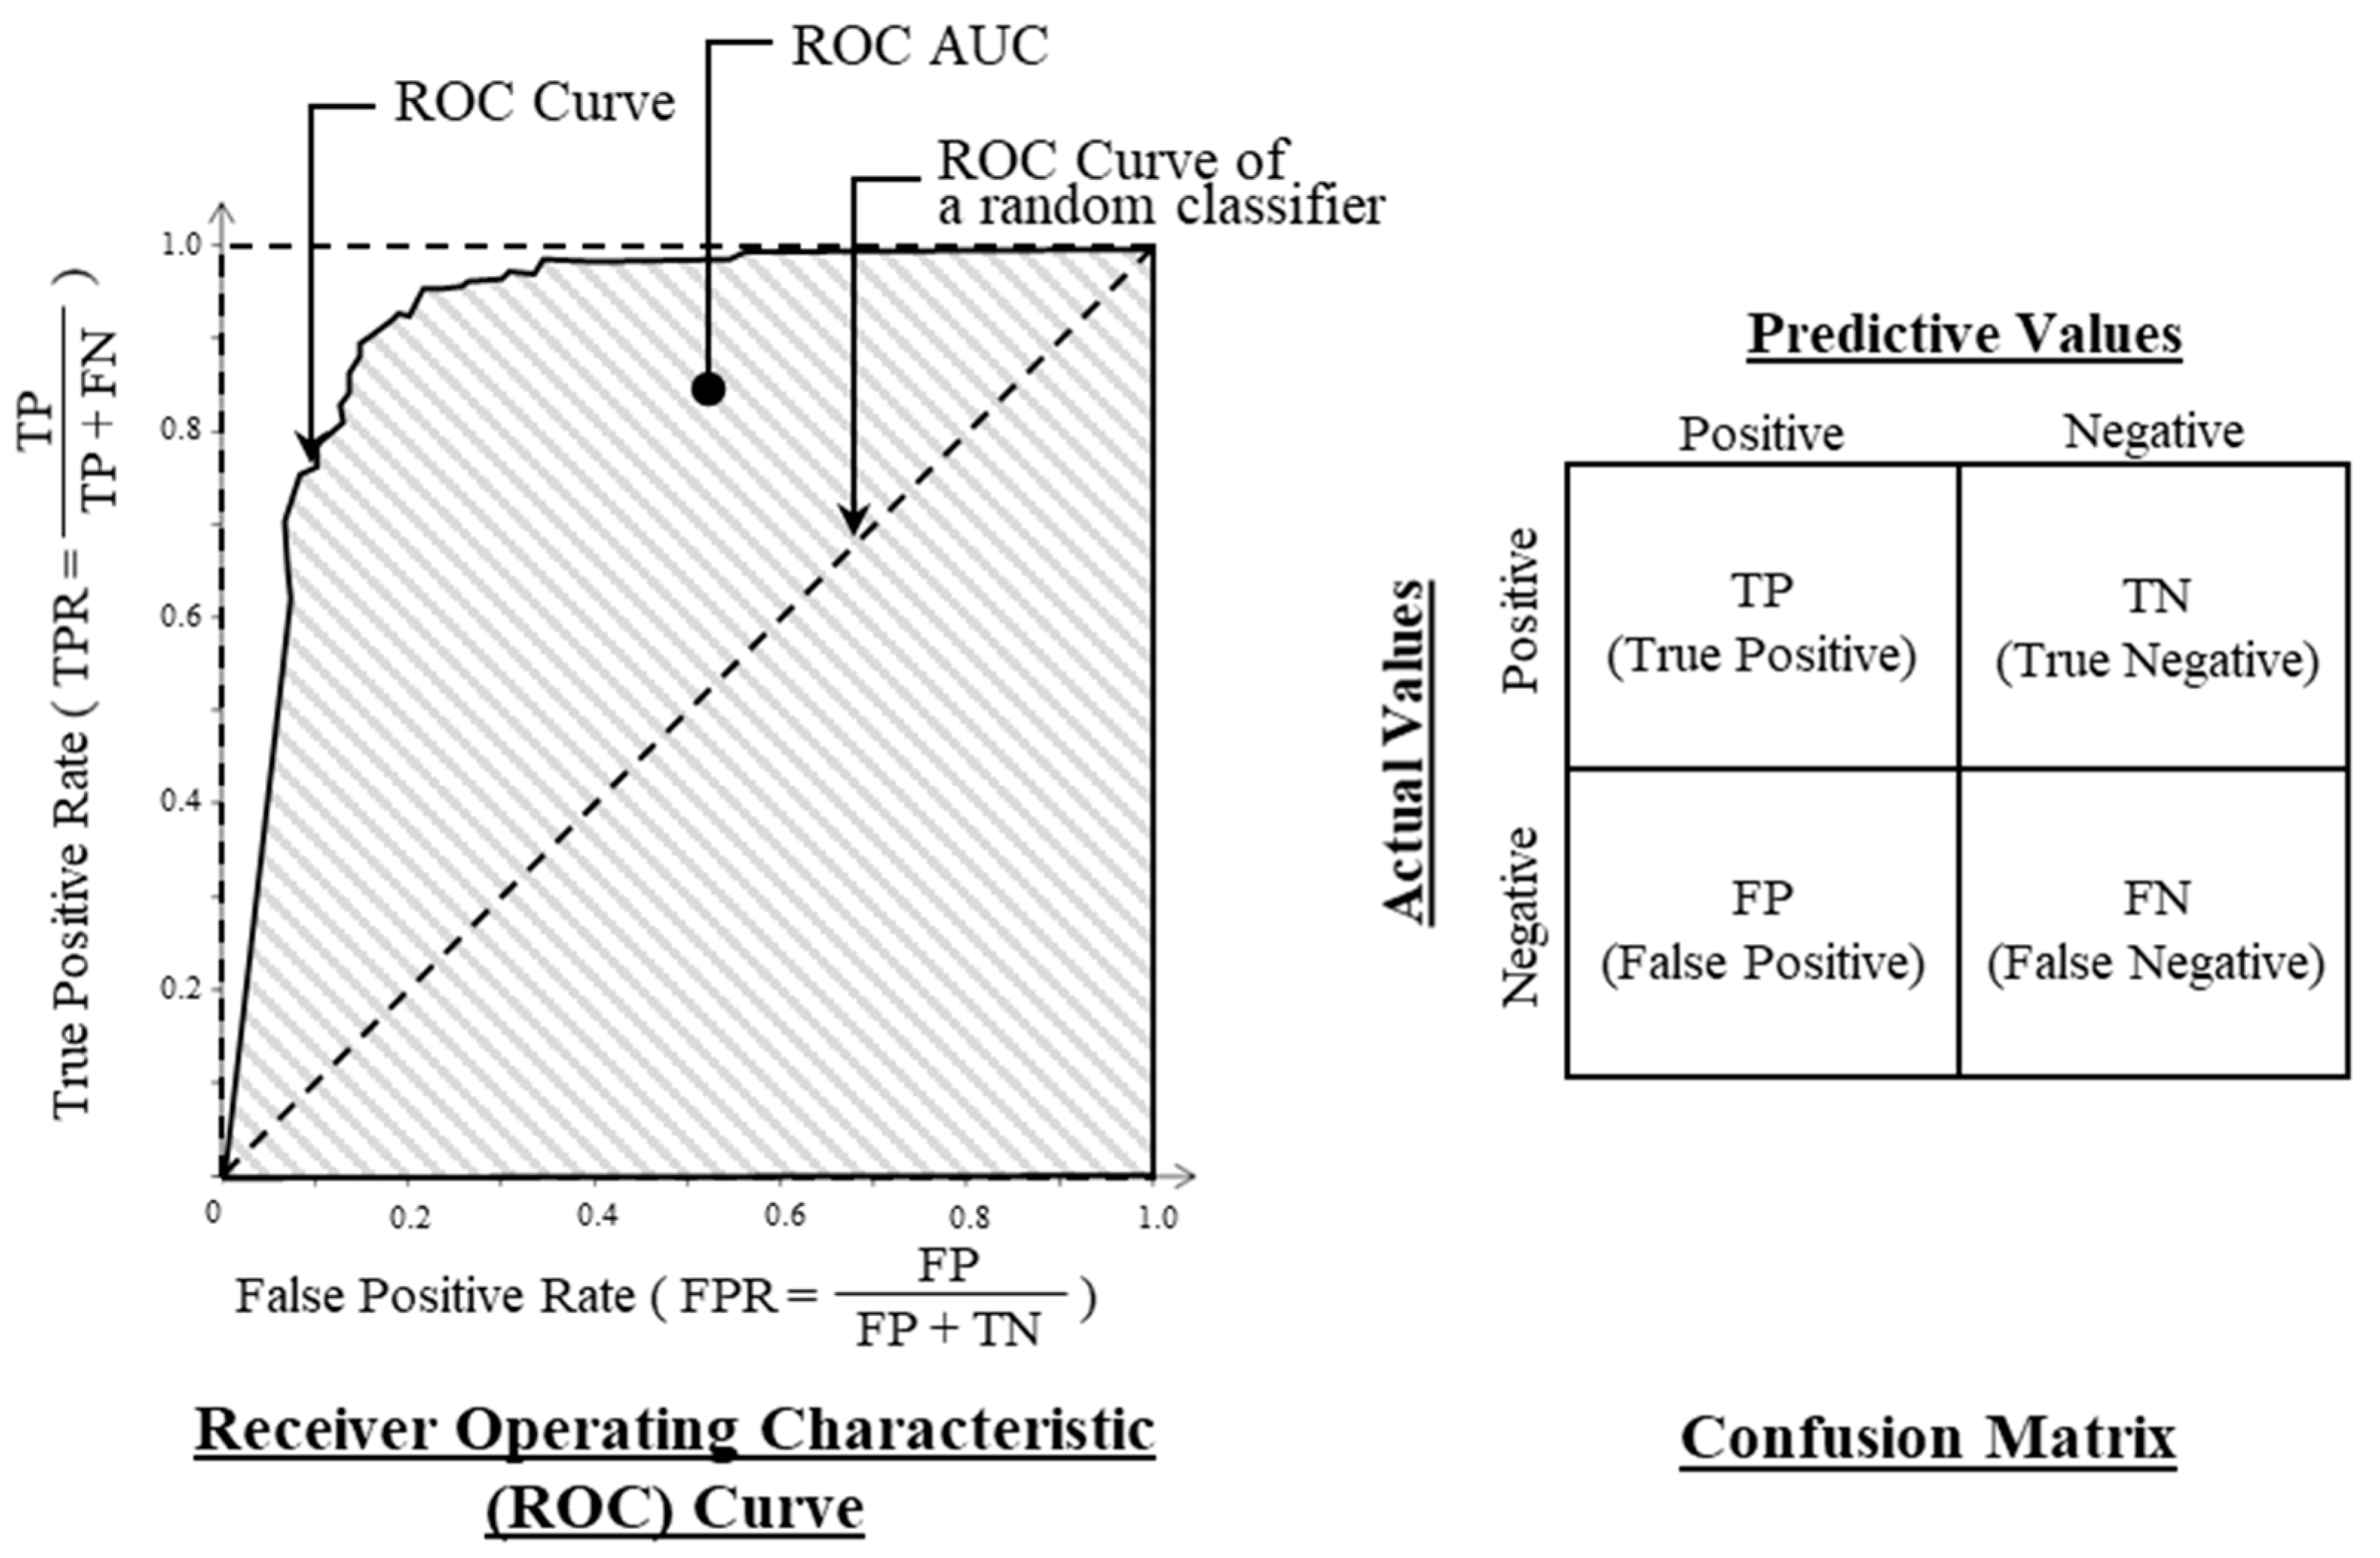
  • An evaluation of the trained model with the validation dataset (i.e., the remaining two groups of split data) based on the area under the receiver operating characteristic (ROC) curve.
  • Repetition of (3) and (4) five times.
Based on the two feature sets formed (i.e., FS1 and FS2 in Section 3.5.2), as well as the three ML algorithms and three combinations of NMRR durations to be taken into considerations, a total of 18 analysis cases have been identified in Table 6. For each of the analysis cases, the hyperparameters were tuned with the corresponding set of preprocessed data based on the same workflow. Afterwards, the model was formed by training using the entire input dataset without splitting.
Scikit learn packages were used for the implementation of the Decision Tree and Random Forest algorithms, whereas the XGBoost package was adopted for the XGBoost algorithm.

3.6.3. Model Performance Evaluation

The performance evaluation of the ML models was carried out at two levels. The first level comprised the conventional ML performance metrics calculation with the testing data, while the second level involved a more detailed evaluation of the model performance which included looking at the degree of resolution enhancement of the susceptibility map, as well as validating the map’s performance against the actual landslide data in a spatial manner.
(a)
Evaluation Metrics
Evaluation metrics serve as tools to measure the performance of the ML models. Among others, accuracy statistics, e.g., accuracy, sensitivity, specificity, threat score, odds ratio, etc., are widely adopted. These accuracy statistics are determined with reference to the classes of true positive (TP), false positive (FP), true negative (TN), and false negative (FN) in a confusion matrix (see Figure 9). A pre-determined cut-off value, or classification threshold that defines the splitting of the model predictions in binary classification, is required in determining those classes. Whilst a classification threshold of 0.5 is often adopted for other statistical-based landslide susceptibility studies that involve data sampling to achieve a 1:1 ratio of landsliding and non-landsliding data points, the determination of the threshold in this pilot study is less trivial given the modelling approach adopted.
In view of this fact, the performances of the ML models in this pilot study were evaluated using the Area Under Curve (AUC) of the receiver operating characteristic (ROC) curves (see Figure 9). An ROC curve plots the true positive rate (TPR) against the false positive rate (FPR) for different classification thresholds, such that the pre-determination of the threshold is not required. A higher ROC AUC value indicates the better performance of the model over the whole range of the classification threshold.
The ROC AUC of the ML models as assessed based on the input dataset (referred to as training data here) and the two sets of testing data (TD1 & TD2) are summarized in Table 7. The key observations from the evaluation results are summarized as follows:
  • The ROC AUC based on the training data of all cases are over 94%, indicating that the machine learning models fit the training data very well.
  • The ROC AUC based on the two sets of testing data are over 86%. The highest ROC AUCs based on TD1 and TD2 were up to 91.5% and 97.3%, respectively, for individual XGBoost models. The ROC AUC based on TD1 is obviously lower than that based on TD2 for all of the cases as the former served as a more stringent test of the models’ ability to make forward predictions. All in all, the ROC AUC values that were achieved reveal that all of the ML models are able to make fairly accurate predictions.
  • With reference to the ROC AUC based on the testing data, the XGBoost and Random Forest models perform better than the Decision Tree models. The introduction of additional features (i.e., FS2) improved the performance of the ML models; the effect is more obvious when the models were tested with TD2. On the other hand, the durations of NMRR seemed to have no significant effect on the models’ performances.
The second level of the model performance evaluation will focus on analysis model FS2-24-XGB which shows the highest ROC AUC for both TD1 and TD2.
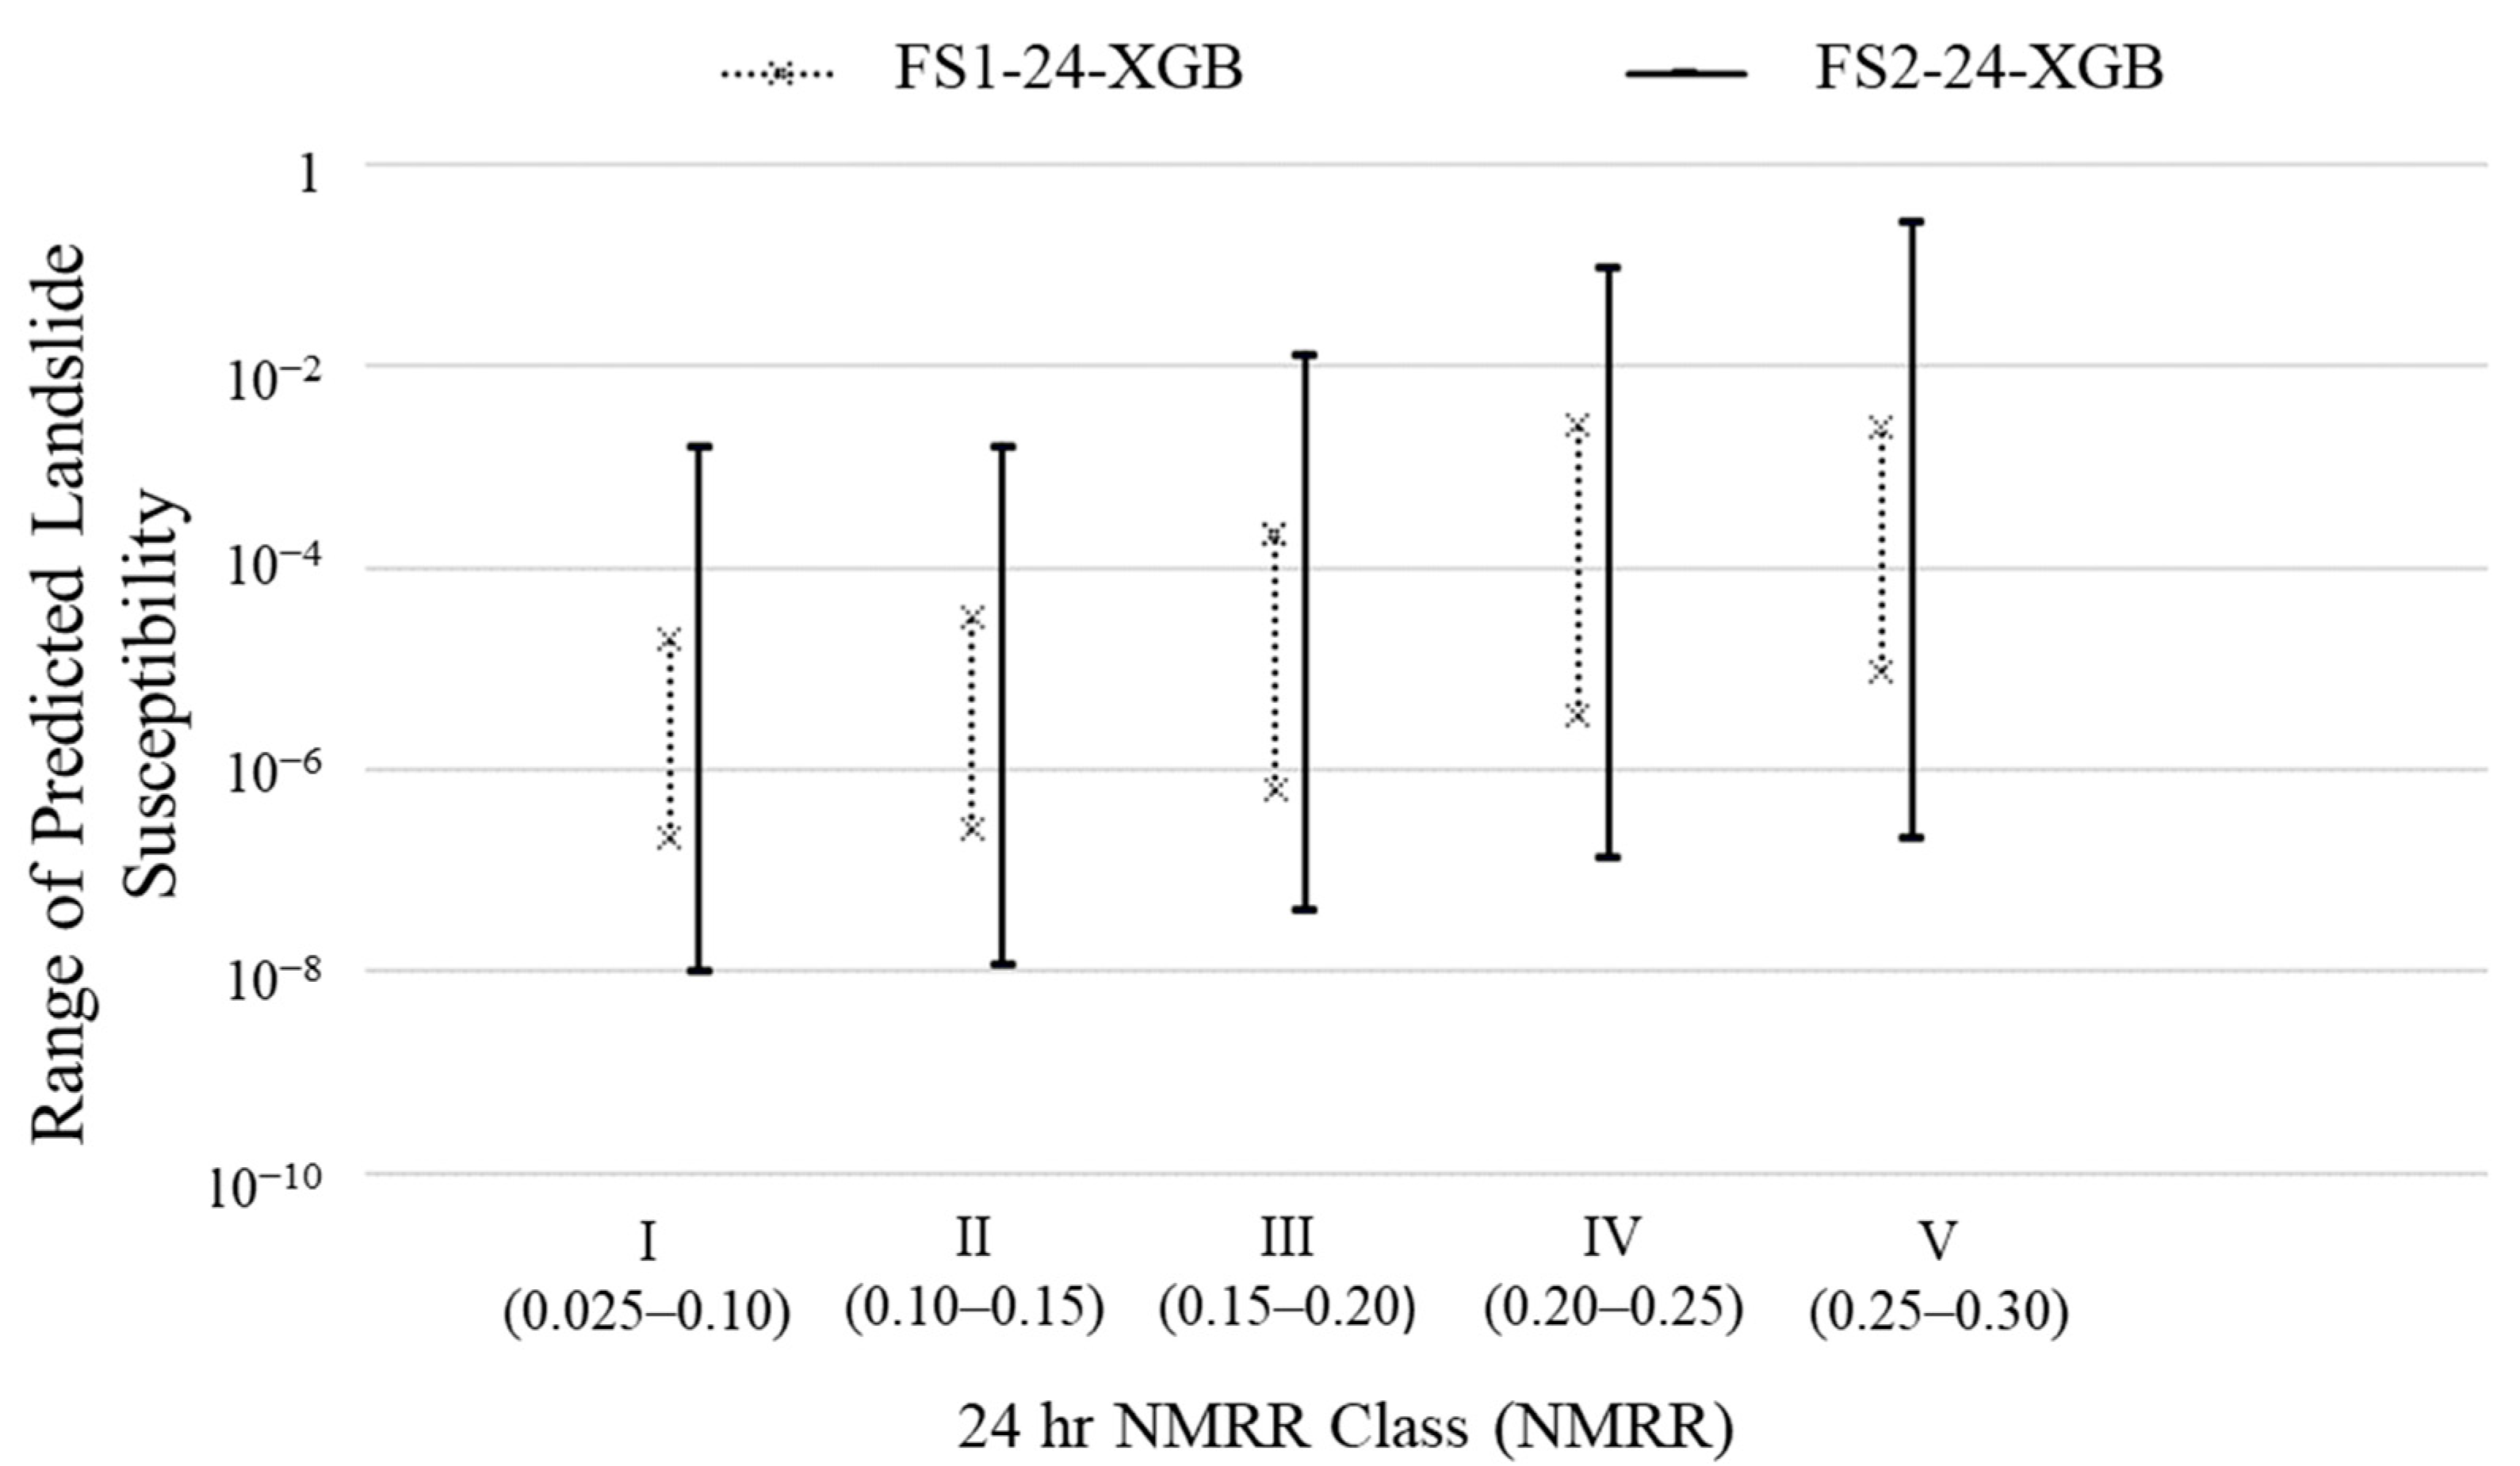
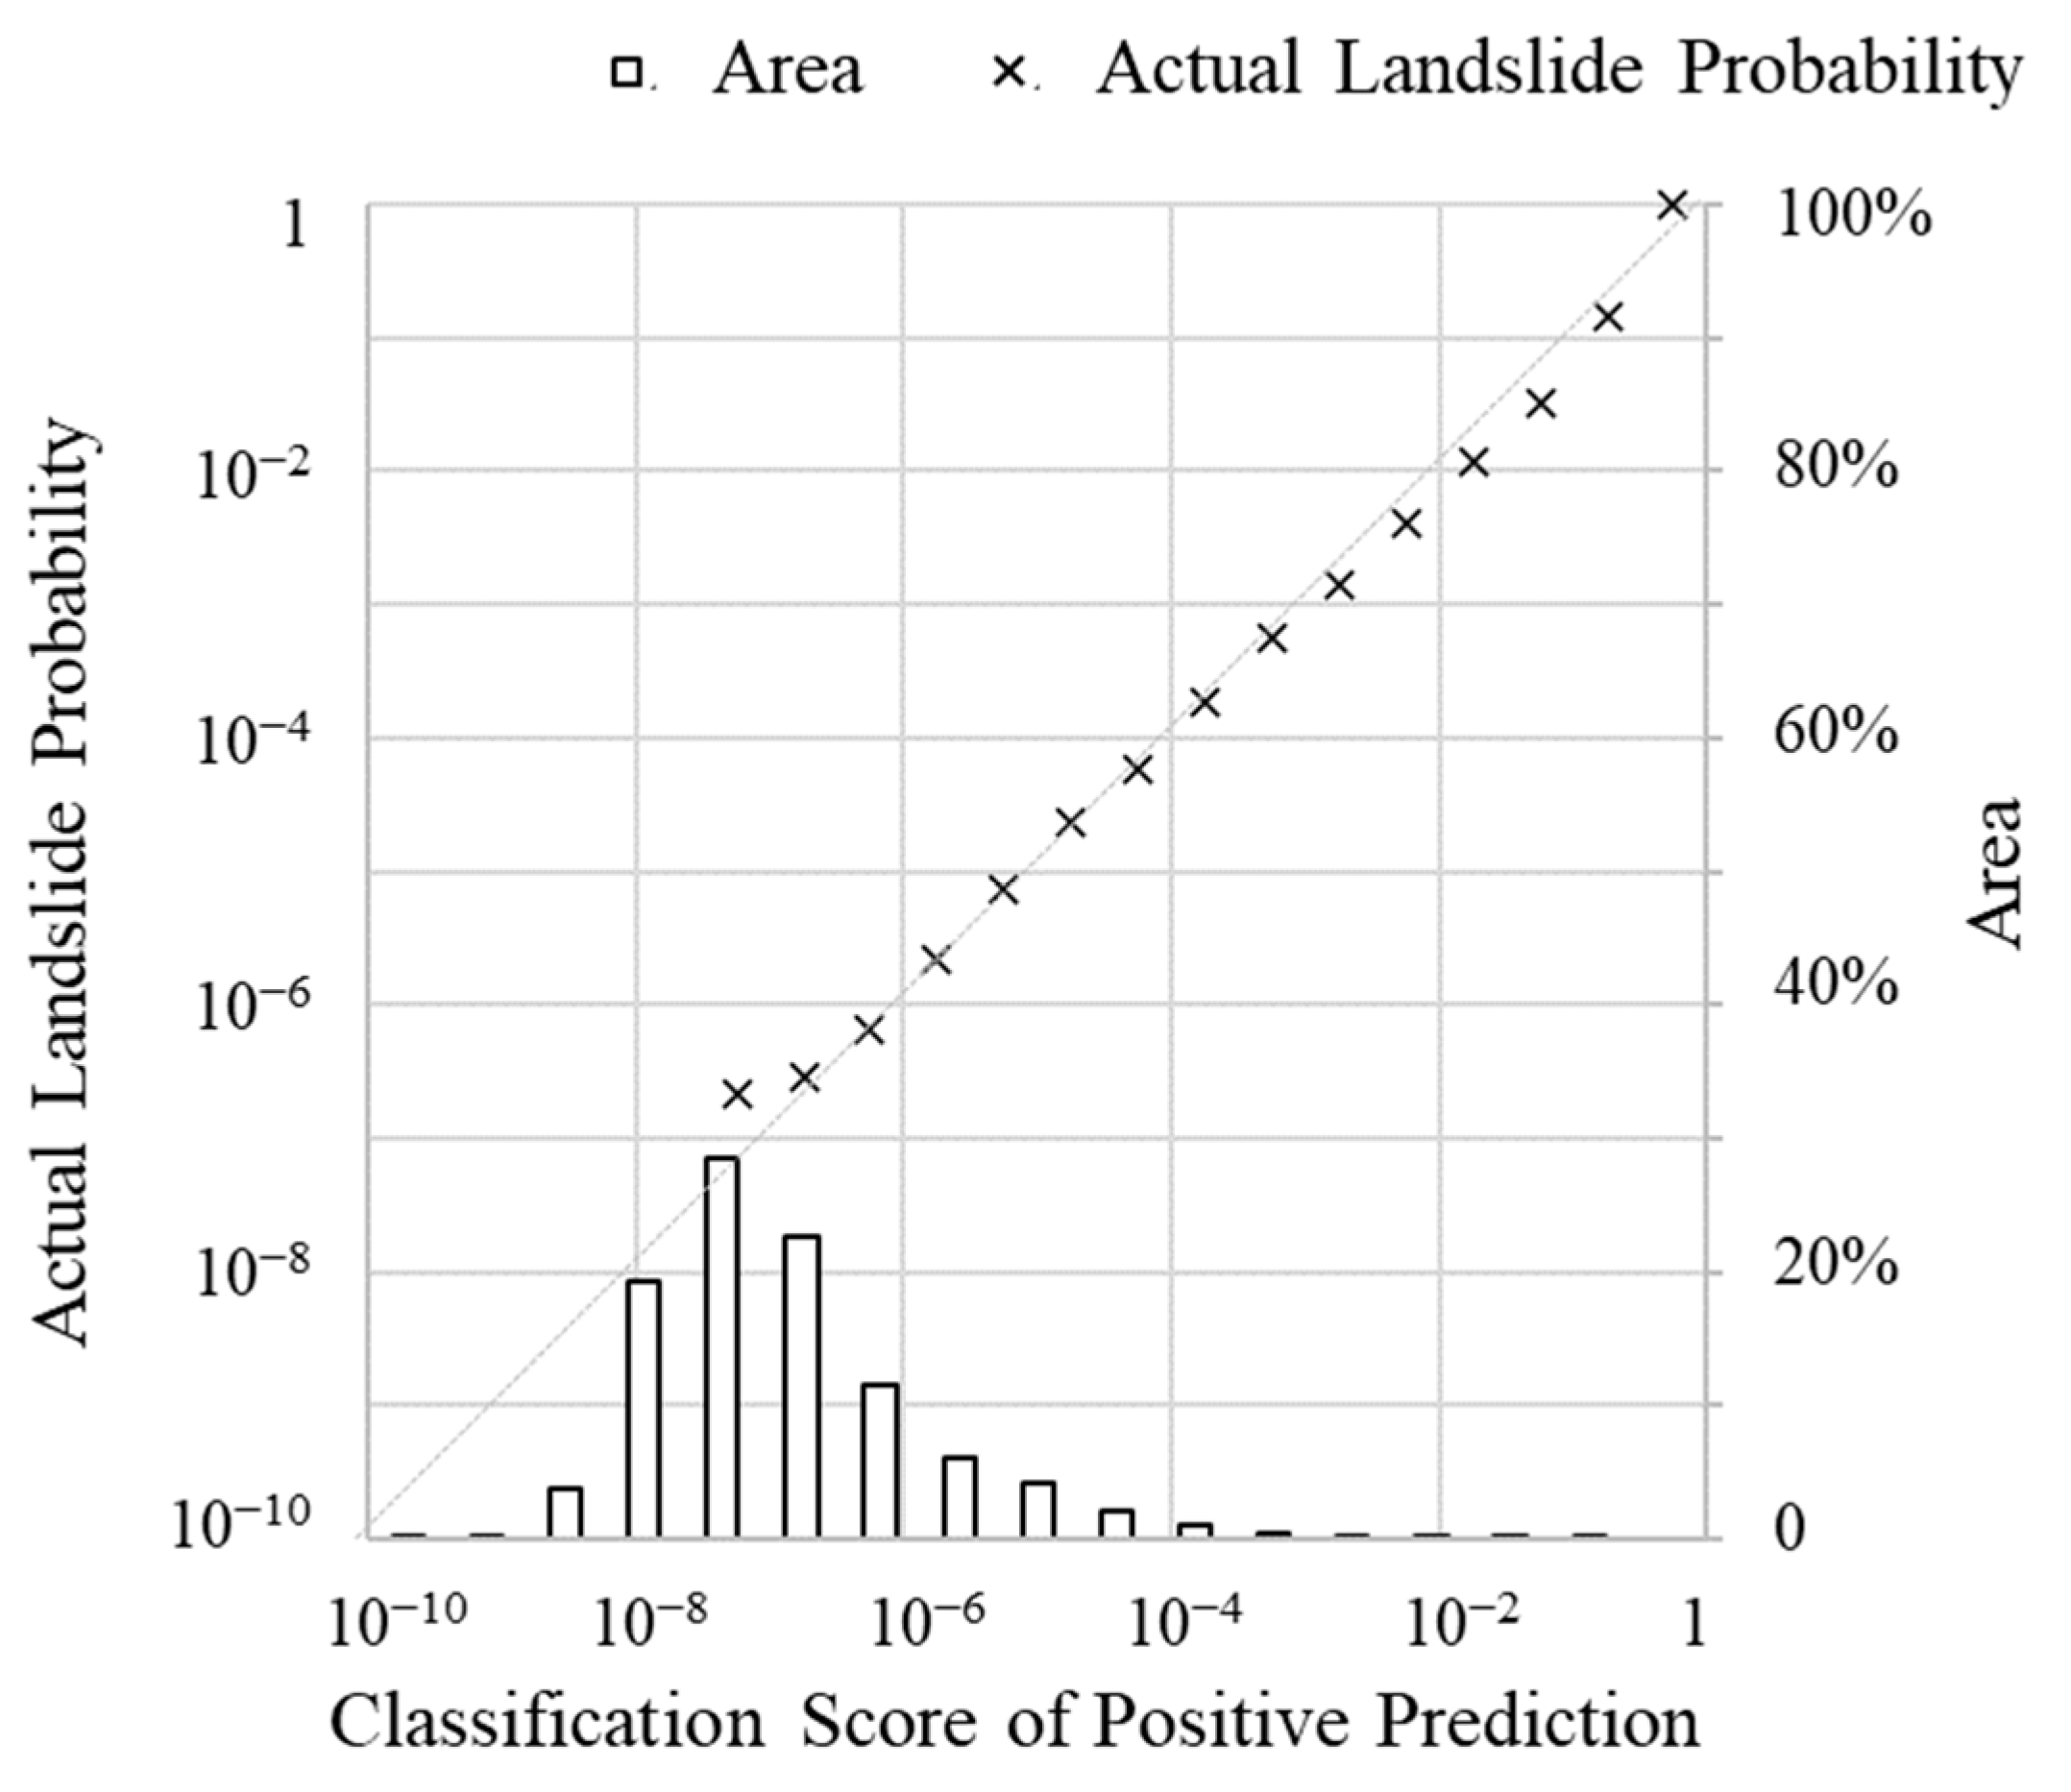
  • (b) Susceptibility Map
Spatial Resolution
Figure 10 shows the landslide susceptibility maps near the Tai O area as predicted by ML models FS1-24-XGB and FS2-24-XGB under a hypothetical constant rainfall scenario with a 24-h NMRR of 0.225, corresponding to the average 24-hr NMRR Class IV in Ko & Lo (2016) [2]. The locations of the recent landslides, including those that happened in the years from 1985 to 2008 considered in the model construction, are included to indicate areas with higher landslide susceptibility. The positive classification scores are directly adopted as the predicted landslide susceptibility. It is observed that most of the recent landslides fall within areas with a higher landslide susceptibility for both models. On the other hand, the FS2-24hr-XGB model can distinguish landslide susceptibility with a much higher resolution as compared with FS1-24hr-XGB.
While Figure 10 allows for a snapshot appreciation of the landslide susceptibility forecast ability of the two ML models adopting different feature sets visually, Figure 11 provides a more comprehensive picture of the degree of spatial resolution improvement by comparing the range of predicted landslide susceptibility values of the entire pilot study area under different rainfall intensities. The rainfall intensities correspond to the mean normalized 24-h maximum rolling rainfall intensities of 24-h NMRR Classes I to V considered in Ko & Lo (2016) [2]. It is revealed that the introduction of the three additional features (i.e., plan curvature, profile curvature, and upslope catchment area) improves the overall resolution of the landslide susceptibility map by approximately three orders of magnitude.
No. of Actual Landslides by Susceptibility of Area
Tehrani et al. (2021) [14] suggested looking at the accuracy of an ML model by validating the areal extent of each susceptibility class against the landslide density distribution form the landslide inventory. A model is accurate when the landslide density ratio increases moving from low susceptibility classes to high susceptibility classes, and when the high susceptibility classes cover only a small extent of areas. For this purpose, Figure 12 plots the actual number of landslides from years 1985 to 2008 as recorded in the ENTLI, and the distribution of area of the study area in each year, by the positive classification score (i.e., predicted landslide susceptibility) given in FS2-24-XGB. About 85% (3695 out of 4377 nos.) of the historical landslides that occurred between 1985 and 2008 fall within 4% of the area with the highest landslide susceptibility (i.e., positive classification score ≥ 10−4), demonstrating that the ML model is making fairly accurate landslide susceptibility predictions.
Under the adopted modelling approach, the positive classification score is directly taken as the predicted landslide probability for the determination of landslide susceptibility. The validity of this assumption is assessed. Figure 13 plots the actual landslide probability of the pilot study area for years from 1985 to 2008 by positive classification scores given by the FS2-24-hr-XGB model. The actual landslide probability is determined by dividing the number of actual landslides by the area falling within the same range of the positive classification score. A linear relationship with a gradient of unity is observed, indicating that the two quantities are quite close to each other. As such, the positive classification score of the ML model under the adopted approach provides a fairly realistic indication of—and can been taken as a proxy to—the predicted landslide probability.

4. Conclusions

For years, the GEO has been maintaining a comprehensive data inventory which supports the state-of-the-art research and technical development work on landslides. Again, these inventories have provided a very good starting point for the GEO’s exploratory studies on the application of machine learning to rainfall-based landslide predictions in Hong Kong.
The exploratory study presented in this paper formed a machine learning-based landslide susceptibility model for a pilot study area based on the GEO’s latest territory-wide natural terrain landslide susceptibility analysis reported in Ko & Lo (2016) [2]. The results of the above pilot study suggested that the predictive performance of ML-based landslide models is promising. In particular, the adoption of ML techniques allows for a systematic method to include additional features for landslide susceptibility analyses. A feature selection framework and a workflow for the machine learning application—which allowed for the incorporation of domain knowledge on landslides for the construction of physically meaningful machine learning models—were developed.
With the emergence of more advanced and complex algorithms with time, the use of ML techniques on landslide susceptibility studies is becoming more popular. While they are powerful, the algorithms learn the association between landslide occurrences and the set of conditioning factors in various manners without considering the physical mechanism behind the slope failures. In other words, the use of ML does not guarantee better susceptibility models that are physically meaningful unless it is applied with the input of sound professional knowledge. In this pilot study, domain knowledge was carefully introduced to ML-based models through critical feature engineering works, a proper selection of suitable algorithms, and a detailed assessment of the model performances. It is evident that the ML models gave fairly accurate landslide susceptibility predictions which could be directly taken as a proxy to landslide probability for practical applications without calibration. In addition, the resolution of the susceptibility map could be enhanced by approximately three orders of magnitude with the introduction of three additional features identified by critically assessing against our feature selection framework.
As a pilot study, the analyses carried out focused on the group of the most promising features and algorithms, based on rainfall and landslide data only up to 2008. We believe the models can be further enhanced in various aspects, which includes the consideration of other ML algorithms and the introduction of additional features that fulfill our feature selection criteria. These features will be introduced in a step-wise manner, with a view to maximizing the amount of information gain while maintaining the feature space of the dataset in a reasonable dimension. The dataset will be expanded to cover data of more recent years (especially for those data associated with intense rainfall comparable to 1993 and 2008) for testing the ML models as the current study considered data only up to 2008. The ML models will also be retrained if necessary. Alternative characterizations of the rainfall intensity and NMRR of different durations may be considered. The scale effect and the effect of post-landslide topography may also be explored.

Author Contributions

Conceptualization, T.K.C.W. and R.W.M.C.; Data curation, H.W.M.L.; Formal analysis, H.W.M.L.; Investigation, H.W.M.L. and F.L.C.L.; Methodology, F.L.C.L., T.K.C.W. and R.W.M.C.; Project administration, H.W.M.L., F.L.C.L. and T.K.C.W.; Resources, T.K.C.W. and R.W.M.C.; Software, H.W.M.L.; Supervision, F.L.C.L., T.K.C.W. and R.W.M.C.; Validation, F.L.C.L.; Visualization, H.W.M.L.; Writing—original draft, H.W.M.L.; Writing—review & editing, F.L.C.L., T.K.C.W. and R.W.M.C. All authors have read and agreed to the published version of the manuscript.

Funding

This research received no external funding.

Acknowledgments

This paper is published with the permission of the Head of the Geotechnical Engineering Office and the Director of Civil Engineering and Development, the Government of the Hong Kong Special Administrative Region, China.

Conflicts of Interest

The authors declare no conflict of interest.

References

  1. Cheung, R.W.M. Landslide risk management in Hong Kong. Landslides 2021, 18, 3457–3473. [Google Scholar] [CrossRef]
  2. Ko, F.W.Y.; Lo, F.L.C. Rainfall-based landslide susceptibility analysis for natural terrain in Hong Kong-A direct stock-taking approach. Eng. Geol. 2016, 215, 95–107. [Google Scholar] [CrossRef]
  3. Kong, V.W.W.; Kwan, J.S.H.; Pun, W.K. Hong Kong’s landslip warning system—40 years of progress. Landslides 2020, 17, 1453–1463. [Google Scholar] [CrossRef]
  4. Li, H.W.M.; Li, R.H.L.; Wong, C.C.J.; Lo, F.L.C. ML-Powered Natural Terrain Landslide Susceptibility Analysis–A Pilot Study. 2022; not yet published. [Google Scholar]
  5. Wong, H.N. Digital technology in geotechnical engineering. In Proceedings of the Hong Kong Institution of Engineers Geotechnical Division Annual Seminar 2007, Hong Kong, China, 15 May 2017; pp. 157–168. [Google Scholar]
  6. Ng, K.C.; Chiu, K.M. Airborne LiDAR survey in Hong Kong-Application to natural terrain hazard study. In Proceedings of the 28th Annual Seminar 2008, Hong Kong, China, 27–29 March 2008; Geotechnical Division, The Hong Kong Institution of Engineer: Hong Kong, China; pp. 219–224. [Google Scholar]
  7. Hong Kong Geological Survey. Available online: https://www.cedd.gov.hk/eng/publications/geo/hong-kong-geological-survey/index.html (accessed on 10 April 2022).
  8. Wong, H.N.; Shum, W.W.L.; Ko, F.W.Y. Assessment of Natural Terrain Landslide Risk on the Planned Development in Ling Pei, Lantau; Geotechnical Engineering Office: Hong Kong, China, 2004. [Google Scholar]
  9. Evans, N.C.; King, J.P. The Natural Terrain Landslide Study-Debris Avalanche Susceptibility (TN 1/98); Geotechnical Engineering Office: Hong Kong, China, 1998. [Google Scholar]
  10. Dai, F.C.; Lee, C.F. Terrain-based mapping of landslide susceptibility using a geographical information system: A case study. Can. Geotech. J. 2001, 38, 911–923. [Google Scholar] [CrossRef]
  11. Ng, C.W.W.; Yang, B.; Liu, Z.Q.; Kwan, J.S.H.; Chen, L. Spatiotemporal modelling of rainfall-induced landslides using machine learning. Landslides 2021, 18, 2499–2514. [Google Scholar] [CrossRef]
  12. Reichenbach, P.; Rossi, M.; Malamud, B.D.; Mihri, M.; Guzzetti, F. A review of statistically-based landslide susceptibility models. Earth-Sci. Rev. 2018, 180, 60–91. [Google Scholar] [CrossRef]
  13. Wang, H.; Zhang, L.; Lau, H.; He, J.; Cheung, R.W.M. AI-powered landslide susceptibility assessment in Hong Kong. Eng. Geol. 2021, 288, 106103. [Google Scholar] [CrossRef]
  14. Tehrani, F.S.; Calvello, M.; Liu, Z.Q.; Zhang, L.; Lacasse, S. Machine learning and landslide studies: Recent advances and applications. 2021; not yet published. [Google Scholar]
  15. Ma, Z.; Mei, G.; Piccialli, F. Machine Learning for Landslides Prevention: A Survey. Neural Comput. Appl. 2021, 33, 10881–10907. [Google Scholar] [CrossRef]
  16. Liu, Z.Q.; Gilbert, G.; Cepeda, J.M.; Lysdahl, A.O.K.; Piciullo, L.; Hefre, H.; Lacasse, S. Modelling of shallow landslides with machine learning algorithms. Geosci. Front. 2021, 12, 385–393. [Google Scholar] [CrossRef]
  17. Wang, H.; Zhang, L.; Yin, K.; Luo, H.; Li, J. Landslide identification using machine learning. Geosci. Front. 2020, 12, 351–364. [Google Scholar] [CrossRef]
  18. Xiao, T.; Zhang, L. Storm-based forecasting of man-made slope failures using machine learning. In Proceedings of the 20th International Conference on Soil Mechanics and Geotechnical Engineering, Sydney, Australia, 1–5 May 2022. [Google Scholar]
  19. Merghadi, A.; Yunus, A.P.; Dou, J.; Whiteley, J.; Pham, B.T.; Bui, D.T.; Avtar, R.; Abderrahmane, B. Machine learning methods for landslide susceptibility studies: A comparative overview of algorithm performance. Earth-Sci. Rev. 2020, 207, 103225. [Google Scholar] [CrossRef]
  20. Breiman, L.; Friedman, J.H.; Olshen, R.A.; Stone, C.J. Classification and Regression Tree, 1st ed.; Wadsworth: New York, NY, USA, 1984. [Google Scholar]
  21. Breiman, L. Random Forest. Mach. Learn. 2001, 45, 4–32. [Google Scholar]
  22. Chen, T.; Guestrin, C. XGBoost: A Scalable Tree Boosting System. In Proceedings of the 22nd ACM SIGKDD International Conference on Knowledge Discovery and Data Mining, San Francisco, CA, USA, 13–17 August 2016. [Google Scholar]
  23. Ho, H.Y.; Roberts, K.J. Guidelines for Natural Terrain Hazard Studies (GEO Report No. 138), 2nd ed.; Geotechnical Engineering Office, Civil Engineering and Development Department: Hong Kong, China, 2016. [Google Scholar]
  24. Ko, F.W.Y. Correlation between Rainfall and Natural Terrain Landside Occurrence in Hong Kong (GEO Report No. 168); Geotechnical Engineering Office: Hong Kong, China, 2005. [Google Scholar]
  25. Marc, O.; Gosset, M.; Saito, H.; Uchida, T.; Malet, J.-P. Spatial patterns of storm-induced landslides and their relation to rainfall anomaly maps. Geophys. Res. Lett. 2019, 46, 11167–11177. [Google Scholar] [CrossRef]
Figure 1. Data inventories considered in the exploratory study.
Applsci 12 06017 g001
Figure 2. Hong Kong’s Landslide-related data inventories adopted in the current study: (a) Spatial distribution of natural terrain landslides in ENTLI up to 2019; (b) Location plan of rain gauges for the operation of the Landslip Warning System; (c) Digital elevation model (DEM) based on LiDAR survey results in 2010; (d) Extract of the 1:20,000-scale geological map.
Applsci 12 06017 g002
Figure 3. Workflow of the Machine Learning-based Landslide Susceptibility Pilot Study.
Applsci 12 06017 g003
Figure 4. Extent of the Study Area.
Applsci 12 06017 g004
Figure 5. Feature Selection Priority Matrix.
Applsci 12 06017 g005
Figure 6. Statistical Correlation of Landslide Conditioning Factors with Landslide Density: (a) Slope gradient; (b) Plan curvature; (c) Profile curvature; (d) Upslope catchment area; (e) Normalized Difference Vegetation Index (NDVI); (f) Superficial geology (the effect of slope angle to the landslide occurrence is normalized); (g) Aspect.
Applsci 12 06017 g006
Figure 7. Available Dataset in a Grid.
Applsci 12 06017 g007
Figure 8. Resampling of Data in the Pilot Study.
Applsci 12 06017 g008
Figure 9. Definition of ROC AUC and Confusion Matrix.
Applsci 12 06017 g009
Figure 10. Predicted Landslide Susceptibility of the Tai O Area: (a) Model FS1-24-XGB under 24-h-NMRR of 0.225; (b) Model FS2-24-XGB under 24-h-NMRR of 0.225. Legend covers the range of landside susceptibility predicted for the entire pilot study area.
Applsci 12 06017 g010
Figure 11. Ranges of Predicted Landslide Susceptibility.
Applsci 12 06017 g011
Figure 12. Distribution of Past Landslide Occurrences and Area by Positive Classification Score.
Applsci 12 06017 g012
Figure 13. Actual Landslide Probability by Positive Classification Scores (FS2-24-XGB).
Applsci 12 06017 g013
Table 1. Summary of Landslide Susceptibility Studies in Hong Kong.
Evans & King (1998) [9]Dai & Lee (2002) [10]Ko & Lo (2016) [2]Ng et al. (2021) [11]Wang et al. (2021a) [13]The Current Pilot Study
Modelling Approach
  • Conventional Statistical Approach
  • Territory-wide
  • Year-based
  • Terrain unit-based
 (247 terrain units)
  • Machine learning-based
  • Regional
  • Year-based
  • Grid-based
 (20 m × 20 m)
  • Conventional Statistical Approach
  • Territory-wide
  • Year-based
  • Grid-based
 (5 m × 5 m)
  • Machine learning-based
  • Territory-wide
  • Storm-based
  • Grid-based
 (5 m × 5 m)
  • Machine learning-based
  • Territory-wide
  • Year-based
  • Object-based
  • (30 m × 30 m object formed by 2 m × 2 m grids)
  • Machine learning-based
  • Regional
  • Year-based
  • Grid-based
 (5 m × 5 m)
Resampling RatioNot Applicable1:1Not Applicable1:11:2Not Applicable
Features
  • Slope Gradient (in 13 classes)
  • Lithology (in 19 groups)
  • Elevation
  • Slope Gradient
  • Slope Aspect
  • Slope Shape
  • Lithology
  • Land Use
  • Proximity to Drainage Line
  • Slope Gradient (in eight classes)
  • Lithology (in three groups)
  • 24-h Normalized Maximum Rolling Rainfall (in six classes)
  • Combined 4-h and 24-h Normalized Maximum Rolling Rainfall (in seven classes)
  • Elevation
  • Slope Gradient
  • Aspect
  • Plan Curvature
  • Profile Curvature
  • Geology
  • Normalized Difference Vegetation Index (NDVI)
  • Maximum Rolling 1-, 4-, 8-, 12- and 24- rainfall of specific storm
  • Cumulative 1-, 3-, 7- and 14-day antecedent rainfall amounts before specific storm.
  • Elevation
  • Slope Gradient
  • Aspect
  • Planform Curvature
  • Profile Curvature
  • Topographic Wetness Index (TWI)
  • Length-slope Factor
  • Superficial Geology
  • Normalized Difference Vegetation Index (NDVI)
  • Distance to Fault
  • Distance to River/Sea
  • 4 h maximum rolling rainfall
  • 24 h maximum rolling rainfall
  • Slope Gradient
  • Lithology
  • Plan Curvature
  • Profile Curvature
  • Upslope Catchment Area
  • 4-h Normalized Maximum Rolling Rainfall
  • 24-h Normalized Maximum Rolling Rainfall
Machine Learning AlgorithmNot ApplicableLogistic RegressionNot Applicable
  • Logistic Regression
  • Random Forest
  • Adaboost Tree
  • Support Vector Machine
  • Multilayer Perceptron
  • Logistic Regression
  • Random Forest
  • LogitBoost
  • Convolutional Neural Network (CNN)
  • Bidirectional long short-term memory architecture of Recurrent Neural Network (BiLSTM-RNN)
  • CNN-LSTM
  • Decision Tree
  • Random Forest
  • XGBoost
Susceptibility Resolution Achieved
  • By landslide frequency (i.e., no. of landslide/km2/year)
  • In five susceptibility classes
  • One order of magnitude
  • In four susceptibility classes
  • By landslide density (i.e., no. of landslide/km2)
  • Four to five orders of magnitude
  • In five susceptibility classes
  • In five susceptibility classes
  • By predicted probability of landslide
  • Seven to eight orders of magnitude
Table 2. Brief description on the selected machine learning algorithms.
ML
Algorithms
Brief Descriptions
Decision TreeIt is known as one of the most commonly used algorithms in studies of a similar nature. It works by recursive partitioning of data (i.e., splitting of tree) based on splitting criteria that yields the maximum information gain as assessed based on Gini impurity value. Despite this, it is a less robust algorithm and sensitive to the predictive data. It has been adopted for its computational efficiency and high interpretability to facilitate an understanding of the other two tree-based algorithms.
Random forestIt is a tree-based ensemble learning algorithm, of which performance is greatly enhanced in terms of robustness and generalizability compared with Decision Tree. Random Forest adopts the bagging method which lowers variance and avoids overfitting of the models by injecting randomness into the model though feature selection. The collection of independent tree-structured predictors formed from different subsets of randomly selected features are combined giving the majority vote cast as the final prediction for classification problems.
XGBoostIt is also a tree-based ensemble learning algorithm. XGBoost adopts a scalable gradient tree boosting (GTB) system in which outputs from many weak tree-based learners are ensembled in a stage-wise manner. A weak learner learns from the errors of the previous learner and improves the model at each stage under this method. While Gradient Boosting has recently become popular, it is less routinely used in landslide susceptibility studies, but it improves the accuracies of ML models according to Merghadi et al. (2020). In fact, the performance of XGBoost is widely recognized in several ML and data mining challenges.
Table 3. Summary of potential features considered.
FeatureSelected FeatureFS1FS2
Rainfall
Lithology
Slope gradient
Plan curvature-
Profile curvature-
Aspect--
Upslope catchment area-
Normalized vegetation density index (NDVI)--
Superficial geology--
Table 4. Selected Features for the Pilot Study.
FeatureDescriptionCriterion (i)Criterion (ii)Criterion (iii)
Rainfall
  • Quantified in terms of year-based NMRR 1
  • 24-h and 4-& 24-h NMRR
  • Data from dense network of automatic rain gauges
  • Good spatial and temporal resolution data
  • Strong statistical correlation up to five orders of magnitude observed in Ko & Lo (2016) [2]
  • Natural terrain landslides in Hong Kong were rainfall-induced.
  • Landslide occurrence is highly sensitive to rainfall according to Ko & Lo (2016) [2]
Slope
Gradient
  • Slope inclination
  • Processed data with ArcGIS applications based on territory-wide multi-return airborne LiDAR survey results in 2010
  • Good spatial resolution data
  • Landslide density increased by about five times from 30° to 45° and is lower beyond 45°.
  • Strong statistical correlation is observed.
  • Affects the balance of stabilizing and destabilizing forces, and thus the overall stability of a slope.
  • Areas steeper than 45° are more rocky or composed of denser soil, having a higher stabilizing force.
Plan
Curvature
  • The rate of change of slope gradient along the horizontal directions
  • (concave profile = negative; convex profile = positive)
  • Processed data with ArcGIS applications based on territory-wide multi-return airborne LiDAR survey results in 2010
  • Good spatial resolution data
  • Areas with negative plan curvature are up to six times more susceptible to landslide than those with positive plan curvature
  • Strong statistical correlation is observed.
  • Influences the convergence and divergence of surface runoff and subsurface groundwater flow [12]
  • Concave slope is more susceptible to landslides.
Profile Curvature
  • The rate of change of slope gradient along the vertical directions
  • (concave profile = positive; convex profile = negative)
  • Processed data with ArcGIS applications based on territory-wide multi-return airborne LiDAR survey results in 2010
  • Good spatial resolution data
  • Areas with greater magnitude of profile curvature (both positive and negative) are up to four times more susceptible to landslide.
  • Strong statistical correlation is observed.
  • Considered as a proxy to the break in slope that is assumed to be landslide related [23]
  • Areas with large magnitude profile curvatures (both positive and negative) are more susceptible
Upslope Catchment Area
  • Indicates the amount of flow that would accumulate in the location
  • Processed data with ArcGIS applications based on territory-wide multi-return airborne LiDAR survey results in 2010
  • Good spatial resolution data
  • The landslide density of the areas with upslope catchment area of 10–1000 m2 is about 2 to 3-fold higher than the other areas.
  • Strong to moderate statistical correlation is observed.
  • Areas with larger upslope catchment are more adversely affected by erosion
  • Areas with very large upslope catchment area could indicate the downstream of a drainage line or riverbed, which is relatively flat and less susceptible.
Lithology
  • Bedrock geology categorized into three main groups:
    1.
    intrusive
    2.
    volcanic
    3.
    sedimentary
  • Same categorization as adopted in Ko & Lo (2016) [2]
  • 1:20,000 solid and superficial geology maps of Hong Kong [7].
  • Data of wide spatial coverage with sufficient level of details
  • Volcanic rock is three times more susceptibility to landslide than intrusive or sedimentary rocks according to Ko & Lo (2016) [2].
  • Strong to moderate statistical correlation is observed.
  • Related to the engineering properties of the soils derived from the parent rocks and is thus considered to be physically relevant to the landslide potential.
1 NMRR refers normalised maximum rolling rainfall, which is determined by normalizing the maximum rolling rainfall as recorded at a location with the mean annual rainfall of the same location of a 30-year period from year 1977 to 2006. The normalisation of rainfall intensity is a commonly adopted approach to better characterise extremity or anomalies of the rainfall [3,24,25].
Table 5. Features not included in the Pilot Study after assessment.
FeatureDescriptionCriterion (i)Criterion (ii)Criterion (iii)
Normalized
Difference Vegetation Index (NDVI)
  • Indicates the conditions of the vegetation cover of an area based on the amount of red and infrared light reflected
  • Ranges from −1 to 1,
  • −1 = vegetation not present
  • 1 = dense levels of healthy vegetation.
  • NDVI determined based on photos taken by satellite WorldView-3 in 2019
  • Categorization of land usage based on Land Use Map published by the Planning Department of Hong Kong in 2019
  • Satellite photos were taken at a time of the year, insufficient temporal resolution as factors such as seasonal vegetation growth and effects of hill fire cannot be reflected
  • Moderate correlation to the landslide susceptibility is observed
  • There is a lack of a clear (and unique) relationship linking vegetation cover to slope stability conditions [12].
Superficial Geology
  • Superficial material categorized into colluvium and non-colluvium materials
  • Based on 1:20,000 superficial and solid geology map [7], assuming the superficial deposits are derived from local bedrock.
  • Colluvium of thickness less than 2 m cannot be identified
  • Insufficient accuracy, as most of the natural terrain landslides in Hong Kong involve shallow mantle only
  • Areas overlain by colluvium have a lower landslide susceptibility (about 60%) than the average susceptibility of all superficial materials.
  • Statistical correlation is contrary to the domain knowledge, as natural terrain landslides in Hong Kong very often involve colluvial materials.
Aspect
  • Compass direction of the slope with maximum gradient
  • Processed data with ArcGIS applications based on territory-wide multi-return airborne LiDAR survey results in 2010
  • Good spatial resolution data
  • Areas with south or southeast aspects are two times more susceptible than the north.
  • The statistical correlation cannot be justified based on domain knowledge
Table 6. Summary of Analysis Cases Considered in the Pilot Study.
Feature SetRainfallMachine Learning Algorithm
Decision TreeRandom ForestXGBoost
FS124 h-NMRRFS1-24-DTFS1-24-RFFS1-24-XGB
4 h-NMRRFS1-4-DTFS1-4-RFFS1-4-XGB
4 h- & 24 h-NMRRFS1-4&24-DTFS1-4&24-RFFS1-4&24-XGB
FS224 h-NMRRFS2-24-DTFS2-24-RFFS2-24-XGB
4 h-NMRRFS2-4-DTFS2-4-RFFS2-4-XGB
4 h- & 24 h-NMRRFS2-4&24-DTFS2-4&24-RFFS2-4&24-XGB
Table 7. ROC AUC of the Predictive Models.
Evaluation DataFeature Set & NMRR DurationDecision TreeRandom ForestXGBoost
Training DataFS1-240.95710.98810.9660
FS1-40.94260.99050.9559
FS1-4&240.96010.99650.9748
FS2-240.96740.99650.9808
FS2-40.94800.99310.9720
FS2-4&240.95990.99990.9769
Testing Data 1
(TD1)
FS1-240.87700.88360.8867
FS1-40.87090.87400.8873
FS1-4&240.87170.87420.8602
FS2-240.87640.90830.9149
FS2-40.87440.89700.9130
FS2-4&240.87950.90420.9132
Testing Data 2
(TD2)
FS1-240.94990.95930.9627
FS1-40.94440.96540.9695
FS1-4&240.94810.95630.9602
FS2-240.94430.96700.9732
FS2-40.94370.96030.9685
FS2-4&240.95180.97290.9734
Publisher’s Note: MDPI stays neutral with regard to jurisdictional claims in published maps and institutional affiliations.

