Article

A Better Integration of Industrial Robots in Romanian Enterprises and the Labour Market

by
Ivona Stoica (Răpan)
1,*,
Gheorghe Zaman
1,
Marta-Christina Suciu
2,
Victor-Lorin Purcărea
3,
Cornelia-Rodica Jude
1,4,
Andra-Victoria Radu
3,
Aida Catană
2 and
Anamaria-Cătălina Radu
1
1
Institute of National Economy, Romanian Academy, 050711 Bucharest, Romania
2
Faculty of Theoretical and Applied Economy, Bucharest University of Economic Studies, 010961 Bucharest, Romania
3
Faculty of Medicine, University of Medicine and Pharmacy “Carol Davila” Bucharest, 050474 Bucharest, Romania
4
Academy of Romanian Scientists, Splaiul Independenței 54, 050044 Bucharest, Romania
*
Author to whom correspondence should be addressed.
Appl. Sci. 2022, 12(12), 6014; https://doi.org/10.3390/app12126014
Submission received: 29 April 2022 / Revised: 2 June 2022 / Accepted: 7 June 2022 / Published: 13 June 2022
(This article belongs to the Section Robotics and Automation)

Abstract

:
The purpose of this paper is to illustrate the opportunities for adopting robotic applications, through a marketing mix perspective, as well as depicting the current state of industrial robot integration in Romanian enterprises and the labor market, in contrast to other economies of the European Union. In this research, we highlight the impact of industrial robots within enterprises, while also considering the perceived standard of living through GDP per capita. For this, we conducted exploratory research based on secondary data regarding the evolution of the robotics sector in Romania, in connection to the dynamics of the global and European Union robotics market. We also performed a principal components analysis, which revealed the main factors that contributed to the dynamics of nation-level enterprise statistics. Our analysis revealed that a higher integration of industrial robots contributed to the reduction of employment rates amongst all six EU countries considered, while also having positive correlations with the GDP per capita and apparent labor productivity. Mixed results were only observed for the impact of industrial robots on remuneration growth, suggesting the potential adverse effects automation could have on incomes.

1. Introduction

Nowadays, it is generally accepted that modern technologies (automation, IT&C, artificial intelligence (AI), virtual reality, digital technologies) are key determinants for long-term sustainable, smart, and inclusive socio-economic development. In particular, IT&C, AI, and digital technologies have significant effects on total factors and/or labor productivity. Our paper focuses on the impact of robotics on labor productivity, and also considering the expected undesirable consequences with respect to employment rates and standards of living. The main goal of the paper is to illustrate the current state of industrial robot implementation in Romanian enterprises and the labor market in contrast with other European economies. The paper provides additional insights into the evolution of Romanian labor demand, as manifested with respect to automation and digitalization processes. We consider that, in the context of embracing recently developed technologies, Romania has a high potential to develop, from both an economic and social point of view, into a competitive country and transition towards a “knowledge and innovation-based” economy, which would translate to better job opportunities and standards of living for its residents. Our research is built on relevant data retrieved from different databases such as: the International Federation of Robotics, Eurostat, and Data World Bank’s development indicators. Our paper highlights the impact of industrial robots within enterprises, mostly in terms of the perceived standard of living through GDP per capita. It illustrates the variance of structural business results and the main components that encourage Romanian enterprises towards a better integration of industrial robots. In the first part, we conducted exploratory research based on secondary data regarding the evolution of the robotics sector in Romania in connection with the dynamics of the global and European Union robotics market, with respect to selected key variables, such as robotics density and enterprise use. Furthermore, we evaluated the distribution of industrial robots within enterprises from other developed countries, using the clustering method. In order to support our initial assumption that Romania’s economic landscape might benefit from a more comprehensive integration of robotics, we also performed a principal components analysis, which revealed the main factors that contributed to the recent dynamics of business statistics. Furthermore, we illustrated, based on a time-series analysis, how countries from each cluster may perform in terms of the perceived standard of living.
Over the past decades, many researchers have highlighted the main consequences the large-scale implementation of emerging technologies (such as automation, artificial intelligence, machine learning, and robotics) has on the standards of living and on economics (considering macro and microeconomics perspectives).
“The robots are no longer coming; they are here” [1] suggested the Nobel laureate in Economics, Edmund S. Phelps, at the beginning of August 2020, when he highlighted the amplified effects of the global crisis due to the COVID-19 pandemic.
More and more, SMEs worldwide must face the challenges of the so-called “new normal” [2]; including, but not being limited to concerns regarding labor productivity and the availability of highly-qualified IT&C specialists, supply chain disruptions, cash flow accessibility, and the high level of risk and uncertainty brought by the frequent and random legislative changes. Moreover, the COVID-19 pandemic illustrated the crisis of healthcare systems. These systems are overloaded, and medical staff are usually constrained both by time and capabilities; as a result, doctors became unable to offer appropriate healthcare. Despite the social distancing regulations, the cases of infected people reached significant numbers among workers. Consequently, several institutions worldwide pushed to adopt robots [3] for some treatments, food delivery, vital sign check-ups, or supply assistance. The desire to augment human labor capabilities with robots has become a necessity.
Our paper aims to provide additional insights into why Romania and other developed countries would benefit from a better understanding of the need to become early adopters of robotics, and how this would contribute to labor productivity, while also improving the opportunities of their citizens in the labor markets.
We identified within the specialized literature that there are many authors suggesting that the implementation of robots in the workspace will lead to a more resilient economic landscape, which will no longer hire and offer adequate wages to people. Other authors emphasize how robots might facilitate more agile, decentralized organizations; therefore, leading to accelerated business growth, increased labor productivity, reduced costs, and embracing more and better opportunities for individuals.
One recent study even suggested that “one more robot per thousand workers reduces the aggregate employment-to-population ratio by about 0.2 percentage points and wages by about 0.42%”, as demonstrated in the model of Acemoglu and Restrepo [4]. “Despite the competitive business environment, adopting state-of-the-art technology can help SMEs create new strategies and set the stage for long term growth and market leadership. The current technology revolution can benefit all businesses irrespective of the company size, industry, or operations activities” [5].
“Evaluating AI is a challenging task, as it requires an operative definition of intelligence and the metrics to quantify it, including amongst other factors economic drivers, depending on specific domains” [6]. “Innovation is an important factor that produces quality and improves competitiveness” [7].
“To overcome these adverse circumstances and pursue sustainable growth, both SMEs and large companies prepare long-term growth strategies to strengthen their technological innovation capability; overall, SMEs are in a relatively unfavorable condition to improve their performance and pursue continuous growth through technological innovation” [8].
“Technology innovation capability is a combination of technology innovation and capability; it is the organizational ability to carry out the process of developing, introducing, and adopting ideas and technologies for new products, services, and production processes” [9].
Another research study [10], conducted by Price Waterhouse Coopers, analyzed data concerning more than 200,000 jobs from 29 countries. This study revealed that, although the automation of jobs will have a significant impact on many professions in the next decades (more than 30% of jobs from developed countries are considered to be at high risk due to automation by 2035), in the short term, the risks of mass unemployment due to adopting automation solutions might be rather insignificant, as job automation will take place gradually; thus, allowing people to acquire the skills and competencies needed for this transformation. At the same time, the study estimated a growing demand and offer of both IT&C specializations and specialists.
Nevertheless, the PwC study highlighted that organizations and governments must overcome a significant number of technical, economic, social, governing, and legal limitations. Comprehensive restructuring of learning curricula, special employee onboarding training, and access to high-tech and digitization technologies for the majority of the active population must become a high priority and should be based on lifelong learning and better integration of less well-educated workers within the new industries, such as industries 4.0 and 5.0.
Our paper aims to portray the situation of Romania’s enterprises using robots. We, therefore, analyzed Eurostat data regarding the use of industrial robots within enterprises. Next, we compared these results with the values registered in other developed countries. Furthermore, we included a cluster analysis of the most robotized countries, based on the share of enterprises using industrial robots, and depicted their status with the help of GDP per capita based on a time-series analysis.

2. Recent Evolutions in the Robotics Market

2.1. The Intensive Use of Automation, Artificial Intelligence, and Robots

According to Schwab, ”in the 21st century, it has been broadly accepted that high-tech business is very important for the socio-economic development on long-term” [11]
The author summarizes the role of technologies in complex transformations, debating the expected effects on governments, corporations, communities, and people, as a prerequisite for a better future.
In order to better understand the impact of robots on the economic environment today, we consider it essential to outline the main trends of industrialization and to draw attention to some of the main novelties involved in this transformative process.
Around the end of the 18th century, Industry 1.0 marks the first period when manual workers faced societal unrest due to the challenges of machine-aided labor. The spread of machines used to produce goods or services, together with the invention of the steam engine, supported economic growth processes at a higher rate than before, as highlighted by Deane in 1965, [12]; thus, facilitating the need for a more specialized workforce, as the newly industrialized economy required workers to engage in more dedicated operations within the production cycle of a finished product (but not being responsible for the whole manufacturing processes).
The second major milestone (Industry 2.0) of economic development began with electrification, bringing advancements such as assembly lines (first used in the automotive industry), which soon allowed for gradual automation of tasks executed by workers within the serial production process.
Beginning in the middle of the 19th century, the third industrial revolution benefited from the invention of semiconductors, the spread of mainframe and personal computing, and the data ease of access brought by the Internet. This is also known as Industry 3.0 or the Digital Revolution; preparing society for the Internet-of-Things era.
The term Industry 4.0 was publicly introduced in 2011 at the Hannover Fair (the first use of the term “Industry 4.0” comes from Professor Wolfgang Wahlster, Director and CEO of the German Research Centre for Artificial Intelligence, at Hannover Messe, referring to companies’ challenges in achieving success in a developed region amidst global competition. The concept has since then been greatly discussed and become associated with means of automation, digitalization, and use of high technology in a coordinated and integrated manner, according to various frameworks, and in order to increase work productivity and economic growth) [13]; and encompasses a wide-ranging number of concepts, such as the industrial Internet-of-Things (IIoT), smart manufacture, smart factories, cloud and cognitive computing, automation, artificial intelligence, and robotics.
In order to better understand the challenges brought by the fourth industrial revolution and how this process might accelerate the use of robotics subsequently, we will outline the main advancements brought by automation, artificial intelligence, and a robotic-augmented workforce.

2.2. Filling the Gap between Automation and Robotics

The simplest form of automation, also known as robotic process automation (RPA), refers to repetitive rule-based events applied to a consistent set of processes that produce efficient outcomes in the shortest timeframe [14] (Madakam et al., 2019, p. 11). RPA allows robots to connect existing tools for data processing, notification control, or other analogous operations, while human intervention becomes necessary only for handling exceptions. It seems that RPA does not involve a high level of learning, adaptive, or decision-making capabilities.
On the other hand, it seems that artificial intelligence (AR) facilitates automation through machine learning, to “automatically improve through experience” [15]. AI refers to the implementation of intelligent problem-solving behaviors for developing computer systems.
While the number of enterprises that use AI varies demographically, and the type of AI software they use differs from one business to another, according to their size and sector of activity [16], the importance of AI in the economy is unquestionable. From a broader point of view, the economic applications of AI can be divided [17] into five groups: deep learning, robotics, dematerialization, gig economy, and autonomous driving.
Within this paper, we focus on the way in which industrial robotic applications are used in enterprises, and at the same time, we highlight why Romania’s economic landscape might greatly benefit from their implementation.
Robotics asks for complex interdisciplinary research studies (both at scientific and engineering levels). It covers the study, design, production, and usage of robots.
While the definitions and classification of robots may be seen from different perspectives (types of tasks executed, power source, workspace geometry, degrees of freedom, movement, or kinematic structure of the manipulator), we consider it is useful to classify them solely based on their application. Based on their areas of application the main types of robots can be classified [18] into two main categories:
Non-industrial/service robots that perform different tasks humans or equipment could also perform, excluding industrial automation applications. They are generally used for medical care, security and defense, domestic use, education, space, or entertainment.
Industrial robots: used in various business fields, characterized by the ability to perform a variety of industry-specific repetitive operations, such as painting, machining, drilling, and welding.
We ought to note that, according to Tractica Research in 2019 [19], industrial and non-industrial robotics represent important opportunities for the economy, with the worldwide robotics revenue estimated to achieve $248.5 billion by 2025.

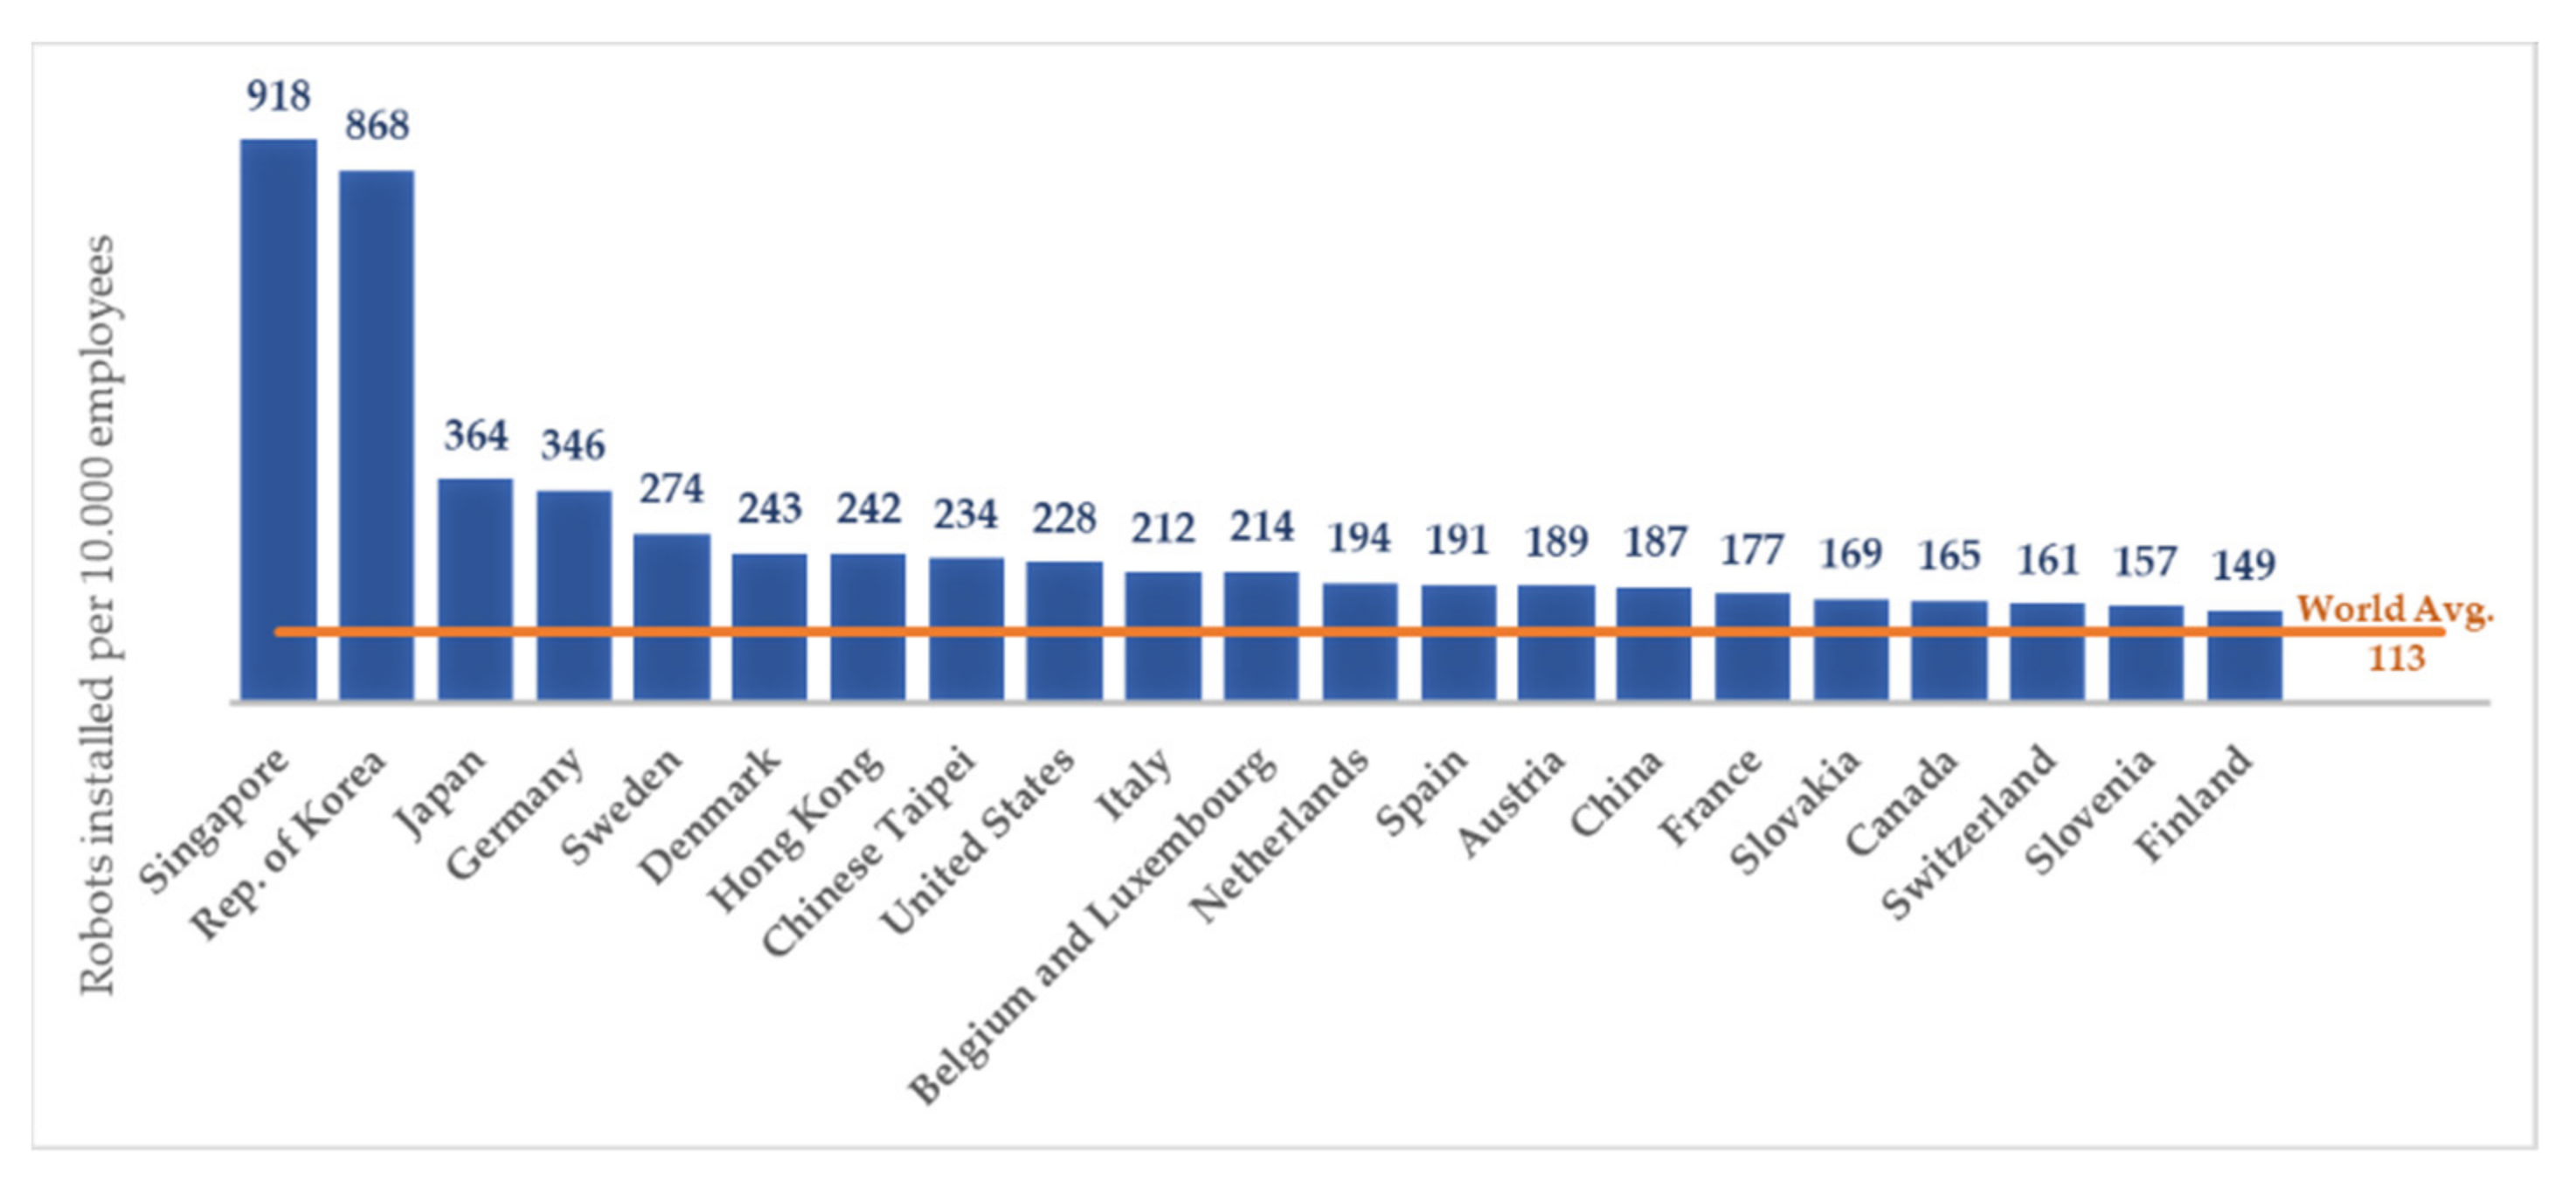
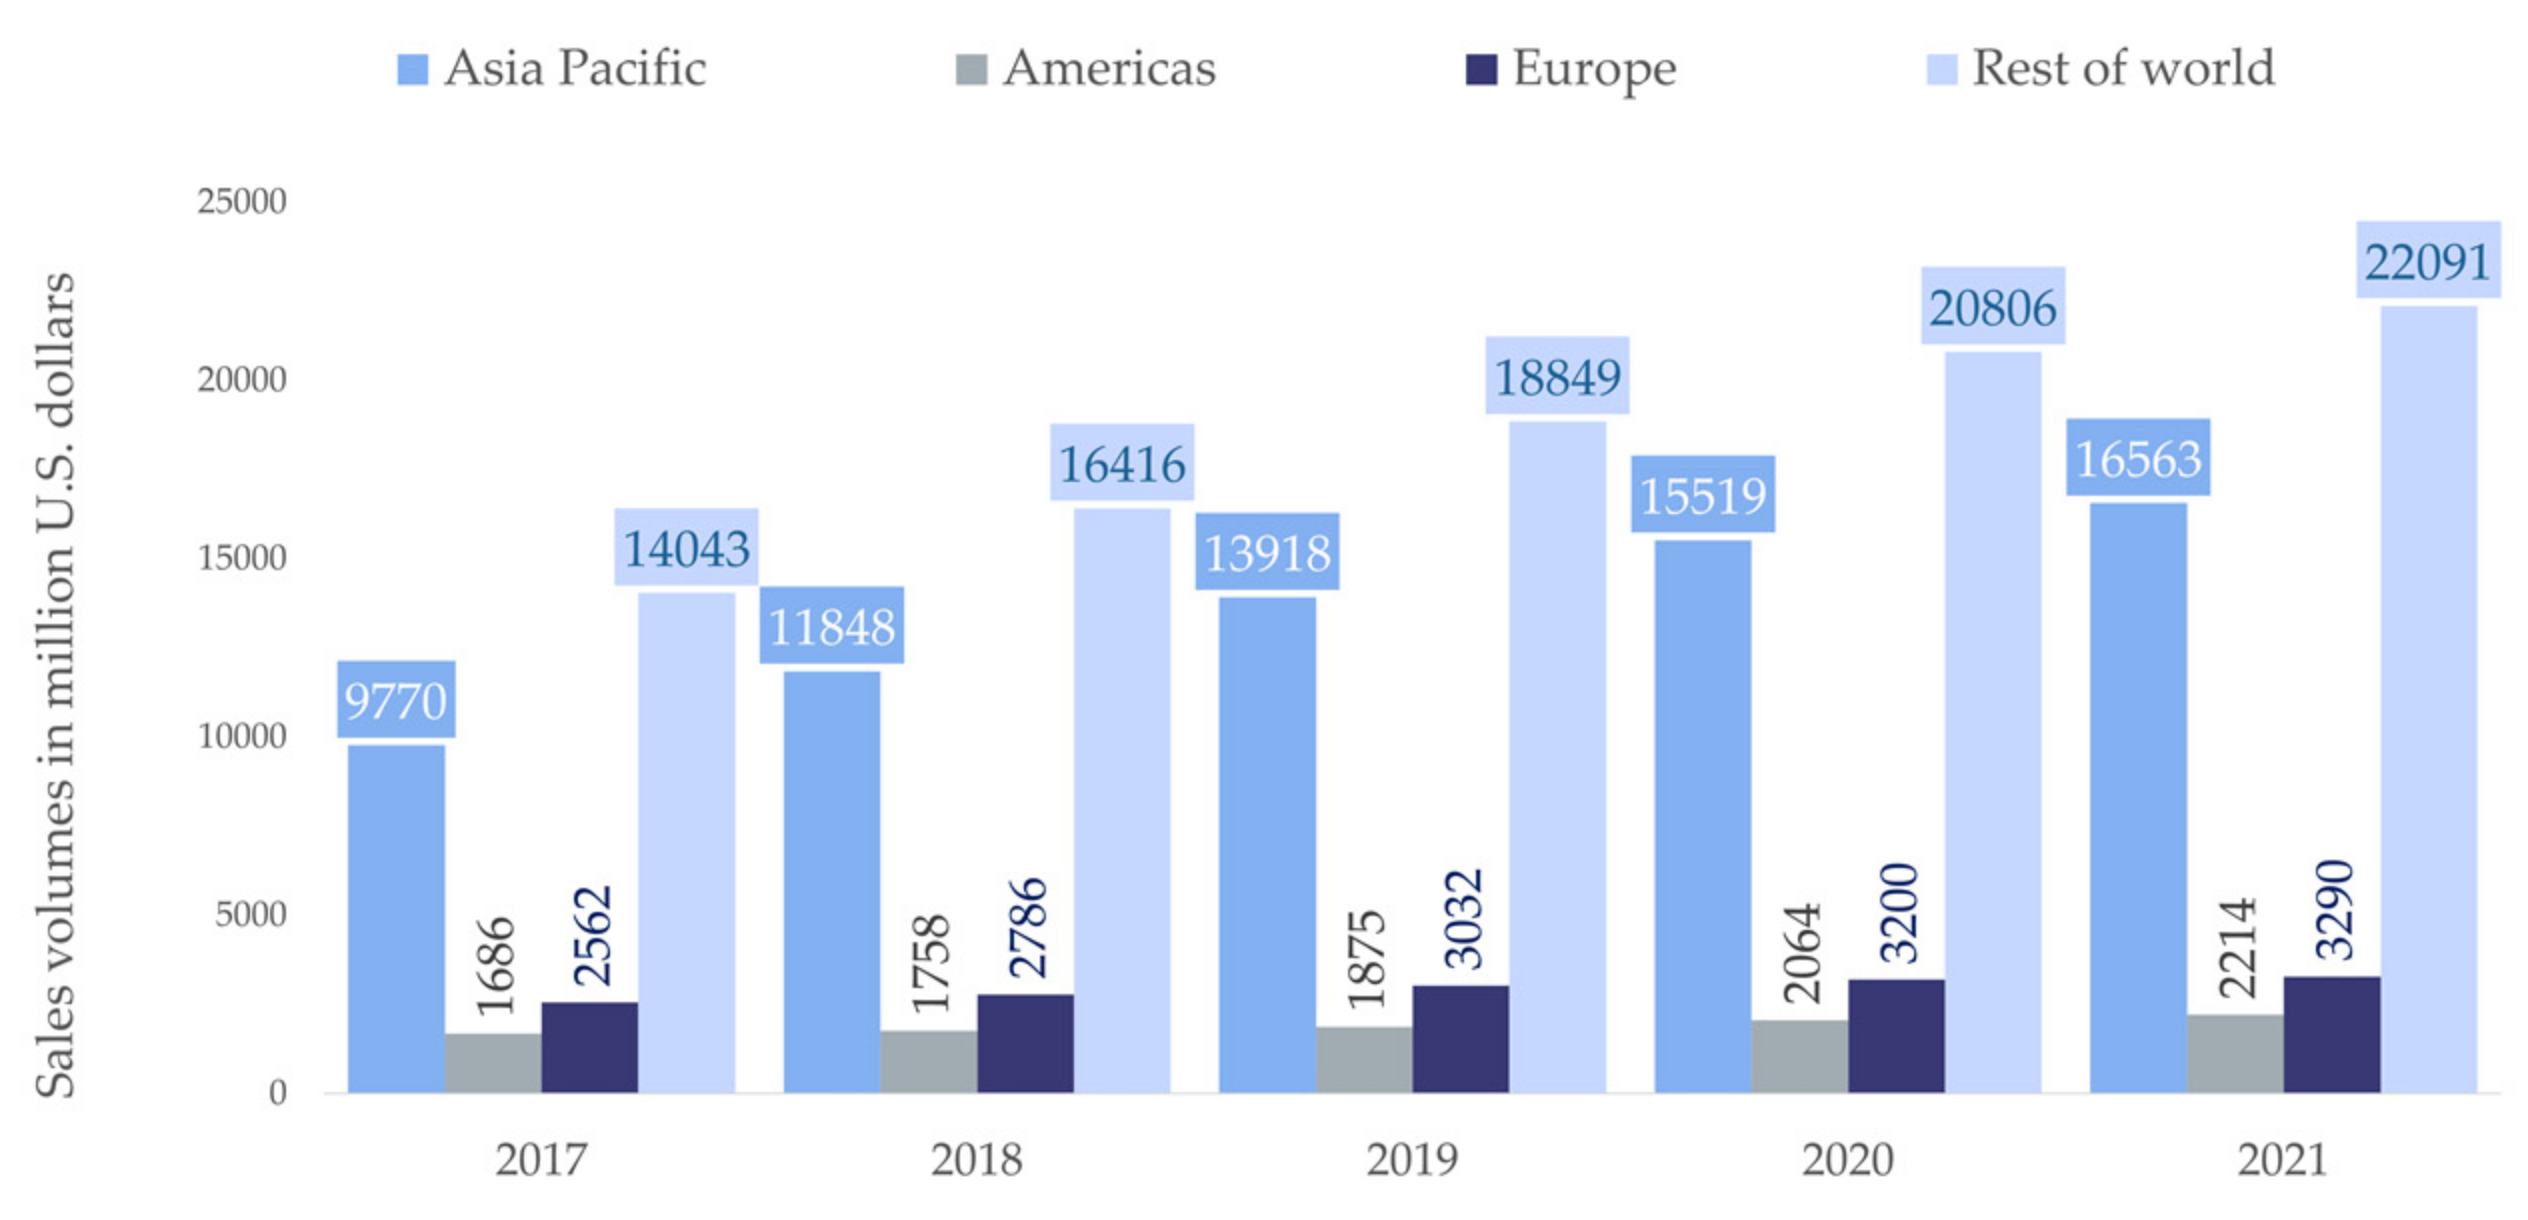
2.3. Global Robotics Market: Main Dimensions, Considerations, and Impact

Robot density is one of the metrics used to quantify the number of robots per 10,000 workers within a specific geographical area or industry. When it comes to the global robotics market, based on the metrics of manufacturing industry-related robot density, a global record was established in 2019. According to the International Federation of Robotics’ 2020 World Robotics Report [20], the average worldwide manufacturing-related robot density reached the level of 113 robots per 10,000 workers (Figure 1).
As highlighted by the International Federation of Robotics in 2019 [21] (IFR Report, 2019), the top five most automated countries worldwide were Singapore (918 robots/10,000 workers), South Korea (868 robots/10,000 workers), Japan (364 robots/10,000 workers), Germany (346 robots/10,000 workers), and Sweden (274 robots/10,000 workers).
These results are consistent and relevant with respect to Statista’s 5-year analysis of sales volumes (million US dollars) of robots. According to the analysis geographically, Asia Pacific represents the leading region in the robotics field, surpassing both Europe and America in terms of robot sales volume (Figure 2).
The position paper entitled “The Impact of Robots on Productivity, Employment and Jobs”, published by the International Federation of Robotics Frankfurt, Germany (in 2017, updated in April 2018) [22], states that the acceptance of robotics in the global labor market should be considered an important opportunity for future economic and social development. The main argument used to support this statement refers to how the use of robotics contributes to the improvement of labor productivity and business competitiveness, and furthermore leads to an increase in the aggregate demand for products and services; thus, generating more diverse employment opportunities that require higher levels of skill.
These statements are questioned [4], who assert how automation may instead lead to the substitution of human resources with robots, as “at the margin, capital performs certain tasks more cheaply than labor used to”.
In response, the International Federation of Robots Reports (IFR) highlights that higher use of robots will lead to a more specialized labor market that will allow employees to better appreciate the importance of core competencies and high skills such as “critical thinking, problem-solving, and people management”. Therefore, we should observe an increase in the demand for new jobs that require high levels of skill and capabilities, such as smart factory managers, solution planners, and production technology engineers [20].
Additionally, examining data from the OECD’s latest available Report [2] regarding the future of work, we noticed that, during 2012–2019, the employment rate had an ascending trend line (an average of 12% growth rate across all countries and occupations analyzed).
The employment growth rate for occupations falling under the incidence of automation, in the bottom half of the range, registered an average rate of 18%, while in the case of occupations at high risk of automation there was an average rate of 6% (i.e., assemblers had an average employment growth rate of 25% between 2012 and 2019, whilst at risk of automation of more than 35%; food preparation assistants with a risk of automation of 50.1% had an average employment growth rate of more than 40%). As noted by the above-mentioned report, there is no direct correlation that can be illustrated from an occupational perspective between the risk of automation and the employment growth rate. However, the report highlights that some differences between the lower-risk of automation and higher-risk of automation professions, in terms of employment and unemployment, may arise.
Therefore, the question that we consider important to be addressed is whether society should be more afraid of work automation or rather of its potential failure to create inclusive jobs and training opportunities for its individuals, regardless of their current occupation or education levels. These kinds of questions are also illustrated by the correlation existing between the percentage change in the operational stock of robots (IFR calculates the operational stock of robots/country by adding annual deployments, assuming robots operate exactly 12 years and are withdrawn afterwards), on one hand, and the percentage change in the employment among countries, on the other hand; both being reported for the period 2012–2019 (Figure 3).
We can note from Figure 3 above that, in the case of countries [23] with a significant increase in the operational stock of industrial robots, the change rate in employment followed the same ascending trend line; while, in the case of countries with a lower average investment rate in industrial robots, the employment rate still registered an ascending trend, but at a steadier pace of the growth rate.
Another paper, based on a panel of industry-specific data collected from 17 different countries during the period 1993–2007, illustrated that “an increased use of industrial robots is associated with an increase in labor productivity”. More specifically the authors observed that the calculated productivity growth rate based on conservative estimations “comes to 0.36 percentage points, accounting for 15% of the aggregate economy-wide productivity growth” [24].
The previously mentioned thesis also illustrated that the increase in industrial robot use contributed to an increase in selected countries’ GDP by 0.37 percentage points. This result might be credited to the fact that an increase in productivity means fewer hours of work spent on the entire manufacturing and processing of a single product.
Other important parallels between the density of industrial robots and potential economic growth were highlighted within the study led by Kara Mazachek, a research analyst from Select USA [25] (SelectUSA is a governmental program that facilitates investments in the United States of America). The study considers data from the IFR and EUKLEMS [26] databases. It illustrates that, while among different industries, results in productivity, added value, and hours worked may vary, the average rate of productivity growth was 0.8% for each increment of one percent average growth rate of industrial robot density. The authors noticed that this productivity growth rate registered higher values among countries that were less robotized at the time when the study was developed.
These findings are in line with IFR’s predictions for 2020–2022, estimating an average growth rate of 12% for the worldwide annual sales of industrial robots. Likewise, the International Data Corporation’s (IDC) projections for this year anticipate that “by 2022, 35% of repetitive work tasks in large enterprises will be automated and/or augmented” [27] based on the implementation of AI, robotics, or intelligent process automation.
Moreover, when it comes to the non-industrial robot market, IFR highlights how the global COVID-19 pandemic caused the growth of the service robot market “by 12% in 2020, from a sample turnover of USD 6.0 billion to USD 6.7 billion” [28].
These growth trend lines, registered by both industrial and non-industrial robot markets, reveal that many companies worldwide are considering or have already begun to heavily invest in the deployment of emerging technologies to increase manufacturing task productivity, minimize engineering time, and avoid human error.
In the context of today’s highly competitive business environment, it is certain that from both a financial perspective and technological absorptive capacity, the increase in the robotics market opens a series of opportunities and challenges, especially for small and midsize businesses (SMBs).

2.4. The Added Value of Robotics: A Marketing Perspective for Increasing Competitiveness

In recent years, literature attempts have focused on determining how robots may increase businesses’ competitiveness, particularly highlighting the importance of facilitating SMB adoption of labor automation and augmentation through the deployment of robotic applications. From a marketing perspective, robotics adoption calls for redefining the marketing mix of businesses, by influencing the four Ps: product, price, place, and promotion.
Through a product marketing lens, the scopes of goods and services are viewed by the means through which they succeed in meeting customer demand and not necessarily as tangible assets. Robotic applications are reshaping the way in which products are being manufactured, by partially or totally substituting the human labor, while also allowing for better quality control and standardized production.
The substitution of human labor includes using collaborative robots for automating repetitive tasks, such as goods’ quality inspections, welding, painting, packaging, or even creating assembly line systems comprised of multiple industrial robot arms, which manage the entire manufacturing processes of large goods, without the need for employing multiple workers.
Likewise, the specialized literature has shown that for various industries, the fast growth of human labor costs and the dynamism of market shares means that robot substitution brings significant cost advantages throughout the whole life cycle of robotic assets. However, these cost advantages resulting from robot adoption may be observed to different degrees and are based on various factor analyses, depending on the business specifics.
A case study, for the case of the automobile industry, noted that industrial robotic work substitution allows for “continuous heterogeneous resource investment” [29], while for the hospitality and tourism industry, service robotic work substitution minimizes operational costs and allows for enhanced customer experiences, simultaneously reducing waiting times and contributing to the improvement of service consistency [30].
Moreover, subscription-based robotic applications, such as the recently developed Robots-as-a-Service (RaaS) technology comprised of a robotic device leasing model and the cloud computing solution designed to facilitate human–robotic collaboration, allow businesses to benefit from robotic applications at a much more affordable cost of deployment, while also providing the needed interfaces for various functions, including data collection and sharing options, communication control, state maneuvering, or robotic cooperation.
The observed cost reduction achieved through robotic work substitution and increase in production flexibility finally mean that companies can ensure a method through which they can offer standardized goods and services, offering the demanded mix of features, quality, and usability, at more affordable prices, while also allowing companies to cover a greater market share in a much shorter period, compared to traditional labor.
When it comes to the place component of the marketing mix, robotic applications are consolidating the logistics and transportation value chains through technologies that allow for autonomous driving and control of vehicles and machinery. Self-driving autonomous vehicles mean faster transportation times and precise logistics management, while applications such as autonomous mobile robots ensure workplace ergonomics by easily transporting heavy loads through warehouses.
Robotics developments in the field of logistics and transportation are also improving employee safety, by replacing the need for human action in hazardous environments and, thus, minimizing work-associated health risk factors.
Nonetheless, the recent literature highlights that despite the earlier development of industrial robots, the automation of customer-centric labor activities, including those undertaken in the service sector, are more at risk of automation than the physical work performed in the manufacturing industry; with manufacturing falling only in second place on the list of industries ordered by risk of automation [31].
The rise of the Internet and network-based technologies in the past decades, together with the movement towards a knowledge-based society and the fast-paced transition towards digitalization, have revealed the need for creating new advertisement and sales channels that would offer companies competitive advantages, by augmenting customer’s experience and minimizing the product return rate with the help of novel technologies and robotics.
Applications of such technologies include virtual agents or intelligent assistants, such as the IBM Watson Assistants, automated shopping carts, interactive shelves, smart robots that use facial recognition for making personalized recommendations, robot-assisted shelf-reading, or even humanoid smart robots designed for the sole purpose of providing entertainment.
In this regard, service robots used for the promotion of goods and services differ from industrial ones, as they can generally overlook requirements regarding force and mechanical capabilities, as their principal scope of function resides in the degree of artificial intelligence employed, which will automate various sales processes.
Additionally, the literature reveals that the rapid development of more affordable and better performing robotic applications may help businesses, regardless of their industry or size, achieve cost-effective service excellence [32,33], facilitating companies worldwide to offer high-quality goods and services at more affordable prices, increasing sales volumes through augmented consumer experiences, and decreasing the product return ratio, while also reducing time spent on repetitive tasks and, thus, allowing employees to focus on innovation and business growth.

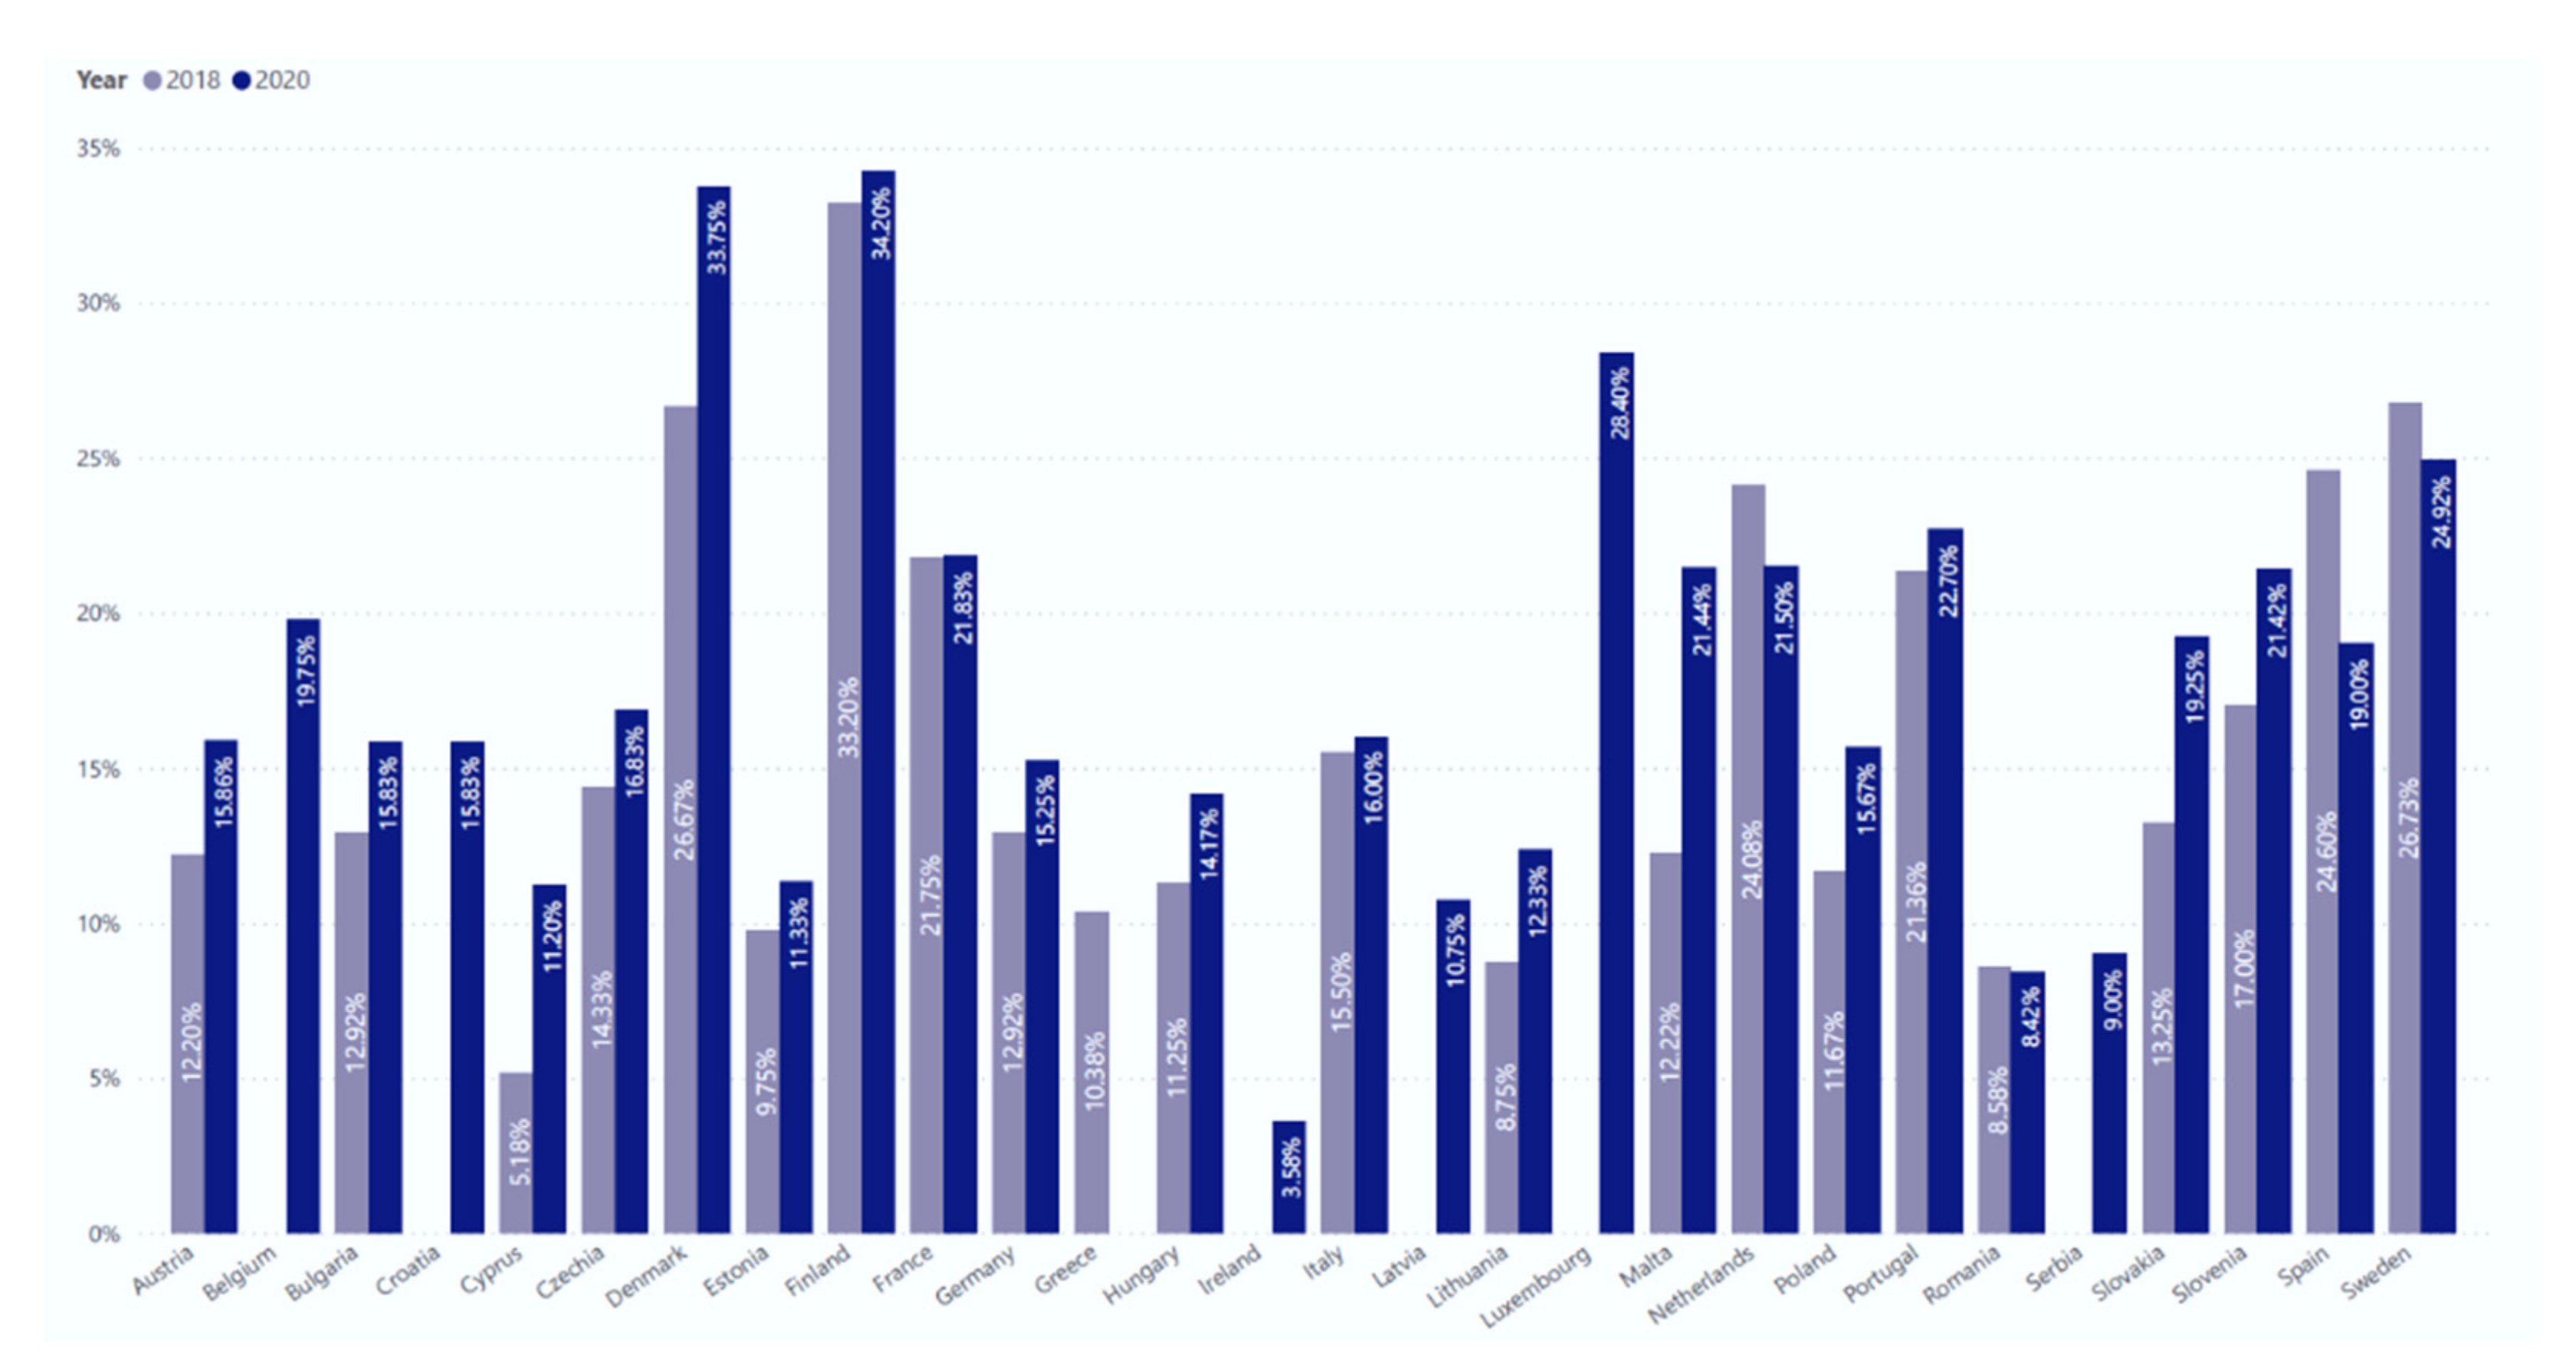
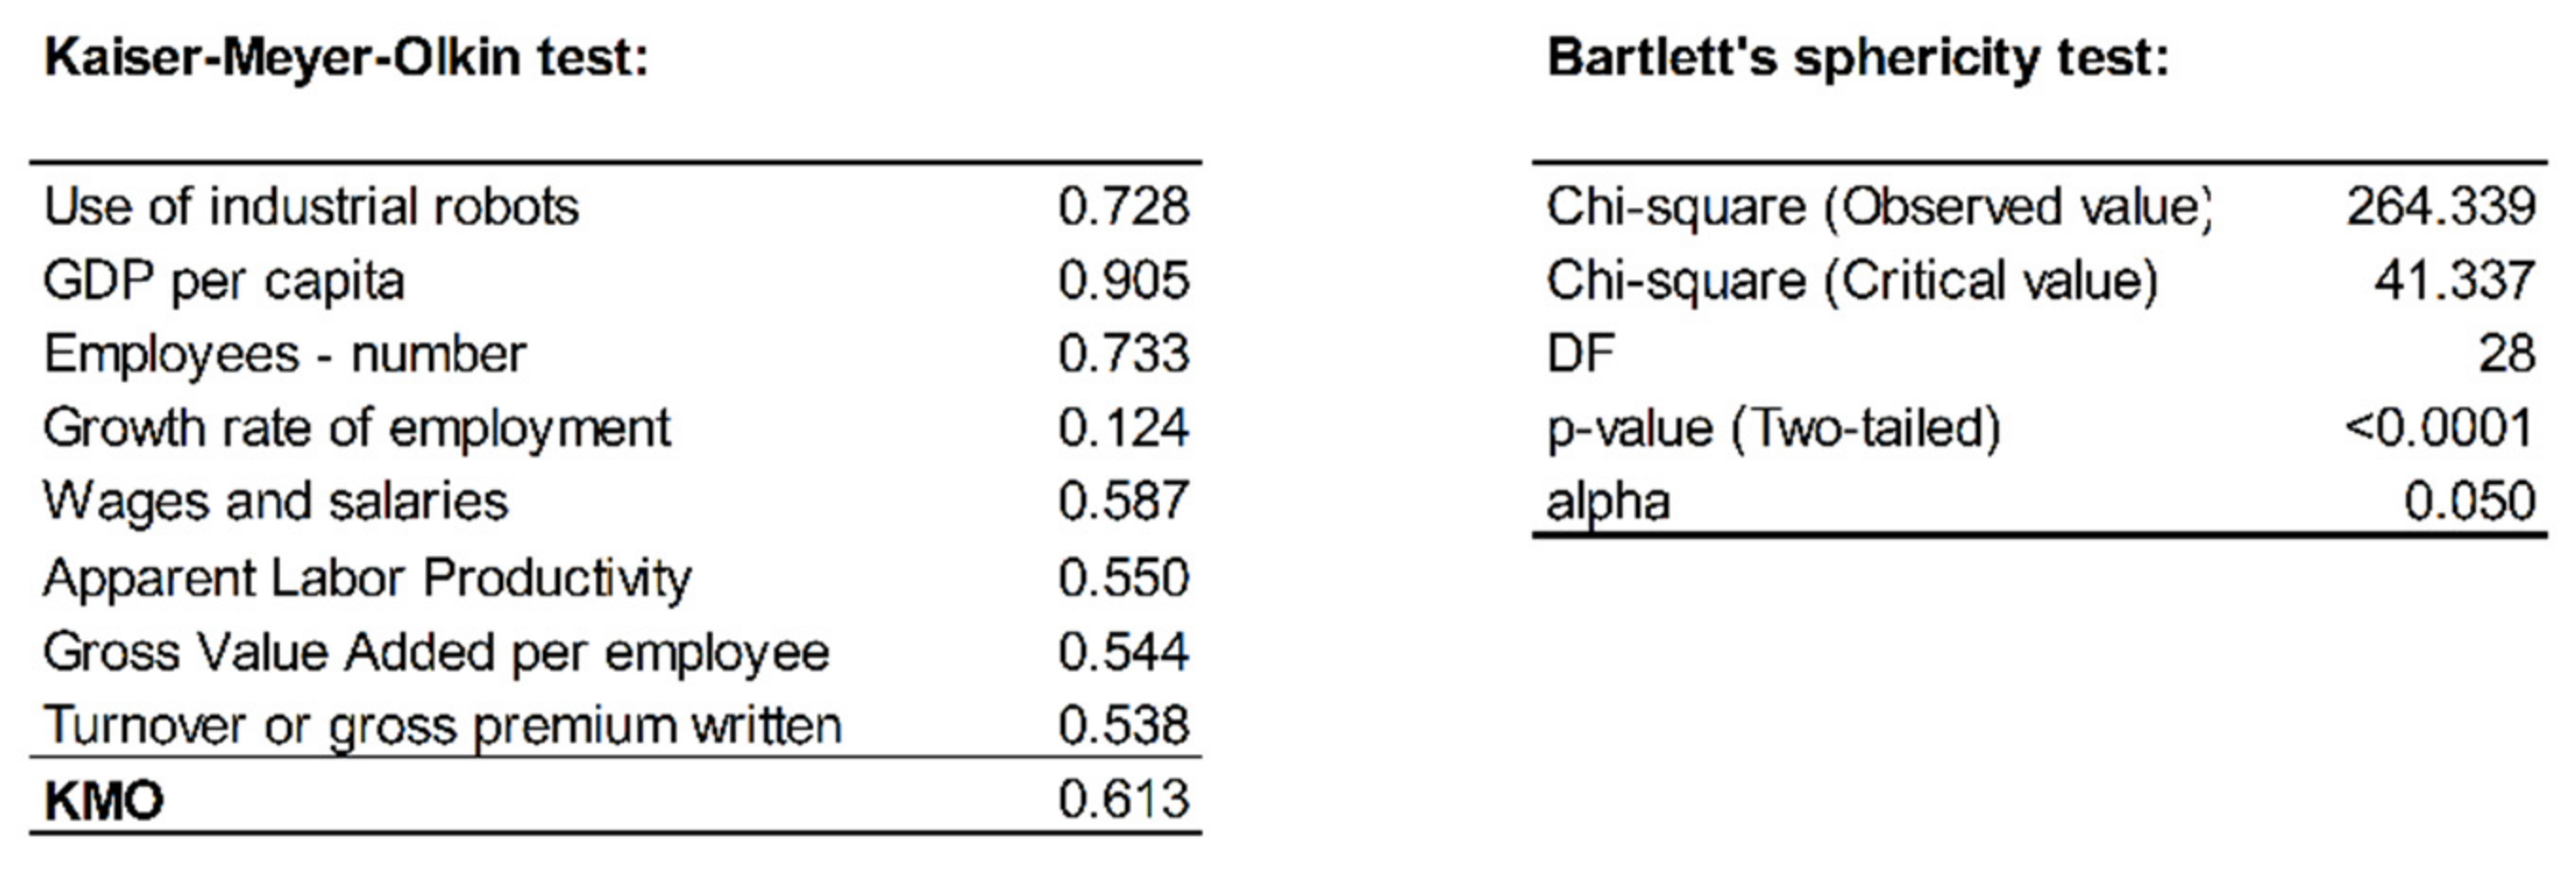
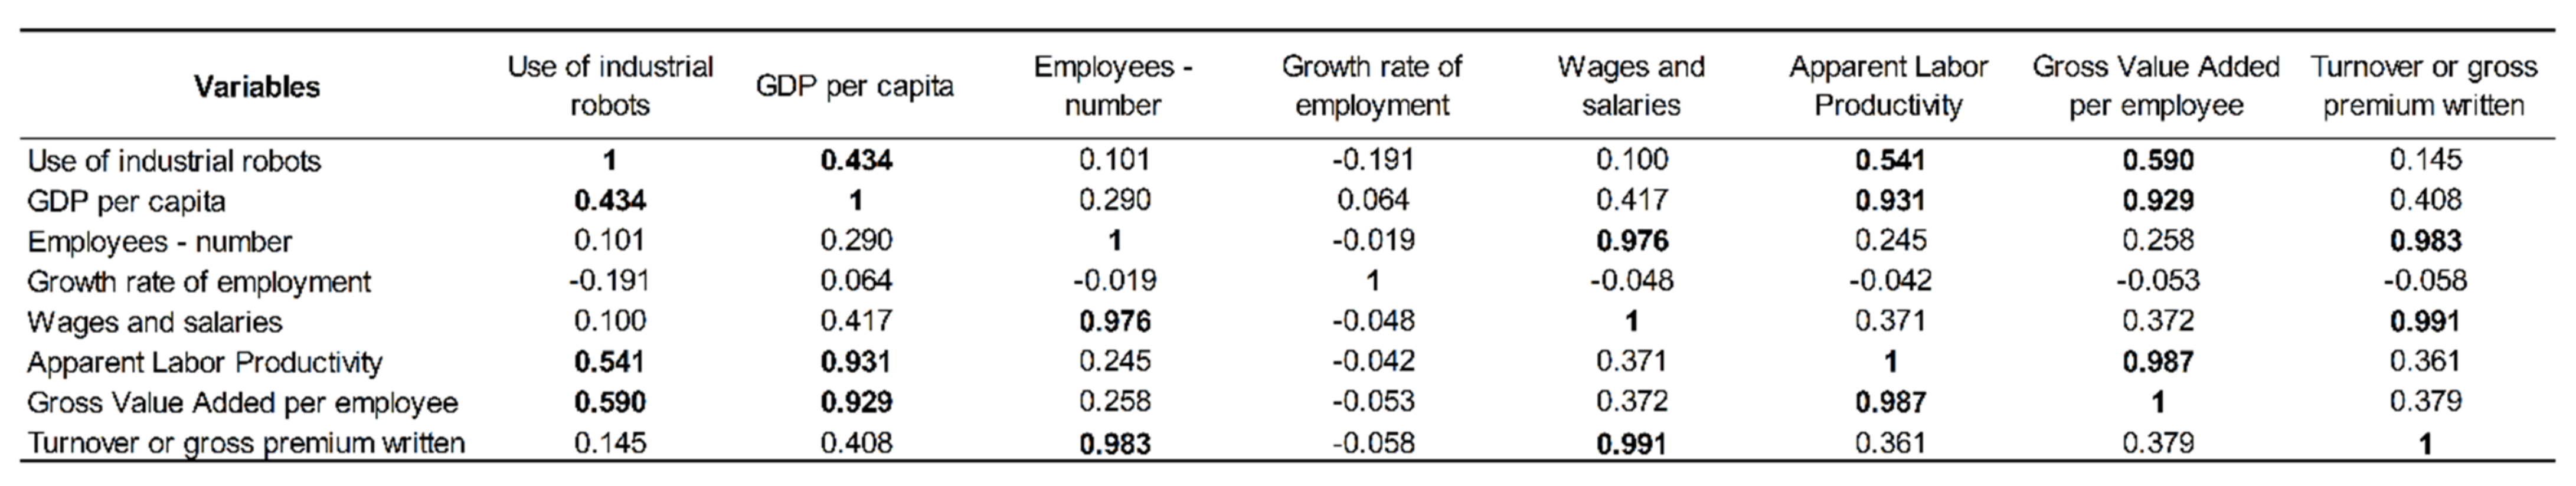
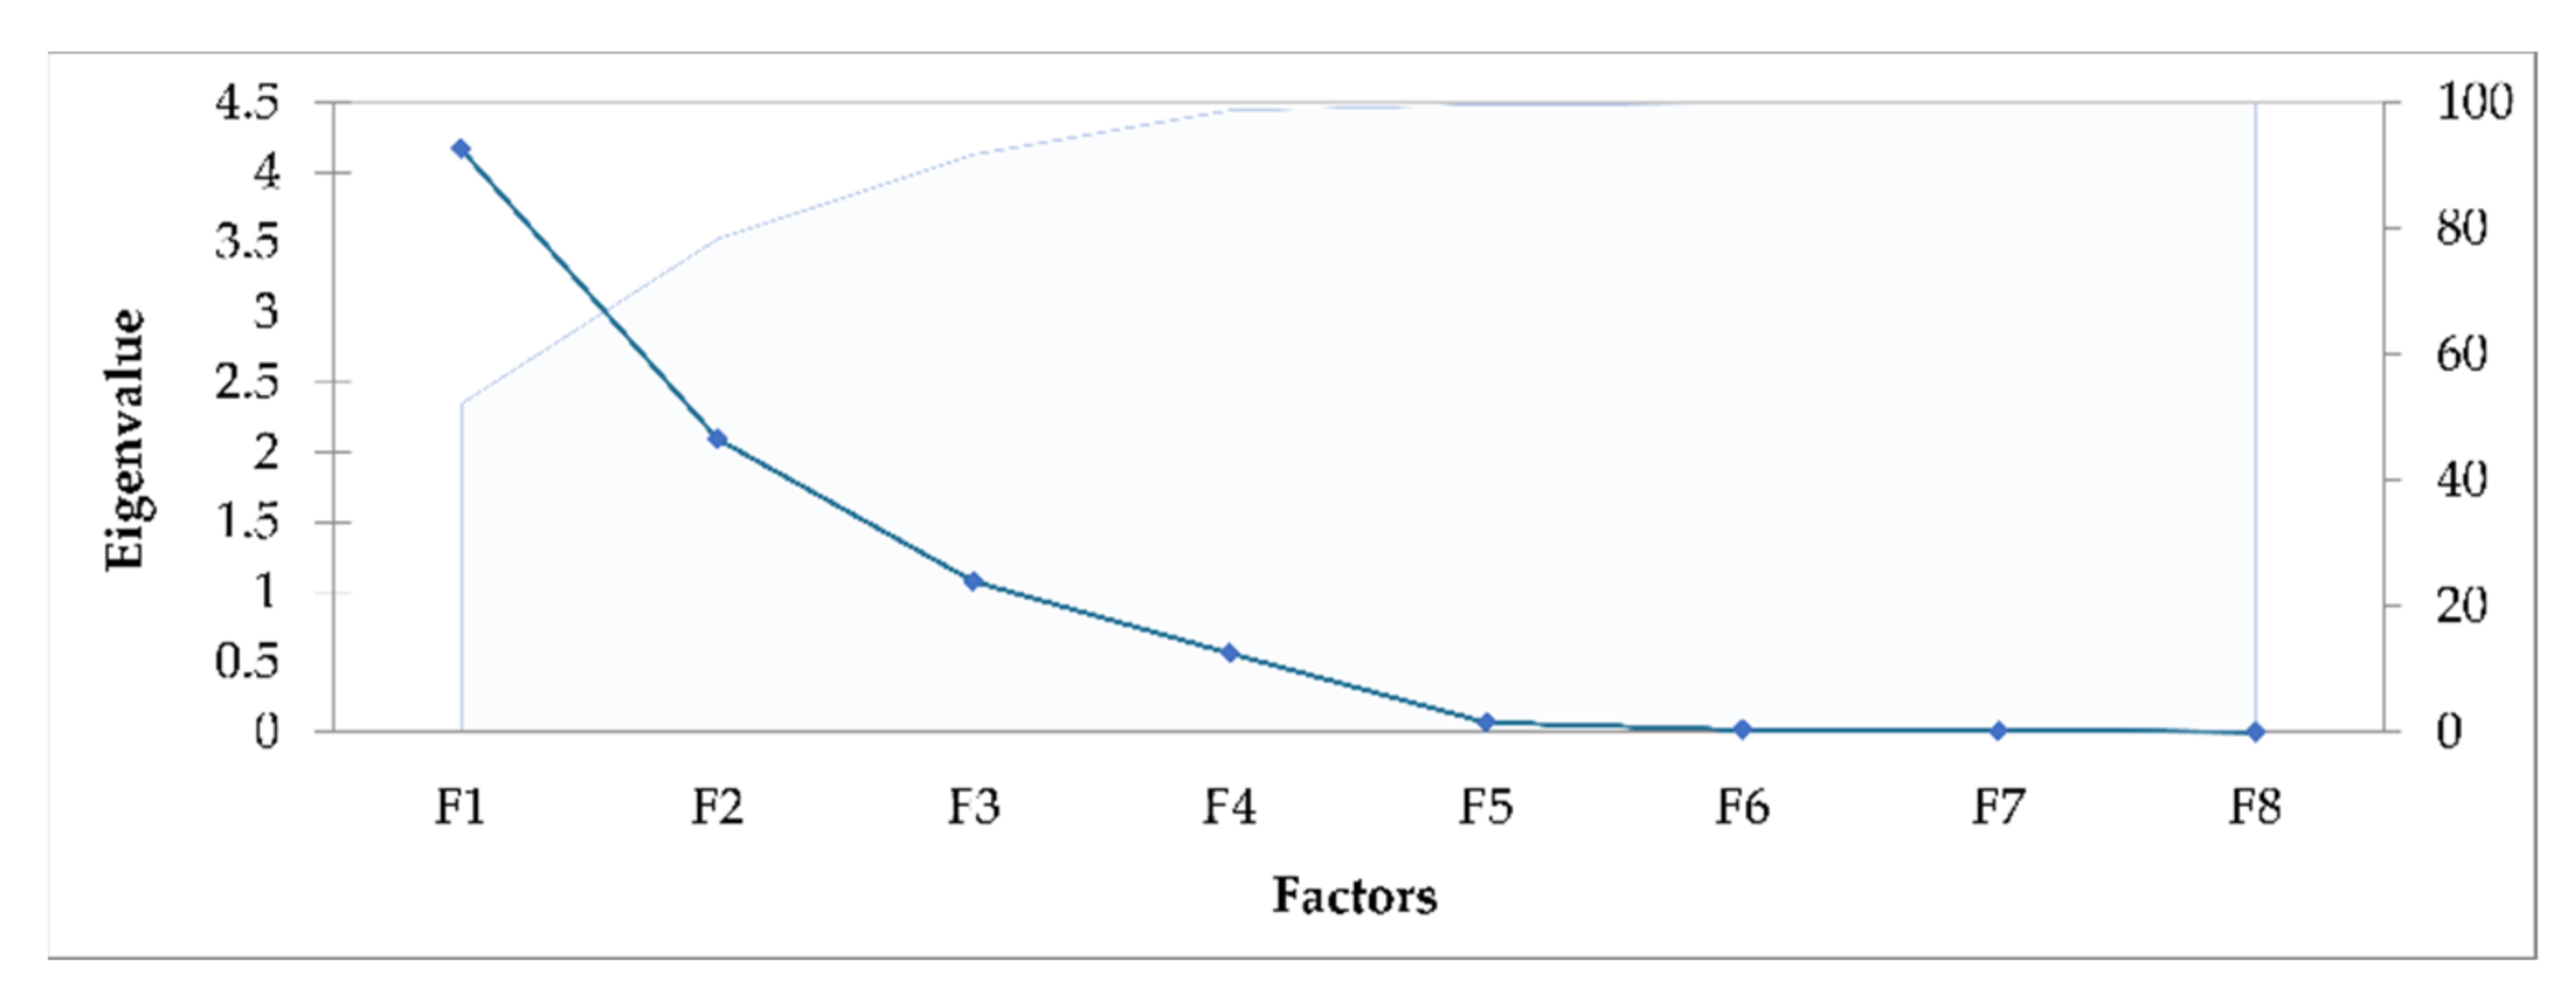
3. Modelling Data Regarding Enterprises’ Use of Industrial Robots: Key Findings and Main Results

3.1. Data Collection

The data used in this paper are primarily extracted from Eurostat. Values regarding the share of enterprises using industrial robots were extracted from Eurostat’s Database—3D Printing and Robotics [34], while the values for enterprise number, turnover or gross premium written (million euro), the growth rate of employment (%), wages and salaries (million euro), employee numbers, gross value added per employee (thousand euro), and apparent labor productivity (thousand euro) were extracted from Eurostat’s Annual enterprise statistics [35] for special aggregates of activities, according to the classification of economic activities—NACE Rev.2, database. Gross domestic product (GDP) and GDP per capita series expressed in Purchasing Power Parities (PPP) at current international USD were extracted from the World Development Indicators database of the World Bank Group [36].

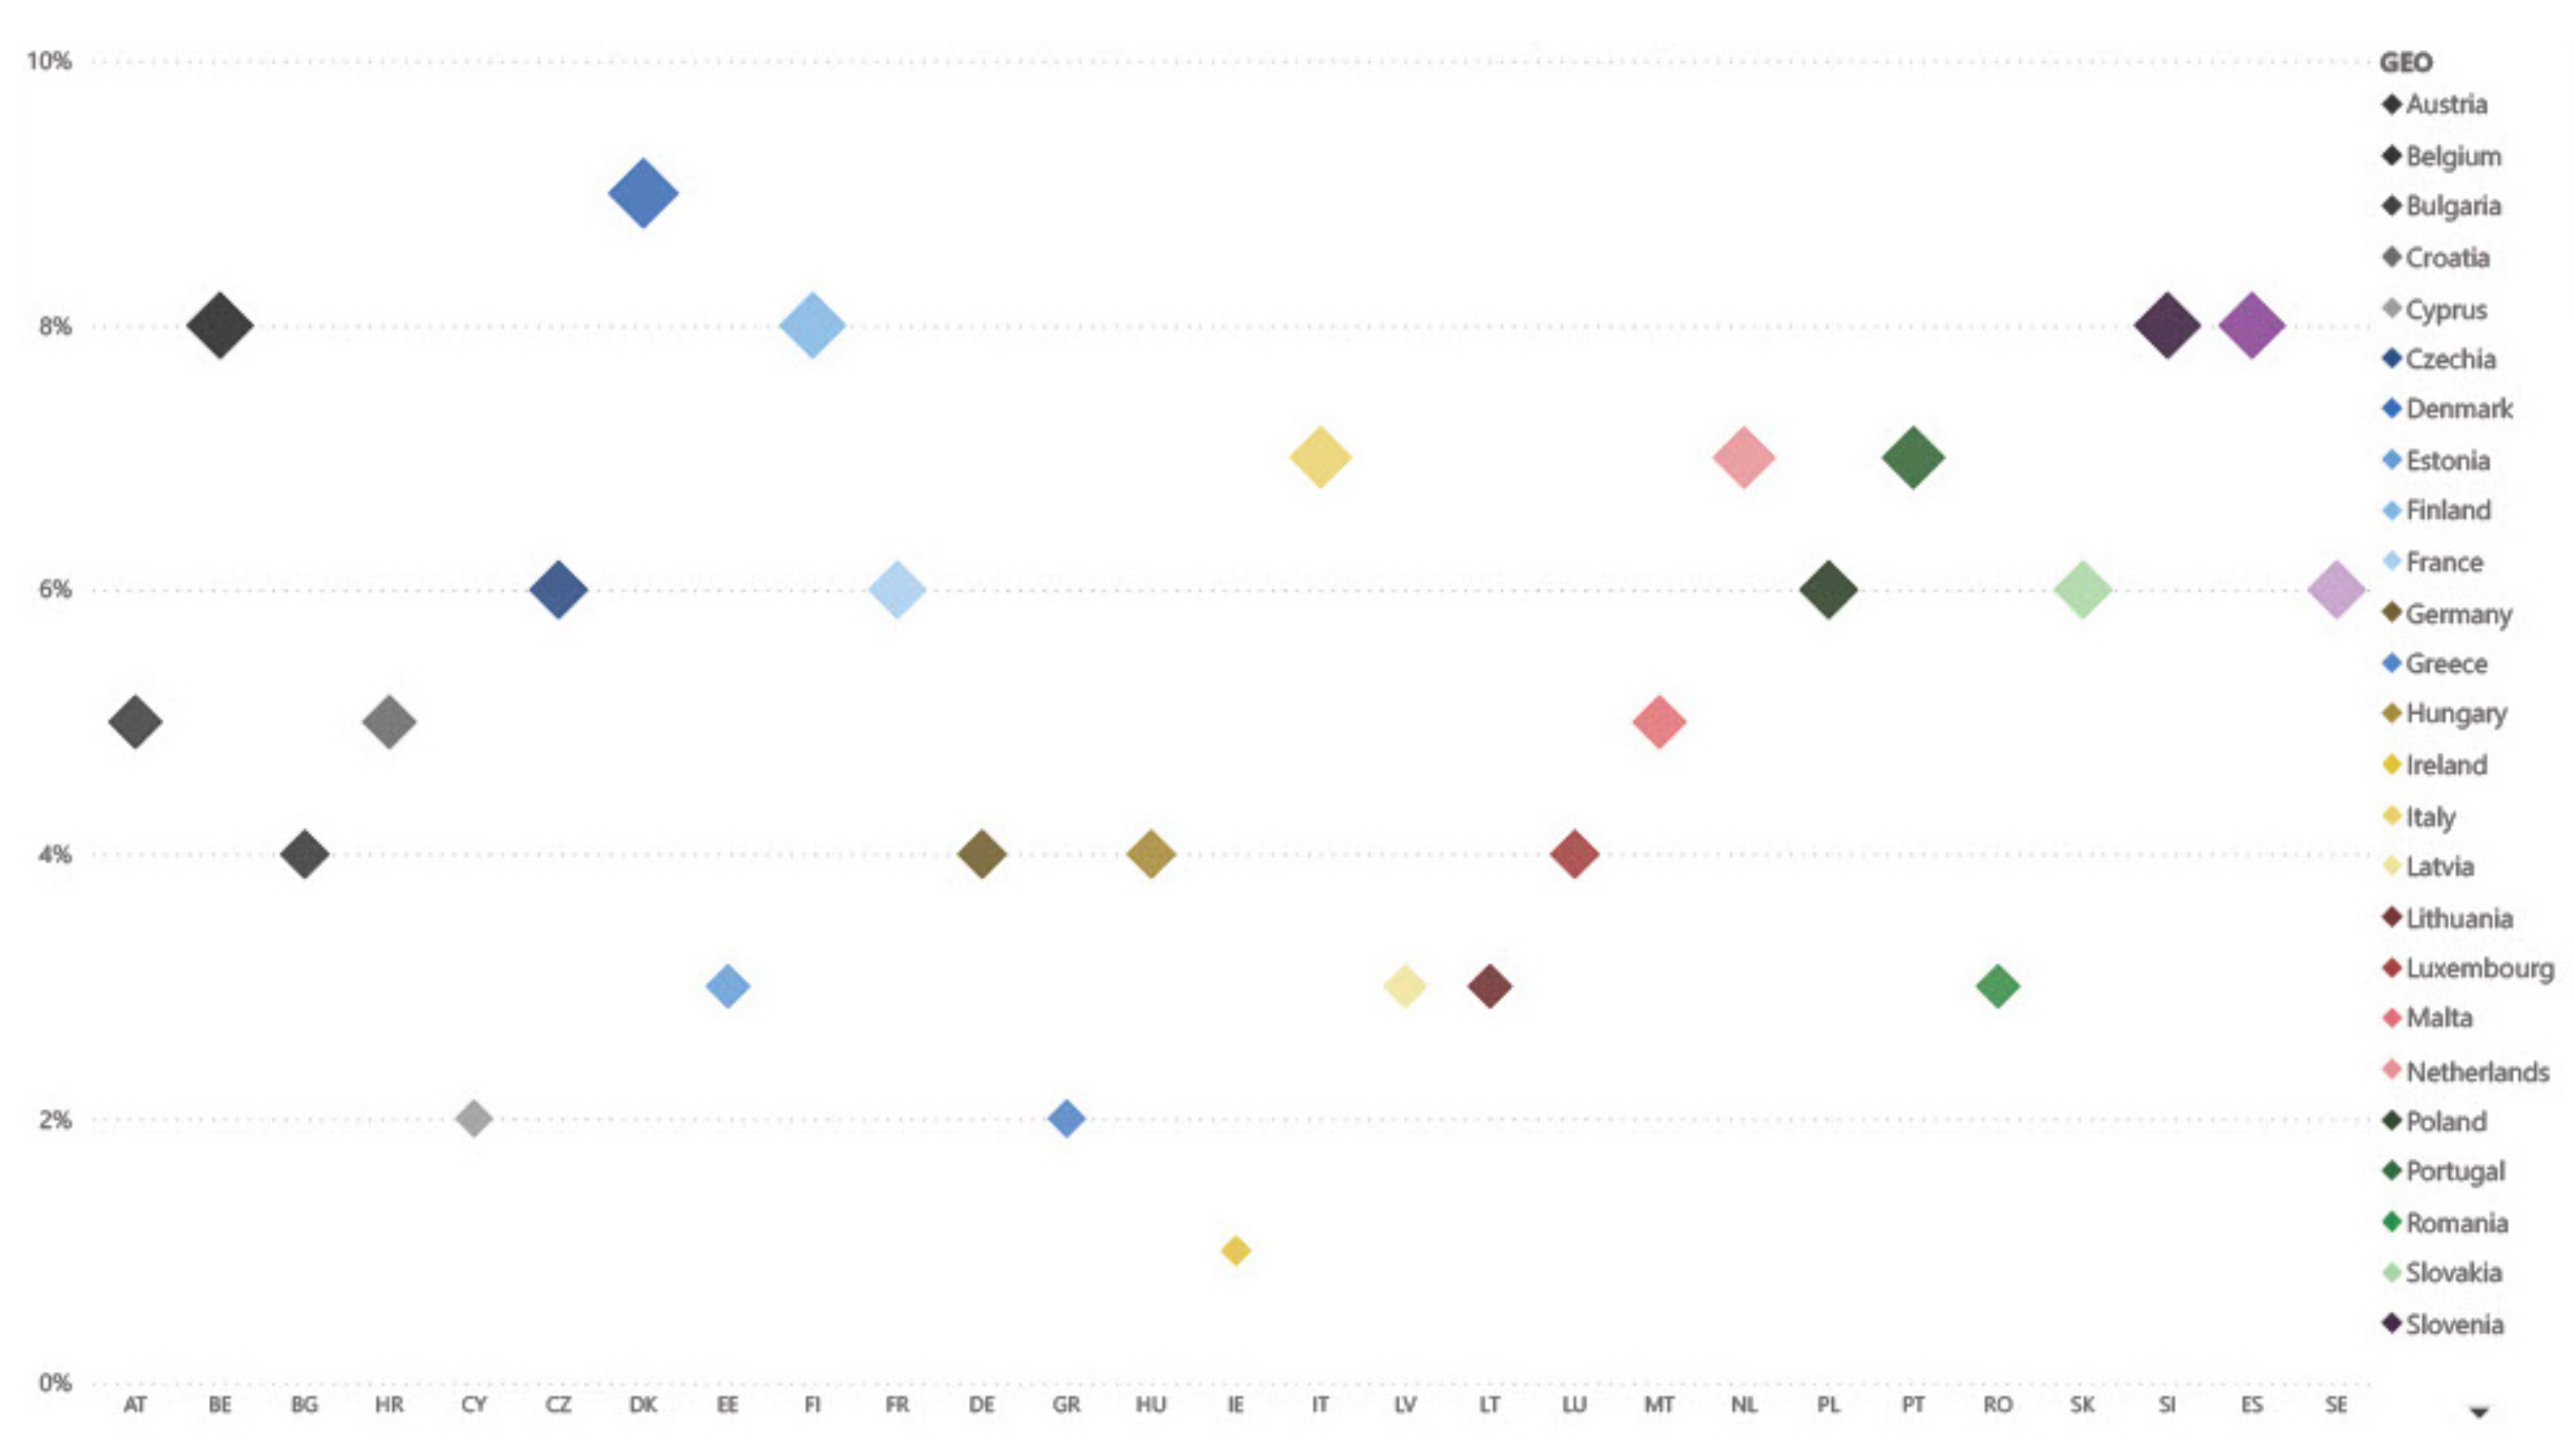
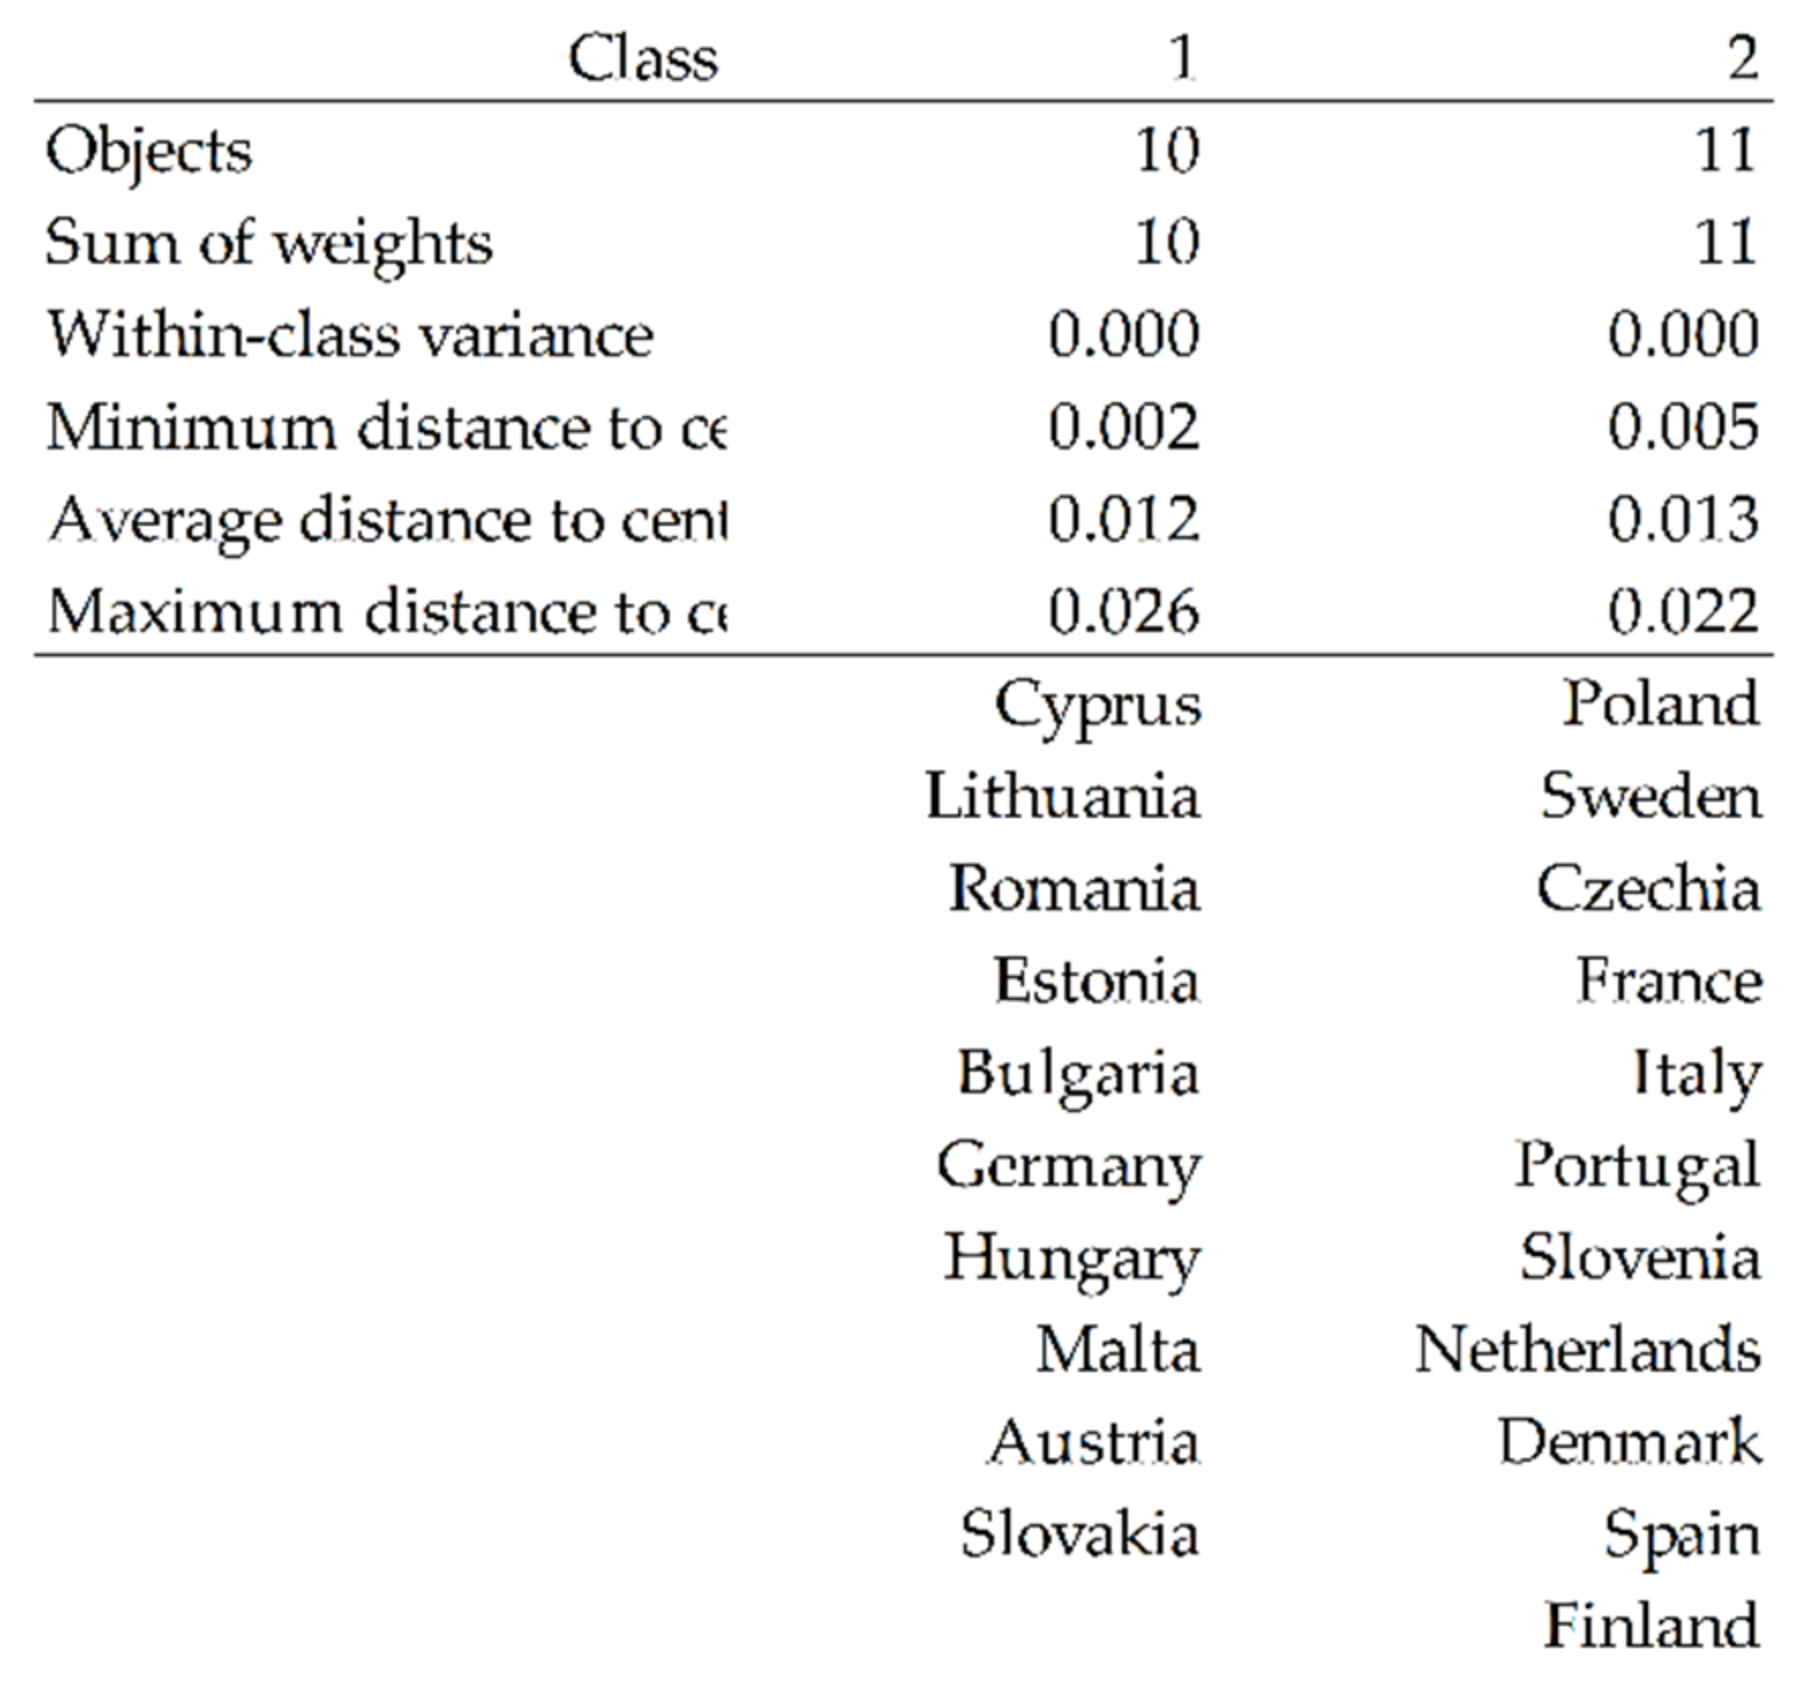
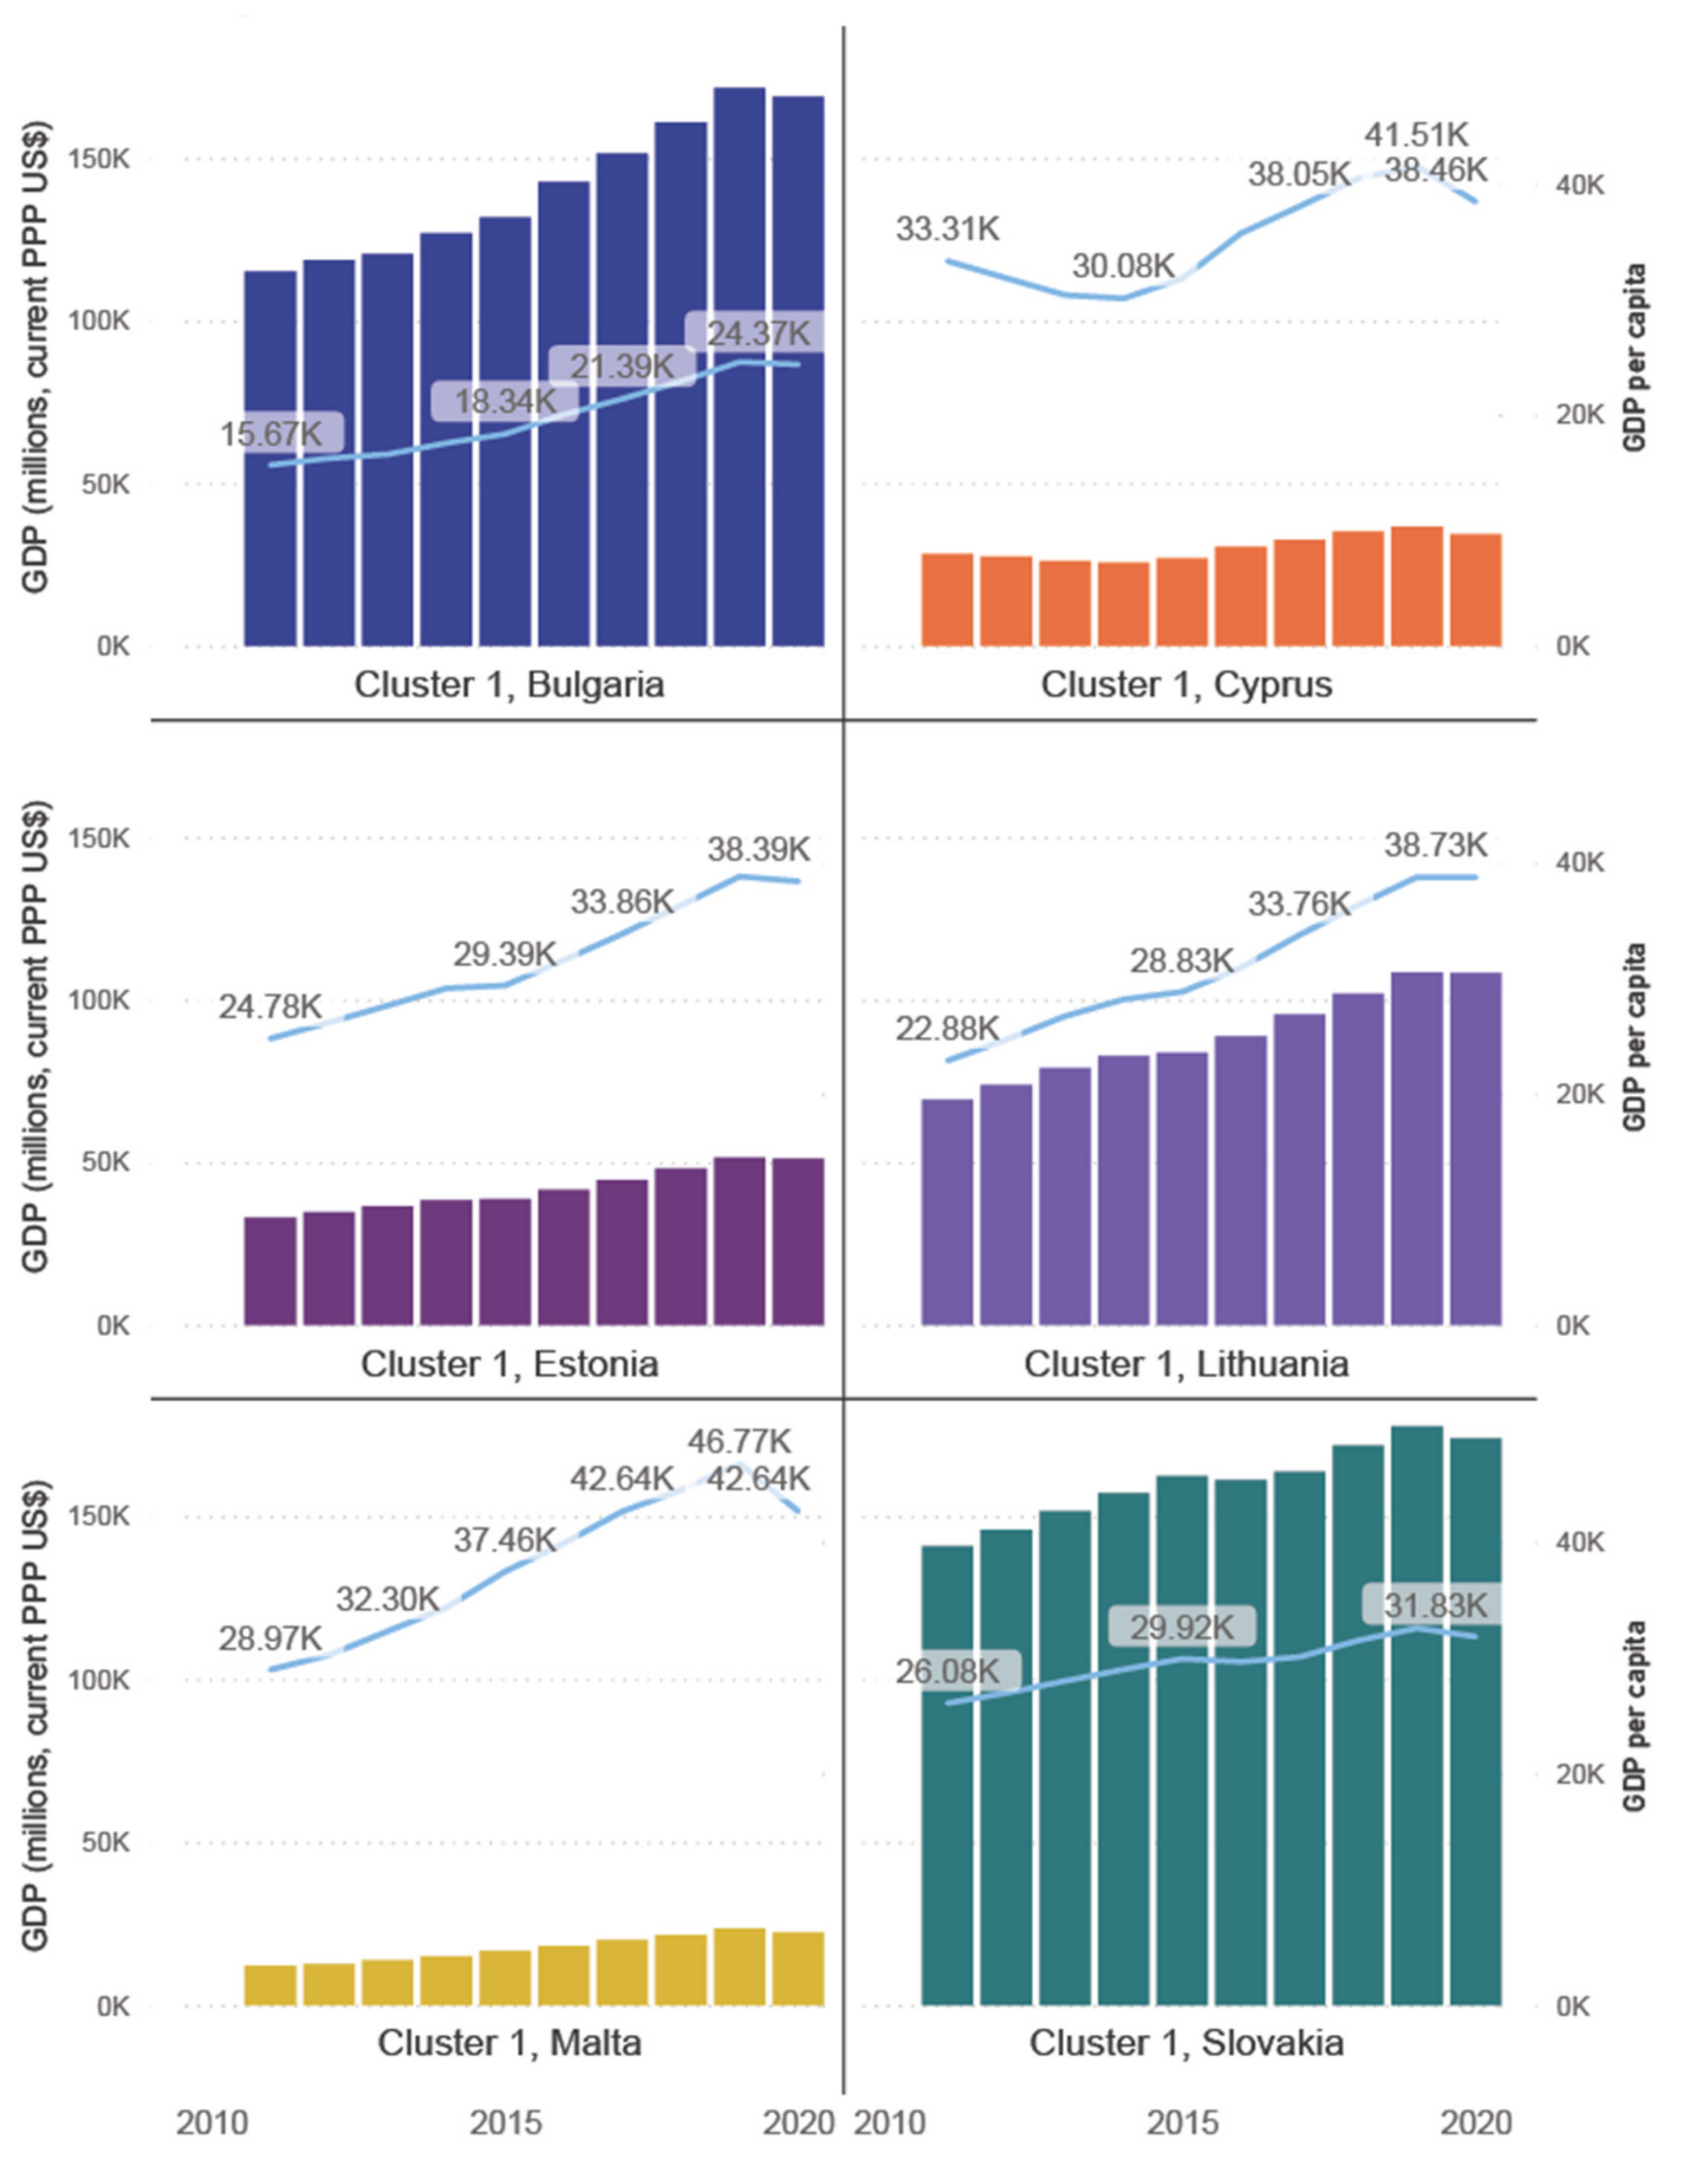
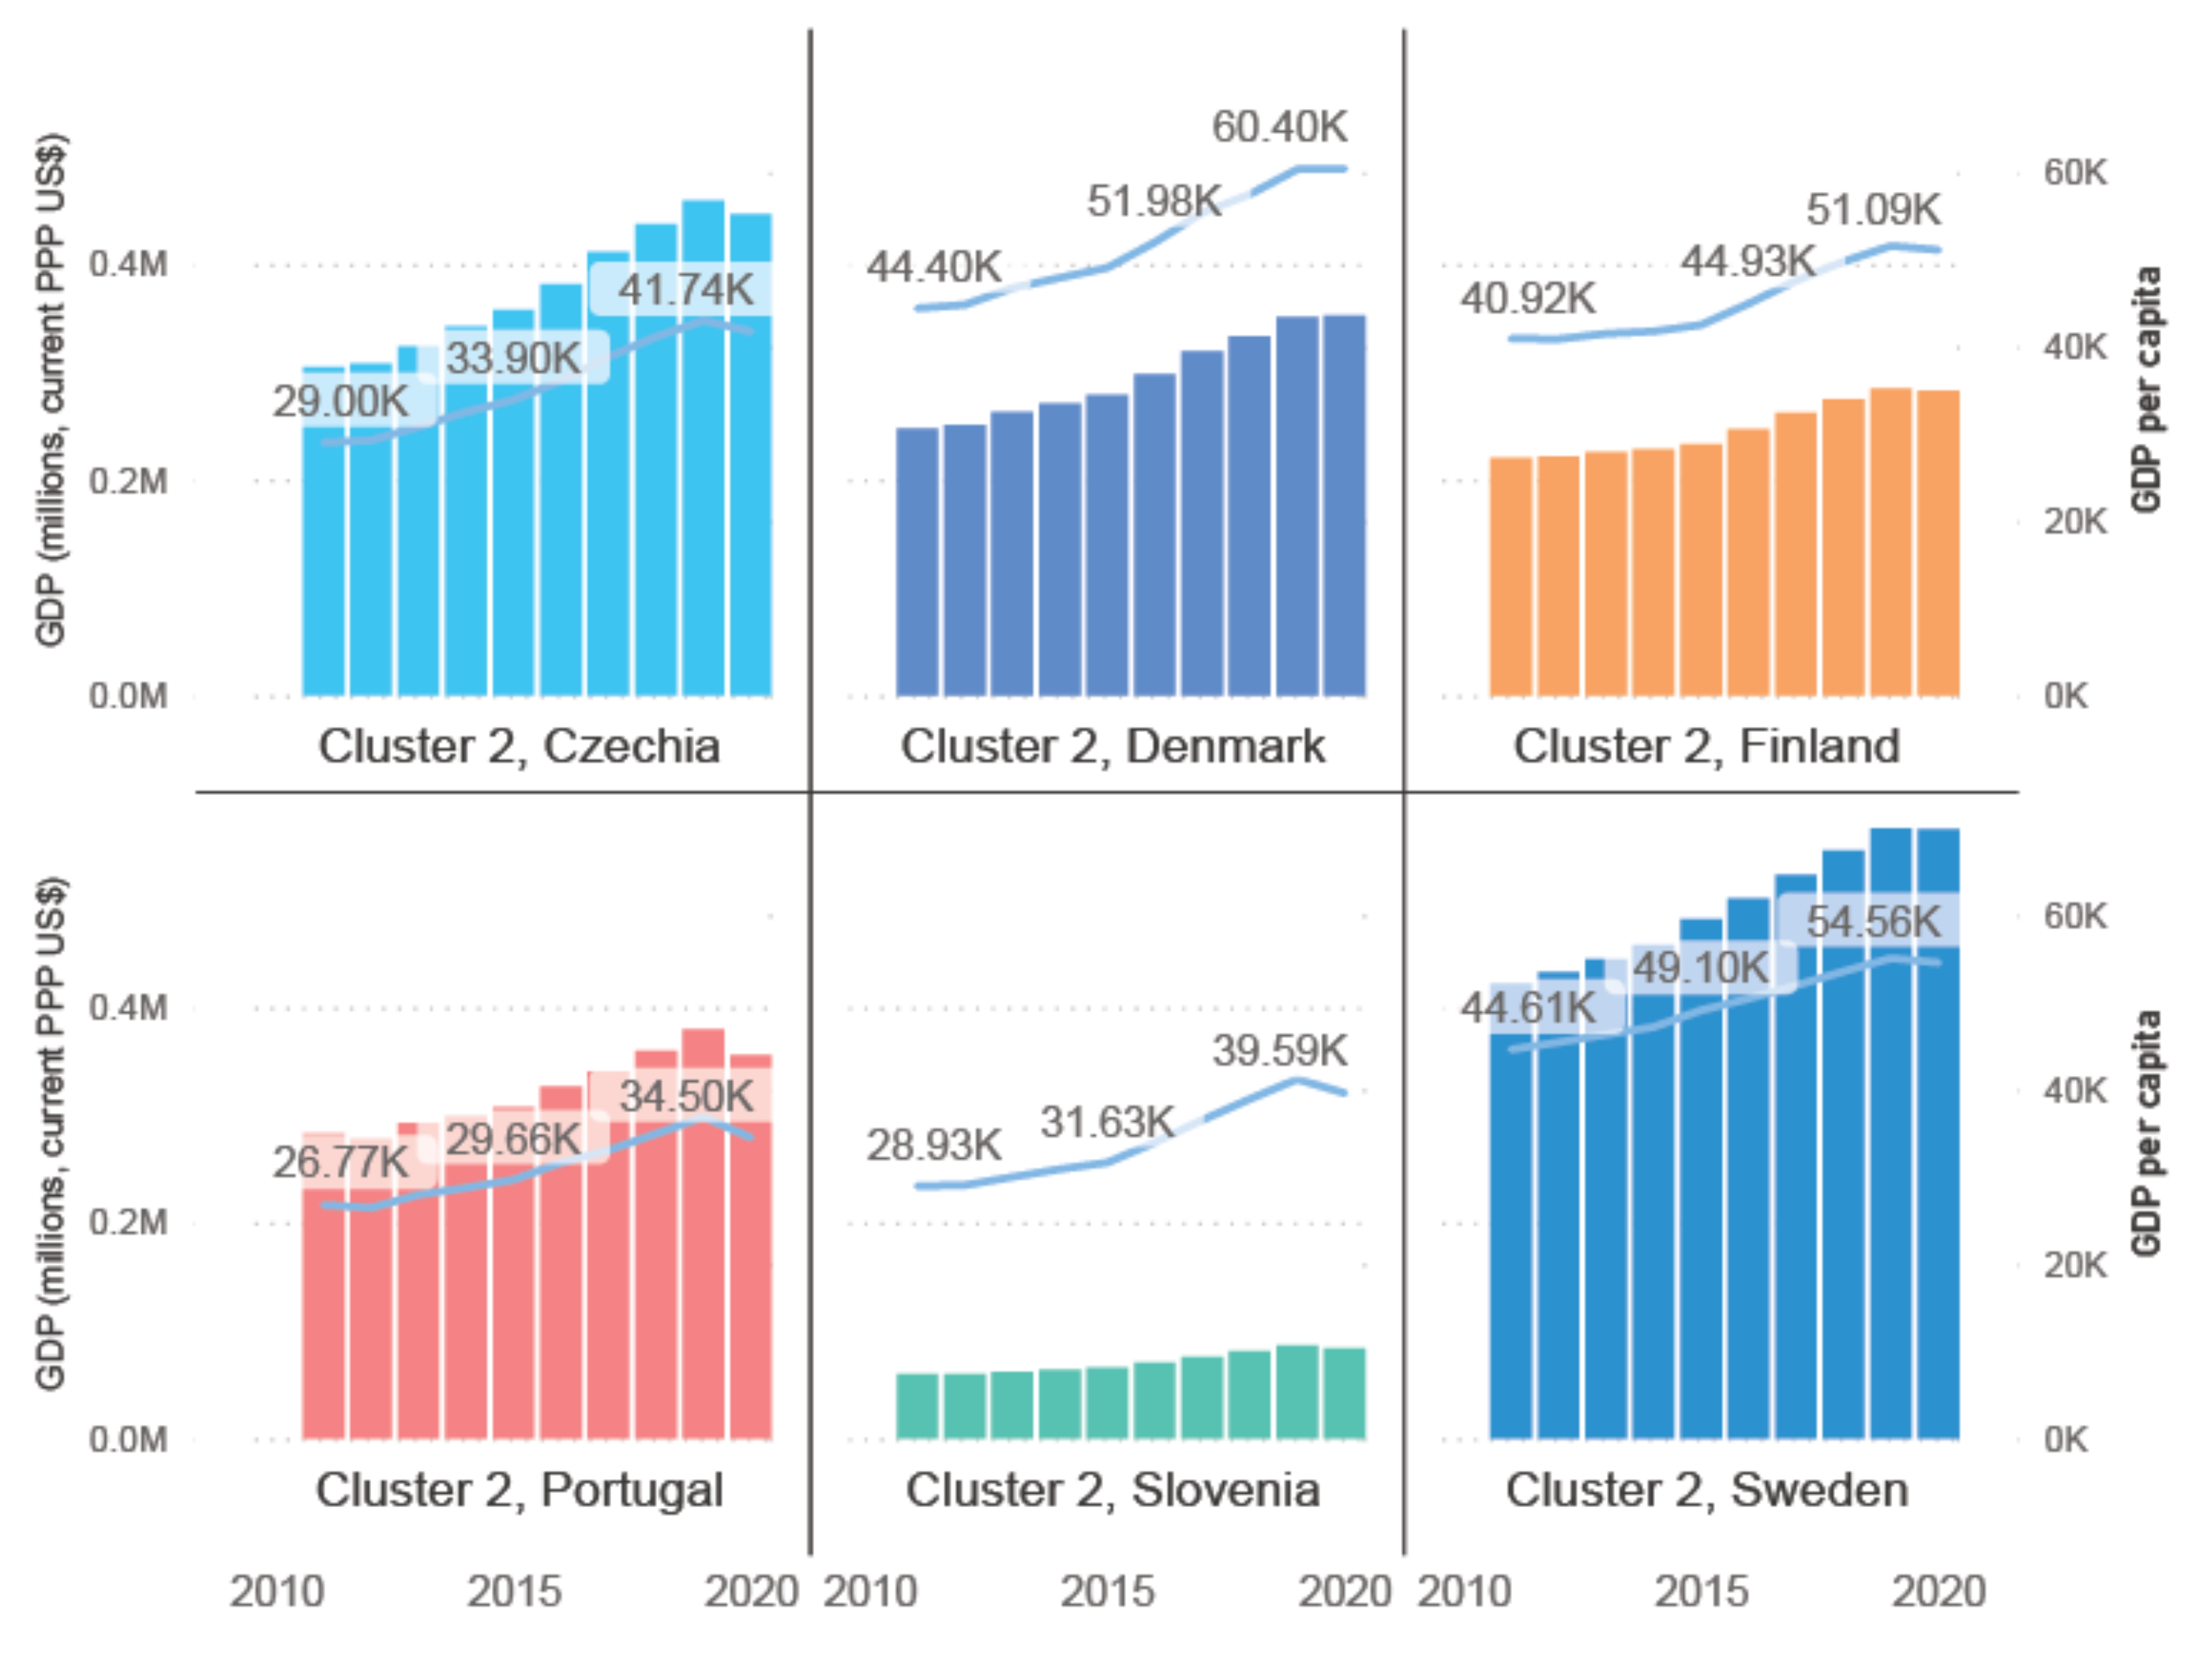
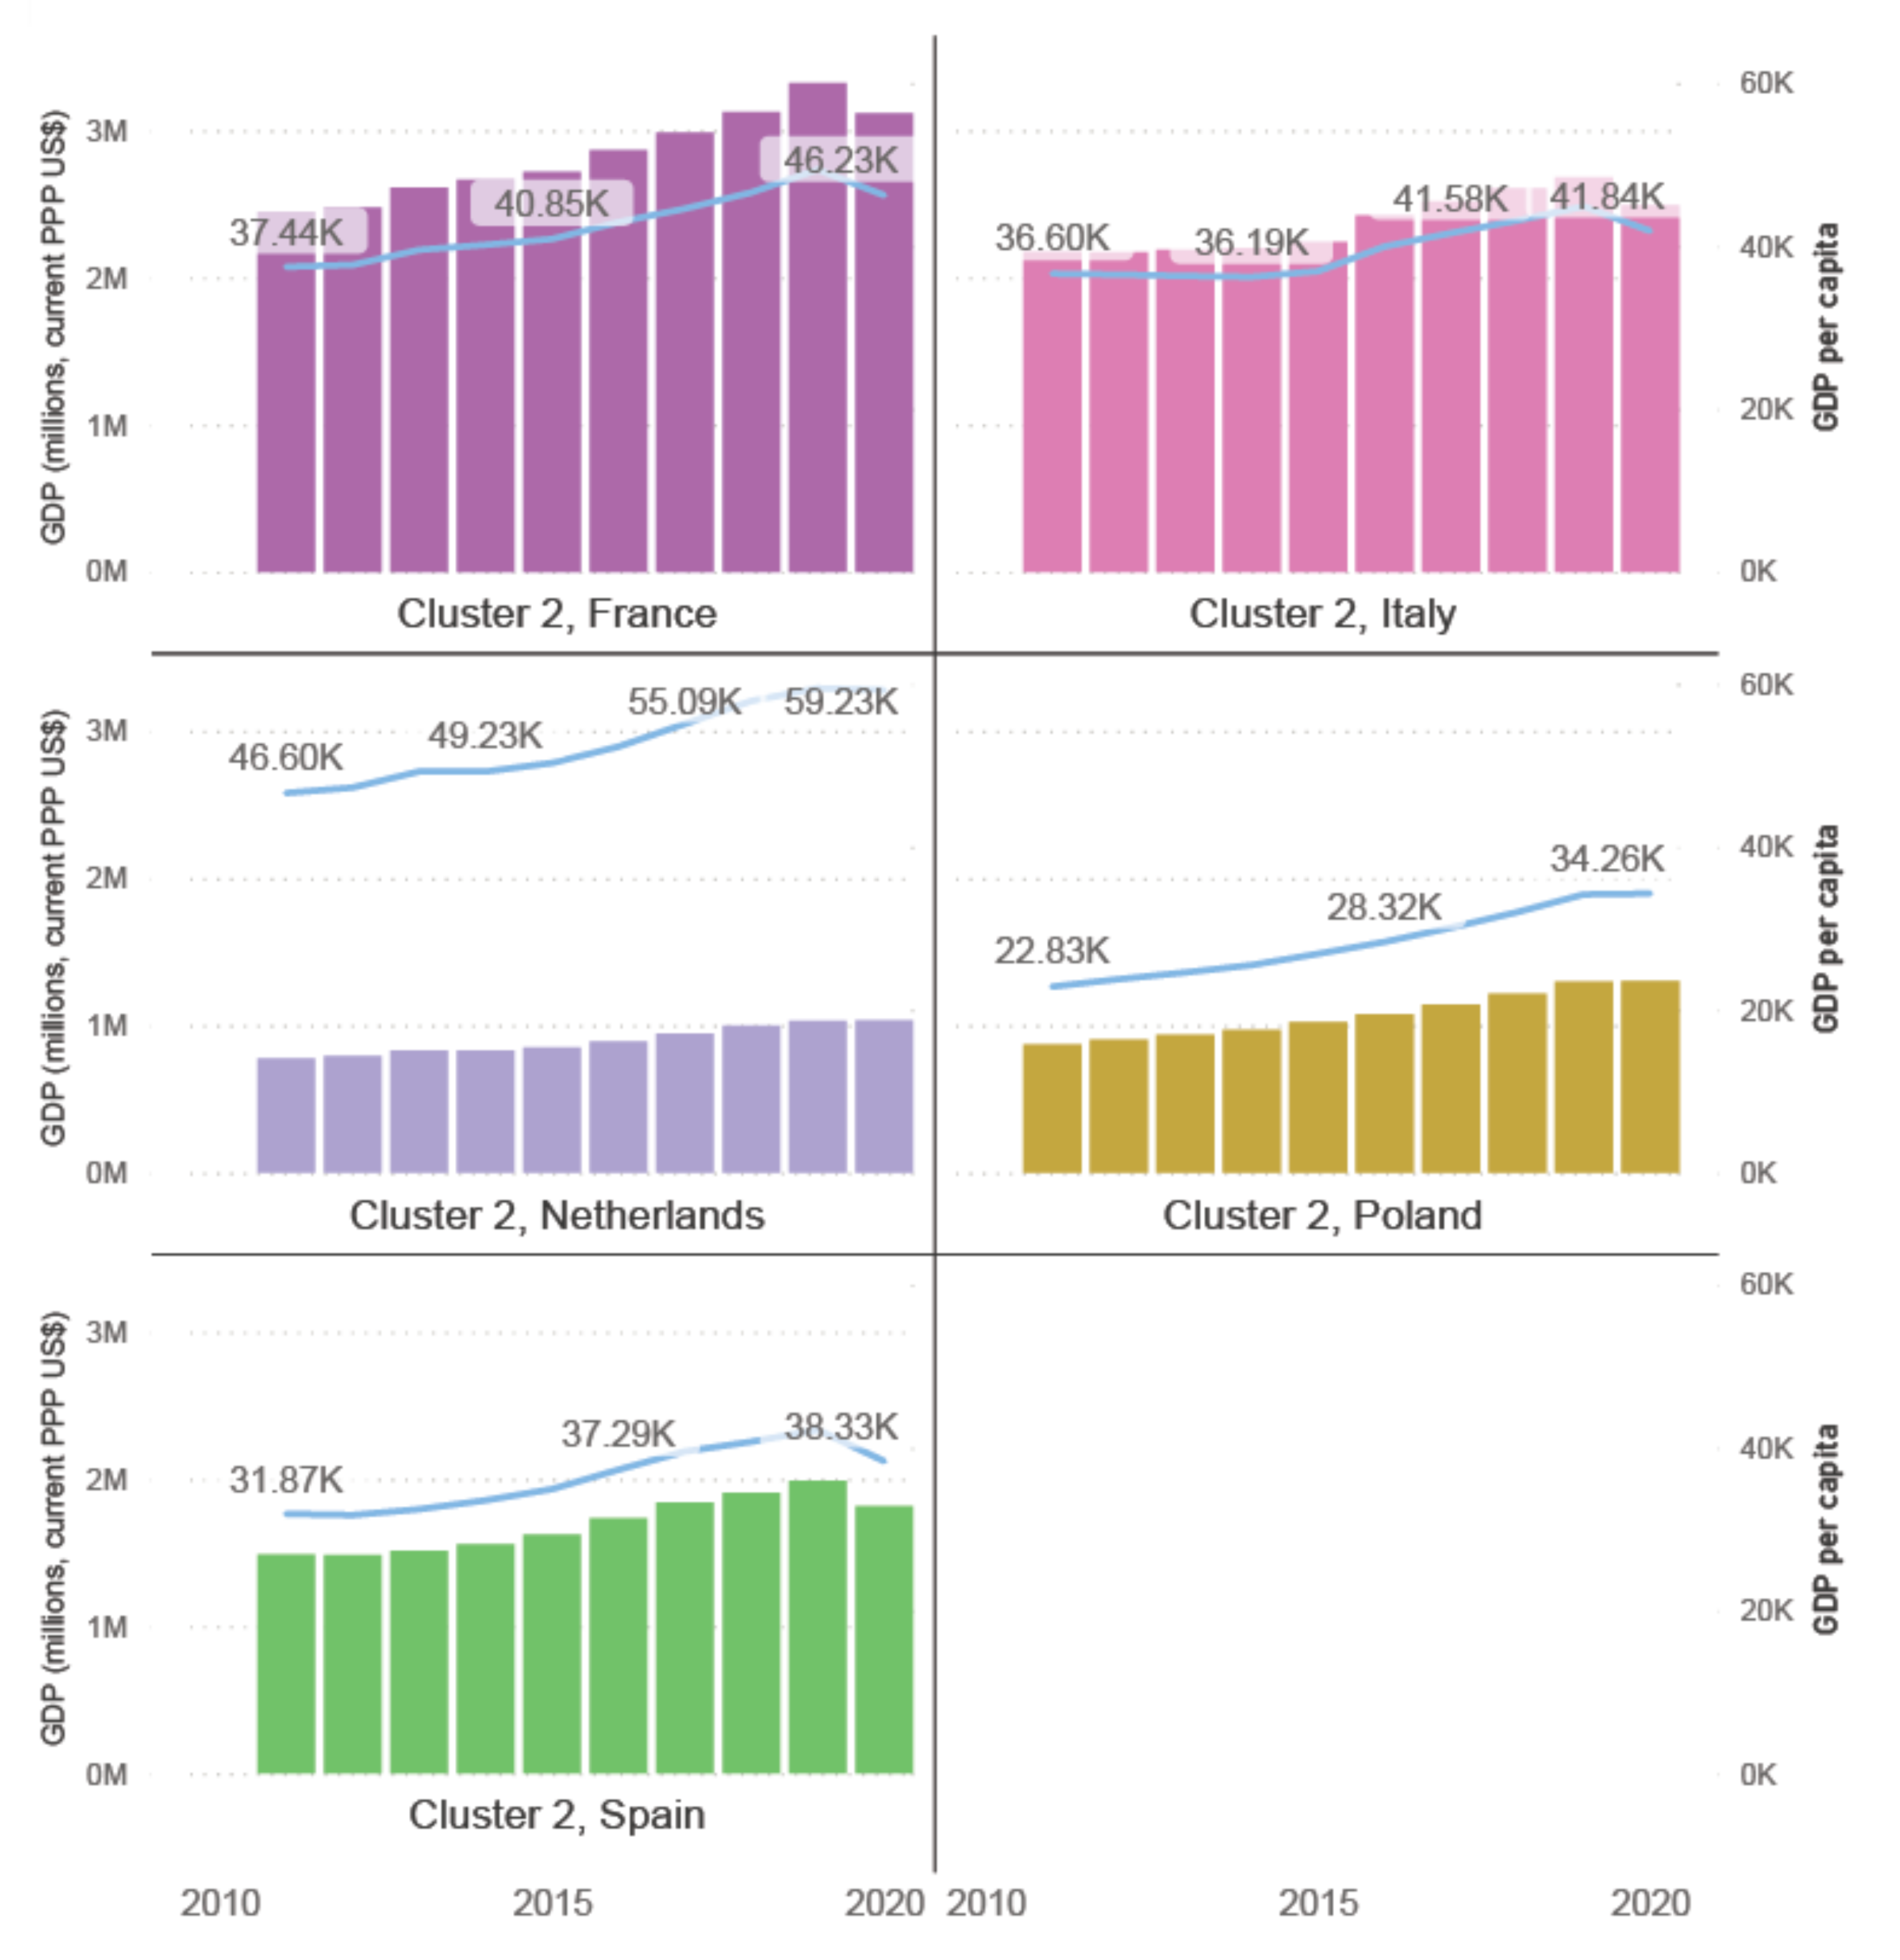
3.2. Clustering Analysis of Countries’ Distribution Based on the Share of Enterprises That Are Using Industrial Robots

According to Eurostat data, in 2020, 28% of the large enterprises from the European Union, with respect to the total business economy and excluding the financial sector, were using industrial or service robots for certain processes of their work, while 13% of medium enterprises implemented robotics in their activity. In the case of small enterprises, the percentage was lower, with a percentage of only 5% of total small enterprises from the EU using industrial or service robots (Eurostat’s classification for large to small enterprises is based on their hiring capabilities: large enterprises are considered those employing 250 persons or more; medium enterprises, those that employ between 50 to 249 employees; and small enterprises, those with 10 to 49 employees. This statistic is based on 2018 data).
The average percentage for all enterprises (all enterprises with more than 10 employees were considered, excluding the financial sector), regardless of their size, that were using, in 2020, service or industrial robots for all EU countries was 7%, while the most robotized enterprises were found in Denmark (13%) and Finland (10%), who both surpassed 2018’s most robotized country, Spain, whose enterprises reduced their usage of robots from 11% registered in 2018 to 9% in 2020. Although, while still among some of the least automated countries in the EU, both Hungary and Romania’s percentage of enterprises that use industrial or service robots in 2020 (4%) was one percentage point higher than those registered in 2018 (3%), and in countries such as Latvia, Estonia, Cyprus (all 3%), and Ireland (2%).
When it comes to the percentages of enterprises that use industrial robots, the 2020 data are slightly different, with 9% of enterprises using industrial robots in Denmark, 8% in Belgium, Slovenia, and Finland, 3% in Estonia, Latvia, Lithuania, Romania, Serbia, Bosnia and Herzegovina, and only 1% in Cyprus.
As revealed above, Romania falls behind most developed countries in the EU, with only 4% of its enterprises making use of service or industrial robots in 2020. This percentage is based on 1% of all enterprises that adopted service robots and the 3% of enterprises that financed the use of industrial robots. These numbers fall outside the most developed countries’ pattern of distribution, based on robot type; as the percentages of industrial robots used by enterprises from countries such as Denmark (9%), Belgium, Slovenia, and Finland (all 8%) are higher than the percentages calculated for the use of service robots for the same period and countries (Denmark—5%, Belgium—2%, Slovenia—1%, and Finland—3%).
Additionally, IFR reveals that in 2018, Romania had a robot density of only 18 robots for every 10,000 workers, falling again far behind the Central and Eastern European countries, and far behind the worldwide average robot density of 113 robots/10,000 workers.
Another concern noticed in the case of Romania’s robotics market is that small enterprises are quite reserved in implementing robotics, being “five times less likely to use robots than large firms” [34].
As shown in Figure 4, proving this point, a share of 13% of all large enterprises in Romania implemented service or industrial robots in 2020, while only 3% of small enterprises and 5% of medium enterprises invested in this direction. One possible explanation for such a low level of robotics use implementation percentages in the case of Romanian enterprises can be credited to the higher-than-average uncertainty about the future (81% in Romania versus 72% on EU average), which stands in the way of major investments, as highlighted by the European’s Commission Country Report in 2020 [37]. When compared to the general share of enterprises using industrial robots in other countries in the European Union, Romania falls behind, registering below average results, as shown in Figure 5.
From an industry point of view, the most robotized enterprises in 2020 were found in manufacturing-related industries. Romania follows this trend, having the highest registered share of enterprises using industrial robots out of the total enterprises using industrial robots for industries such as the manufacture of motor vehicles, trailers and semi-trailers, or other transport equipment (with 21% of all enterprises using industrial robots; 13% of enterprises in manufacturing of computer, electronic, and optical products using industrial robots; and 13% of enterprises in manufacturing of basic metals and fabricated metal products, excluding machines and equipment, using industrial robots).
As shown in Figure 6, for the year 2020, the least automated of Romania’s enterprises fell in categories such as accommodation, real estate, computer programming, consultancy and related activities, information service activities or travel agencies; tour operators, enterprises offering reservation services or related activities reported no use of industrial robots.
When looking at the average share of manufacturing-related enterprises using industrial robots out of the total enterprises that used industrial robots in selected EU countries (with countries with missing data being excluded) for the years 2018 and 2020, we can notice that Romania still fell behind the average share calculated for both years (of 17.39%, having an average share of manufacturing enterprises of only 8.42% for 2020), as represented in Figure 7 below. Even though for most countries 2020 showed an increase in the use of industrial robots in manufacturing-related enterprises compared to 2018, Romania registered a decrease of 0.04 percentage points, which may indicate a lack of capacity for enterprises to finance new investments in equipment and technology.
In order to better understand the impact that the share of enterprises using industrial robots had on the economy, we had furthermore performed a k-means clustering analysis and grouped the selected EU countries into several clusters, based on the share of enterprises using industrial robots in 2018 and 2020, assuming that each country could fit in one of the following two cluster categories:
  • Countries with a low-to-moderate use of industrial robots in enterprises.
  • Countries with intense use of industrial robots in enterprises.
In the cases of Ireland, Latvia, Luxembourg, Croatia, Belgium, and Greece, data regarding the share of enterprises using industrial robots for both years 2018 and 2020 were not available, and a time-series estimation could not be performed. Thus, we ignored these countries in our subsequent analysis and were left with 21 selected EU countries: Austria, Bulgaria, Cyprus, Czech Republic, Denmark, Estonia, Finland, France, Germany, Hungary, Italy, Lithuania, Malta, Netherlands, Poland, Portugal, Romania, Slovakia, Slovenia, Sweden, and Spain.
First, we initialized our model based on clearly defining the maximum number of clusters k = 5, for 500 iterations, a convergence of 0.00001 and 50 repetitions, starting from a random initial partition, and representing the within-class variance for each k, starting from 1.
The elbow plot presented above in Figure 8 indicates, based on Kaiser’s rule, that the best fitted number of clusters that reduces the total squared errors between groups is as low as two. Therefore, the classes resulting from the univariate clustering, solely based on the share of enterprises using industrial robots as registered for each country in the years 2018 and 2020, are represented below in Figure 9.
Our main assumption is that the share of enterprises using industrial robots influences the overall economic landscape and the enterprise employment in the selected countries’ economies. Thus, the clustering of the selected countries using these dimensions would look similar when compared to the previous analysis, and amongst countries with intense use of industrial robots in enterprises, we should observe a better enterprise performance and a higher economic growth rate.
To further analyze our hypothesis, we looked at the annual enterprise statistics for special aggregates of activities [38]; excepting financial and insurance activities, the previously considered share of enterprises using industrial robots for all enterprises, and countries GDP per capita values (PPP, current US$) registered in 2018 are represented above in Table 1. Our hypothesis is stated below:
Hypothesis (H0).
Economic prosperity and a higher perceptual standard of living are more common in countries with intense use of industrial robots in enterprises.
Table 1. Annual enterprise statistics for special aggregates of activities NACE Rev.2. bn_s95_x_k. Source: Author’s contribution based on data retrieved from Eurostat. Annual enterprise statistics for special aggregates of activities. https://appsso.eurostat.ec.europa.eu/nui/show.do?dataset=sbs_na_sca_r2&lang=en, accessed on 9 January 2022.
CountryClassYearUse of Industrial RobotsGDP per
Capita
Employees-NumberGrowth Rate of EmploymentWages and SalariesApparent Labor ProductivityGross Value Added per EmployeeTurnover or Gross Premium Written
Austria120184.0%57,050.352,606,7572.796,271.368.977.3737,701
Bulgaria120183.0%22,911.301,755,3080.912,626.414.516.7141,152
Cyprus120181.0%40,476.39255,9308.44623.635.337.233,708
Germany120183.0%54,954.8528,392,6204.5966,659.359.765.46,830,401
Hungary120183.0%31,831.982,430,6514.329,833.825.229.4324,310
Estonia120183.0%36,326.80406,08215860.63133.464,982
Lithuania120182.0%36,346.40888,6911.89010.121.323.691,926
Malta120183.0%44,482.24133,8116.52709.24249.624,471
Slovakia120184.0%31,505.061,265,8372.816,547.924.331.7212,337
Romania120182.0%29,248.813,944,656138,575.218.418.9313,933
Czechia220186.0%41,134.092,917,9241.543,711.229.738.5541,087
Denmark220187.0%57,462.781,706,1383.482,813.092.898.4545,569
Finland220188.0%49,755.141,406,3851.952,513.668.974.3402,031
France220186.0%46,569.0214,610,1080.5528,720.863.768.93,830,389
Italy220186.0%43,123.6110,979,7551.5295,949.649.868.53,033,061
Netherlands220187.0%57,901.105,194,7583.6168,480.064.874.91,644,839
Poland220185.0%31,978.538,035,3916.499,261.425.230.81,124,830
Portugal220186.0%34,931.782,804,3514.540,277.22631.8375,645
Slovenia220186.0%38,915.64560,8854.212,147.836.843102,384
Spain220188.0%40,720.1910,438,3233.9252,581.742.250.82,055,805
Sweden220186.0%53,553.312,820,0652.4106,466.370.784.8842,503
First, we tested the fitness of our model using Bartlett’s sphericity test, to assess if there was equality of variance in our sample, and the Kaiser-Meyer-Olkin test, to measure our sampling adequacy based on each variable in the model. As shown in Figure 10 below, the KMO measure of sampling adequacy showed that our model’s fitness was significant, with a value of 0.613. Bartlett’s test of sphericity proved to also be significant, having a computed p-value lower than the significance level alpha = 0.05, and consequently rejecting the hypothesis that there is no correlation significantly different than 0 between these variables.
The correlation matrix presented below in Figure 11 shows us that generally there was a low-to-moderate correlation between the structural business variables included, the enterprises’ use of industrial robots, and GDP per capita.
Nevertheless, the model shows that the share of enterprises using industrial robots had moderate positive correlations with the GDP per capita, apparent labor productivity, and gross value added per employee, and a low positive correlation with enterprises’ wages and salaries, and gross premiums written. It is important to mention that these calculations are different from 0, with a significance level of alpha = 0.05, meaning they are significant at a 95% confidence level.
Furthermore, the principal component analysis revealed how these initially correlated variables may be reduced to fewer components in our model. The next table (Table 2) presents the eigenvalues of each dimension, which reflect the quality of the projection from the eight-dimensional initial table to a lower number of dimensions.
In our model, we can see that in the principal component model without rotation, the first factor’s eigenvalue equals 4.170 and represents 52.122% of the total variability, while the cumulative variance of the first three factors accounts for 91.752% of the total variability; with the second factor displayed being accountable for 26.174% of the variance and the third for 13.456%. Using Kaiser’s principle for choosing the main components of our model, which states that the most relevant factors are those that register eigenvalues >1 and considering Figure 12 below where we represented the scree plot of all eigenvalues of the factors, listed in decreasing order of value, we retained the factors above the inflexion point and considered the first three factors as principal components for our further analysis: use of industrial robots in enterprises, GDP per capita and employees number.
We can notice that the first two components are strongly determined by the share of enterprises using industrial robots and the third one by the employee number. Wages and salaries, apparent labor productivity, gross value added per employee, and turnover written show low and even negative weights with all the three components, while the growth rate of employment shows a slightly higher positive relationship with the second component.
Table 3 presents the factor matrix after Varimax rotation and represents an important outcome for our analysis, revealing that our initial eight-variable model could be reduced to three different variables describing the status of enterprise and economic health: one component provides the measure of robotization, while the other two are strongly correlated with economic results and employment. The result of this analysis suggests that our model has three independent variables (share of enterprises using industrial robots, GDP per capita, and employee number), and five dependent ones, which are the growth rate of employment, wages and salaries, apparent labor productivity, gross value added per employee, and turnover or gross premium written.
A biplot representation illustrating the variance of variables and selected countries grouping based on our model, using the main two factors’ axes F1 and F1, can be consulted in Figure 13.
Focusing only on the horizontal arrangement of the chart, which reveals the strongest pattern, we can observe that Germany, with quite a low use of industrial robots in enterprises (3%) for 2018, is leading in terms of enterprise employee number, wages and salaries, and turnover or gross premium written for enterprises in the total business economy, except financial and insurance activities. However, countries with intense use of industrial robots in enterprises agglomerate on the right-hand side of the chart, towards the positions of the three indicators: share of enterprises using industrial robots, apparent labor productivity, and gross value added per employee.
Additionally, we can observe that, on average, the enterprise’s use of industrial robots, gross value added per employee and apparent labor productivity have comparable response patterns. Countries with a low-to-moderate use of industrial robots in enterprises lie towards the left-hand side of the chart, being mainly driven by the growth rate of employment.
Additionally, the distance between each factor and the origin in the biplot illustrates that enterprises’ employee number, wages and salaries, or enterprises’ gross premium written distinguish these countries more than the growth rate of employment, use of industrial robots in enterprises, or GDP per capita. Ultimately, the insignificant angle between the places for gross value added per employee and apparent labor productivity demonstrates that these two factors have similar response patterns across the selected countries, as depicted in Figure 13.
The last part of our analysis focuses on the illustration of the main trends, based on a time-series analysis of GDP and GDP per capita between clusters. Although neither of these two indicators has the scope to reflect a state’s standard of living, GDP per capita is the closest simplification of it, as an alternative measure might take many other contributing factors into account; factors which should afterwards be weighted accordingly to their importance. As different individuals may derive well-being from identical resources, in unique ways and capacities [35], considering a compounded measure for standard of living might become inefficient within the scope of our paper.
For the analysis of existent GDP and GDP per capita dataset, we used PowerBI as a desktop data analysis tool and represented the data collected from the World Bank’s World Development Indicators database [36] for all 21 countries on a line and stacked column chart, where GDP (millions, current PPP US$) is represented as the principal column-value and GDP per capita is represented as a trend line for the selected period of 2010–2020.
When looking at countries from the first cluster, we can observe that although both GDP and GDP per capita have an ascending trend for the selected period, as we can see in Figure 14, Figure 15, Figure 16 and Figure 17; GDP per capita in 2020 has both its minimal and maximal values for countries in the first cluster (22,398.21 for Malta expressed in millions, current PPP USD, and 4,469,546.28 expressed in millions, current PPP USD for Germany).
However, when looking at the top five countries in terms of GDP results, besides Germany from cluster one, only France, Italy, Spain, and Poland (Figure 17) made the list (all falling into the second cluster); being countries with higher shares of enterprises using industrial robots.
As we previously mentioned, while GDP is not an accurate measure for quantifying the standards of living in a specific state, it reflects the total market value of the finished goods and services produced within a country’s borders in that specific period.
Undeniably, these results are relevant only if considering the total population of that country or state, and that is where data on GDP per capita plays an important role, as if we look at the average GDP per capita in 2020 for countries in cluster one, its value reaches 38,824.93 current PPP USD per capita, while for the countries in the second cluster, the average GDP per capita’s value is 45,615.74 current PPP USD, reflecting a difference of +14.88% for countries with the higher share of enterprises using industrial robots [37].
We consider this to be an important result, which might be used for further analysis of Romania’s perspective on the use of industrial robots in enterprises; especially as, despite its more-than-average results in terms of GDP for the studied period, we may observe that the GDP per capita is below the cluster’s average for 2020, being at only 38,458.19 current PPP USD while the average sat at 38,824.93 current PPP USD; if we consider the second cluster’s average, the difference is even more significant.
With a sustainable and efficient production framework being the basis for long-term economic development, we consider that, given the existence of a significant number of manufacturing plants in Romania, its economic landscape would benefit from the implementation of industrial robots, not only as a result of increasing labor productivity but also as a result of retraining employees to positions that require a higher degree of specialization and skills. One of the many arguments that might sustain Romania’s development for more-in-depth research and implementation of industrial robots in enterprises, lays in the already high availability of privately-held enterprises with manufacturing plants existing at the national level; in Table 4, being depicted only a small share of these together with their general industry.
An increase in the use of industrial robots [37] by these companies may also lead to an increase of their competitiveness in the manufacturing industry compared to existing giants in the market; giving small and medium-sized companies the opportunity to grow rapidly, even in the absence of financial resources to recruit the specialists for their open positions, while giving them the opportunity to record an increase in financial results, leading to new investments and expansion towards global markets.

4. Conclusions and Potential Limitations

4.1. Conclusions

Recent studies in the specialized literature have highlighted the main contributions of automation, AI, robotization, and modern technologies to economic results. Our paper focused on the role of industrial robots as an important factor in the complex transformations and changes occurring within local labor markets from a sample of EU countries. In particular, our collective estimations indicated a significant displacement effect, with the integration of robots into production processes contributing to the reduction of the employment rates in the case of all six EU countries included in our sample.
We found that young employees and those with “secondary” education (i.e., high school) are the first category particularly affected by the penetration of industrial robots. At a professional level, we found that the effect of automation and industrial robots on technicians is quite positive. We applied a comparative analysis of our main results of the impact of industrial robots on the aggregate employment rate to the evidence found for the labor market in the US [38].
This comparative analysis suggests that in European labor market policies, active policies should take into consideration the impact of industrial robots, in order to decrease the unemployment rate. In order to highlight the different impacts of robots in the US and the EU, we also applied a comparative study of welfare systems and the labor market, illustrating the main conditions and regulations that could be appropriate for designing policies in order to minimize the potential effects of displacement and to correspondingly contribute to strengthening the associated positive effects the increase of labor productivity due to robotization may have on the economy.
An increase in information and communication technology (IC&T) capital has a positive impact on the employment rate, suggesting that different automation technologies may have a different impact on labor markets.
We found mixed results only for the impact of industrial robots on wage growth, even after analyzing the potential for endogeneity and the potential compensatory effects between different populations or sectorial groups. These estimations provide suggestive evidence of the potential negative effects automation might have on wages.
As the number of industrial robots continues to grow, the results suggest some policies and concrete actions, designed to facilitate the adaptation and flexibility of the workforce, that might be needed due to augmented work and the increase of digitalization and automation. In any case, the extent to which automation-induced movement progresses crucially depends on the new trends in socio-economic growth and development, which means an increase in the demand for all factors of production (including labor).
Active social and economic policies are needed, in order to reduce the potential costs of disruption. For example, important active policies based on effective and efficient investments must be made to improve labor mobility. Higher mobility and different types of jobs highlight the importance of a different set of core competencies and skills, indicating the need for active education policies to better manage education systems, by stimulating effective and efficient investments in education and training.
Fairly insignificant aggregate effects (on wages) were found as a potential result of counterbalancing developments taking place at the firm level. One possibility is that the overall impact of automation and integration of industrial robots is considered to depend on the investments in human and intellectual capital (applied simultaneously on an individual level, firm-level, and local, regional, and macro levels). The long-run effects of an investment in human and intellectual capital are expected to be amplified by national and regional active policies.
The development of the robotics industry is also a requirement for less developing countries.Lower the robotic industry is, lower is also the conomy of the country.
The technological challenges and transformations generated by robots are a factor with a strong impact, especially because of the COVID-19 pandemic crisis, on the emergence and development of new value chains of supply and demand internationally, as well as the readjustment and reshaping of pre-existing value chains, and intensification of globalization processes.
This is in line with the objective of diversifying the processes for manufacturing of goods and services, which might lead to a higher contribution from nation-states in the monitoring, surveillance, and identification of a second-best in the international division of work compatible with the requirements to support long-term smart, sustainable, and inclusive development.
Robots are considered an important factor that determines the increasing role of collaborative and sharing economies, by stimulating diverse forms of partnerships (public–private, private–private, and public–public), highly contributing to multidimensional development in terms of socio-economic, technological, environmental, and geopolitical factors. This might lead to an increase in the role and responsibilities of nations/states in establishing and monitoring specific standards and mechanisms to support the overall efficiency and effectiveness, which also requires a multi-participant strategy game known as win–win; unlike the win–loss formula, in which the gain for one participant represents a loss for the rest of the participants.
The integration of robots is expected to lead to major changes in the evolution of the relationship between the work undertaken for routine activities and the availability of places for creative activities (called creative and innovative communities).
Robotization is also considered an important factor that contributes to the increase in the accuracy of short-, medium- and long-term forecasts and predictions, the applicability of the implementation of strategies developed for different areas and macro/world economic strategies. It also contributes to more efficient and effective use of diverse methods to support resilience and the prevention of risks, challenges, and vulnerabilities that humanity, at different levels of economic and social aggregation is currently facing, with expected amplified effects in the future.
Robotization is an emergent industry that is evolving at a higher pace mostly in the very developed countries, a phenomenon that contributes to an increase and amplification of the gaps in socio-economic development. Thus, many countries are trying hard at all levels (micro-, mezzo-, and macro-economic) to reach a certain level of technologization through robots. These kinds of strategies may act as a continuous pressure; thus, being less effective, so that gaps within industries are dislocated and appear due to high-tech factors (marginal benefits external) at micro and macro-societal level, at different time horizons. These positive externalities may include a wide range of marginal external benefits for the various economic agents, for which they do not pay. For example, the free use of scientific research results, the use of incentives in enterprises in the form of bonuses, participation in equity by holding shares, employee retraining courses, and training in the LLL (Lifelong Learning) system for adults, as well as series of favorable propagation effects, such as the reduction of pollution, ecological reconstruction, and the increase of welfare.
Such a paradigm of contemporary development has led to an increase in the importance of the second pillar of sustainable development (the social pillar), which involves inclusion, solidarity, social cohesion, and sustainable development “for all”. Robots are considered to have great potential in meeting the requirements of the social pillar, including the use of economic-monetary and fiscal policies to redistribute income, differentiated according to the level of economic and social development of the countries.

4.2. Limitations of the Study

Our paper focused on highlighting the potential benefits of deploying industrial robots in Romanian organizations, by interpreting the dynamics of selected countries’ enterprise statistics in relation to the share of enterprises using industrial robots. While the relevant literature regarding the long-term and short-term effects of automation on employment was consulted, the study has some potential limitations within which the significance of our findings must be carefully interpreted.
First, as secondary data were used to portray the growing interest and potential advantages of human labor augmentation through the deployment of industrial robots, we must not generalize that the benefits of this technologization would outweigh the costs for all enterprises and all nations. Each economic system and the enterprises operating within it present many uncorrelated facets, which could greatly impact the workforce’s response in the face of robotization.
Second, while extensive literature exists on the results of industrial robots in private organizations in EU and non-EU countries, in the case of Romania’s enterprises, there is limited evidence on the effects of a large-scale implementation within businesses. We must also point out that the robotics investment could mean for many businesses an increase in the average cost per employee, which small and medium-sized enterprises might not be able to account for without a proper policy advisory for accessing non-reimbursable funds or a complete workforce restructuring.
Last, supplementary studies should be conducted with respect to Romania’s labor force perceptions of the implementation of robotics, while considering the vast spectrum of workforce characteristics, the latest demographic trends, and both formal and informal educational systems’ capacity for providing fair access to lifelong learning and development for all. Furthermore, these should be correlated with industry or organizational readiness to accelerate the adoption of robotics.

Author Contributions

Conceptualization, M.-C.S., A.-V.R. and A.C.; Data curation, C.-R.J.; Formal analysis, M.-C.S., V.-L.P. and C.-R.J.; Investigation, V.-L.P., C.-R.J., A.-V.R. and A.-C.R.; Methodology, I.S., G.Z., M.-C.S., V.-L.P., C.-R.J., A.-V.R., A.C. and A.-C.R.; Supervision, G.Z., M.-C.S. and V.-L.P.; Validation, G.Z.; Writing—review & editing, G.Z. All authors have read and agreed to the published version of the manuscript.

Funding

This research was funded by the Academy of Romanian Scientists.

Institutional Review Board Statement

Not applicable.

Informed Consent Statement

Not applicable.

Acknowledgments

We thank Gheorghe Zaman, correspondent member of the Romanian Academy for reviewing the article and completing it with such dedication for the scientific research, and for his support for young researchers. We hope he is guiding us now from Heaven and will keep guiding us with the rigor that he taught to us during the collaboration. This article is submitted in the memory of our distinguish and appreciated Director of the Institute of National Economy, our mentor who taught us everything we know, with elegance and rigor but also with the passion for reassearch.

Conflicts of Interest

The authors declare no conflict of interest.

References

  1. Phelps, E.S. The Robot Question. Proj. Synd. 2020. Available online: https://www.project-syndicate.org/commentary/economics-of-ai-robot-labor-by-edmund-s-phelps-2020-08?referral=d461cf&barrier=accesspaylog (accessed on 10 February 2022).
  2. OECD. Coronavirus (COVID-19): SME Policy Responses. In Policy Responses to Coronavirus; OECD: Paris, France, 2020; Available online: https://read.oecd-ilibrary.org/view/?ref=119_119680-di6h3qgi4x&title=Covid-19_SME_Policy_Responses (accessed on 21 February 2022). [CrossRef]
  3. Shen, Y.; Guo, D.; Long, F.; Mateos, L.A.; Ding, H.; Xiu, Z.; Hellman, R.B.; King, A.; Chen, S.; Zhang, C.; et al. Robots under COVID-19 Pandemic: A Comprehensive Survey. IEEE Access 2020, 9, 1590–1615. [Google Scholar] [CrossRef] [PubMed]
  4. Acemoglu, D.; Pascual, R. Artificial Intelligence, Automation, and Work. In The Economics of Artificial Intelligence: An Agenda; Ajay, A., Joshua, G., Avi, G., Eds.; University of Chicago Press: Chicago, IL, USA; National Bureau of Economic Research, Inc.: Middlesex County, MA, USA, 2019; pp. 197–236. Available online: http://www.nber.org/chapters/c14027 (accessed on 15 March 2022).
  5. Akpan, I.J.; Udoh, E.A.P.; Adebisi, B. Small business awareness and adoption of state-of-the-art technologies in emerging and developing markets, and lessons from the COVID-19 pandemic. J. Small Bus. Entrep. 2020, 34, 123–140. [Google Scholar] [CrossRef]
  6. Barbierato, E.; Zamponi, M.E. Shifting Perspectives on AI Evaluation: The Increasing Role of Ethics in Cooperation. AI 2022, 3, 331–352. [Google Scholar] [CrossRef]
  7. Al Suwaidi, F.; Alshurideh, M.; Al Kurdi, B.; Salloum, S.A. The Impact of Innovation Management in SMEs Performance: A Systematic Review. In Proceedings of the International Conference on Advanced Intelligent Systems and Informatics Systems Frontiers 2020 (AISI 2020), Cairo, Egypt, 19–21 October 2020; Advances in Intelligent Systems and, Computing. Hassanien, A.E., Slowik, A., Snášel, V., El-Deeb, H., Tolba, F.M., Eds.; Springer: Cham, Switzerland, 2020; Volume 1261, pp. 720–730. [Google Scholar] [CrossRef]
  8. Yoo, W.-J.; Choo, H.H.; Lee, S.J. A Study on the Sustainable Growth of SMEs: The Mediating Role of Organizational Metacognition. Sustainability 2018, 10, 2829. [Google Scholar] [CrossRef] [Green Version]
  9. Rhodes, J.; Cheng, V.; Sadeghinejad, Z.; Lok, P. The relationship between management team (TMT) metacognition, entrepreneurial orientations and small and medium enterprises (SMEs) firm performance. Int. J. Manag. Pract. 2018, 11, 111–140. [Google Scholar] [CrossRef]
  10. Hawksworth, J.; Berriman, R.; Goel, S. Will Robots Really Steal Our Jobs? An International Analysis of the Potential Long-Term Impact of Automation; Price Waterhouse Coopers: London, UK, 2018; Available online: https://www.pwc.com/hu/hu/kiadvanyok/assets/pdf/impact_of_automation_on_jobs.pdf (accessed on 19 February 2022).
  11. Schwab, K. The Fourth Industrial Revolution; World Economic Forum: Geneva, Switzerland, 2016; ISBN 1944835008. [Google Scholar]
  12. Deane, P.M. The First Industrial Revolution; Cambridge University Press: Cambridge, UK, 1965; pp. 238–254. ISBN 0521048028. [Google Scholar]
  13. Wahlster, W. Director and CEO of the German Research Center for Artificial Intelligence. In Proceedings of the Hannover Messe, Industry 4.0, Hannover Fair, Hannover, Germany, 4–8 April 2011. [Google Scholar]
  14. Somayya, M.; Rajesh, M.H.; Durgesh, K.J. The Future Digital Work Force: Robotic Process Automation (RPA). J. Inf. Syst. Technol. Manag. 2019, 16, e201916001. Available online: https://www.scielo.br/pdf/jistm/v16/1807-1775-jistm-16-e201916001.pdf (accessed on 19 February 2022).
  15. Tom, M.M.; Hill, M. Machine Learning Definition, 1st ed.; McGraw-Hill: New York, NY, USA, 1997; Available online: http://www.cs.cmu.edu/afs/cs.cmu.edu/user/mitchell/ftp/mlbook.html (accessed on 19 February 2022).
  16. European Commission. European Enterprise Survey on the Use of Technologies Based on Artificial Intelligence; Final Report; Ipsos Belgium and International Centre for Innovation Technology and Education, Solvay Brussels School of Economics, Management, Eds.; Publications Office of the European Union: Luxembourg, 2020; ISBN1 978-92-76-20108-3. Available online: https://ec.europa.eu/digital-single-market/en/news/european-enterprise-survey-use-technologies-based-artificial-intelligence& (accessed on 10 January 2022)ISBN2 978-92-76-20108-3.
  17. Gerlind, W.; Biacabe, B.T.; Bormann, U.; Muntz, A.; Niehaus, G.; Soler, G.J.; Brauchitsch, B.V. Artificial Intelligence and Robotics and Their Impact on the Workplace. IBA Glob. Employ. Inst. 2017, 11, 49–57. Available online: https://www.ibanet.org/Article/NewDetail.aspx?ArticleUid=012a3473-007f-4519-827c-7da56d7e3509 (accessed on 14 March 2022).
  18. Ben-Ari, M.; Mondada, F. Robots and Their Applications. In Elements of Robotics; Springer: Cham, Switzerland, 2018. [Google Scholar] [CrossRef]
  19. Tractica Research. Robotics Market Forecasts; Informa Tech.: London, UK, 2019; Available online: https://omdia.tech.informa.com/OM000845/Robotics-Market-Forecasts (accessed on 10 January 2022).
  20. Robot Race: The World´s Top 10 Automated Countries; International Federation of Robots: Frankfurt, Germany. 2020. Available online: https://ifr.org/ifr-press-releases/news/robot-race-the-worlds-top-10-automated-countries (accessed on 12 January 2022).
  21. International Federation of Robots. Positioning Paper: The Impact of Robots on Productivity, Employment and Jobs; International Federation of Robots: Frankfurt, Germany, 2018; Available online: https://ifr.org/img/office/IFR_The_Impact_of_Robots_on_Employment.pdf (accessed on 12 January 2022).
  22. Thacher, T.D.; Pludowski, P.; Shaw, N.J.; Mughal, M.Z.; Munns, C.F.; Högler, W. Nutritional rickets in immigrant and refugee children. Public Health Rev. 2016, 37, 3. [Google Scholar] [CrossRef] [PubMed] [Green Version]
  23. Georgieff, A.; Milanez, A. Correlation between average percentage change in employment by country and percentage change in the use of industrial robots during the period 2012–2019. In What Happened to Jobs at High Risk of Automation; OECD Publishing: Paris, France, 2021. [Google Scholar]
  24. Graetz, G.; Michaels, G. Robots at Work. Rev. Econ. Stat. 2018, 100, 753–768. [Google Scholar] [CrossRef] [Green Version]
  25. Mazachek, K. Robots and the Economy. The Role of Automation in Driving Productivity Growth; Ascendant Program Services LLC for Select USA , Ed.; Department of Commerce: Washington, DC, USA, 2020. Available online: https://www.selectusa.gov/servlet/servlet.FileDownload?file=015t0000000kyXN (accessed on 9 January 2022).
  26. Timmer, M.; van Moergastel, T.; Stuivenwold, E.; Ypma, G. EUKLEMS Report—European Union Capital, Labor, Energy, Materials and Services Database. Available online: http://www.euklems.net/data/euklems_growth_and_productivity_accounts_part_i_methodology.pdf (accessed on 12 February 2022).
  27. Deepan, P.; Simon, P. IDC FutureScape: Worldwide Future of Work 2021 Predictions—Asia/Pacific (Excluding Japan) Implications, IDC Future Scape Reports. 2020. Available online: https://www.idc.com/getdoc.jsp?containerId=AP45873020 (accessed on 10 January 2022).
  28. International Federation of Robots.Executive Summary World Robotics 2021-Service Robots, World Robotics R&D Programs. 2021. Available online: https://ifr.org/img/worldrobotics/Executive_Summary_WR_Service_Robots_2021.pdf (accessed on 12 January 2022).
  29. Zhao, X.; Wu, C.; Liu, D. Comparative Analysis of the Life-Cycle Cost of Robot Substitution: A Case of Automobile Welding Production in China. Symmetry 2021, 13, 226. [Google Scholar] [CrossRef]
  30. Belanche, D.; Casaló, L.V.; Flavián, C. Frontline robots in tourism and hospitality: Service enhancement or cost reduction? Electron. Mark. 2020, 31, 477–492. [Google Scholar] [CrossRef]
  31. Chui, M.; Manyika, J.; Miremadi, M. Where Machines Could Replace Humans—And Where They Can’t (Yet); Mckinsey: Chicago, IL, USA, 2016; Available online: https://www.mckinsey.com/business-functions/digital-mckinsey/our-insights/where-machines-could-replace-humans-and-where-they-cant-yet (accessed on 20 January 2022).
  32. Wirtz, J.; Zeithaml, V. Cost-effective service excellence. J. Acad. Mark. Sci. 2017, 46, 59–80. [Google Scholar] [CrossRef] [Green Version]
  33. Xiao, L.; Kumar, V. Robotics for Customer Service: A Useful Complement or an Ultimate Substitute? J. Serv. Res. 2019, 24, 9–29. [Google Scholar] [CrossRef]
  34. Eurostat. Products Eurostat News. 25% of Large Enterprises in the EU Use Robots. Available online: https://ec.europa.eu/info/sites/info/files/file_import/2019-european-semester-country-reportromania_en.pdf (accessed on 20 January 2022).
  35. Eurostat. Annual Enterprise Statistics for Special Aggregates of Activities. Available online: https://appsso.eurostat.ec.europa.eu/nui/show.do?dataset=sbs_na_sca_r2&lang=en (accessed on 9 January 2022).
  36. International Comparison Program. World Bank, World Development Indicators Database. World Bank, Eurostat-OECD PPP Programme. Available online: https://data.worldbank.org/indicator/NY.GDP.PCAP.PP.CD (accessed on 10 March 2022).
  37. Stiglitz, E.; Joseph, A.S.; Jean-Paul, F. Mismeasuring Our Lives: Why GDP Doesn’t Add Up: The Report; ReadHowYouWant: New York, NY, USA, 2010. [Google Scholar]
  38. Statista. Statista’s Most Important Companies in the Manufacturing Industry in Romania in 2019, by Revenue Report. Available online: https://www.statista.com/statistics/1115921/romania-companies-in-the-manufacturing-industry-by-revenue/; https://www.statista.com/study/64326/robotics/ (accessed on 19 March 2022).
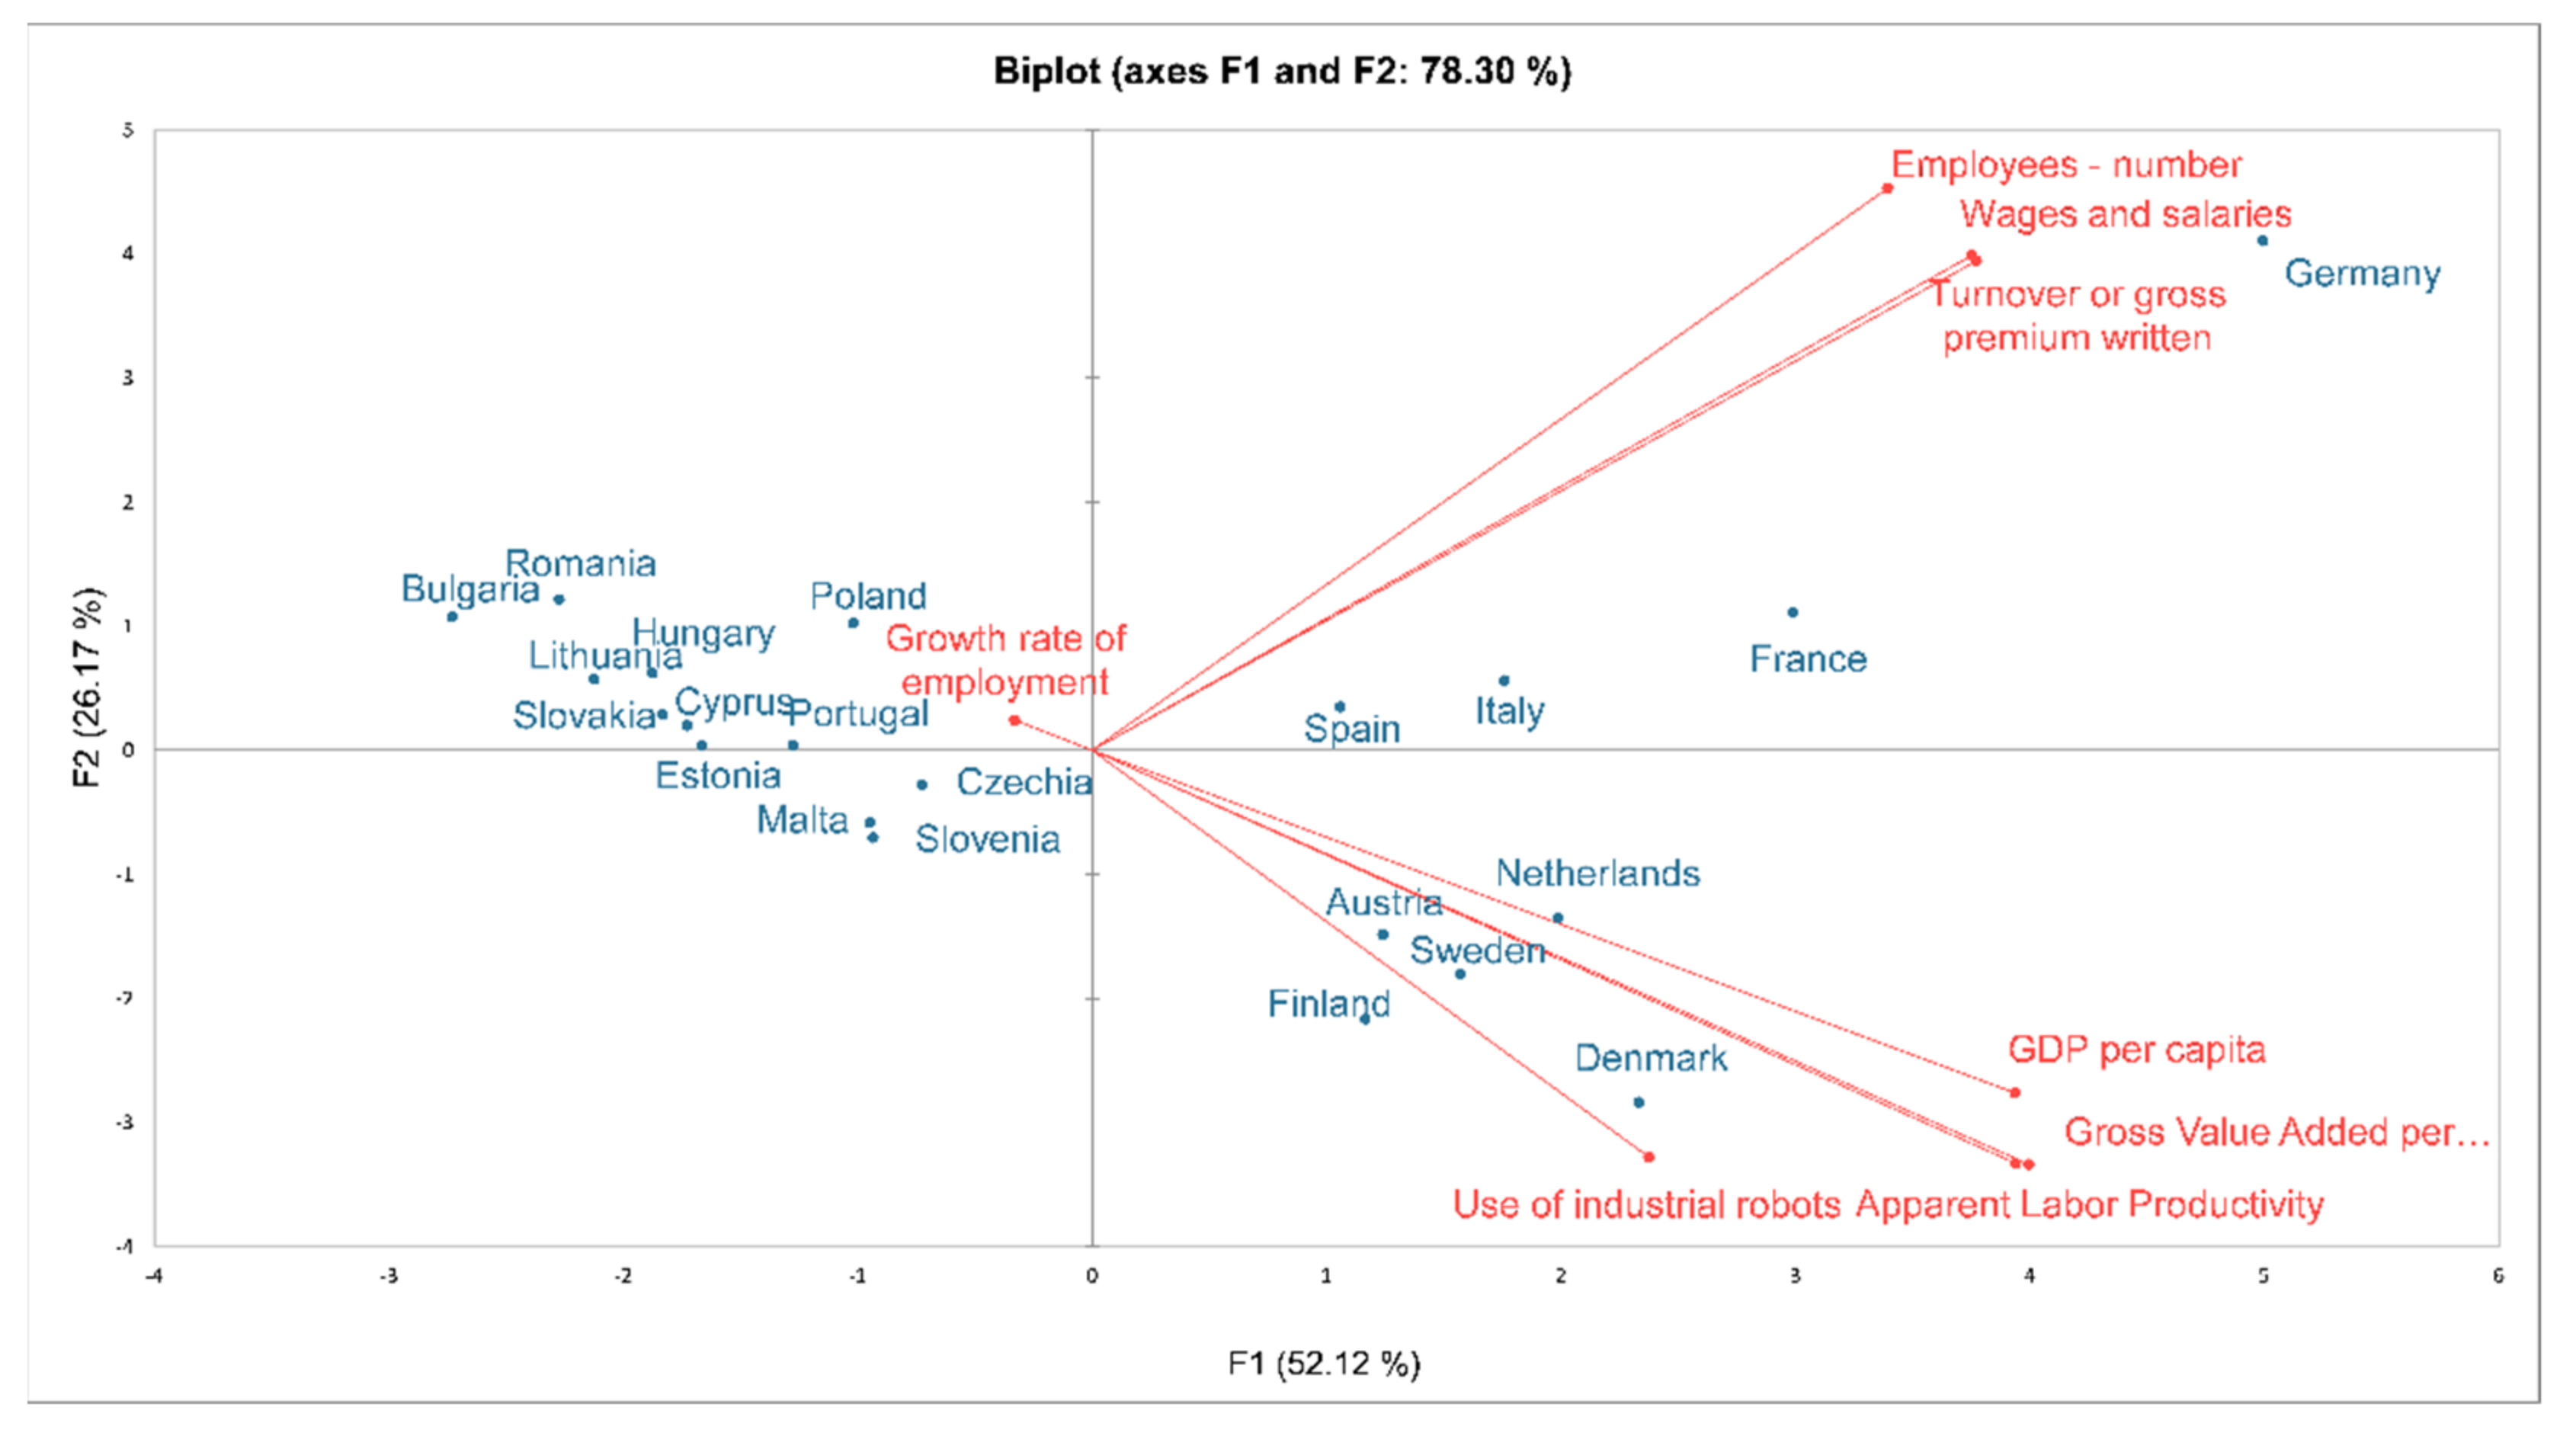
Figure 1. Worldwide manufacturing industry-related robot density in 2020. Source: Author’s contribution, based on International Federation of Robotics, https://ifr.org/news/robot-race-the-worlds-top-10-automated-countries/, accessed on 12 January 2022.
Applsci 12 06014 g001
Figure 2. Sales volume of industrial robots by continent. Source: Author’s contribution, based on Statista, https://www.statista.com/study/64326/robotics/, accessed on 19 March 2022.
Applsci 12 06014 g002
Figure 3. Correlation between average percentage change in employment by country and percentage change in the use of industrial robots during the period 2012–2019. Source: Georgieff, A. and A. Milanez (2021), “What happened to jobs at high risk of automation?” OECD Social, Employment and Migration Working Papers, No. 255, OECD Publishing, https://doi.org/10.1787/10bc97f4-en, accessed on 21 February 2022.
Applsci 12 06014 g003
Figure 4. Use of industrial or service robots in Romania, for each enterprise size, 2020. Source: Author’s Contribution. Data retrieved from Eurostat. Robotics and 3D Printing Data, https://ec.europa.eu/eurostat/databrowser/bookmark/f29db2df-2e19-4bfd-8bb4-af630dc3e907?lang=en, accessed on 9 January 2022.
Applsci 12 06014 g004
Figure 5. Share of enterprises using industrial robots in 2020, by country. Source: Author’s Contribution. Data retrieved from Eurostat. Robotics and 3D Printing Data, https://ec.europa.eu/eurostat/databrowser/bookmark/f29db2df-2e19-4bfd-8bb4-af630dc3e907?lang=en, accessed on 9 January 2022.
Applsci 12 06014 g005
Figure 6. Share of enterprises using industrial robots out of the total enterprises that used industrial robots in, 2020—Romania compared to EU27 averages. Source: Author’s Contribution. Data retrieved from Eurostat. Robotics and 3D Printing Data, https://ec.europa.eu/eurostat/databrowser/bookmark/f29db2df-2e19-4bfd-8bb4-af630dc3e907?lang=en, accessed on 15 March 2022.
Applsci 12 06014 g006
Figure 7. Average share of manufacturing enterprises using industrial robots out of all enterprises using industrial robots, by country, 2020 vs. 2018. Source: Author’s Contribution. Data retrieved from Eurostat. Robotics and 3D Printing Data, https://ec.europa.eu/eurostat/databrowser/bookmark/f29db2df-2e19-4bfd-8bb4-af630dc3e907?lang=en, accessed on 20 February 2022.
Applsci 12 06014 g007
Figure 8. Elbow plot based on the share of enterprises using industrial robots. Source: Author’s Contribution. Data retrieved from Eurostat. Robotics and 3D Printing Data, https://ec.europa.eu/eurostat/databrowser/bookmark/f29db2df-2e19-4bfd-8bb4-af630dc3e907?lang=en, accessed on 15 March 2022.
Applsci 12 06014 g008
Figure 9. Countries clustered by the share of enterprises using industrial robots (k = 2). Source: Author’s Contribution. Data retrieved from Eurostat. Robotics and 3D Printing Data, https://ec.europa.eu/eurostat/databrowser/bookmark/f29db2df-2e19-4bfd-8bb4-af630dc3e907?lang=en, accessed on 9 January 2022.
Applsci 12 06014 g009
Figure 10. KMO test and Bartlett’s sphericity test. Source: Author’s contribution based on data retrieved from Eurostat. Annual enterprise statistics for special aggregates of activities. https://appsso.eurostat.ec.europa.eu/nui/show.do?dataset=sbs_na_sca_r2&lang=en, accessed on 9 January 2022.
Applsci 12 06014 g010
Figure 11. Correlation matrix. Source: Author’s contribution based on data retrieved from Eurostat. Annual enterprise statistics for special aggregates of activities. https://appsso.eurostat.ec.europa.eu/nui/show.do?dataset=sbs_na_sca_r2&lang=en, accessed on 9 January 2022.
Applsci 12 06014 g011
Figure 12. Screen plot of the eigenvalues after principal component analysis. Source: Author’s contribution based on data retrieved from Eurostat. Annual enterprise statistics for special aggregates of activities. https://appsso.eurostat.ec.europa.eu/nui/show.do?dataset=sbs_na_sca_r2&lang=en, accessed on 9 January 2022.
Applsci 12 06014 g012
Figure 13. Biplot on F1 and F2—countries distribution pattern. Source: Author’s contribution based on data retrieved from Eurostat. Annual enterprise statistics for special aggregates of activities. https://appsso.eurostat.ec.europa.eu/nui/show.do?dataset=sbs_na_sca_r2&lang=en, accessed on 9 January 2022.
Applsci 12 06014 g013
Figure 14. GDP and GDP per capita for the cluster of less robotized countries. Source: Author’s contribution based on data retrieved from International Comparison Program, World Bank, World Development Indicators database, World Bank | Eurostat-OECD PPP Programme. Available at: https://data.worldbank.org/indicator/NY.GDP.PCAP.PP.CD and https://data.worldbank.org/indicator/NY.GDP.MKTP.PP.CD, accessed on 10 March 2022.
Applsci 12 06014 g014
Figure 15. GDP and GDP per capita for the cluster of less robotized countries. Source: Author’s contribution based on data retrieved from International Comparison Program, World Bank, World Development Indicators database, World Bank|Eurostat-OECD PPP Programme. Available at: https://data.worldbank.org/indicator/NY.GDP.PCAP.PP.CD and https://data.worldbank.org/indicator/NY.GDP.MKTP.PP.CD, accessed on 10 March 2022.
Applsci 12 06014 g015
Figure 16. GDP and GDP per capita for the cluster of highly robotized countries. Source: Author’s contribution based on data retrieved from International Comparison Program, World Bank, World Development Indicators database, World Bank|Eurostat-OECD PPP Programme. Available at: https://data.worldbank.org/indicator/NY.GDP.PCAP.PP.CD and https://data.worldbank.org/indicator/NY.GDP.MKTP.PP.CD, accessed on 10 March 2022.
Applsci 12 06014 g016
Figure 17. GDP and GDP per capita for the cluster of highly robotized countries. Source: Author’s contribution based on data retrieved from International Comparison Program, World Bank, World Development Indicators database, World Bank|Eurostat-OECD PPP Programme. Available at: https://data.worldbank.org/indicator/NY.GDP.PCAP.PP.CD and https://data.worldbank.org/indicator/NY.GDP.MKTP.PP.CD, accessed on 10 March 2022.
Applsci 12 06014 g017
Table 2. Calculated eigenvalues of each variable. Source: Author’s contribution based on data retrieved from Eurostat. Annual enterprise statistics for special aggregates of activities. https://appsso.eurostat.ec.europa.eu/nui/show.do?dataset=sbs_na_sca_r2&lang=en, accessed on 9 January 2022.
°F1F2F3F4F5F6F7F8
Eigenvalue4.1702.0941.0770.5630.0690.0160.0100.002
Variability (%)52.12226.17413.4567.0410.8600.2040.1190.024
Cumulative %52.12278.29691.75298.79399.65299.85699.976100.000
Table 3. Factor matrix after Varimax rotation. Source: Author’s contribution based on data retrieved from Eurostat. Annual enterprise statistics for special aggregates of activities. https://appsso.eurostat.ec.europa.eu/nui/show.do?dataset=sbs_na_sca_r2&lang=en, accessed on 9 January 2022.
Component
FactorD1D2D3
Use of industrial robots0.667−0.028−0.401
GDP per capita0.9180.2370.121
Employees-number0.0880.987−0.011
Growth rate of employment0.022−0.0410.957
Wages and salaries0.2000.976−0.008
Apparent Labor Productivity0.9620.177−0.014
Gross Value Added per employee0.9690.184−0.041
Turnover or gross premium written0.2050.975−0.034
Table 4. Manufacturing enterprises in Romania. Source: Author’s contribution based on data retrieved from various sources, including Statista’s Most important companies in the manufacturing industry in Romania in 2019, by revenue report, available at https://www.statista.com/statistics/1115921/romania-companies-in-the-manufacturing-industry-by-revenue/, accessed on 19 March 2022.
Enterprise NameGeneral Industry
Astra Bus S.R.LAutomotive
Automobile Dacia S.AAutomotive
C&I Eurotrans XXIAutomotive
El Car Igescu S.N.C.Automotive
Ford RomaniaAutomotive
ROMAN S.A.Automotive
Continental AGAutomotive
KIRCHHOFF Automotive Romania SRLAutomotive
Daimler AGAutomotive
Greiner PackagingPackaging manufacturer
ElectroplastManufacturing of cables and electric cords
BraiconfManufacturing of textiles
ConfindManufacturing of equipment
NorielToy manufacturing
Publisher’s Note: MDPI stays neutral with regard to jurisdictional claims in published maps and institutional affiliations.

