Article

The Amalgamation of the Object Detection and Semantic Segmentation for Steel Surface Defect Detection

1
Department of Computer Science and Engineering, Kongju National University, 1223-24 Cheonan-daero, 275 Budae-dong, Seobuk-gu, Cheonan-si 31080, Chungcheongnam-do, Korea
2
School of Creative Convergence, Andong National University, 1375 Gyeongdong-ro, Andong 36729, Gyeongsangbuk-do, Korea
*
Author to whom correspondence should be addressed.
Appl. Sci. 2022, 12(12), 6004; https://doi.org/10.3390/app12126004
Submission received: 8 April 2022 / Revised: 10 May 2022 / Accepted: 10 June 2022 / Published: 13 June 2022

Abstract

:
Steel surface defect detection is challenging because it contains various atypical defects. Many studies have attempted to detect metal surface defects using deep learning and had success in applying deep learning. Despite many previous studies to solve the steel surface defect detection, it remains a difficult problem. To resolve the atypical defects problem, we introduce a hierarchical approach for the classification and detection of defects on the steel surface. The proposed approach has a hierarchical structure of the binary classifier at the first stage and the object detection and semantic segmentation algorithms at the second stage. It shows 98.6% accuracy in scratch and other types of defect classification and 77.12% mean average precision (mAP) in defect detection using the Northeastern University (NEU) surface defect detection dataset. A comparative analysis with the previous studies shows that the proposed approach achieves excellent results on the NEU dataset.

1. Introduction

In recent years, digital transformation has been rapidly spreading in the manufacturing industry, and the concept is expanding from factory/process automation to the smart factory. Among the related technologies, automatic vision inspection technology, in particular, was created by combining machine vision and artificial intelligence technology. Its application is extensive and used in all manufacturing processes that require inspection [1,2,3,4,5]. The automatic vision inspection is a technology that automatically detects defects in parts of a product in a manufacturing line. The automatic vision inspection system takes an image of the finished part (or end product) from a dedicated camera installed on the production line and compares it with the normal product image to check for any defects. By detecting in advance the defective parts during the manufacturing stage, there is the possibility of a lower final defect rate and increased product productivity, thereby enhancing the reliability and profit of the company. The traditional manufacturing defect inspection is a method that relies on human eyesight and has the advantage of being able to detect various types of defects very quickly and accurately, depending on the skill level of the inspector. However, it takes a large amount of time and money to train skilled inspectors. In addition, it has the disadvantage of missing defects due to the accumulation of fatigue caused by the long-term work of the operator. On the other hand, machine vision is a system that replaces a human inspector for the visual inspection of product defect detection with a computer [6,7,8,9,10,11,12,13,14,15,16,17,18,19]. However, full automation is difficult to achieve due to many variables. Although it is a necessary technology for factory/process automation, it is still in the growing phase. Conventional machine vision technology is developed in a rule-based way. After defining the good products first, the method of classifying non-good products as defective products was adopted. At the time of the initial introduction of machine vision, it was evaluated as a groundbreaking technology that could make accurate and consistent decisions, but it gradually showed limitations. As the industry is segmented, more sophisticated technologies are needed. For example, parts and products have been miniaturized and more diversified throughout the manufacturing industry, such as machinery, automobiles, semiconductors, and electronic products. The demand for rapid and accurate technology development for precision (may be precise) parts has also increased rapidly. In particular, as atypical defects are difficult to distinguish by general definition, there is an active movement to introduce artificial intelligence (AI) technology, such as machine learning (ML) and deep learning to automatic vision inspection. Among AI technologies, the deep learning-based vision inspection system, in particular, guarantees high accuracy and efficiency in areas that are difficult to inspect by conventional methods [20,21,22,23,24,25,26,27,28,29,30,31,32,33,34].
On the other hand, with the development of the automobile, aerospace, and shipbuilding industries, the importance of the steel industry is also increasing. As a result, the requirements for automated technology for steel surface defect detection to control the quality of steel products are increasing. Steel surface defects contain various atypical defects, such as pitted surface, inclusion, patches, rolled-in scale, crazing and scratches; thus, it remains a difficult problem. Many previous studies have tried to solve the steel surface defect detection problem by using only one ML or deep learning-based methods, such as object detection and image segmentation. Despite the introduction of deep learning technology, it is difficult to detect all of the aforementioned metal surface defects accurately [35,36,37].
In this study, we propose a hierarchical approach for steel surface defect detection, which has a hierarchical structure of the binary classifier at the first stage and the object detection and image segmentation algorithms at the second stage. In general, an object can be defined based on the characteristics such as closed boundary, different appearance and uniqueness. Most defective types of steel surfaces, such as pitted surfaces, inclusion, patches, rolled-in scale, and crazing, can be considered objects. However, scratches are very thin and elongated in shape, so they are not included in the general category of objects. We defined scratch detection as an image segmentation problem and other types of defect detection as an object detection problem. In the first stage, the binary classifier classifies whether the input image is an image containing a scratch defect or an image containing other types of defects. In the second stage, an image segmentation algorithm for detecting scratches or an object detection algorithm for detecting other types of defects is applied according to the classification result of the first stage. We obtained 98.6% accuracy in scratch and other types of defect classification and 77.12% mAP in defect detection using the NEU surface defect detection dataset.
The organization of the paper is as follows. In Section 2, we discussed the related work on traditional and state-of-the-art methods in defect detection, followed by the hierarchical steel surface detection methodology explaining the proposed steel surface defect detection model in Section 3. In Section 4, the experiment evaluation is illustrated. Section 5 provides the analysis and discussion. Finally, the paper is concluded in Section 6.

2. Related Work

2.1. Traditional Methods

The traditional methods are also referred to as ML methods. They are the traditional techniques for image processing. The traditional techniques are broadly classified as statistical-based, structural-based, spectral/filter-based, and model-based. The statistical technique is based on the pixel value distribution of the given images. The methods included in this technique are thresholding [6], gray-level [7], co-occurrence matrix [8], histogram of oriented gradient (HOG) [9], and local binary pattern (LBP) [10]. The structural-based technique is based on detecting the edges and skeleton of the images. This method includes the following techniques: edge-based [11], skeleton-based [12], and morphological-based [13]. The spectral/filter-based detection techniques are based on regions, texture and edges. Filtering is a process in which filter algorithms extract specific features during the transformation process. Several approaches are classified into spatial domain, frequency domain and spatial-frequency domain. The frequency domain methods, such as Fourier transform [14], help to eliminate the noise from an image and then process it. The shortcomings of the Fourier transform are determined by the Gabor filter [15], which provides an optimal location of defects in spatial and spatial-frequency domains. The wavelet transform [16] has a greater ability than the Gabor filter for defect detection. It detects the defect location horizontally or vertically and diagonally through wavelets, which are small waves of differing frequency in a limited time period. The model-based techniques are the combination of certain attributes of the aforementioned approaches. The models associated with this technique are the fractal model [17], Markov random field [18] and autoregressive model [19]. The fractal models provide information regarding irregular texture surfaces. The Markov random model is a combination of the above two approaches. It has performed texture analysis defect detection on fabrics. Lastly, the autoregressive model defines the textural features based on pixel linear dependency. The ML methods have two-step processes, which include feature extraction and classification. The above approaches are challenging for the real world due to several issues, such as the illumination of the surface, noise, background factor and environmental factor. Due to this, every time, we have to change the parameters according to the concern raised, which makes it difficult to adapt to real-time applications.

2.2. Deep Learning Methods

The deep learning methods were introduced to overcome the drawbacks of traditional methods. Various deep learning models have been introduced to date. In the paper [20], the author introduced an end-to-end defect detection network (EDDN) on the metallic surface based on the single shot multibox detector (SSD). The detection model base comprises two modules; one is the visual geometry group (VGG)16 for feature extraction and non-maximum suppression, as the model focuses on different scales of defects. Due to class imbalance, the author introduces a hard negative mining technique to resolve the issue. The mAP evaluated on the NEU dataset is around 72.4%. In the paper [21], Vira Fitriza Fadli et al. introduced an automated and more sophisticated approach for defect detection on the steel surface. The architecture uses Xception as the CNN model for defect detection. The model performs a two-step classification of four types of defects, first the binary classification for identifying the presence of a defect or not with resulting accuracy of 94% and then the multi-classification to categorize the different types of defects with 85% accuracy. This technique focuses on the classification method and not localization. In the paper [22], the author proposes a defect classification model that endorses GoogleLeNet as its base model for feature extraction. This model uses inception modules for extraction and a softmax classifier for classification. The model achieves 98.5% classification accuracy. In the paper [23], the author uses the VGG model [24] for defect classification with an accuracy of 90%. In the paper [25], the author proposed a defect detection system DDN consisting of residual neural network (ResNet) 50 [26] as a base model for classification. They introduce the multi-level feature network for fusing all the features into one, which further helps the region proposal network to evaluate the regions of interest for better detection. These regions of interest are severed into two fully connected layers for classification and detection, resulting in 82.3% detection accuracy. In the paper [27], the author proposes an improvised faster region-based convolutional neural network (Faster-RCNN) [28], along with the support of multi-scale feature fusion for defect detection, resulting in 98.26% accuracy. The model performed data augmentation to reach this result. Various other convolutional neural networks (CNN), such as the OverFeat network [29], are the pre-trained models on the ImageNet and COCO dataset and are used as a feature extractor for defect detection. Various state-of-the-art approaches, such as Faster-RCNN [28], SSD [30], You Only Look Once V2 (YOLOV2) [31,32], YOLO-V3 [33,34], including the above two, are introduced for the defect detection on steel or metal surface. These models outperform the traditional methods on all classes of defects. In the coming section, the proposed model is compared with the traditional and state-of-the-art methods.

2.3. Segmentation Methods

Image segmentation has proven to be one of the best ways of detecting defects on any surface. Various semantic segmentation models have been introduced for defect detection in the past few years. In the paper [35], the model used is a convolutional auto-encoder and sharpening process to highlight the defective area on the NEU dataset. The model segmented the illuminated parts of an image as defects, which led to compromised efficacy and incorrect defect detection. The evaluation parameters are not discussed for diagnosing the performance of the model. With regard to the other segmentation model, a fully convolutional network (FCN), ref. [36] with transfer learning was proposed. The model is tested on the NEU dataset, obtaining 98% classification accuracy. Although the classification accuracy is satisfactory, the author still feels the contours of the defect images are not segmented appropriately, due to which model is unable to achieve high segmentation accuracy. Various papers have included the promising model UNet as their base model with slight changes in the architecture and showed satisfactory results. The author [37] proposed an FCN model influenced by UNet to detect defects on the DAGM 2007 textured surface dataset. The paper introduced two models with a slight tweak in the architecture. Model 2 performed slightly better than model 1, with the intersection over union (IoU) value of 68.3% and F1-score of 79%. However, the model accuracy is still low, and there is room for further improvement. The paper [38] proposed UNet with ResNet34 and an additional decoder for severity evaluation of the defects and to obtain the two segmented images, one for defect information and another for defect severity. They included production process parameters to improve the performance of the model. The ground truth image provides a mask in box form, which led to false positive detection and resulted in the poor performance of the model. The model is evaluated through IoU metrics, which is around 40%. The paper [39] introduces DSUNet to overcome the variability in the types of defects, shape and location. They introduced a multi-scale module to improve segmentation between the encoder end and decoder start. The model’s dice coefficient of 80.8% and accuracy of 95.4% were achieved on the SD-saliency-900 dataset. The generalization of the model for other defects is not clear. The paper [40] used the pre-trained transfer learning classic UNet model for feature extraction. No additional features are used in the model to improve the segmentation, and model generalization is fuzzy. The model resulted in a mean IOU (mIoU) of 84.3%.
Various enhancements have been carried out to existing models for better performance; one of them is the attention module. Some papers have discussed the advantageous use of the attention module in their proposed models. In paper [41], the author proposed the PGA-Net model, a combination of two main modules, pyramid feature fusion (PFF) and global context attention (GCA) network. The PFF module extracts features for fusing into five resolutions. Along the boundary refinement block, the GCA network propagates the information and refines boundaries from low to high-resolution feature maps. The model is evaluated on the NEU dataset (containing three defects), resulting in 82.15% mIOU. Despite the promising results, the model failed to detect some defects correctly due to overfitting. The paper [42] discussed the dual attention network (DAN)-DeepLabv3+ model, including a dual attention module and Xception as the backbone. Only three defects of the Severstal defect dataset were considered. The first defect was weakly detected out of the three, due to data imbalance and shape. The mIoU value of 89.9% was evaluated. The paper [43] proposed a triple attention semantic segmentation network (TAS2-Net) architecture. Multi-level feature extraction and focus context module are introduced to extract and fuse the small defects with multi-level feature information for defect segmentation. The IoU of 86.3% on the NEU dataset shows that the proposed model performed well. In [44], the author introduced a model transfer learning-based UNet (TLU-Net) based on transfer learning, with ResNet and DenseNet as encoders. The performance of both is compared, and it is observed that the pre-trained models performed relatively well compared to the random initialization. The other paper [45], with the concept of transfer learning in the UNet model with various pre-trained models as backbones, shows how the model’s accuracy increases. Among all the backbones, EfficientNetb0 performed well.

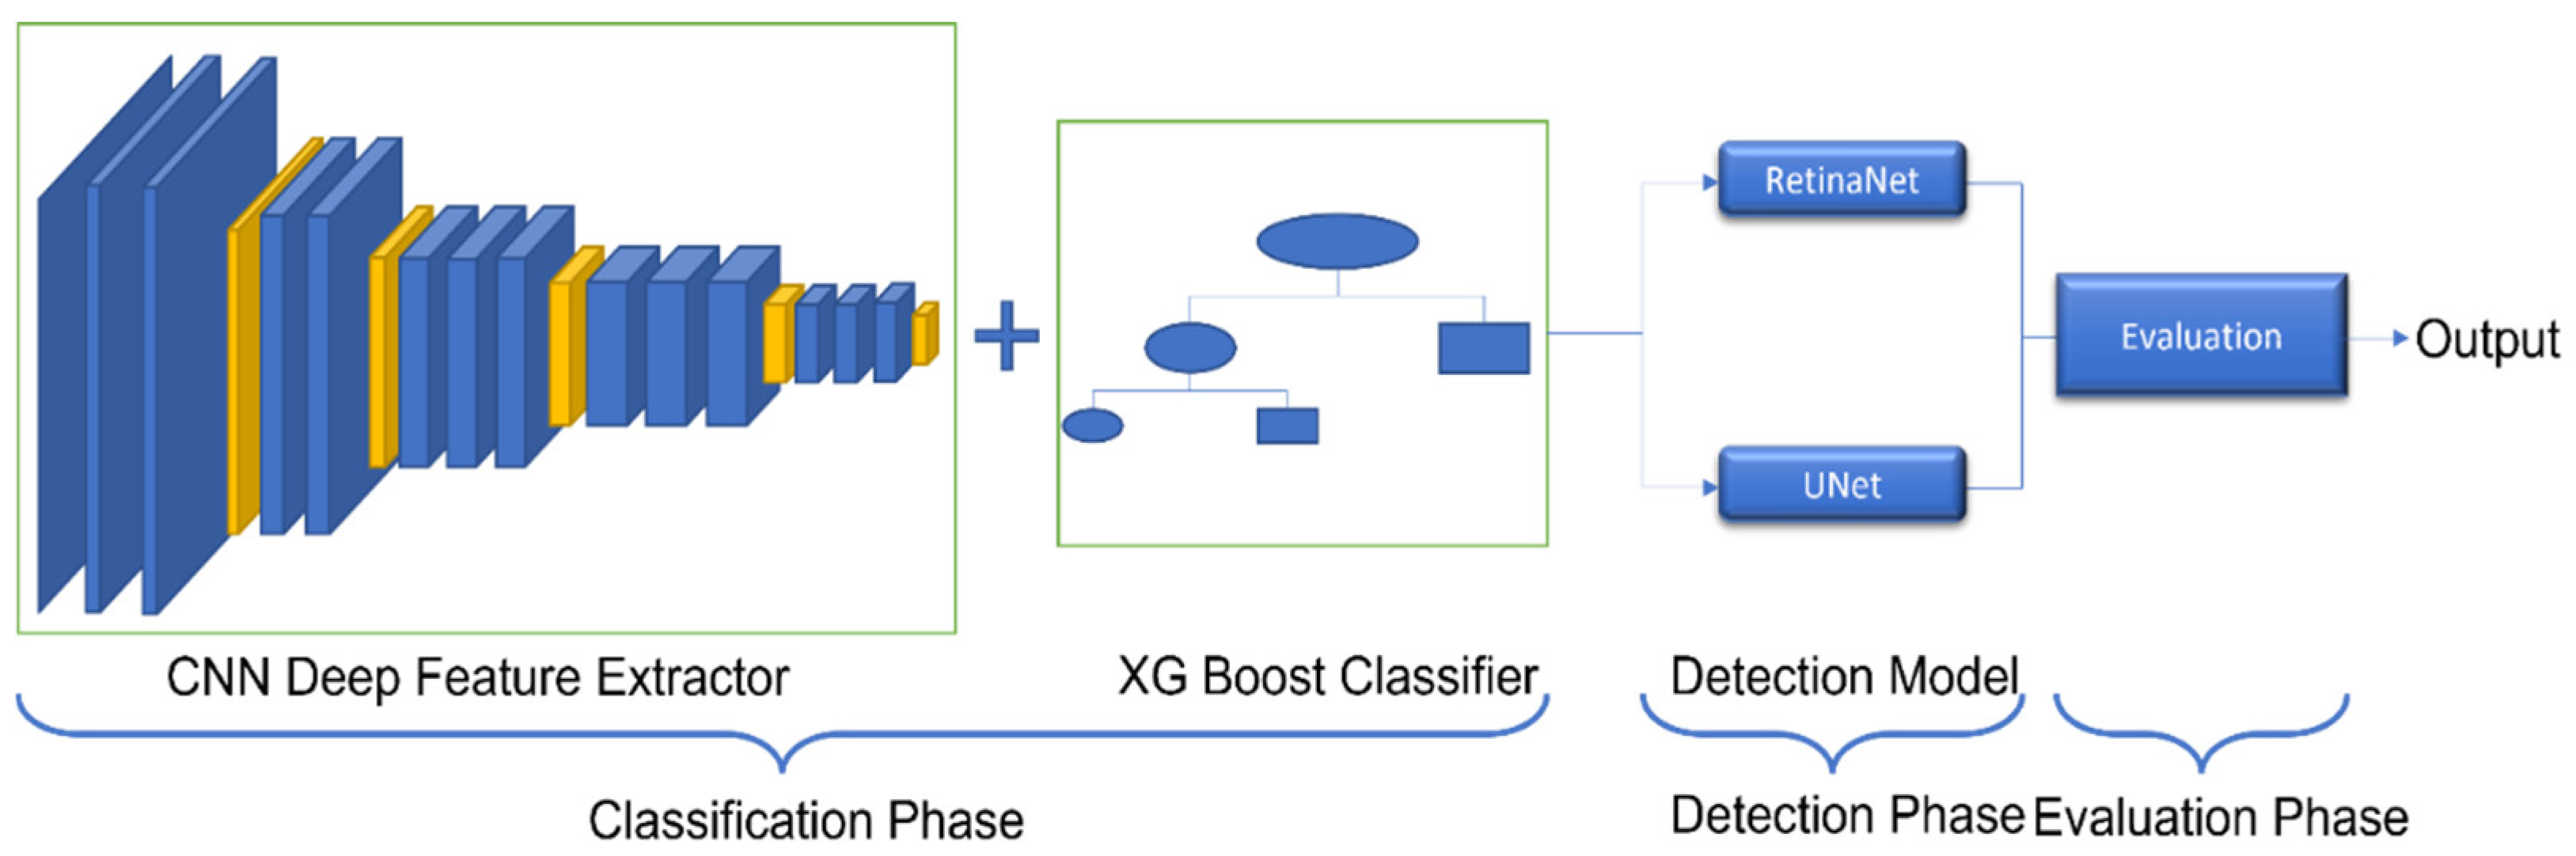
3. The Hierarchical Steel Surface Detection Methodology

Many previous studies have employed object detection methods for steel surface defect detection [20,21,22,23,24,25,26,27,28,29,30,31,32,33,34]. They reported that the results showed its inability to detect the scratch defect. The other defects were precisely detected. The reason behind the model’s incompetence in detecting scratches is its features and the visibility of the defect in an image. The scratch defect look is a thin elongated line, whose clarity is affected by the luminosity of the image, which further makes it difficult to distinguish the defect from the background. In some images, the shape of the scratch was the whole image horizontally or vertically, due to which the limited anchor boxes in the object detection model led to lower detection of the scratch. The bounding boxes of ground truth (GT) and the anchor boxes were not coordinating correctly. According to the literature review, the image segmentation methods show good results in detecting scratches among steel surface defects [33,34,35,36,37,38,39,40,41,42,43,44,45]. Most of the defects of steel surfaces, such as pitted surfaces, inclusion, patches, rolled-in scale and crazing, can be considered objects because they satisfy most of the characteristics of object definition, i.e., closed boundary, different appearance and uniqueness. However, scratches are not included in the general category of objects.
To overcome the limitations of object detection and image segmentation approach for steel surface defect detection, a proposed hybrid architecture for defect detection on the steel surface is in this study. The proposed approach has a hierarchical structure of the binary classifier on the top layer, the image segmentation algorithm for scratch detection and object detection algorithm for detecting other types of defects on the second layer. The image classifier of the top layer classifies the input image into scratch images and other defect images. If the input image is classified as a scratch image, it is input to the image segmentation algorithm of the second layer, that is, UNet, and the location of the scratch is found through object segmentation. If the input image is classified as a different kind of defect images, it is fed into an object detection algorithm of the second layer, i.e., RetinaNet, and the defect is located. In the final phase, the result is evaluated with an evaluation metric. The proposed architecture is shown in Figure 1.

3.1. Defect Image Classification

For defect image classification, the combination of CNN and ensemble algorithm is carried out. In this study, three convolutional models, VGG16, VGG19 and ResNet50, are experimented with, and out of them, VGG16 outperforms the other two models. In Table 1, it is clearly depicted that VGG16 accuracy is better than the other two models. The VGG16 convolutional neural network is used as a feature extractor model where it extracts the features of defects. The architecture is a simple and uniform convolutional network. It is a recognized and preferred choice for feature extraction. It is the pre-trained model on the imagenet dataset. The input to this network has the dimension of 256 × 256 × 3. The VGG16 has a total of five convolutional blocks. The first two convolutional blocks provide two convolution filters, followed by max-pooling and the remaining three convolutional blocks contain three convolution filters, followed by max-pooling. The final output of this feature extractor is in the shape of 8 × 8 × 512. These extracted features go through the ensemble model, the XGBoost classifier [46], for the classification of the defects. XGBoost (extreme gradient boosting) is a ML algorithm based on the decision tree. XGBoost is a scalable boosting tree that optimizes gradient boosting. It is capable of handling missing data and overfitting issues, through a parallel process. The system is optimized through parallelization. It handles sparse data and performs out-of-core computation with large datasets. In steel surface defect detection where time is the critical factor, XGBoost can handle this factor, as it is computationally fast and requires fewer resources for computation. This algorithm is the most effective ML algorithm among most of the existing ones for classification. The XGBoost’s main feature is the gradient descent algorithm. The results of this ensemble algorithm are promising. The XGBoost subsists of classification and regression modules. In this study, we need the classifier module. The reason behind using this algorithm is that it involves less computational resources and requires less time for classification, compared with other ensemble algorithms. It uses the depth-first approach and avoids overfitting through regularization. It is capable of handling missing data and has an in-built cross-validation feature for determining the model’s effectiveness and reduces the bias and variance. After the classification of the defects, it goes to the detection phase consisting of two models parallelly aligned. The first one is the object detection model, RetinaNet, and the other is the image segmentation model UNet. The five defects (crazing, inclusion, pitted surface, patches, rolled-in scale) pass through the RetinaNet model, and the scratch defect goes through the UNet model.

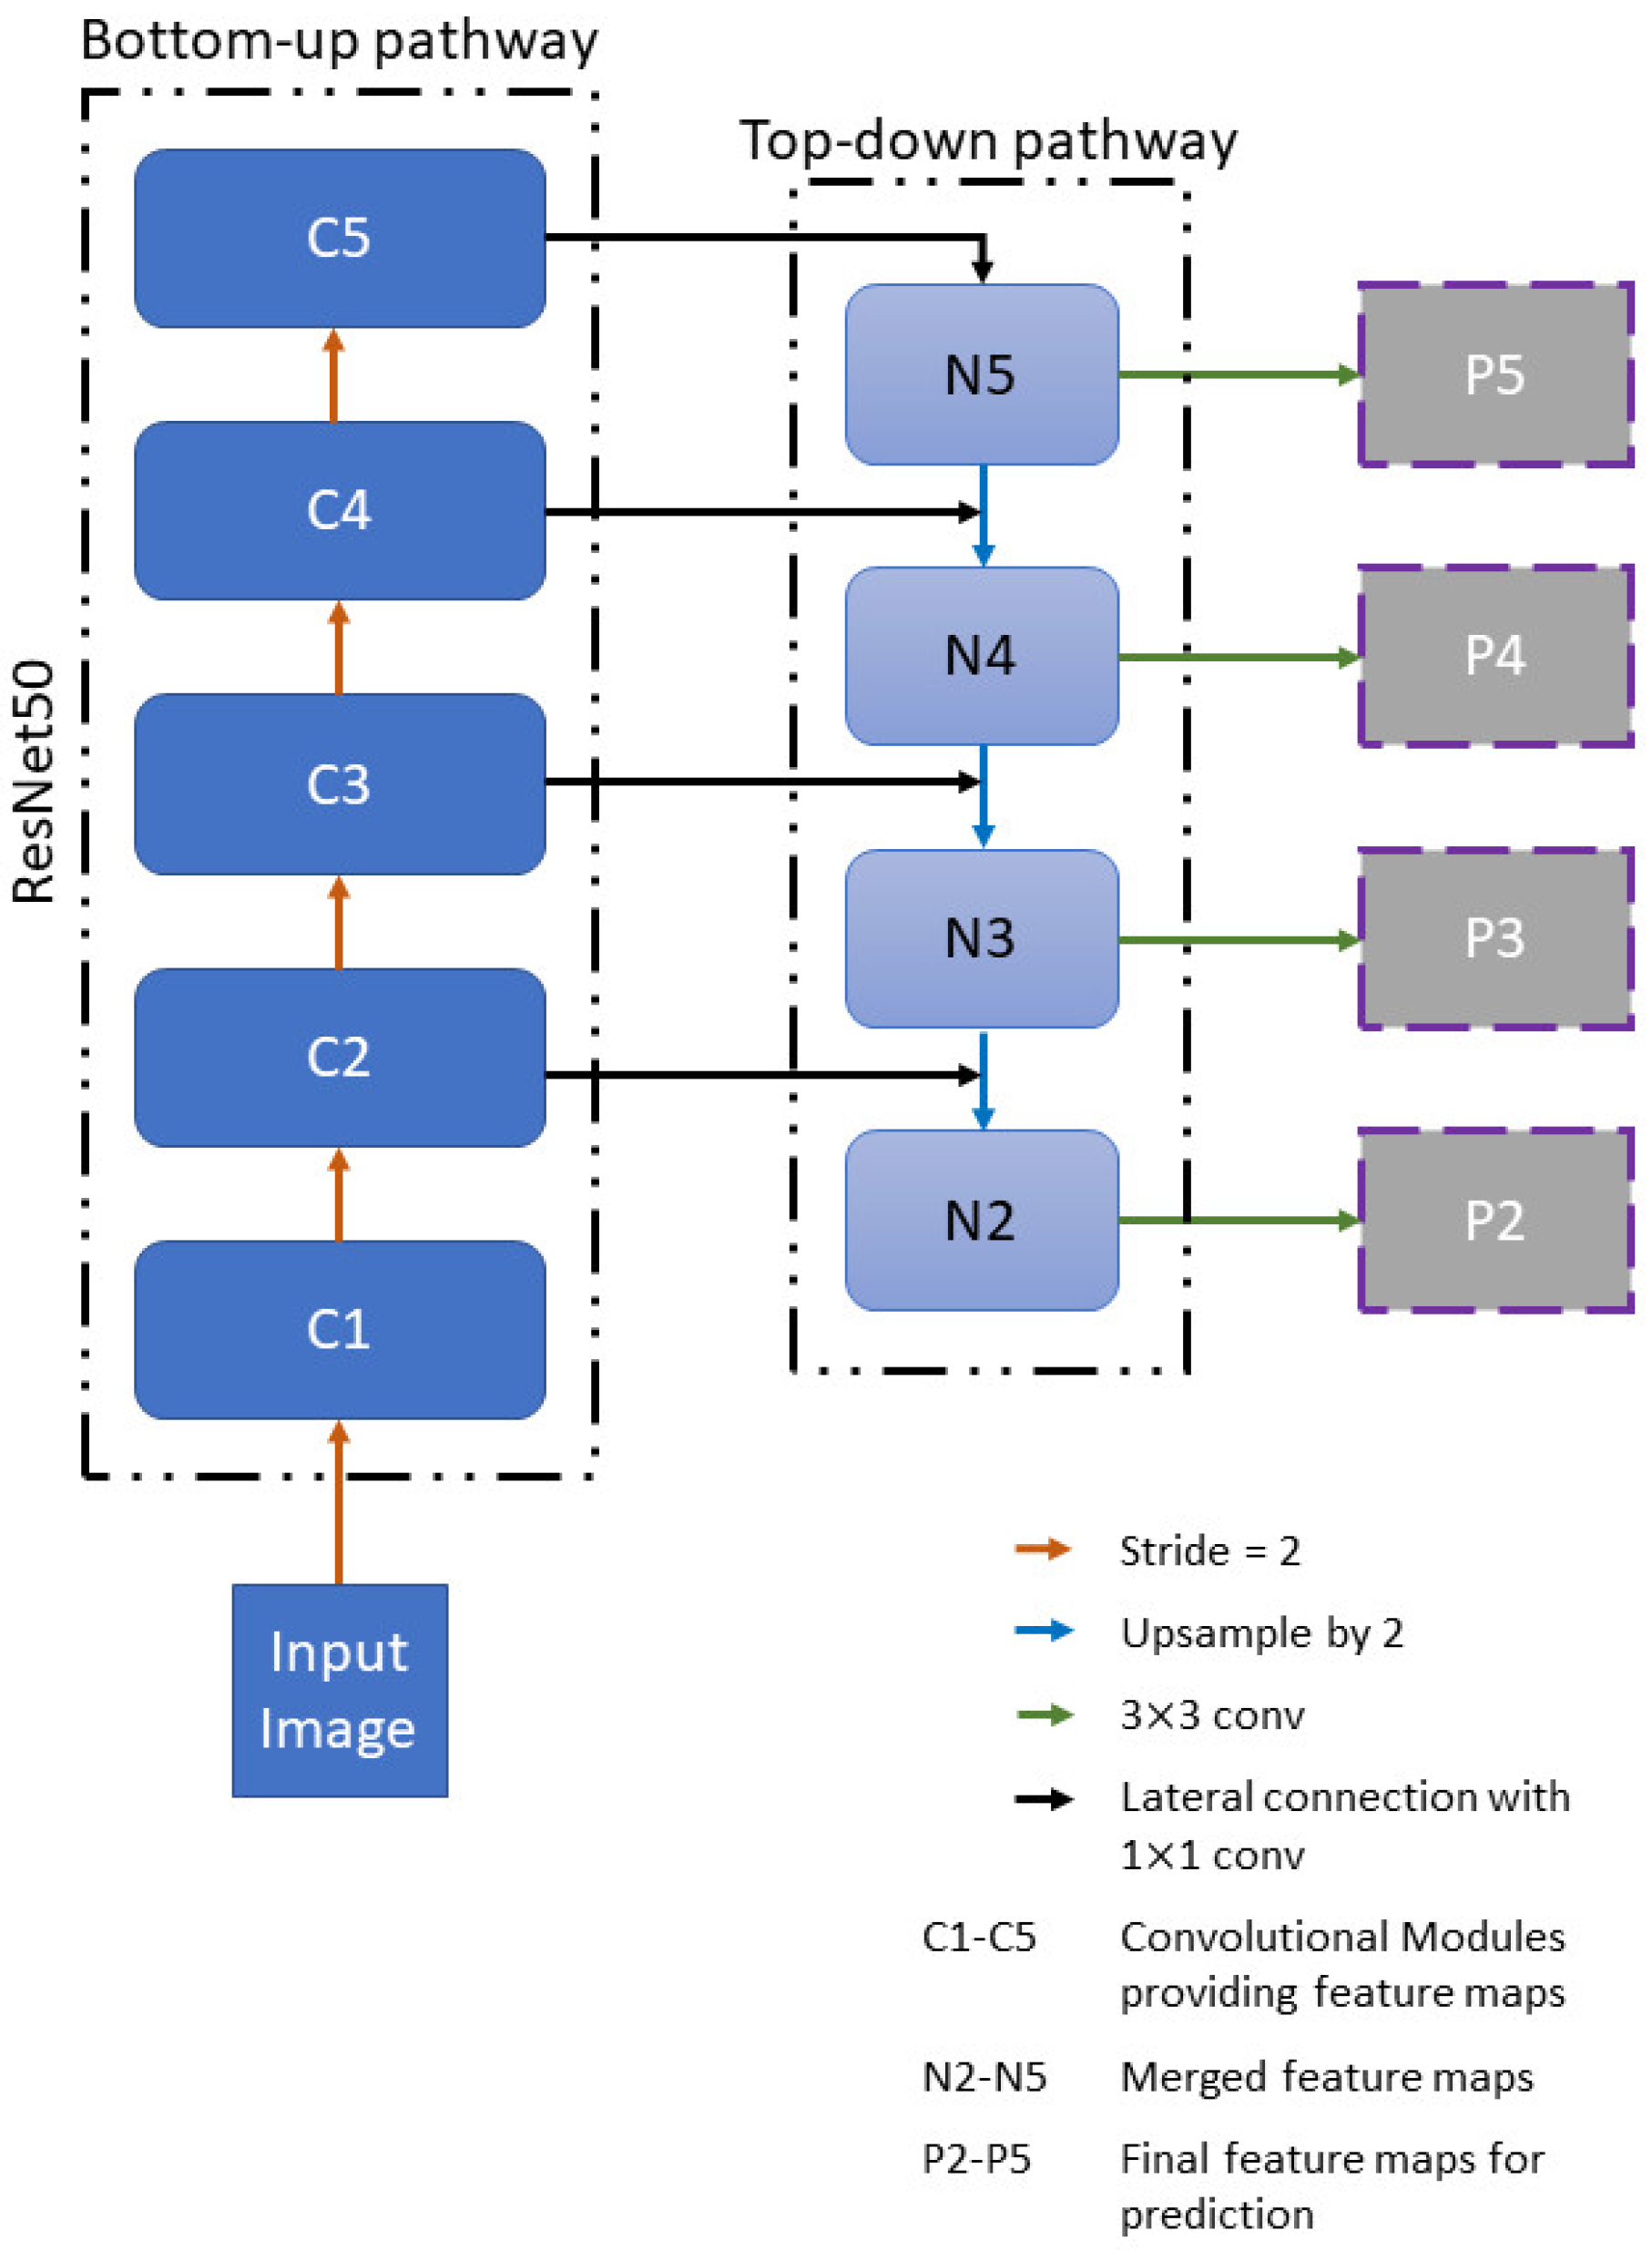
3.2. Object Detection for the Pitted Surface, Inclusion, Patches, Rolled-In Scale and Crazing Defects Detection

To provide an algorithm for real-time applications, the one-stage detectors, RetinaNet [47], as the defect detection for pitted surface, inclusion, patches, rolled-in scale and crazing is employed. The RetinaNet model, compared with other state-of-the-art detectors, has a simple architecture with good speed and acceptable accuracy. The RetinaNet architecture comprises the following three sections: first, the backbone network; second, the classification subnet and third, the regression subnet. The backbone network section comprises of a bottom-up pathway and a top-down pathway. The input image is passed through the bottom-up pathway, consisting of ResNet50 as a feature extractor. This extractor generates the multi-scale feature maps in bottom-up hierarchical form. Each feature maps belongs to the last layer of the convolution stage. In the bottom-up path, the semantic values increases and the spatial resolution decrease. In the top-down pathway, a feature pyramid network (FPN) [48] generates the multi-scale feature maps from semantic-rich layers in a top-down hierarchy. The hierarchy of the feature maps generated by the ResNet50 is laterally connected with the feature maps of FPN on the same spatial size with strong semantics. The levels in FPN mainly focus on providing the hard features that are difficult to detect. The output feature maps of FPN are used in the prediction of objects and their classes. The block diagram representation of FPN is shown in Figure 2. The classification subnet section consists of a fully convolutional network connected to each level of FPN. The feature maps generated at each pyramid level serve as input to the classification subnet. These feature maps go through four sets of convolutional layers of size 3 × 3 with 256 filters each, followed by rectified linear unit (ReLU) activation, again with a convolutional layer of size 3 × 3 with C × A filters, where C is the number of classes and A is the number of anchor box, followed by sigmoid function for classification of objects. The regression subnet is attached to FPN and aligned parallel to the classification subnet. The subnet has identical convolutional layers to the classification subnet, except for the last convolutional layer with 4 × A filters. This subnet detects the bounding box of an object present in an image. The final image output is predicted with the bounding box and respective class. The reason to choose this model is that it performs better than the one-stage detectors. Approximately, there is a gap of 6 points in the average precision (AP) of RetinaNet with the nearest competitor model, deconvolutional single shot detector (DSSD). The two-stage detectors are well-known for good accuracy, Faster R-CNN is the top-performing model among them; regardless of that, RetinaNet surpasses the model with a gap of 2.3 points. This model uses focal loss as its loss function, which is very good for class imbalance.

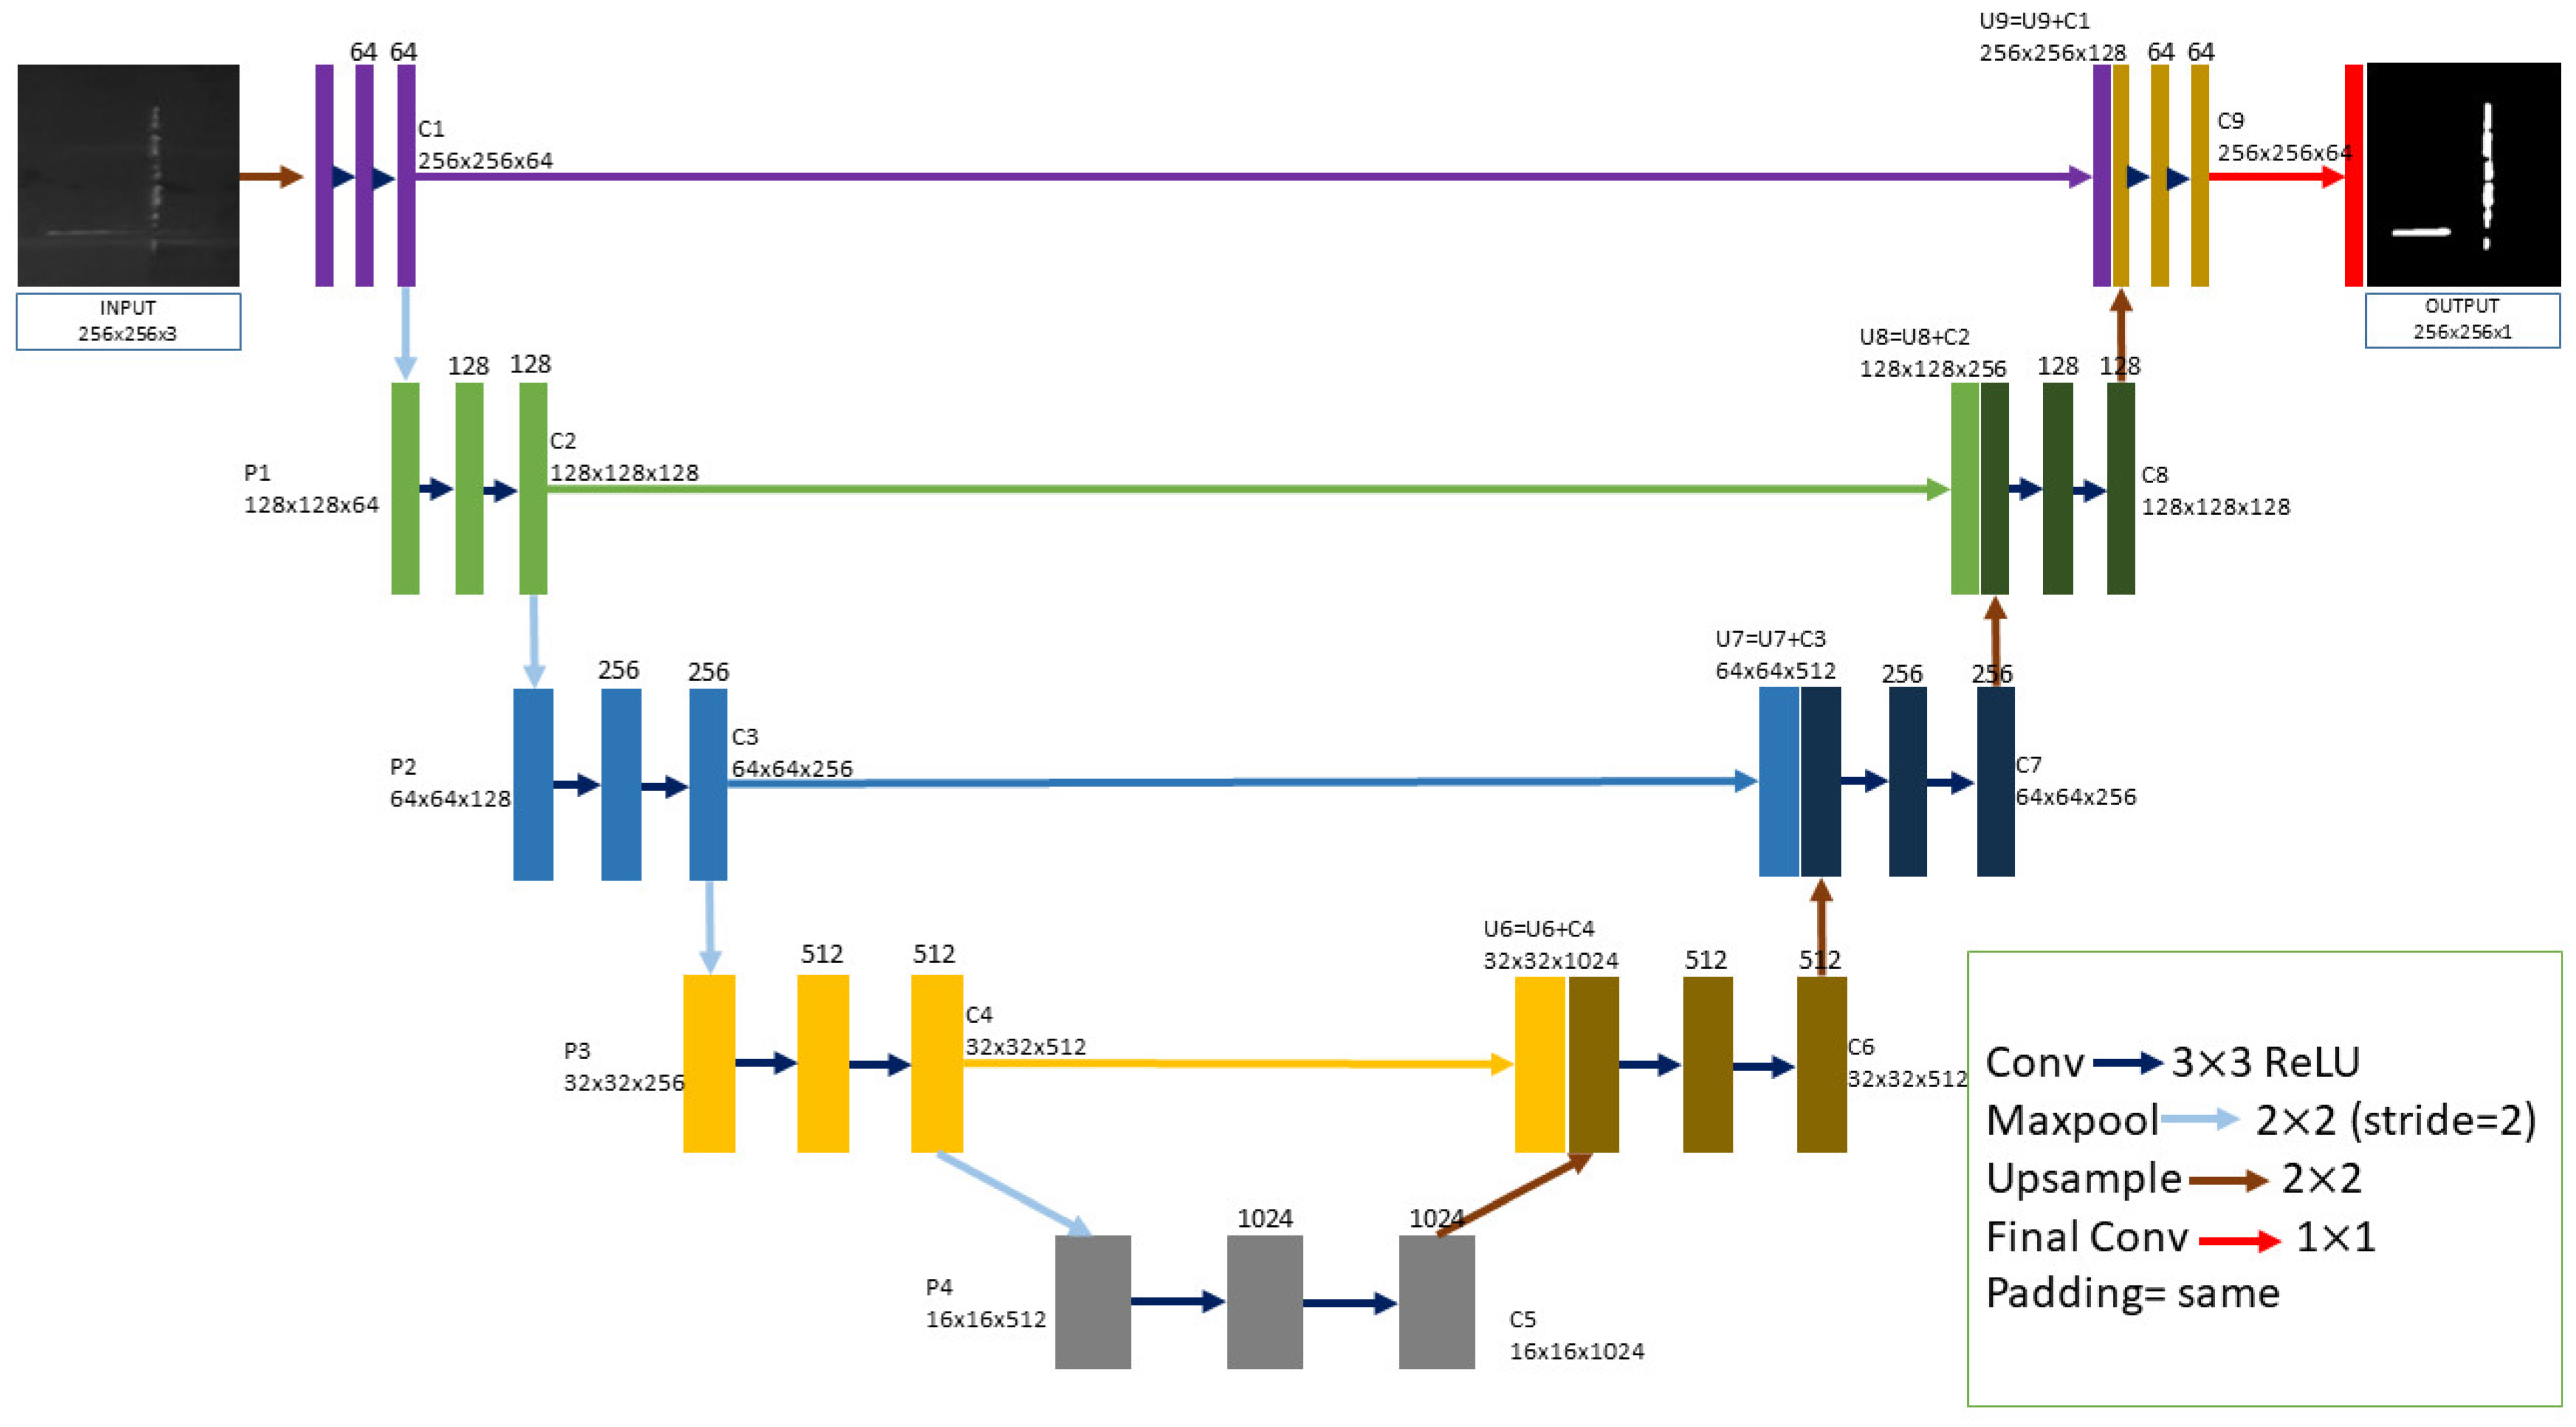
3.3. Image Segmentation for the Scratch Defect Detection

Image segmentation is a process in which the image is broken down into small segments. Out of all the segments, the segment that contains the important information is processed in the image processing algorithm. The pixels with related features are accumulated together through image segmentation. Along with the classification and localization, it also provides us with the exact shape of an object in an image. The image segmentation techniques are broadly classified into the following two types: semantic segmentation and instance segmentation. Keeping in mind the constraint of this paper, we focus only on semantic segmentation. Semantic segmentation works on every pixel of an image. It assigns a label to every pixel of the image. It denotes the same labels to pixels of multiple objects but belongs to the same class. It reduces the inference time for detection, as it only processes the particular region instead of the whole image for detection.
One of the semantic segmentation models is UNet [49]. UNet is a special type of architecture for semantic segmentation. It was designed for biomedical image applications, but now it is widely used in different fields. UNet, as the simple and efficient segmentation model, has inspired many researchers to implement it for defect segmentation on any surface. The architecture shown in Figure 3 is the combination of convolutional and max-pooling layers arranged in a particular form for processing the image. It contains two paths, one is the down sampling, encoder, or contraction path and the other path is the up sampling, decoder, or expansion path. The concatenation process between the encoder and decoder path provides us with the localization information of the objects. During concatenation, cropping of the encoder output is eliminated in the proposed model, although it is carried out in the original model. In the model, the upper layers provide the information about the classification of objects, which means that it answers the ‘what’ question. As we go to deeper layers, it provides the localization information, which means the answer to the ‘where’ question. The advantage of this model is that it can be trained efficiently with fewer datasets. The UNet model for scratch detection is adopted. The visibility of some scratches is very low in the dataset, due to which it was difficult to detect the scratch properly on an image. The UNet model, which is simple with less inference time, generated better results by precisely locating the defect and its shape. We use the binary focal loss to calculate the loss to reduce the imbalance issue.

4. Experimental Results

The experiment is conducted on the NEU dataset, which is described shortly. The dataset is split into two sets. One set contains crazing, pitted surface, inclusion, patches and rolled-in scale, and the other set contains only scratches. The first set of datasets goes through the RetinaNet model as the ResNet50 backbone, and the other set goes through the UNet model. These models are combined through the evaluation process. The following section contains the description of the dataset used, the performance analysis based on individual defects and comparison of our method with the deep learning methods and traditional methods.

4.1. Implementation Details

This study considers the Northeastern University (NEU) [10] surface defect detection dataset. This dataset is a collection of defects on hot-rolled steel strips, consisting of the following six defects: pitted surface, inclusion, patches, rolled-in scale, crazing and scratches. This dataset includes 360 image samples for each defect, respectively.
The parameters were set for various models used in the experiment. The RetinaNet model used a pre-trained model with weights, with the number of anchor boxes as nine, the learning rate 10−5. The backbone used in RetinaNet is ResNet50, and the model is executed for 50 epochs. In the UNet model, the learning rate parameter is set to a 10−2 value, and the model is executed for 300 epochs. The XGBoost classifier is supported by stochastic gradient boosting. It has a parallel computing environment. The classifier has two types of boosters, gbtree and linear. The classifier in this study uses a gbtree booster. The total number of trees in this booster is 100, and each level of tree size is 6. These trees are constructed parallelly, which is supported by the block structure feature of the algorithm. The classifier performs multi-classification, with multi-softmax probability as the optimization objective.
An evaluation metric is a standard for measuring or evaluating the performance and efficiency of ML and deep learning models. There are various evaluation metrics accessible according to the models and the conditions to be satisfied. Among all the available metrics, we adopted confusion matrix (CM), AP and mAP [50]. The CM is a matrix of form MxM. This evaluation metric is introduced in the classification phase of the proposed approach, where the defects are classified into one of the six classes of defects. So, the CM is of 6 × 6 size in this study and depicts six classes of defects. The general representation of the CM is shown in Figure 4.
In this study, the AP and mAP for evaluation of the steel surface defect detection are used [51]. The AP is calculated from the graph plotted between precision and recall values. We can obtain the AP using Equation (1), which is as follows:
AP = k = 0 k = n 1 [ R ( k ) R ( k + 1 ) ] P ( k )
where n is the number of thresholds, R is recalls and P is precisions.
The precision and recall are computed by the Equations of (2) and (3), respectively.
Precision = TP TP + FP
Recall = TP TP + FN
The mAP is the mean of all the AP calculated for the individual classes.
mAP = 1 c   k = 1 k = c AP k
where APk is the average precision of class k and c is the number of classes.

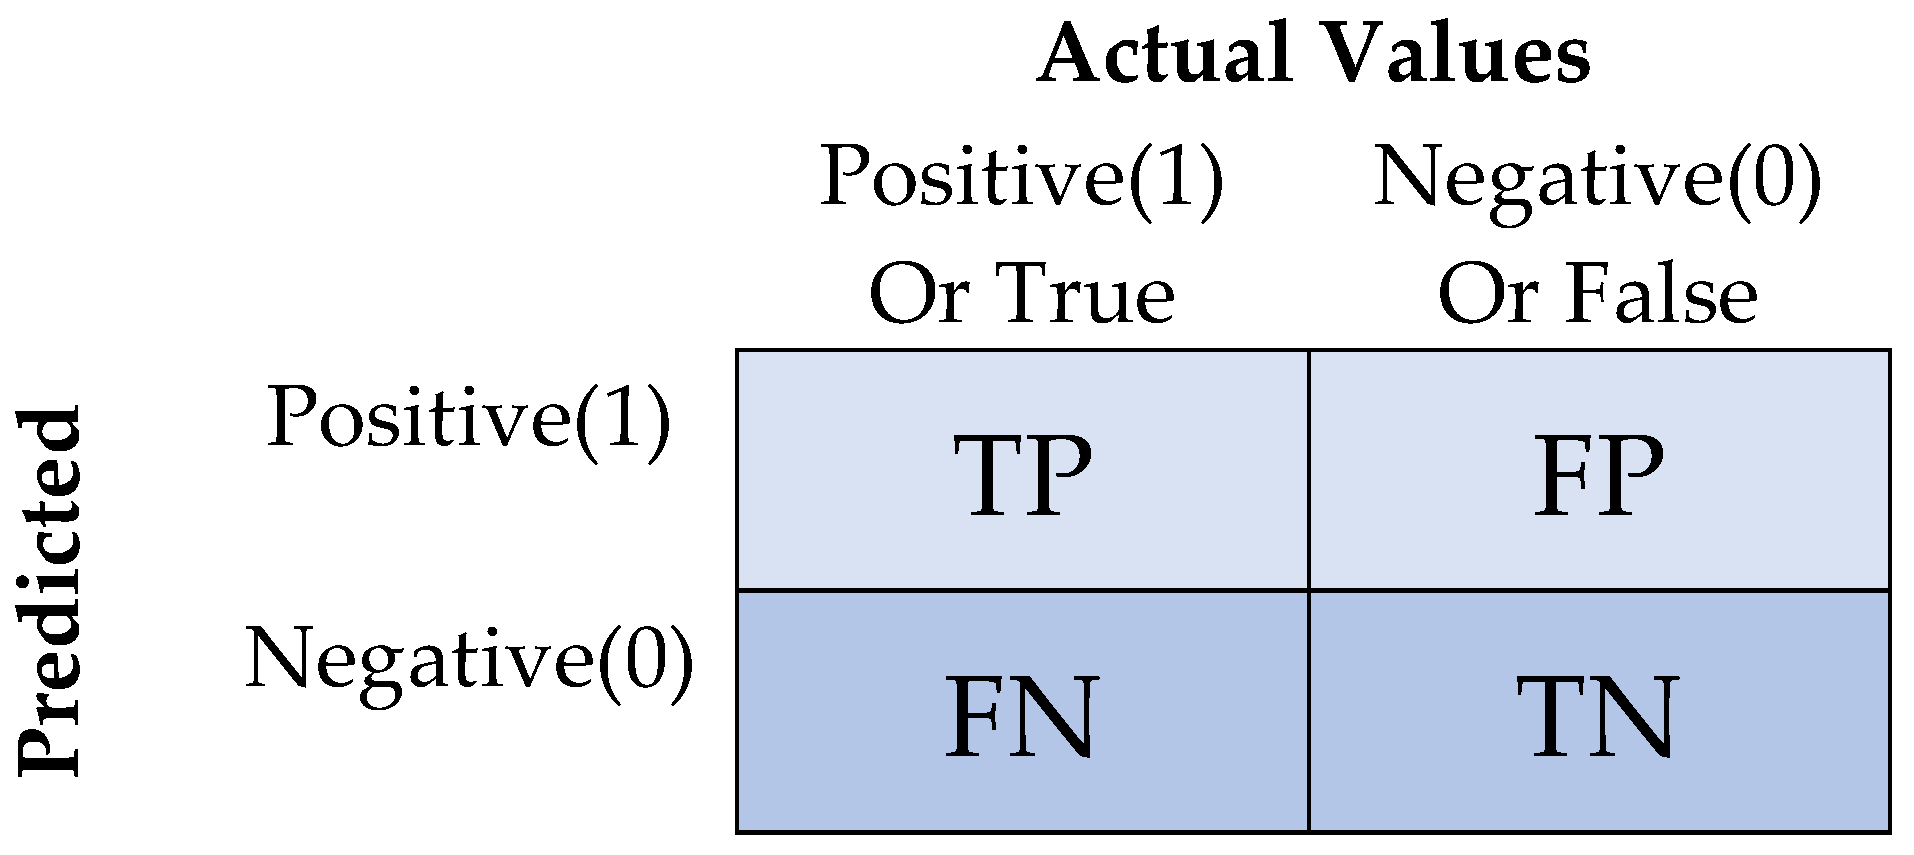
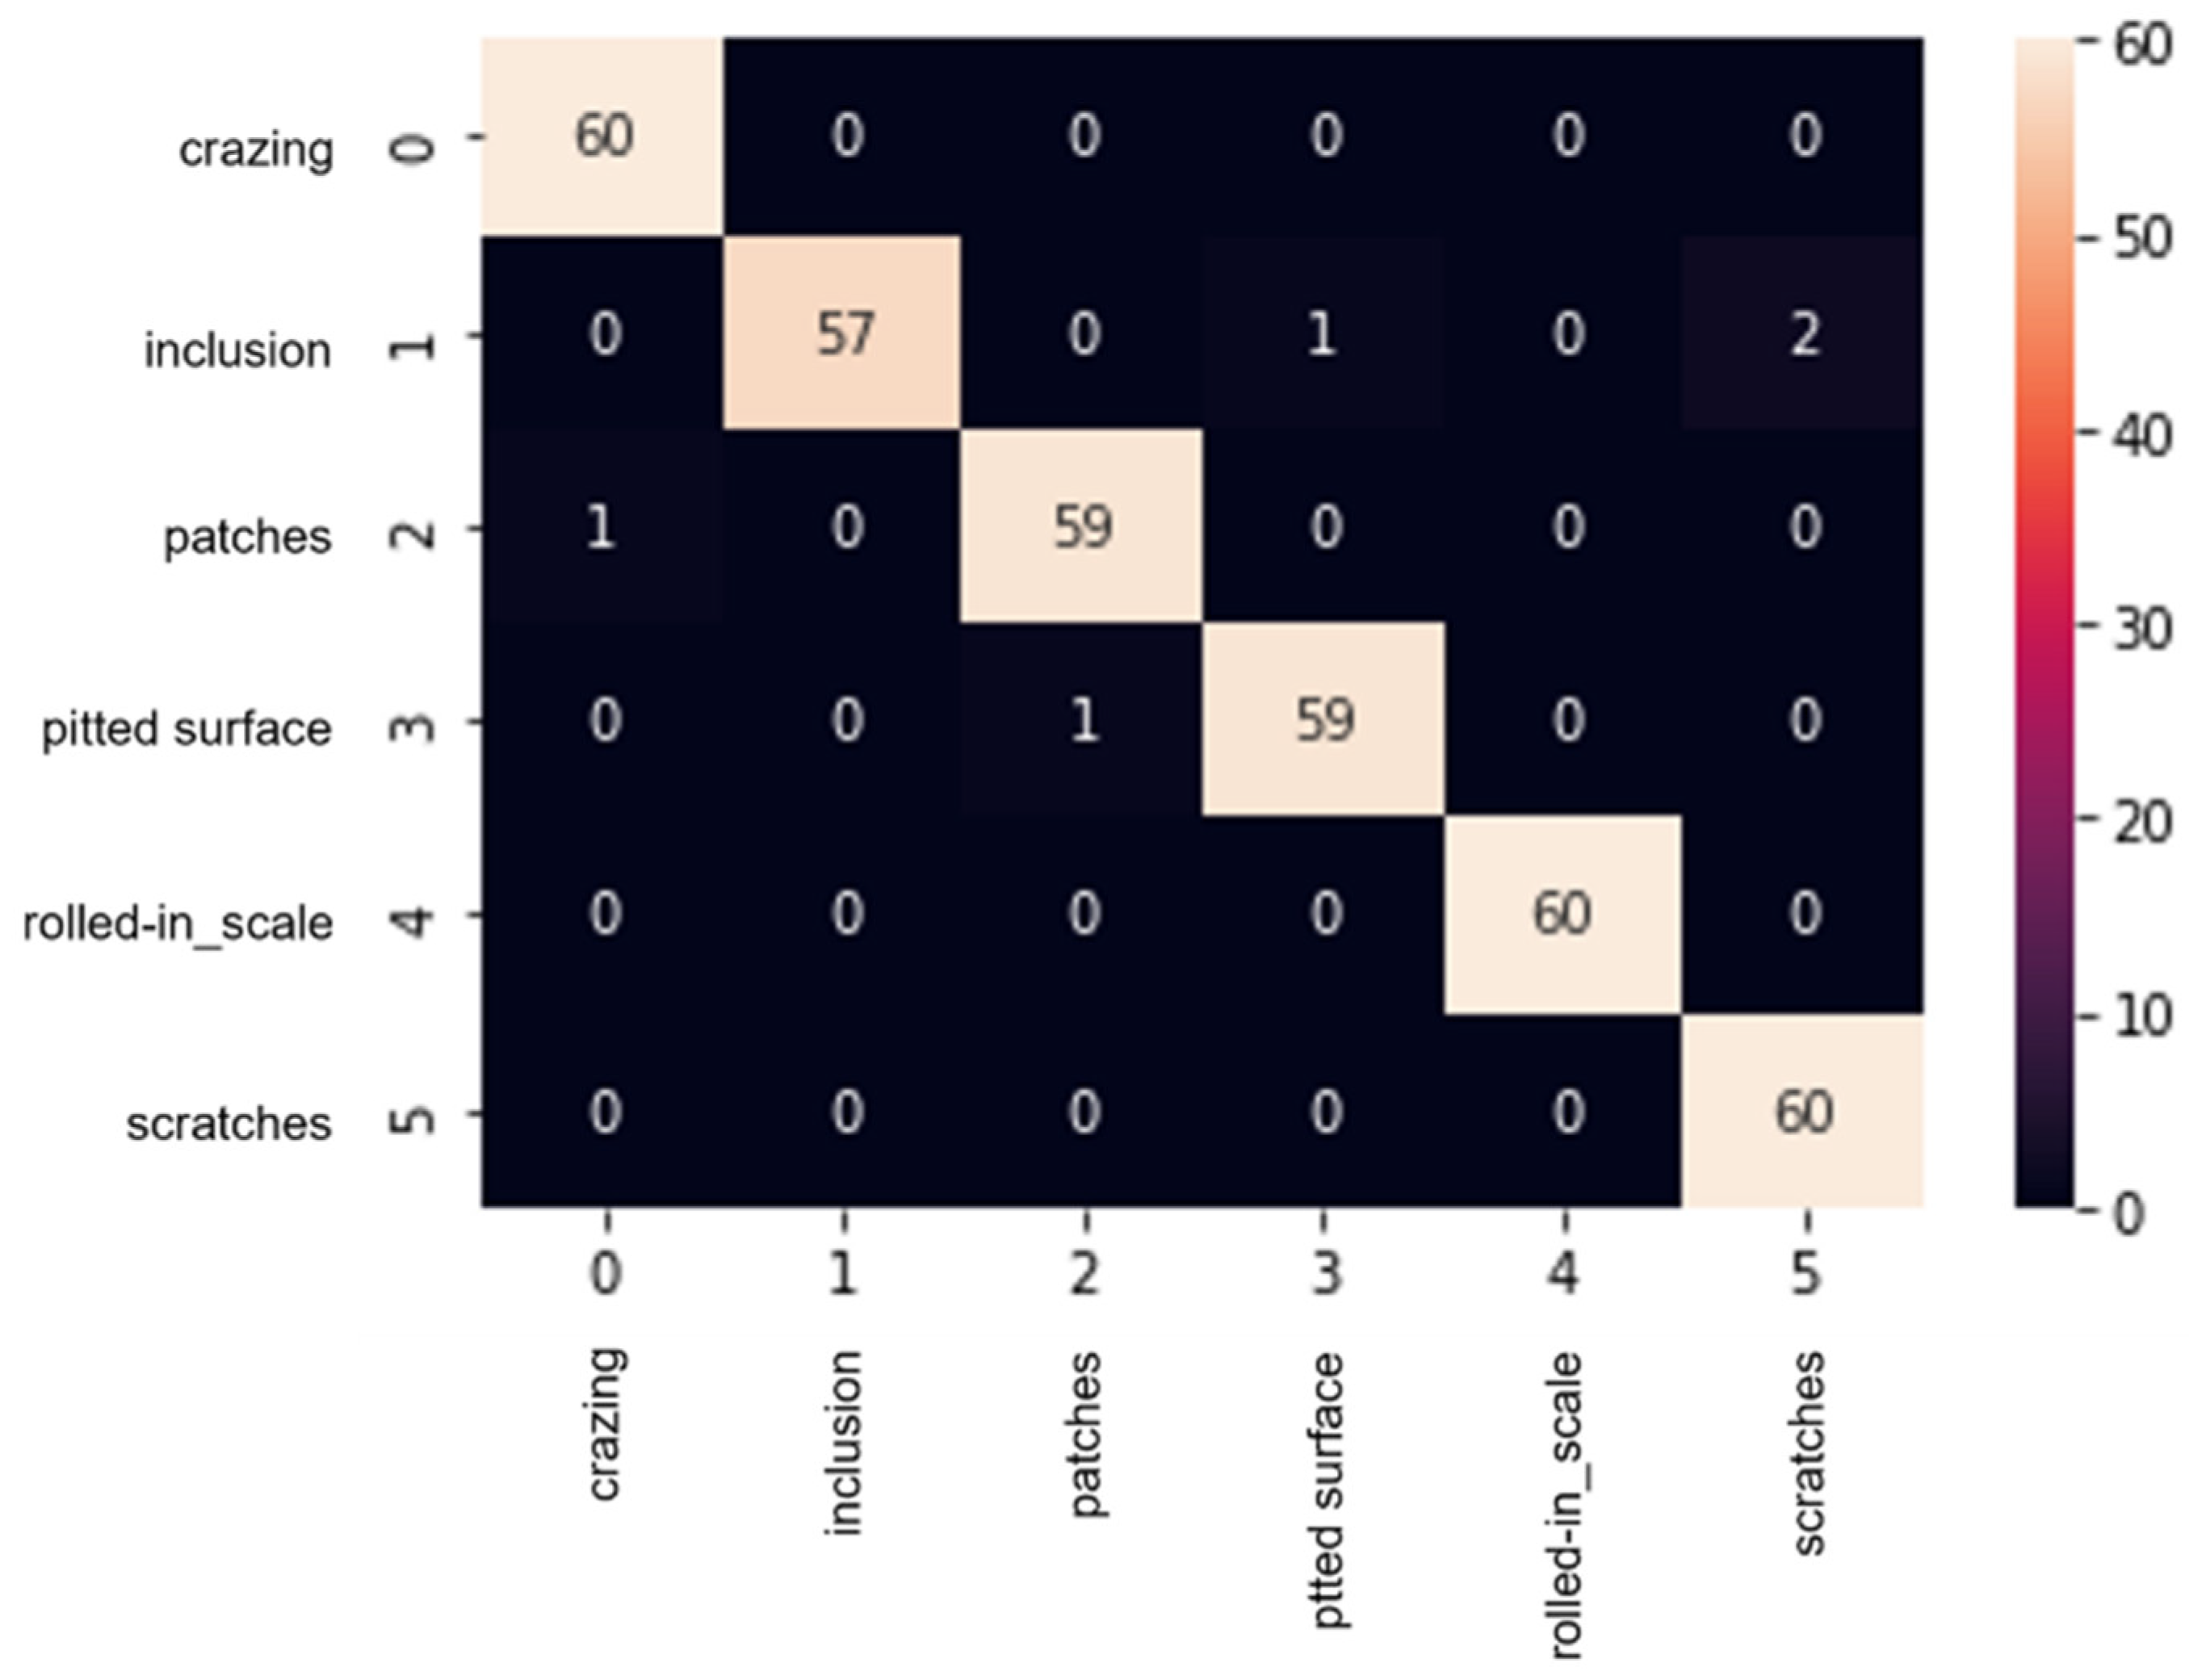
4.2. Evaluation of the Defect Image Classification and Defect Detection

The classification of the dataset was distinguished. The accuracy score for defect classification was 98.6%. Figure 5 presents the CM of the six defects classified. Crazing, rolled-in scale and scratches were classified at 100%. For the inclusion defect, one image was classified as pitted surface and two images as scratches. In the case of patches and pitted surface, only one image was incorrectly classified, respectively. The patches image is classified as pitted surface, and the pitted surface image is classified as patches. The proposed classification model performed quite well and was effective.
Through the evaluation process, we combined the two disparate models. The evaluation metric used in this paper is AP and mAP. The AP of individual defects is evaluated and the mAP of all six defects is calculated. Table 2 exhibits the AP of individual defects during the evaluation process.

4.3. Comparison of Average Precision with Traditional Methods

Xiaoming Lv et al. [20] provided significant and valuable research results on steel surface defects. They presented the performance evaluations of steel surface defect detection with traditional ML algorithms on the NEU dataset. In this section, we provide a comparison between the proposed method and the traditional methods, which are HOG and LBP with two classifiers, neighbor classifier (NNC) and a support vector machine (SVM), based on the experimental results in [20]. Table 3 illustrates the outperformance of the proposed method with the other traditional models on all defects. Figure 6 displays the overall mAP compared to the other traditional approaches. The graph shows that the proposed approach is the best among all the traditional approaches by a 30% margin.

4.4. Comparison of Average Precision with Deep Learning Methods

This section shows the comparison among diverse deep learning methods used in the field of defect detection. The paper [20] also provided the performance evaluation of the state-of-the-art methods. Based on the experimental results in their work, the comparison between our method and the state-of-the-art methods, which are SSD, Faster-RCNN, YOLO-V2, YOLO-V3, EDDN, and Xception, is shown in Table 4. The table shows how our method performed well for defects such as patches, crazing, rolled-in scale, and pitted surfaces. Although the proposed method scored lower in scratch and inclusion, the overall mAP of the proposed model is the best among the other state-of-the-art methods. The Figure 7 displays the overall mAP compared to the other approaches. The figure asserts that the proposed model performance is better than the others by a 5% difference.

4.5. Detection Results

The detection results of the test data are displayed in Figure 8. The figure shows the original image, the GT annotation and the predicted image. The predicted image’s similarity with the GT images can be observed. The proposed model detected images with acceptable accuracy and performed quite well. For scratch detection, the model was able to detect weak scratches. Although the GT mask did not provide the weak scratch information, the proposed model can still predict it, and the result is better than the GT mask image.
Figure 9 shows the incorrectly detected images of all the defects. Various reasons are to blame for false detection, firstly the inter-class similarity and the intra-class diversity of the dataset. Secondly, for some images, annotation files are not apt. The limited number of anchor boxes in RetinaNet is not provided, especially for very small or very long defects. In some images, it is difficult to distinguish between the foreground and the background parts of the image, which made the model confused during detection. One of the main reasons is the less availability of datasets for training. In segmentation detection, the boundary of the scratch defect is not clear or distinct, which leads to unacceptable segmentation. The faint boundaries of the defects cause the detection of the defect incorrectly.

5. Analysis and Discussion

The proposed model performed relatively well compared with the state-of-the-art method. The XGBoost classifier achieves outstanding classification accuracy of 98.6%. The classification result is presented by a CM, which shows that crazing, rolled-in scale and scratches are classified at 100%, patches and pitted surface classification is around 98%, and inclusion classification is 95%. The model is compared with the traditional methods and state-of-the-art deep learning models. In Table 3, it can be observed that the proposed model performed extraordinarily well. The feature extraction of traditional methods is limited and is not sufficient enough to detect the defects properly. Figure 6 shows that the mAP of the proposed method is around 30% higher than the traditional methods. Regarding the state-of-the-art method, the proposed model performed well on the pitted surfaces, crazing, patches, and rolled-in scale. Although the SSD model performed well in inclusion, our result is still acceptable. In scratches, although our model shows less compared to other models, it is still better because the proposed model can detect strong, as well as weak, scratches. Furthermore, the information about weak scratch is not provided in the GT image; thus, this shows the model’s efficiency. The YOLO-V2, YOLO-V3, and Faster-RCNN model performed poorly in the detection of crazing and pitted surface defects because crazing and pitted surfaces are small-scale defects, and this model focuses on high-level features with a fixed detection scale, with leads to low detection rate. The overall detection accuracy of the model is better than the others, with 77.12% mAP. The detection visualization of the proposed model is shown in Figure 8, where the GT image and the predicted results are completely matching, with an impressive score. Although the model achieves promising outcomes, some defects were still left undetected, as shown in Figure 9. Various conditions can result in undetected images. Firstly, with defects such as crazing, and rolled-in scale, the difference between the foreground defect and background is fuzzy. When defects are narrow and blend with the background, it is not easy to detect them. With the limited set of anchor boxes, some defects, such as inclusion, are difficult to detect as the anchor box requires that some images in inclusion are narrow and elongated. The dataset also lacks proper annotations for some defects and suffers from the illumination factor.

6. Conclusions

Steel surface defect detection is a very difficult task, due to various atypical defects. In this study, we propose a hierarchical method for detecting various atypical defects on steel surfaces. We divided the steel surface defect detection into object detection problems and object segmentation problems according to the type of defect. We defined the detection of pitted surface, inclusion, patches, rolled-in scale, and crazing as an object detection problem because these kinds of defects have characteristics of objects, such as closed boundary, different appearance and uniqueness. Scratch detection is defined as an image segmentation problem, since it has a very thin and elongated shape. In order to apply different defect detection methods according to the defect types, the proposed approach hierarchically combines a classifier with object recognition and an image segmentation algorithm. The proposed model classifies defect images as scratch images or other defect images in the first step. In the second step, object detection or image segmentation algorithms are applied according to the classification result of the first step. The proposed method is able to detect steel surface defects with high accuracy by applying different detection algorithms that are suitable for each defect type. To summarize the experimental and verification results, the proposed approach achieves 98.6% accuracy in scratch and other types of defect classification and 77.12% mAP in defect detection using the NEU dataset. In future studies, we will conduct a study on scratch detection for simultaneously detecting both strong and weak scratches.

Author Contributions

Conceptualization, M.S., J.L. and H.L.; methodology, M.S. and H.L.; software, M.S.; validation, M.S., J.L. and H.L.; formal analysis, H.L.; investigation, M.S. and H.L.; resources, J.L.; data curation, M.S. and H.L.; writing—original draft preparation, M.S. and H.L.; writing—review and editing, M.S., J.L. and H.L.; visualization, M.S.; supervision, J.L.; project administration, H.L.; funding acquisition, H.L. All authors have read and agreed to the published version of the manuscript.

Funding

This research was supported by the MIST (Ministry of Science, ICT), Korea, under the National Program for Excellence in SW, supervised by the IITP (Institute of Information and communications Technology Planning and Evaluation) in 2022 (2019-0-01113).

Institutional Review Board Statement

Not applicable.

Informed Consent Statement

Not applicable.

Data Availability Statement

Not applicable.

Conflicts of Interest

The authors declare no conflict of interest.

Nomenclature

NEUNortheastern University
mAPMean average precision
AIArtificial intelligence
HOGHistogram of oriented gradient
LBPLocal binary pattern
EDDNEnd-to-end defect detection network
SSDSingle shot multibox detector
CNNConvolutional neural network
VGGVisual geometry group
DDNDefect detection network
ResNetResidual neural network
Faster-RCNNRegion-based convolutional neural network
YOLOYou Only Look Once
FCNFully convolutional network
IoUIntersection over union
PFFPyramid feature fusion
GCAGlobal context attention
DANDual attention network
TAS-NetTriple attention semantic segmentation network
TLU-NetTransfer learning-based UNet
GTGroundtruth
XGBoostExtreme gradient boosting
MLMachine learning
FPNFeature pyramid network
ReLURectified linear unit
DSSDDeconvolutional single shot detector
CMConfusion matrix
APAverage precision
SVMSupport vector machine
NNCNeighbor classifier
mIoUMeanIoU

References

  1. Dai, W.; Li, D.; Tang, D.; Jiang, Q.; Wang, D.; Wang, H.; Peng, Y. Deep learning assisted vision inspection of resistance spot welds. J. Manuf. Process 2021, 62, 262–274. [Google Scholar] [CrossRef]
  2. Saif, Y.; Yusof, Y.; Latif, K.; Kadir, A.Z.A.; Ahmad, M.B.I.; Adam, A.; Hatem, N. Development of a smart system based on STEP-NC for machine vision inspection with IoT environmental. Int. J. Adv. Manuf. 2022, 118, 4055–4072. [Google Scholar] [CrossRef]
  3. Muresan, M.P.; Cireap, D.G.; Giosan, I. Automatic vision inspection solution for the manufacturing process of automotive components through plastic injection molding. In Proceedings of the 16th International Conference on Intelligent Computer Communication and Processing (ICCP), Cluj-Napoca, Romania, 3–5 September 2020. [Google Scholar]
  4. Wang, J.; Fu, P.; Gaob, R.X. Machine vision intelligence for product defect inspection based on deep learning and Hough transform. J. Manuf. Syst. 2019, 51, 52–60. [Google Scholar] [CrossRef]
  5. Moru, D.K.; Borro, D. A machine vision algorithm for quality control inspection of gears. Int. J. Adv. Manuf. 2020, 106, 105–123. [Google Scholar] [CrossRef]
  6. Win., M.; Bushroa, A.R.; Hassan, M.A.; Hilman, N.M.; Ide-Ektessabi, A. A contrast adjustment thresholding method for surface defect detection based on mesoscopy. IEEE Trans. Ind. Inform. 2015, 11, 642–649. [Google Scholar] [CrossRef]
  7. Chetverikov, D. Structural defects: General approach and application to textile inspection. In Proceedings of the 15th International Conference on Pattern Recognition (ICPR), Barcelona, Spain, 3–7 September 2000. [Google Scholar]
  8. Chondronasios, A.; Popov, I.; Jordanov, I. Feature selection for surface defect classification of extruded aluminum profiles. Int. J. Adv. Manuf. Technol. 2016, 83, 33–41. [Google Scholar] [CrossRef]
  9. Shumin, D.; Zhoufeng, L.; Chunlei, L. AdaBoost learning for fabric defect detection based on HOG and SVM. In Proceedings of the 2011 International Conference on Multimedia Technology (ICMT), Hangzhou, China, 26–28 July 2011. [Google Scholar]
  10. Song, K.; Yan, Y. A noise robust method based on completed local binary patterns for hot-rolled steel strip surface defects. Appl. Surf. Sci. 2013, 285, 858–864. [Google Scholar] [CrossRef]
  11. Tsanakas, J.A.; Chrysostomou, D.; Botsaris, P.N.; Gasteratos, A. Fault diagnosis of photovoltaic modules through image processing and Canny edge detection on field thermographic measurements. Int. J. Sustain. Energy 2015, 34, 351–372. [Google Scholar] [CrossRef]
  12. Tastimur, C.; Yetis, H.; Karakös, M.; Akin, E. Rail defect detection and classification with real time image processing technique. Int. J. Comput. Sci. Softw. Eng. 2016, 5, 283–290. [Google Scholar]
  13. Mak, K.L.; Peng, P.; Yiu, K.F.C. Fabric defect detection using morphological filters. Image Vis. Comput. 2009, 27, 1585–1592. [Google Scholar] [CrossRef]
  14. Bai, X.; Fang, Y.; Lin, W.; Wang, L.; Ju, B. Saliency-Based Defect Detection in Industrial Images by Using Phase Spectrum. IEEE Trans. Ind. Inform. 2014, 10, 2135–2145. [Google Scholar] [CrossRef]
  15. Hu, G.H. Automated defect detection in textured surfaces using optimal elliptical Gabor filters. Optik 2015, 126, 1331–1340. [Google Scholar] [CrossRef]
  16. Borwankar, R.; Ludwig, R. An Optical Surface Inspection and Automatic Classification Technique Using the Rotated Wavelet Transform. IEEE Trans. Instrum. Meas. 2018, 67, 690–697. [Google Scholar] [CrossRef]
  17. Mandelbrot, B.B. The Fractal Geometry of Nature; WH Freeman: New York, NY, USA, 1982; Volume 1. [Google Scholar]
  18. Kindermann, R. Markov random fields and their applications. Am. Math. Soc. 1980, 97, 3923–3931. [Google Scholar]
  19. Hajimowlana, S.H.; Muscedere, R.; Jullien, G.A.; Roberts, J.W. 1D autoregressive modeling for defect detection in web inspection systems. In Proceedings of the 1998 Midwest Symposium on Circuits and Systems (Cat. No. 98CB36268) (MWSCAS), Notre Dame, IN, USA, 9–12 August 1998. [Google Scholar]
  20. Lv, X.; Duan, F.; Jiang, J.J.; Fu, X.; Gan, L. Deep Metallic Surface Defect Detection: The New Benchmark and Detection Network. Sensors 2020, 20, 1562. [Google Scholar] [CrossRef] [PubMed] [Green Version]
  21. Fadli, V.F.; Herlistiono, I.O. Steel Surface Defect Detection using Deep Learning. Int. J. Innov. Sci. Res. Technol. 2020, 5, 244–250. [Google Scholar] [CrossRef]
  22. Liu, Y.; Geng, J.; Su, Z.; Zhang, W.; Li, J. Real-time classification of steel strip surface defects based on deep CNNs. In Proceedings of the 2018 Chinese Intelligent Systems Conference (CISC), Wenzhou, China, 4 October 2018. [Google Scholar]
  23. Andrei-Alexandru, T.; Henrietta, D.E. Low cost defect detection using a deep convolutional neural network. In Proceedings of the IEEE International Conference on Automation, Quality and Testing, Robotics (AQTR), Cluj-Napoca, Romania, 21–23 May 2020. [Google Scholar]
  24. Simonyan, K.; Zisserman, A. Very deep convolutional networks for large-scale image recognition. In Proceedings of the International Conference of Learning Representations (ICLR), San Diego, CA, USA, 7–9 May 2015. [Google Scholar]
  25. He, Y.; Song, K.; Meng, Q.; Yan, Y. An end-to-end steel surface defect detection approach via fusing multiple hierarchical features. IEEE Trans. Instrum. Meas. 2020, 69, 1493–1504. [Google Scholar] [CrossRef]
  26. He, K.; Zhang, X.; Ren, S.; Sun, J. Deep residual learning for image recognition. In Proceedings of the IEEE Conference on Computer Vision and Pattern Recognition (CVPR), Las Vegas, NV, USA, 27–30 June 2016. [Google Scholar]
  27. Li, K.; Wang, X.; Ji, L. Application of multi-scale feature fusion and deep learning in detection of steel strip surface defect. In Proceedings of the IEEE International Conference on Artificial Intelligence and Advance Manufacturing (AIAM), Dublin, Ireland, 16–18 October 2019. [Google Scholar]
  28. Ren, S.; He, K.; Girshick, R.; Sun, J. Faster R-CNN: Towards Real-Time Object Detection with Region Proposal Networks. In Proceedings of the Advances in Neural Information Processing Systems 28 (NIPS 2015), Montréal, QC, Canada, 7–12 December 2015; Curran Associates, Inc.: New York, NY, USA, 2015. [Google Scholar]
  29. Sermanet, P.; Eigen, D.; Zhang, X.; Mathieu, M.; Fergus, R.; LeCun, Y. Overfeat: Integrated recognition, localization and detection using convolutional networks. arXiv 2013, arXiv:1312.6229. [Google Scholar]
  30. Liu, W.; Anguelov, D.; Erhan, D.; Szegedy, C.; Reed, S.; Fu, C.Y.; Berg, A.C. SSD: Single Shot Multibox Detector. In Proceedings of the Eu. Conf. on Comp. Vis. (ECCV), Amsterdam, The Netherlands, 17 September 2016; Springer: Cham, Switzerland, 2016. [Google Scholar]
  31. Redmon, J.; Farhadi, A. YOLO9000: Better, Faster, Stronger. In Proceedings of the IEEE Conference on Computer Vision and Pattern Recognition (CVPR), Honolulu, HI, USA, 21–26 July 2017. [Google Scholar]
  32. Le, J.; Su, Z.; Geng, J.; Yin, Y. Real-time detection of steel strip surface defects based on improved YOLO detection network. IFAC-PapersOnLine 2018, 51, 76–81. [Google Scholar]
  33. Redmon, J.; Farhadi, A. Yolov3: An incremental improvement. arXiv 2018, arXiv:1804.02767. [Google Scholar]
  34. Zhang, J.; Kang, X.; Ni, H.; Ren, F. Surface defect detection of steel strips based on classification priority YOLOv3-dense network. Ironmak. Steelmak. 2021, 48, 547–558. [Google Scholar] [CrossRef]
  35. Youkachen, S.; Ruchanurucks, M.; Phatrapomnant, T.; Kaneko, H. Defect Segmentation of Hot-rolled Steel Strip Surface by using Convolutional Auto-Encoder and Conventional Image processing. In Proceedings of the 10th International Conference on Information and Communication Technology for Embedded System (IC-ICTES), Bangkok, Thailand, 25–27 March 2019. [Google Scholar]
  36. Wu, H.; Lv, Q. Hot-Rolled Steel Strip Surface Inspection Based on Transfer Learning Model. J. Sens. 2021, 2021, 8. [Google Scholar] [CrossRef]
  37. Enshaei, N.; Ahmad, S.; Naderkhani, F. Automated detection of textured-surface defects using UNet-based semantic segmentation network. In Proceedings of the IEEE International Conference on Prognostics and Health Management (ICPHM), Detroit, MI, USA, 8–10 June 2020. [Google Scholar]
  38. Neven, R.; Goedemé, T. A Multi-Branch U-Net for Steel Surface Defect Type and Severity Segmentation. Metals 2021, 11, 870. [Google Scholar] [CrossRef]
  39. Huang, Z.; Wu, J.; Xie, F. Automatic surface defect segmentation for hot-rolled steel strip using depth-wise separable U-shape network. Mater. Lett. 2021, 301, 130271. [Google Scholar] [CrossRef]
  40. Wang, K.; Wang, Y.; Zhou, L.; Wang, Z.; Zhang, G. A New Method of Surface Defect Semantic Segmentation of Steel Ball Based on Pre-Trained U-Net Model. In Proceedings of the IEEE International Conference on Computer Science, Electronic Information Engineering and Intelligent Control Technlogy (CEI), Fuzhou, China, 24–26 September 2021. [Google Scholar]
  41. Dong, H.; Song, K.; He, Y.; Xu, J.; Yan, Y.; Meng, Q. PGA-Net: Pyramid Feature Fusion and Global Context Attention Network for Automated Surface Defect Detection. IEEE Trans. Ind. Inf. 2020, 16, 7448–7458. [Google Scholar] [CrossRef]
  42. Pan, Y.; Zhang, L. Dual attention deep learning network for automatic steel surface defect segmentation. Comput.-Aided Civ. Infrastruct. Eng. 2021. [Google Scholar] [CrossRef]
  43. Liu, T.; He, Z. TAS2-Net: Triple Attention Semantic Segmentation Network for Small Surface Defect Detection. IEEE Trans. Instrum. Meas. 2022, 71, 5004512. [Google Scholar] [CrossRef]
  44. Damacharla, P.; Rao, M.V.A.; Ringenberg, J.; Javaid, A.Y. IEEE TLU-Net: A Deep Learning Approach for Automatic Steel Surface Defect Detection. In Proceedings of the International Conference on Applied Artificial Intelligence (ICAPAI), Halden, Norway, 19–21 May 2021. [Google Scholar]
  45. Ali, A.A.; Chramcov, B.; Jasek, R.; Katta, R.; Krayem, S.; Kadi, M.; Silhavy, R.; Silhavy, P.; Prokopova, Z. Detection of Steel Surface Defects Using U-Net with Pre-trained Encoder. In Software Engineering Application in Informatics; Springer: Cham, Switzerland, 2021. [Google Scholar]
  46. Chen, T.; Guestrin, C. Xgboost: A scalable tree boosting system. In Proceedings of the 22nd ACM SIGKDD International Conference on Knowledge Discovery and Data Mining (KDD’16), San Francisco, CA, USA, 13–17 August 2016. [Google Scholar]
  47. Lin, T.Y.; Goyal, P.; Girshick, R.; He, K.; Dollár, P. Focal Loss for Dense Object Detection. IEEE Trans. Pattern Anal. Mach. Intelligence 2020, 42, 318–327. [Google Scholar] [CrossRef] [Green Version]
  48. Lin, T.Y.; Dollar, P.; Girshick, R.; He, K.; Hariharan, B.; Belongie, S. Feature Pyramid Networks for Object Detection. In Proceedings of the 2017 IEEE Conference on Computer Vision and Pattern Recognition (CVPR), Honolulu, HI, USA, 21–26 July 2017. [Google Scholar]
  49. Ronneberger, O.; Fischer, P.; Brox, T. U-Net: Convolutional Networks for Biomedical Image Segmentation. In Medical Image Computing and Computer-Assisted Intervention—MICCAI 2015; Springer: Cham, Switzerland, 2015. [Google Scholar]
  50. Hossin, M.; Sulaiman, M.N. A review on evaluation metrics for data classification evaluations. Int. J. Data Min. Knowl. Manag. Process 2015, 5, 1–11. [Google Scholar]
  51. Padilla, R.; Netto, S.L.; DaSilva, E.A. A survey on performance metrics for object-detection algorithms. In Proceedings of the International Conference on Systems, Signals and Image Processing (IWSSIP), Niteroi, Brazil, 1–3 July 2020. [Google Scholar]
Figure 1. The overall architecture of the proposed approach.
Applsci 12 06004 g001
Figure 2. Block diagram of feature pyramid network (FPN).
Applsci 12 06004 g002
Figure 3. The UNet architecture for the scratch defect detection.
Applsci 12 06004 g003
Figure 4. Confusion matrix representation. TP = true positive, FP = false positive, FN = false negative and TN = true negative.
Applsci 12 06004 g004
Figure 5. Confusion matrix of classification of six defects.
Applsci 12 06004 g005
Figure 6. Comparison of mean average precision of traditional models with ours.
Applsci 12 06004 g006
Figure 7. Comparison of mean average precision of deep learning models with ours.
Applsci 12 06004 g007
Figure 8. Correct detection of (a) crazing (b) inclusion (c) patches (d) pitted surface (e) rolled-in scale (f) scratches defects, including test image, GT image and predicted image.
Applsci 12 06004 g008
Figure 9. Incorrect detection of (a) crazing (b) inclusion (c) patches (d) pitted surface (e) rolled-in scale (f) scratches defects, including test image, GT image and predicted image.
Applsci 12 06004 g009
Table 1. Comparison between the three feature extractor models.
Feature ExtractorVGG16VGG19ResNet50
Accuracy98.697.292.2
Table 2. Average precision of individual defects.
Average Precision
Pitted Surface0.8504
Inclusion0.7117
Patches0.8987
Rolled-in Scale0.6794
Crazing0.6928
Scratches0.7942
Table 3. Comparison of average precision between traditional models and the proposed method.
DefectsHOG + NNC [20]HOG + SVM [20]LBP + NNC [20]LBP + SVM [20]Proposed Method
Pitted Surface0.4380.3280.4460.5150.8504
Inclusion0.5760.5800.4120.3780.7117
Patches0.6120.6300.5380.6010.8987
Rolled-in Scale0.3580.3300.2370.3300.6794
Crazing0.4000.4120.3210.3350.6928
Scratches0.4740.4630.3260.4320.7942
Table 4. Comparison of average precision between deep learning models and the proposed method.
DefectsSSD [20]Faster-RCNN [20]YOLO-V2 [20]YOLO-V3 [20]EDDN [20]Xception [21]Proposed Method
Pitted Surface0.8390.8150.4540.2390.8510.750.8504
Inclusion0.7960.7940.5920.5800.7630.500.7117
Patches0.8390.8530.7740.7720.8630.670.8987
Rolled-in Scale0.6210.5450.2460.3350.581N/A0.6794
Crazing0.4110.3740.2110.2210.417N/A0.6928
Scratches0.8360.8820.7390.5700.8560.930.7942
Publisher’s Note: MDPI stays neutral with regard to jurisdictional claims in published maps and institutional affiliations.

