Article

Effect of Rehabilitation on Brain Functional Connectivity in a Stroke Patient Affected by Conduction Aphasia

Department of Civil, Energy, Environmental and Materials Engineering (DICEAM), Mediterranea University of Reggio Calabria, Via Graziella Feo di Vito, 89060 Reggio Calabria, Italy
*
Author to whom correspondence should be addressed.
Appl. Sci. 2022, 12(12), 5991; https://doi.org/10.3390/app12125991
Submission received: 28 April 2022 / Revised: 31 May 2022 / Accepted: 10 June 2022 / Published: 13 June 2022

Abstract

:
Stroke is a medical condition that affects the brain and represents a leading cause of death and disability. Associated with drug therapy, rehabilitative treatment is essential for promoting recovery. In the present work, we report an EEG-based study concerning a left ischemic stroke patient affected by conduction aphasia. Specifically, the objective is to compare the brain functional connectivity before and after an intensive rehabilitative treatment. The analysis was performed by means of local and global efficiency measures related to the execution of three tasks: naming, repetition and reading. As expected, the results showed that the treatment led to a balancing of the values of both parameters between the two hemispheres since the rehabilitation contributed to the creation of new neural patterns to compensate for the disrupted ones. Moreover, we observed that for both name and repetition tasks, shortly after the stroke, the global and local connectivity are lower in the affected lobe (left hemisphere) than in the unaffected one (right hemisphere). Conversely, for the reading task, global and local connectivity are higher in the impaired lobe. This apparently contrasting trend can be due to the effects of stroke, which affect not only the site of structural damage but also brain regions belonging to a functional network. Moreover, changes in network connectivity can be task-dependent. This work can be considered a first step for future EEG-based studies to establish the most suitable connectivity measures for supporting the treatment of stroke and monitoring the recovery process.

1. Introduction

Stroke is a leading cause of death and disability. Each year, 14 million people suffer their first stroke worldwide, and 80 million people living in the world have experienced it [1]. Stroke is defined by the World Health Organization as a neurological deficit of cerebrovascular cause that persists beyond 24 h or is interrupted by death within 24 h. The 24-h limit differentiates stroke from transient ischemic attack (TIA), which is a temporary cerebral dysfunction related to stroke symptoms characterized by a swift resolution. Stroke can be classified into two main categories: ischemic, caused by a blockage of the blood flow to the brain, and hemorrhagic, due to the rupture of a blood vessel [2]. Both types lead to the dysfunction of the brain areas affected by the stroke. Signs and symptoms of stroke may include numbness, confusion, difficulty in speaking or understanding speech, and loss of balance or coordination. In most cases, the symptoms affect only one side of the body. The effects of stroke can be very different because they depend on the type, severity and location of the lesions. An early detection associated with proper medical treatment is essential for reducing stroke outcomes. Finally, post-stroke rehabilitation represents a very important process for recovering lost function and relearning the skills of everyday life. Even if complete recovery is unusual, rehabilitation can help the patient to regain independence and reintegrate into community life [3].
Conduction aphasia is an acquired language disorder first hypothesized by Carl Wernicke [4]. Conduction aphasia is characterized by intact comprehension and fluent (but paraphasic) speech production, whereas speech repetition is impaired. Therefore, aphasic people produce paraphasic errors and show word-finding difficulty [5]. Conduction aphasia is considered as a disconnection syndrome since it is due to an interruption of communication between anterior and posterior language areas [6]. Lesions usually involve the left cerebral hemisphere, as reported in [7]. Several studies proved that the mechanisms of neuroplasticity lead to recovery from aphasia [8,9]. Moreover, neurophysiological studies revealed that the intra- and inter-hemispheric rearrangement of the linguistic network occurs following a stroke, which involves linguistic areas [10,11]. Finally, the findings of neural reorganization in patients with conduction aphasia have proven the importance of rehabilitative treatment [12,13,14,15].
Graph theory can be conveniently exploited for studying the behavior of brain networks. Brain regions are considered nodes, whereas the edges connecting nodes represent the brain’s functional or structural connectivity between the regions [16]. In particular, the brain’s functional connectivity concerns the functionally integrated relationship between distant brain regions and is expressed in terms of statistical dependencies in the time domain (correlation) and in the frequency domain (coherence) among neurophysiological measurements. Recently, it has been proven that healthy brain networks have a “small-world” architecture, characterized by clustered local connectivity (functional segregation) and short path lengths (functional integration) between nodes [17,18]. Global and local efficiency of a network are two parameters that quantify the performance of a network in information exchange [19] and are related to path lengths and the clustering coefficient, respectively. The higher global and local efficiency, the more efficient the network. Efficiency measures are also more robust in the case of disconnected graphs.
In the present paper, we propose a case study about a patient who suffered from conduction aphasia due to a left ischemic stroke. The purpose is to compare the brain functional connectivity before and after an intensive rehabilitative treatment. The analysis was performed by means of local and global efficiency measures related to the execution of three tasks. As expected, the results showed that the treatment led to a balancing of the values of both parameters between the two hemispheres.

2. Background

The field of EEG-based studies about functional connectivity measures in stroke patients has not yet been deeply explored. Caliandro et al. studied network reorganization after an acute stroke [20]. From a comparison with healthy subjects, the authors found a bilaterally decreased small-worldness in the delta band and bilaterally increased small-worldness in the alpha2 band, regardless of the side of the ischemic lesion. In the theta band, small-worldness decreases bilaterally only in patients with left hemispheric stroke. The study of seven stroke patients reported in [21] showed that when the lesion is not bilateral, the impaired hemisphere has a higher small-worldness than the healthy hemisphere; when the lesion is bilateral, there is no significant difference between small-worldness of the right and left hemisphere. In [22], the authors studied a group of patients with unilateral stroke and found that the motor imagery of the affected hand showed a significantly lower small-worldness and local efficiency as compared to the unaffected hand. Philips et al. carried out a longitudinal analysis of a group of stroke patients undergoing an intensive rehabilitative treatment. Conversely, the study revealed that a reduction in both global and local efficiency in the 12.5–25 Hz band is associated with motor recovery [23].

3. Materials and Methods

3.1. Case Description

This study is concerned with the case of a 50-year-old right-handed female who suffered from conduction aphasia after a left ischemic stroke involving white matter of the fronto-parietal lobe and left temporo-occipital areas. She had surgery to replace the aortic valve with a mechanical prosthesis one week before the stroke. She arrived at the rehabilitative unit of IRCCS Centro Neurolesi Bonino-Pulejo (Messina) one month after the stroke. Neurological, neuropsychological and logopedic assessments were carried out. The patient was attentive, cooperative, and time- and space-oriented. Neurological examination showed a right facio-brachio-crural hemiparesis. The patient followed a drug therapy of oral anticoagulants and antihypertensive. The rehabilitative treatment combined different types of training. In particular: physiotherapeutic training, including balance and gait exercises, Bobath and task-oriented exercises, robotic rehabilitation; neuropsychological training, which provided psychological support to improve the patient’s emotional-behavioral control, strategies to improve patient motivation during rehabilitation, problem-solving strategies; logopedic training, which consisted of sentence repetition therapy, stimulation-facilitation therapy, and group communication treatment. The rehabilitation was carried out every day for a session of 60 min for each type of treatment. The tasks performed during training were different from those used for the assessment before and after the treatment.
EEG data were acquired by means of the 256-channel HydroCel Geodesic Sensor Net, belonging to the Electrical Geodesics (EGI) EEG system (Figure 1). The electrode impedance was kept <50 kΩ, on the basis of EGI guidelines. The reference electrode was Cz, placed in the middle of the scalp. The sampling rate was 250 Hz. The EEG data were band-pass filtered between 1 and 40 Hz by means of EGI’s Net Station EEG software and cleaned from artifacts by visual inspection. The signals from sensors placed on the face and the neck were affected by muscle artifacts, so only 173 electrodes from the starting 256 were considered. In addition, the LORETA-KEY software used for our study required only cephalic (no face, no neck) electrodes to be considered. Finally, the EEG recordings were average referenced and segmented into artifact-free non-overlapping epochs of 1 s. HD-EEG were acquired at baseline (T0) and after a rehabilitative treatment of two months (T1). HD-EEG were recorded while the patient was performing specific language tasks displayed on a computer screen in order to set the time and use a standard method without the influence of external stimuli. The task paradigm was created by means of E-prime 3.0, a leading software for designing, collecting and analyzing data for behavioral research. E-Prime provides a complete environment for building experiments with text, images, sound, and videos through an easy-to-use graphical interface. E-prime provides a millisecond accuracy for subject responses and sound onset times. The EEG recordings were carried out during time blocks consisting of three task periods with alternating rest periods. Specifically, the experimental setup included the following tasks: naming, repetition, and reading. During the naming task, the subject had to mention 24 images, each displayed on the computer screen for 3 s. The images were divided into two groups of 12, alternating with 10 s of rest. The total duration of the naming task is 72 s. The repetition task consisted of repeating 16 words of 5 s, played by speakers. The words were divided into two groups of 8, alternating with 10 s of rest. The total duration of the repetition task was 80 s. The reading task consisted of reading 16 words of 3 s, displayed on the computer screen. The words were divided into two groups of 8, alternating with 10 s of rest. The total duration of the naming task was 48 s. Each task at T0 and the corresponding one at T1 have the same duration. The timing of each above-mentioned event was properly set by the operator during the building of the task blocks with E-prime. Finally, E-prime sent markers to the EGI Net Station based on the onset and end time of each group of stimuli.
The whole procedure was conducted conforming to the related guidelines and regulations. As it is a case study, approval by the local Ethics Committee is not required. The patient signed an informed consent form.

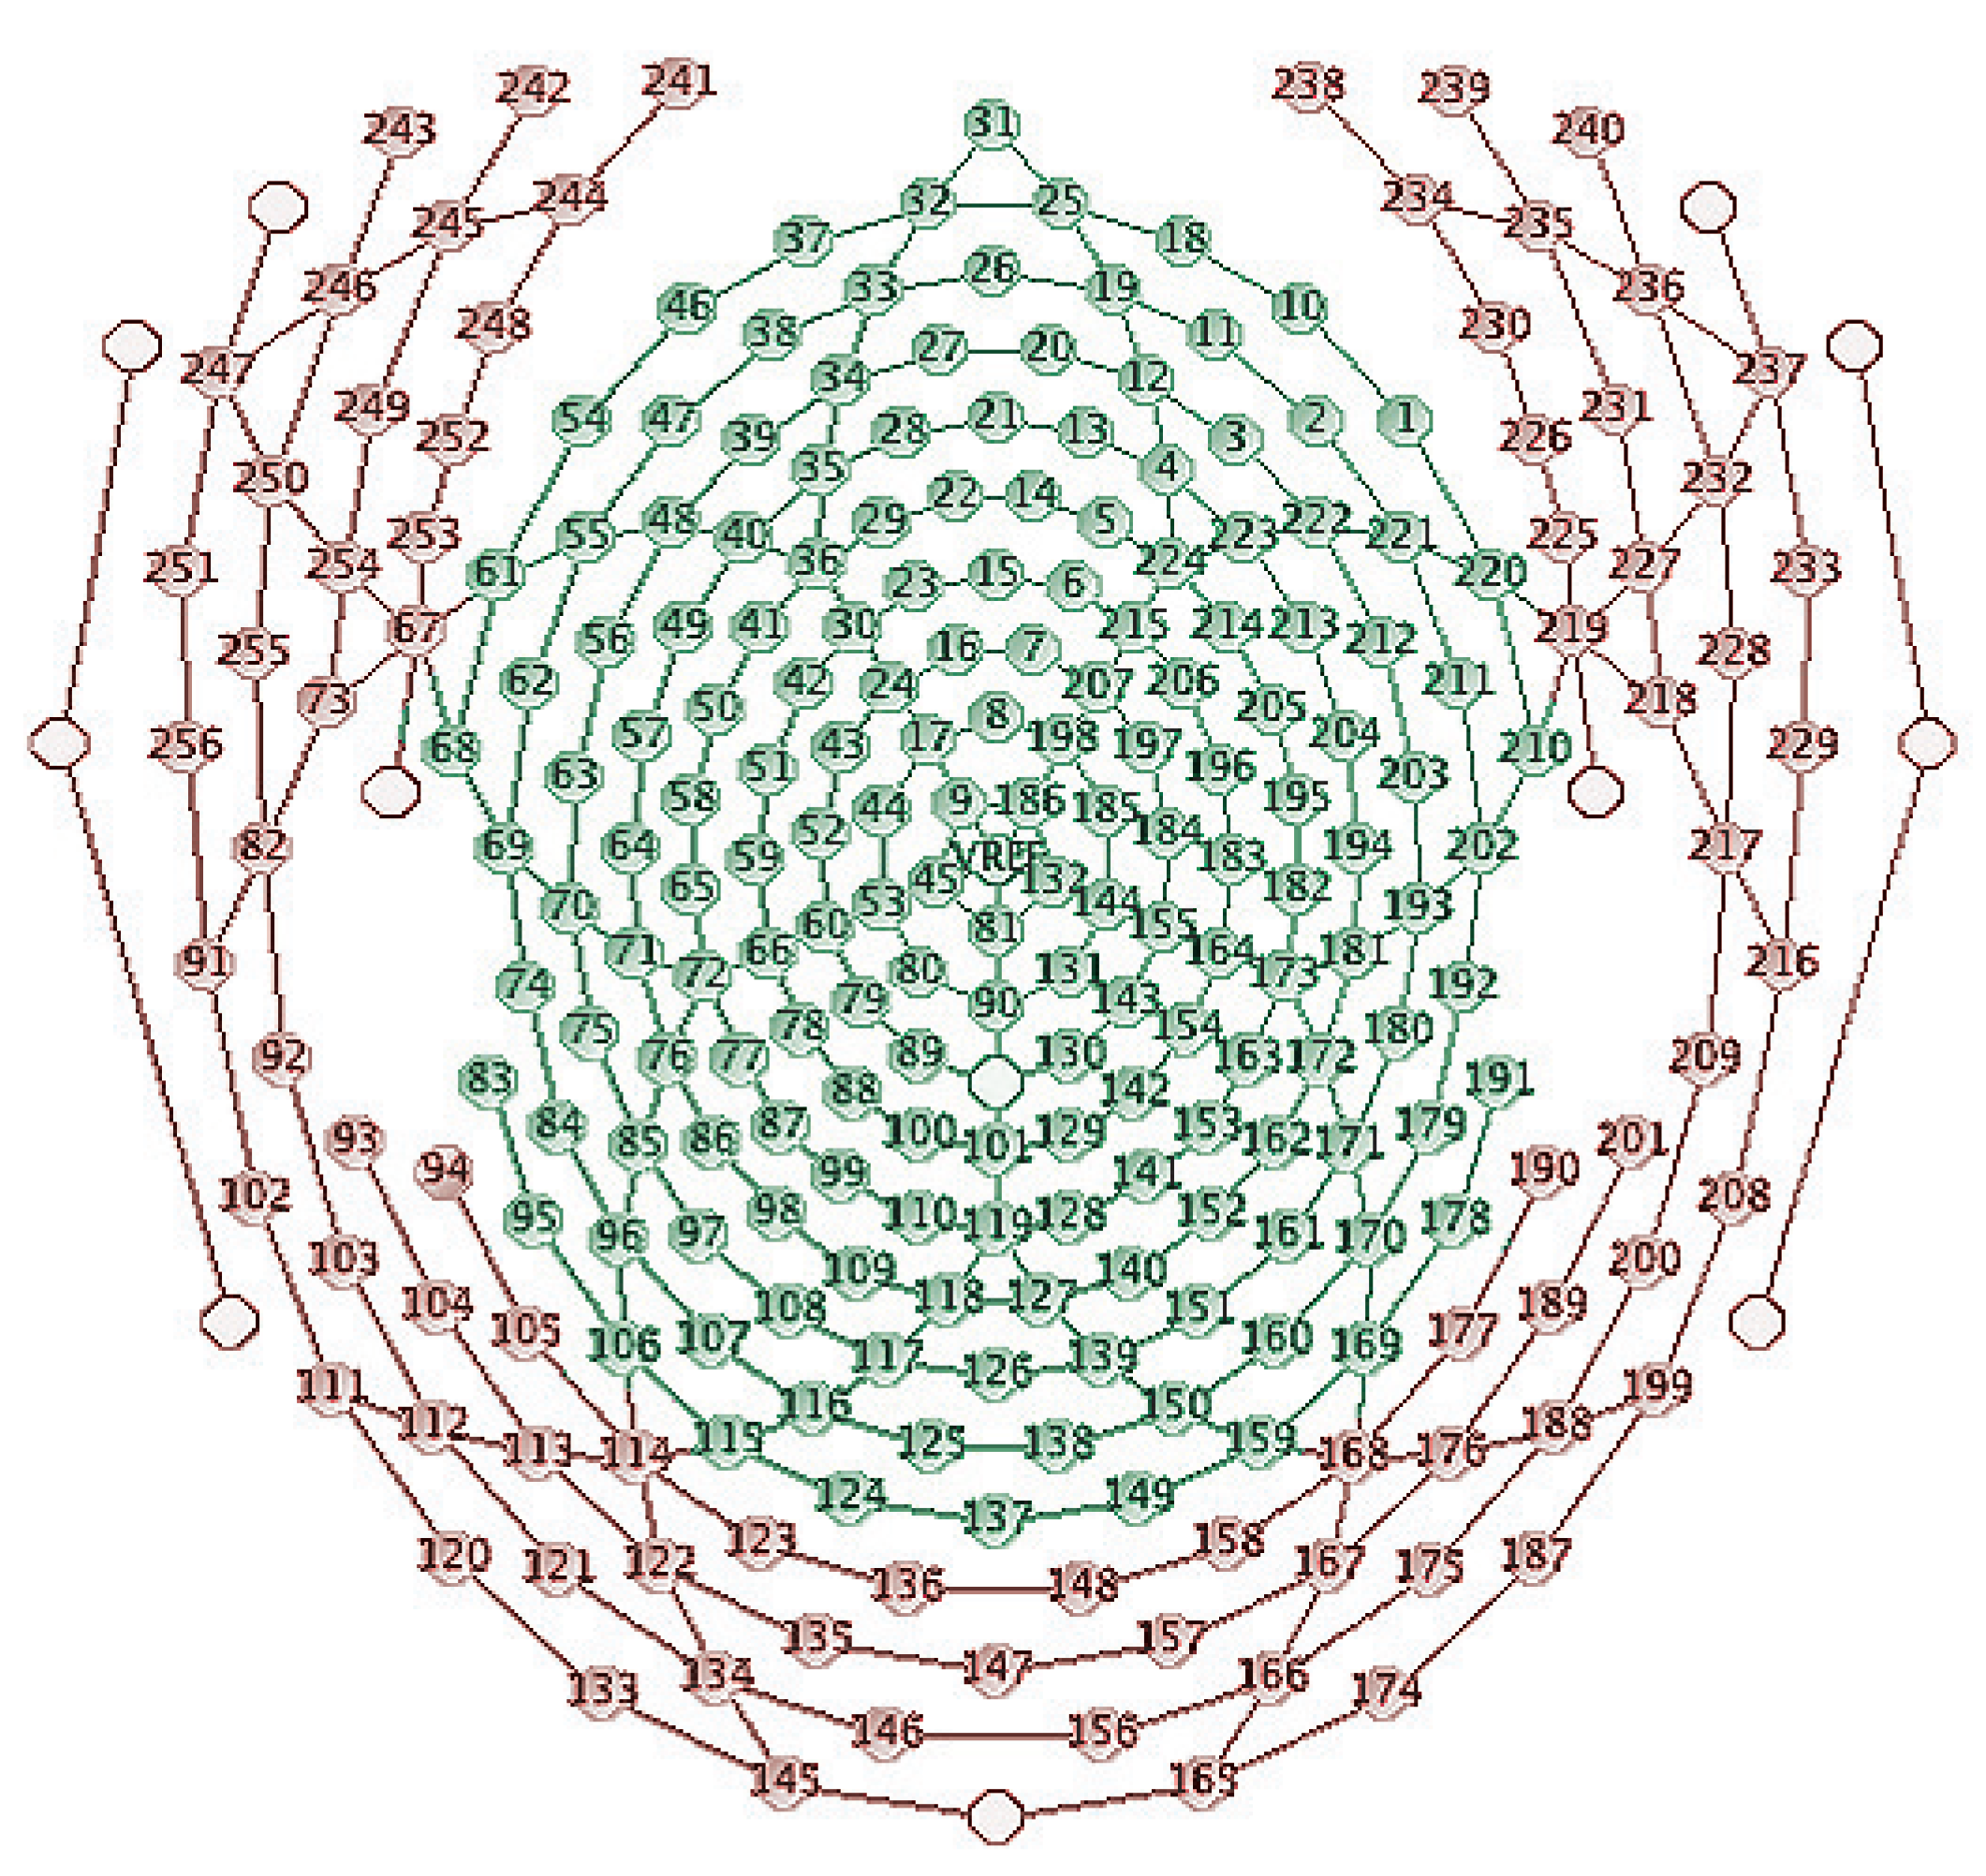
3.2. Brain Network Analysis
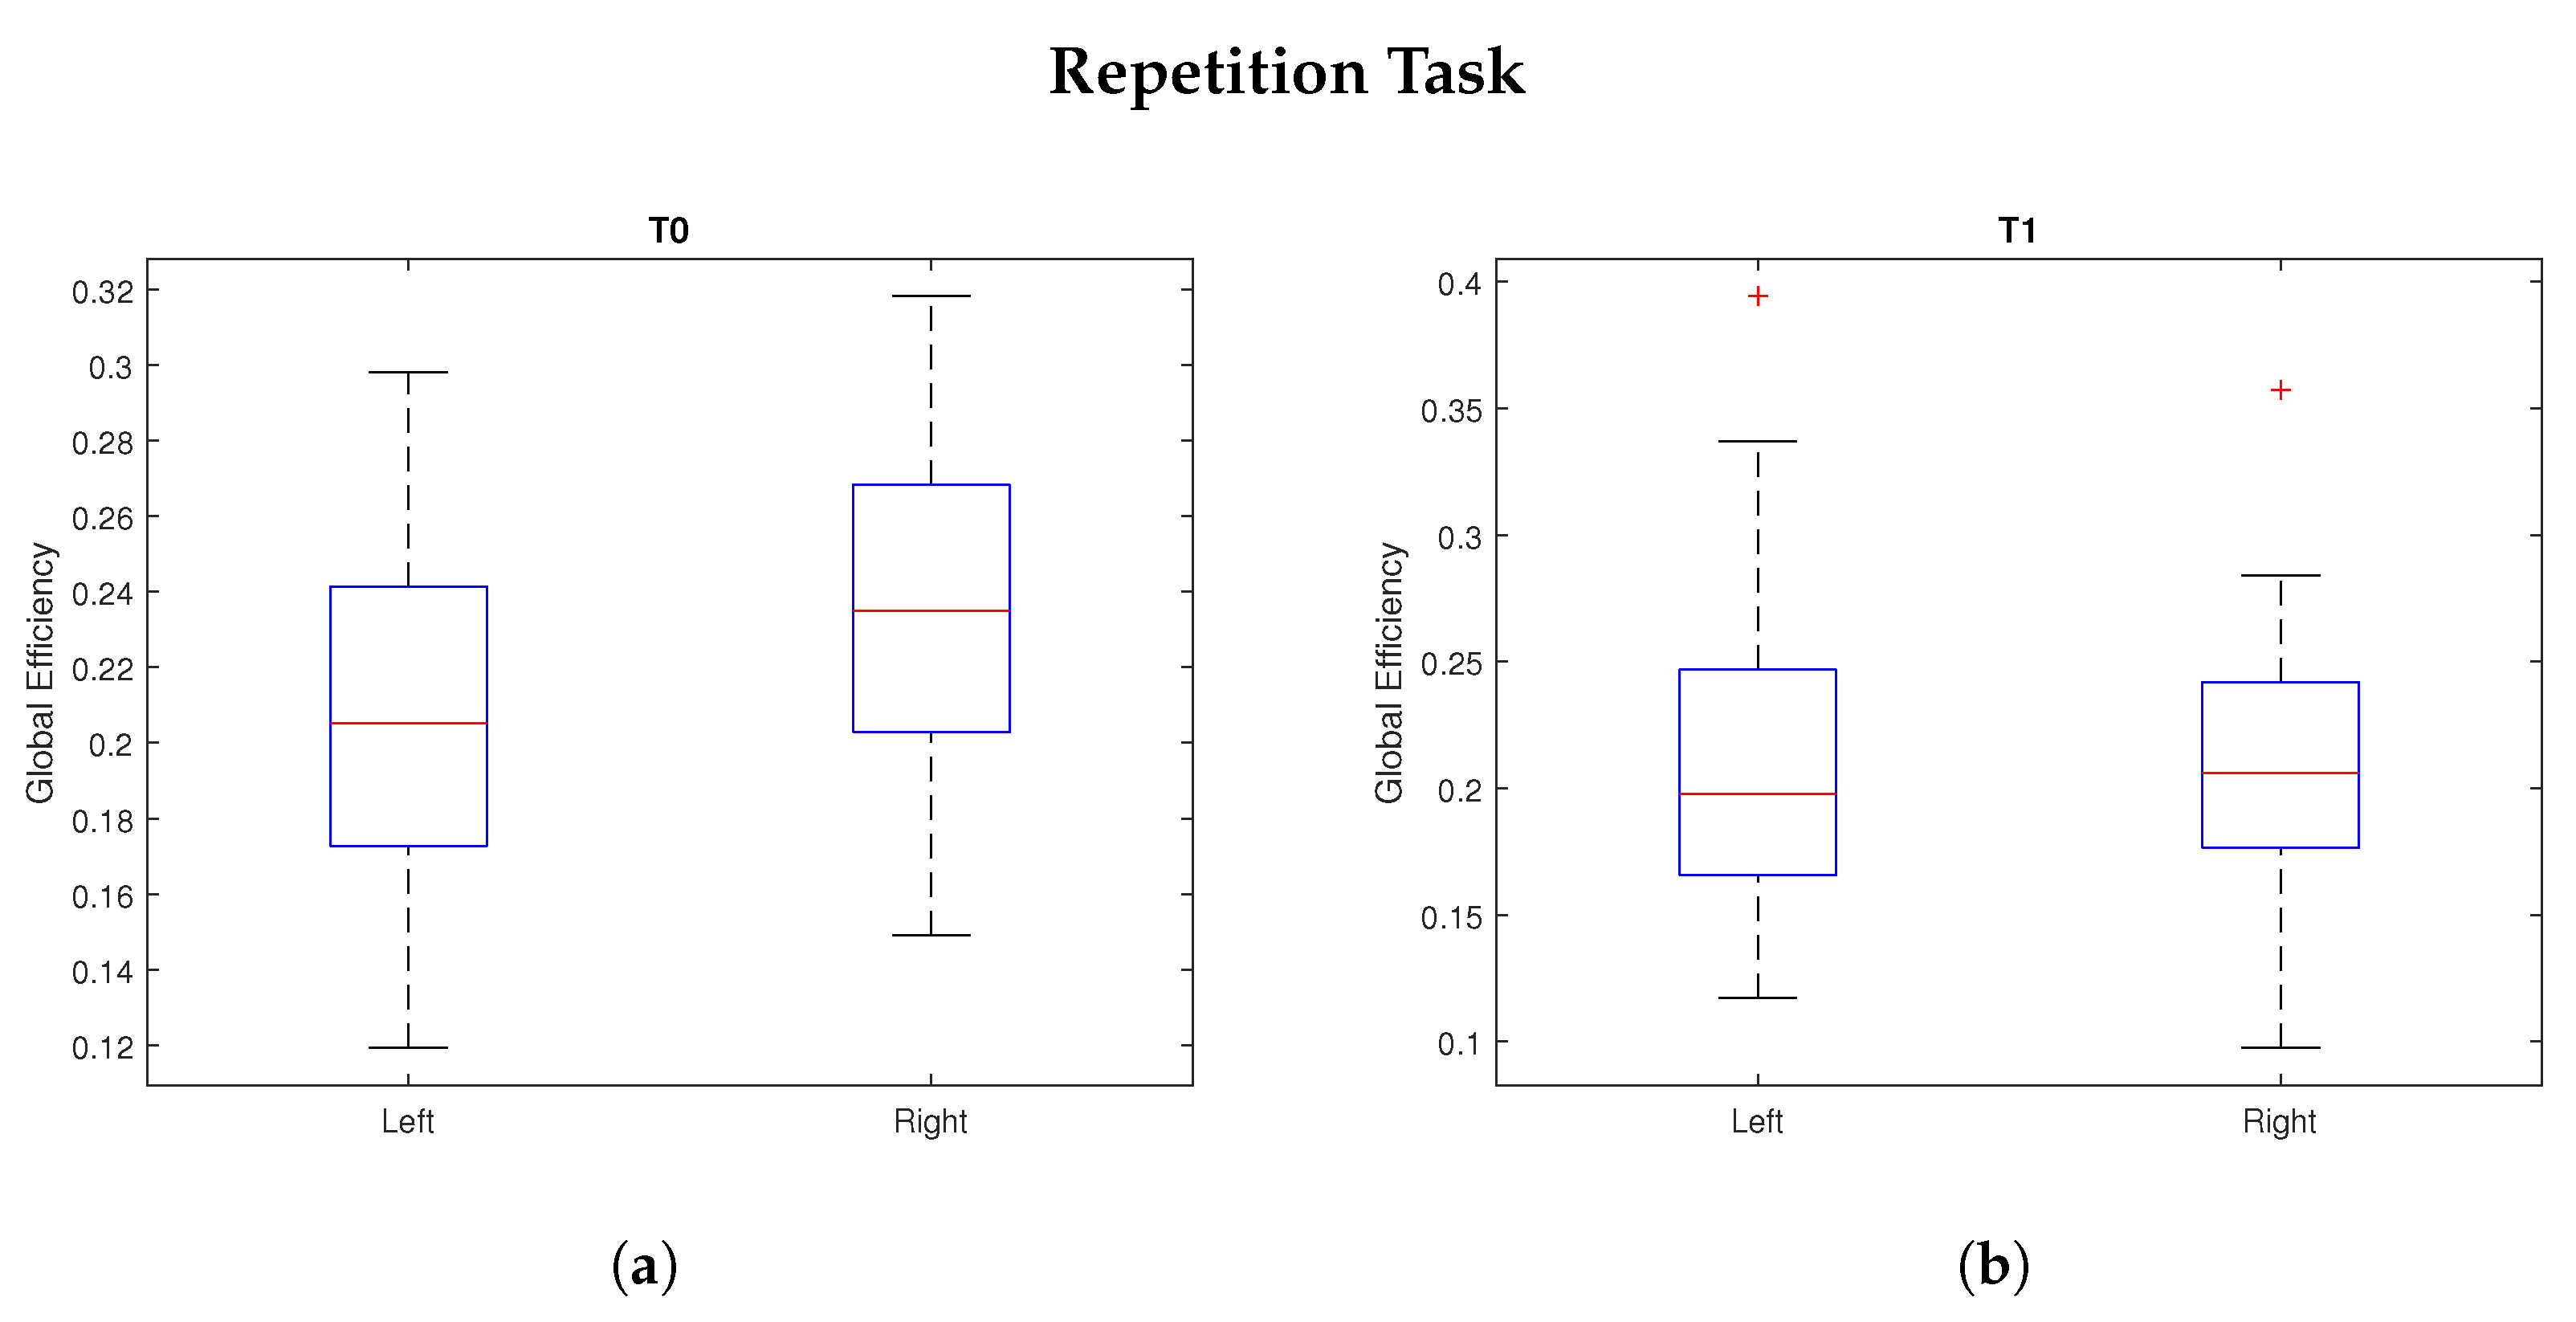
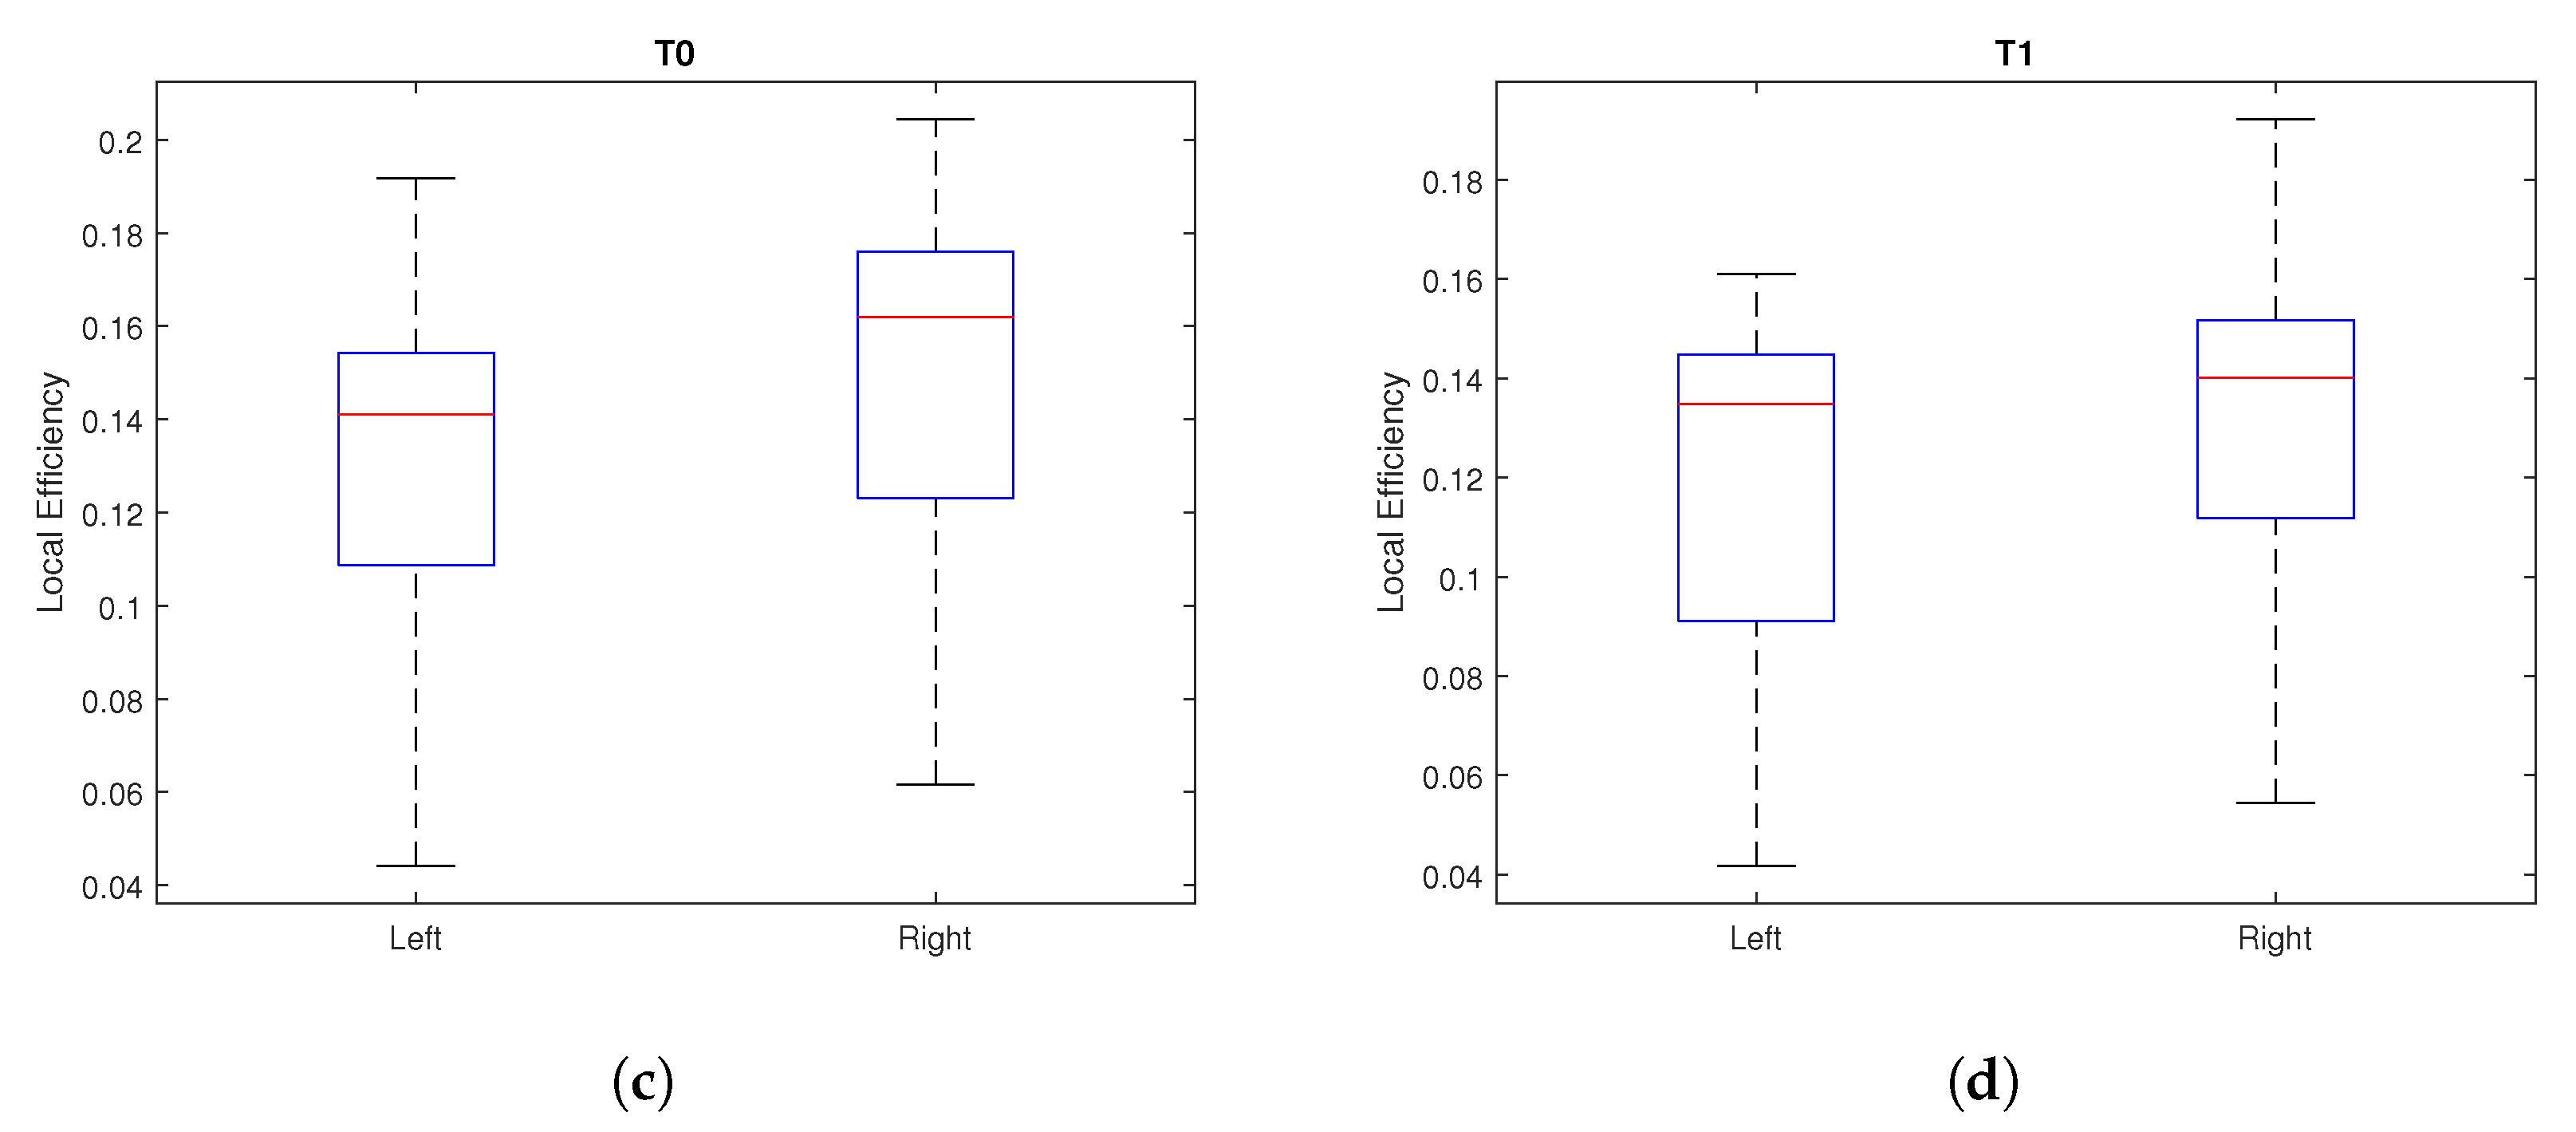
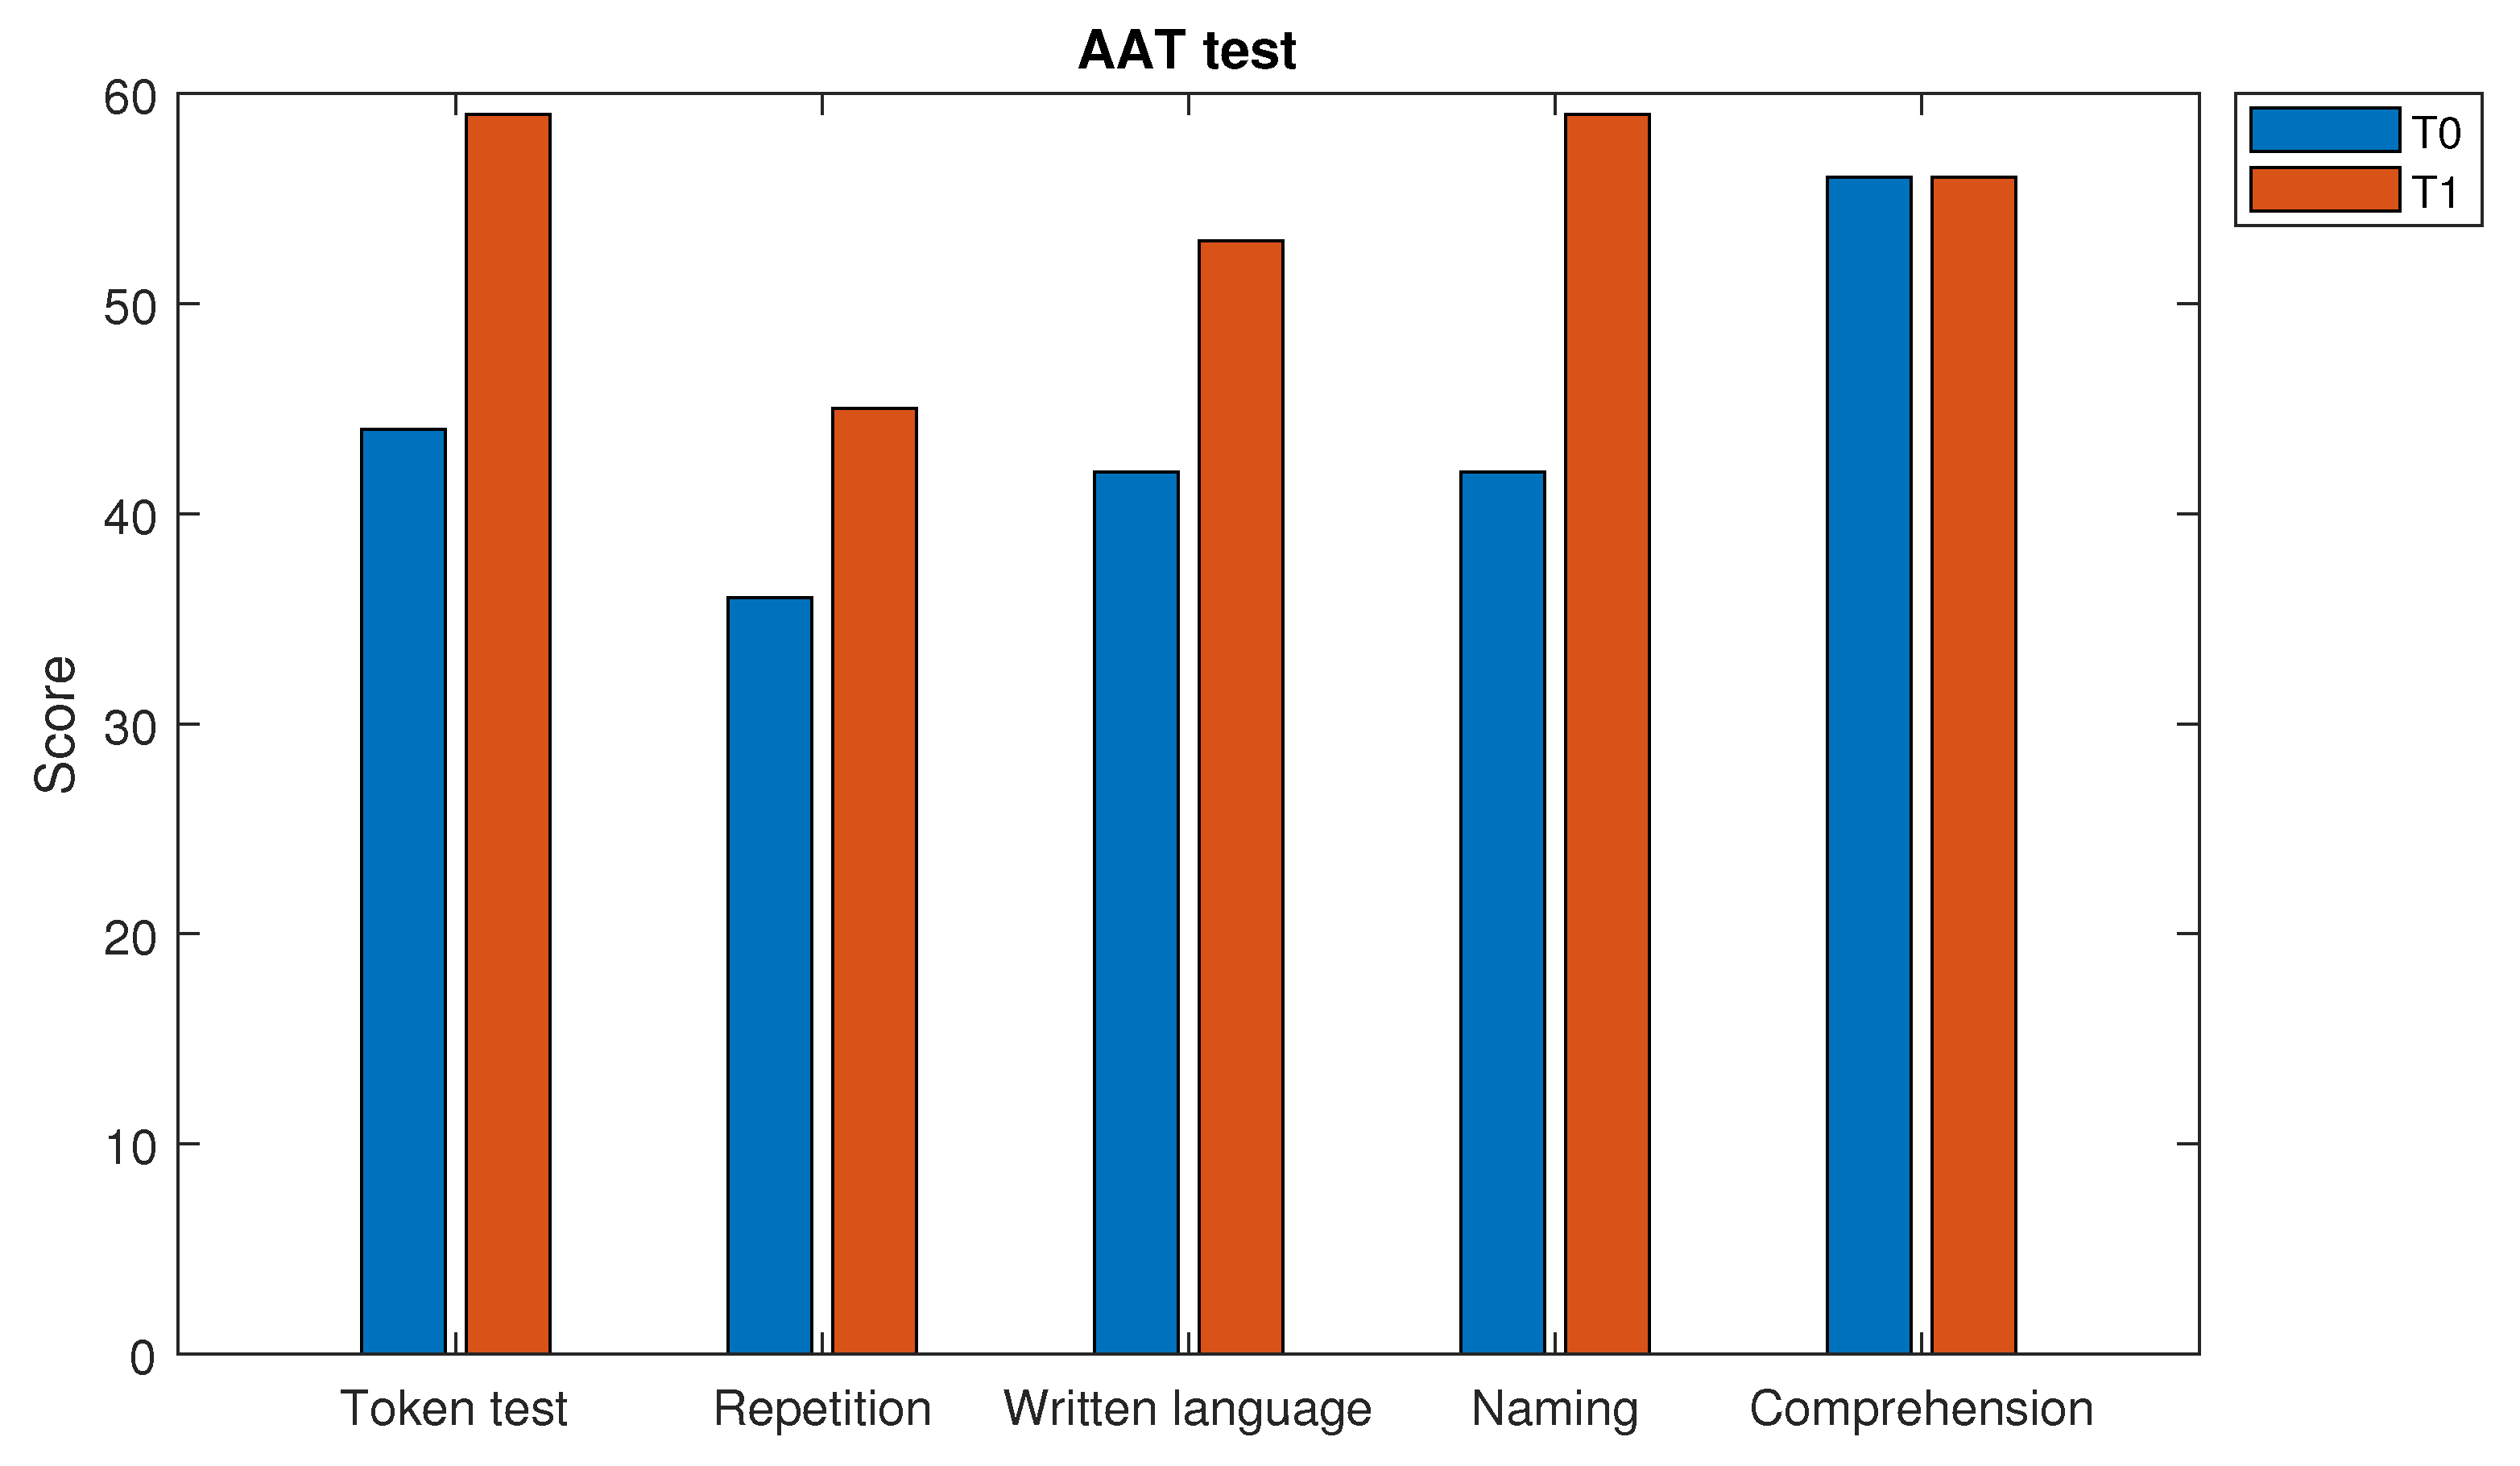
The functional connectivity of the brain was estimated by the Lagged Linear Connectivity (LLC) parameter, which was computed by the Connectivity Toolbox implemented in the LORETA-KEY software (v20210701). LLC provides a measurement of the statistical dependence among active brain sources for each pair of regions of interest (ROIs) for a specified frequency band [24]. In this case, we computed LLC for all 84 possible ROIs defined by the LORETA-KEY software. The ROIs correspond to distinct Brodmann areas, 42 for each hemisphere (Figure 2). Each ROI consists of a single voxel, the one that is the closest to the center of mass of the ROI. The single centroid voxel is an excellent representative of the ROI. The analysis was performed for the frequency range 1–40 Hz. The EEG signals of naming, repetition and reading tasks were divided into 72, 80 and 48 epochs of 1 s, respectively. LLC was calculated for windows of 2 epochs, so we obtained 36, 40 and 24 connection matrices for the naming, repetition and reading tasks, respectively.
Starting from the computation of LLC, the properties of the brain networks were computed by two parameters: global efficiency and local efficiency. The average or global efficiency of a graph G is defined as:
E g l o b ( G ) = 1 N ( N 1 ) i j G 1 d i j
where N is the number of nodes, and d i j is the shortest path length between nodes i and j.
The local efficiency is given by the following expression:
E l o c ( G ) = 1 N i G E ( G i )
The above-mentioned parameters provide a measure of the efficiency in the information exchanges of a network [19]. For both parameters, higher values mean greater network efficiency.
Data processing was performed in MATLAB environment (R2021b). Global and local efficiency were computed by means of the Brain Connectivity Toolbox, a MATLAB toolbox for structural and functional brain connectivity analysis (https://sites.google.com/site/bctnet/, accessed on 18 April 2022).

4. Results

For each task, global and local efficiency were estimated for each hemisphere at time T0 and T1. Figure 3, Figure 4 and Figure 5 show the boxplots of the global efficiency and local efficiency values. A statistical analysis was performed to assess if the differences between the injured (left) and the non-injured (right) hemisphere at T0 and T1 were significant. For this aim, we chose to perform a nonparametric test since the Shapiro–Wilk test [25] revealed that the global and local efficiency values are in some cases normally distributed and in others not normally distributed. In particular, the Wilcoxon rank-sum test [26] was carried out under the null hypothesis that for each task, the medians of the global and local efficiency values between the left and right hemisphere at time T0 do not differ from the corresponding ones at time T1. The significance level was set at 5% so that the difference between T0 and T1 is statistically significant when the p-value is less than 0.05. Table 1 shows the p-values derived from the statistical analysis for each task. At T0, for both naming and repetition task, global and local efficiency in the left (impaired) hemisphere are lower than those of the right (unimpaired) hemisphere. For the reading task, conversely, global and local efficiency of the left hemisphere are higher than those of the right hemisphere. All the differences are statistically significant, except for local efficiency related to the naming task. After the rehabilitative treatment, at T1, the global and local efficiency values between the two hemispheres become balanced, and there is no longer a statistically significant difference. This trend reflects the expected behavior, as the rehabilitation contributed to the creation of new neural patterns to compensate for the disrupted ones. The results also suggest that local and global networks of the brain are altered in stroke patients but not always in the same direction. This trend can be due to the effects of stroke, which affect not only the site of structural damage but also distant brain regions that belong to a functional network. The patient also underwent the Aachener Aphasie Test (AAT), a standardized test that provides an assessment of language functioning after brain injury and determines the presence of aphasia [27]. The scores of the AAT at time T0 and T1 show an improvement of the aphasic deficits of the patient (Figure 6). In particular, the batteries of the naming, repetition and written language tests revealed a gain of 17, 9 and 11 points, respectively, after the rehabilitative treatment. Note that the “written language” battery includes the tests related to the reading ability assessment. The AAT results support our findings of the functional connectivity analysis.

5. Discussion and Conclusions

Stroke is a medical condition that affects the brain and prevents it from functioning properly. Combined with drug therapy, rehabilitative treatment is a precious tool for promoting recovery. The effectiveness of the treatment depends on several factors, such as the therapy type, duration, intensity and beginning treatment early [28]. The treatment can include neuromotor rehabilitation, speech therapy, and cognitive and respiratory rehabilitation. It has been shown that the combination of robotic, psychomotor and cognitive therapy produces positive effects in the rehabilitative process [29]. Moreover, a new effective physiotherapy method for improving movement in post-stroke patients is represented by virtual reality therapy, which allows the subject to interact with an environment within a simulated reality [30]. Therefore, a multidisciplinary approach, based on the cooperation and collaboration between several health professionals, is considered to be a key point for a successful rehabilitative treatment.
In this study, we analyzed the functional connectivity of a left ischemic stroke patient, who suffered from conduction aphasia, before and after a period of intensive rehabilitation. In a human brain, most of the time, the left hemisphere is dominant for language processing [31]. This has been proven by studies that detected a higher activity during language processing in the left hemisphere and a greater probability of linguistic impairment deriving from injuries to the left hemisphere [32,33,34]. As for aphasia, the role of the right hemisphere is still unclear and debated. Nevertheless, there is some evidence that the right hemisphere plays a facilitatory role in the recovery after the rehabilitative treatment in the subacute stage (up to six months after a stroke) [35].
In our study, among the network parameters that are commonly used to describe the brain networks, we chose the global and local connectivity. We expected that after the treatment, a balance of functional connectivity between the impaired and healthy hemisphere occurred. Actually, this trend was observed during the execution of all the three considered tasks. It is noteworthy to point out that for name and repetition tasks, shortly after the stroke, the global and local connectivity are lower in the affected lobe (left hemisphere) than in the unaffected one (right hemisphere). Conversely, for the reading task, global and local connectivity are higher in the left lobe. This apparently contrasting behavior can be explained as a consequence of the alteration of the brain functional network, which can also concern regions belonging to the unaffected lobe. Moreover, changes in network connectivity can be task-dependent, as reported in previous studies [36,37].
In conclusion, functional connectivity in stroke patients has not yet been sufficiently explored and needs to be further investigated. Our work can be considered a starting point for future in-depth research. However, despite the potential of our research, some limitations in this work need to be addressed. First, this is a case report that considers only one subject, so a longitudinal study involving a cohort of patients would further validate our conclusions. Then, a future study based on more than three tasks would provide a more comprehensive assessment. Our analysis was performed considering the total band of the EEG signal. It would be interesting to perform an analysis for each EEG frequency sub-band (delta, theta, alpha, beta, and gamma). Moreover, other connectivity measures could be tested to find out the most suitable features for the intended purpose. In this way, the potentiality of EEG would be fully exploited for supporting the treatment of stroke and monitoring the recovery process.

Author Contributions

Conceptualization, S.D. and F.L.F.; methodology, S.D. and F.L.F.; formal analysis, S.D.; investigation, S.D.; project administration, F.L.F.; writing—original draft preparation, S.D.; writing—review and editing, F.L.F.; supervision, F.L.F. All authors have read and agreed to the published version of the manuscript.

Funding

This research received no external funding.

Institutional Review Board Statement

Ethical review and approval were waived for this study, due to it is a case study.

Informed Consent Statement

Informed consent was obtained from the subject involved in the study.

Data Availability Statement

Restrictions apply to the availability of these data. Data was obtained from “IRCCS—Centro Neurolesi Bonino-Pulejo” of Messina (Italy) and are available from the authors with the permission of “IRCCS—Centro Neurolesi Bonino-Pulejo” of Messina (Italy).

Acknowledgments

The authors thank the doctors of IRCCS Centro Neurolesi Bonino-Pulejo of Messina (Italy) for their insightful comments and suggestions.

Conflicts of Interest

The authors declare no conflict of interest.

References

  1. World Stroke Organization. Annual Report. 2019. Available online: https://www.world-stroke.org (accessed on 11 April 2022).
  2. World Health Organization. Cerebrovascular Disorders: A Clinical and Research Classification; World Health Organization: Geneva, Switzerland, 1978. [Google Scholar]
  3. Gresham, G.E.; Stason, W.B.; Duncan, P.W. Post-Stroke Rehabilitation; Diane Publishing: Darby, PA, USA, 2004; Volume 95. [Google Scholar]
  4. Wernicke, C. Der Aphasische Symptomencomplex: Eine Psychologische Studie auf Anatomischer Basis; Cohn & Weigert: Breslau, Poland, 1874. [Google Scholar]
  5. Ardila, A. A review of conduction aphasia. Curr. Neurol. Neurosci. Rep. 2010, 10, 499–503. [Google Scholar] [CrossRef]
  6. Geschwind, N. Disconnexion syndromes in animals and man. Brain 1965, 88, 585. [Google Scholar] [CrossRef] [Green Version]
  7. Hickok, G.; Erhard, P.; Kassubek, J.; Helms-Tillery, A.K.; Naeve-Velguth, S.; Strupp, J.P.; Strick, P.L.; Ugurbil, K. A functional magnetic resonance imaging study of the role of left posterior superior temporal gyrus in speech production: Implications for the explanation of conduction aphasia. Neurosci. Lett. 2000, 287, 156–160. [Google Scholar] [CrossRef]
  8. Angrilli, A.; Elbert, T.; Cusumano, S.; Stegagno, L.; Rockstroh, B. Temporal dynamics of linguistic processes are reorganized in aphasics’ cortex: An EEG mapping study. Neuroimage 2003, 20, 657–666. [Google Scholar] [CrossRef] [Green Version]
  9. Breier, J.I.; Castillo, E.M.; Boake, C.; Billingsley, R.; Maher, L.; Francisco, G.; Papanicolaou, A.C. Spatiotemporal patterns of language-specific brain activity in patients with chronic aphasia after stroke using magnetoencephalography. Neuroimage 2004, 23, 1308–1316. [Google Scholar] [CrossRef]
  10. Sarasso, S.; Määttä, S.; Ferrarelli, F.; Poryazova, R.; Tononi, G.; Small, S.L. Plastic changes following imitation-based speech and language therapy for aphasia: A high-density sleep EEG study. Neurorehabilit. Neural Repair 2014, 28, 129–138. [Google Scholar] [CrossRef] [Green Version]
  11. Spironelli, C.; Angrilli, A. Brain plasticity in aphasic patients: Intra-and inter-hemispheric reorganisation of the whole linguistic network probed by N150 and N350 components. Sci. Rep. 2015, 5, 12541. [Google Scholar] [CrossRef] [Green Version]
  12. Thompson, C.K.; den Ouden, D.B. Neuroimaging and recovery of language in aphasia. Curr. Neurol. Neurosci. Rep. 2008, 8, 475. [Google Scholar] [CrossRef]
  13. Mattioli, F.; Ambrosi, C.; Mascaro, L.; Scarpazza, C.; Pasquali, P.; Frugoni, M.; Magoni, M.; Biagi, L.; Gasparotti, R. Early aphasia rehabilitation is associated with functional reactivation of the left inferior frontal gyrus: A pilot study. Stroke 2014, 45, 545–552. [Google Scholar] [CrossRef] [Green Version]
  14. Stefaniak, J.D.; Halai, A.D.; Ralph, M.A.L. The neural and neurocomputational bases of recovery from post-stroke aphasia. Nat. Rev. Neurol. 2020, 16, 43–55. [Google Scholar] [CrossRef]
  15. Formica, C.; De Salvo, S.; Micchìa, K.; La Foresta, F.; Dattola, S.; Mammone, N.; Corallo, F.; Ciavola, A.; Arcadi, F.A.; Marino, S.; et al. Cortical Reorganization after Rehabilitation in a Patient with Conduction Aphasia Using High-Density EEG. Appl. Sci. 2020, 10, 5281. [Google Scholar] [CrossRef]
  16. Rubinov, M.; Sporns, O. Complex network measures of brain connectivity: Uses and interpretations. Neuroimage 2010, 52, 1059–1069. [Google Scholar] [CrossRef]
  17. Achard, S.; Bullmore, E. Efficiency and cost of economical brain functional networks. PLoS Comput. Biol. 2007, 3, e17. [Google Scholar] [CrossRef]
  18. Bullmore, E.; Sporns, O. Complex brain networks: Graph theoretical analysis of structural and functional systems. Nat. Rev. Neurosci. 2009, 10, 186–198. [Google Scholar] [CrossRef]
  19. Latora, V.; Marchiori, M. Efficient behavior of small-world networks. Phys. Rev. Lett. 2001, 87, 198701. [Google Scholar] [CrossRef] [PubMed] [Green Version]
  20. Caliandro, P.; Vecchio, F.; Miraglia, F.; Reale, G.; Della Marca, G.; La Torre, G.; Lacidogna, G.; Iacovelli, C.; Padua, L.; Bramanti, P.; et al. Small-world characteristics of cortical connectivity changes in acute stroke. Neurorehabilit. Neural Repair 2017, 31, 81–94. [Google Scholar] [CrossRef] [Green Version]
  21. Mammone, N.; De Salvo, S.; Marino, S.; Bonanno, L.; Ieracitano, C.; Dattola, S.; La Foresta, F.; Morabito, F.C. Estimating the Asymmetry of Brain Network Organization in Stroke Patients from High-Density EEG Signals. In Neural Approaches to Dynamics of Signal Exchanges; Springer: Singapore, 2020; pp. 475–483. [Google Scholar]
  22. Fallani, F.D.V.; Pichiorri, F.; Morone, G.; Molinari, M.; Babiloni, F.; Cincotti, F.; Mattia, D. Multiscale topological properties of functional brain networks during motor imagery after stroke. Neuroimage 2013, 83, 438–449. [Google Scholar] [CrossRef] [Green Version]
  23. Philips, G.R.; Daly, J.J.; Príncipe, J.C. Topographical measures of functional connectivity as biomarkers for post-stroke motor recovery. J. Neuroeng. Rehabil. 2017, 14, 1–16. [Google Scholar] [CrossRef]
  24. Pascual-Marqui, R.D. Instantaneous and lagged measurements of linear and nonlinear dependence between groups of multivariate time series: Frequency decomposition. arXiv 2007, arXiv:0711.1455. [Google Scholar]
  25. Shaphiro, S.; Wilk, M. An analysis of variance test for normality. Biometrika 1965, 52, 591–611. [Google Scholar] [CrossRef]
  26. Gibbons, J.; Chakraborti, S. Nonparametric Statistical Inference; Springer: Cham, Switzerland, 2011. [Google Scholar]
  27. Huber, W.; Poeck, K.; Weniger, D.; Willmes, K. AAT-Aachener Aphasie Test; Hogrefe: Göttingen, Germany, 1983. [Google Scholar]
  28. Van Meijeren-Pont, W.; Tamminga, S.J.; Fiocco, M.; Avila, A.G.; Volker, G.; Janssen, S.M.; Vlieland, T.P.V.; Oosterveer, D.M.; SCORE Study Group. Patient Activation During the First 6 Months After the Start of Stroke Rehabilitation. Arch. Phys. Med. Rehabil. 2022, in press. [Google Scholar] [CrossRef] [PubMed]
  29. Vostrỳ, M.; Zilcher, L. Combined Therapy for Patients after Ischemic Stroke from The Point View of Comprehensive Rehabilitation. J. Educ. Cult. Soc. 2020, 11, 119–125. [Google Scholar] [CrossRef]
  30. Montalbán, M.A.; Arrogante, O. Rehabilitation through virtual reality therapy after a stroke: A literature review. Rev. Cient. Soc. Esp. Enferm. Neurol. 2020, 52, 19–27. [Google Scholar] [CrossRef]
  31. Knecht, S.; Dräger, B.; Deppe, M.; Bobe, L.; Lohmann, H.; Flöel, A.; Ringelstein, E.B.; Henningsen, H. Handedness and hemispheric language dominance in healthy humans. Brain 2000, 123, 2512–2518. [Google Scholar] [CrossRef] [PubMed] [Green Version]
  32. Mesulam, M.M.; Weintraub, S.; Rogalski, E.J.; Wieneke, C.; Geula, C.; Bigio, E.H. Asymmetry and heterogeneity of Alzheimer’s and frontotemporal pathology in primary progressive aphasia. Brain 2014, 137, 1176–1192. [Google Scholar] [CrossRef] [Green Version]
  33. Fridriksson, J.; Yourganov, G.; Bonilha, L.; Basilakos, A.; Den Ouden, D.B.; Rorden, C. Revealing the dual streams of speech processing. Proc. Natl. Acad. Sci. USA 2016, 113, 15108–15113. [Google Scholar] [CrossRef] [Green Version]
  34. Mahowald, K.; Fedorenko, E. Reliable individual-level neural markers of high-level language processing: A necessary precursor for relating neural variability to behavioral and genetic variability. Neuroimage 2016, 139, 74–93. [Google Scholar] [CrossRef]
  35. Cocquyt, E.M.; De Ley, L.; Santens, P.; Van Borsel, J.; De Letter, M. The role of the right hemisphere in the recovery of stroke-related aphasia: A systematic review. J. Neurolinguist. 2017, 44, 68–90. [Google Scholar] [CrossRef] [Green Version]
  36. Vinehout, K.; Schmit, B.D.; Schindler-Ivens, S. Lower limb task-based functional connectivity is altered in stroke. Brain Connect. 2019, 9, 365–377. [Google Scholar] [CrossRef]
  37. Grefkes, C.; Nowak, D.A.; Eickhoff, S.B.; Dafotakis, M.; Küst, J.; Karbe, H.; Fink, G.R. Cortical connectivity after subcortical stroke assessed with functional magnetic resonance imaging. Ann. Neurol. 2008, 63, 236–246. [Google Scholar] [CrossRef]
Figure 1. A 2D map of the 256 channel 256-channel HydroCel Geodesic Sensor Net. The considered electrodes are highlighted in green. The electrodes in red were discarded.
Applsci 12 05991 g001
Figure 2. Red points denote the 84 ROIs considered.
Applsci 12 05991 g002
Figure 3. Naming task: boxplot of global efficiency for each hemisphere at time (a) T0 and (b) T1; boxplot of local efficiency for each hemisphere at time (c) T0 and (d) T1. On each box, the bottom and the top edges denote the 25th and 75th percentiles, respectively; the line inside the box indicates the median; the “whiskers” extend below and above the box up to the minimum and maximum data values, respectively. The ‘+’ marker symbol outside the whiskers represents the outliers.
Applsci 12 05991 g003
Figure 4. Repetition task: boxplot of global efficiency for each hemisphere at time (a) T0 and (b) T1; boxplot of local efficiency for each hemisphere at time (c) T0 and (d) T1. On each box, the bottom and the top edges denote the 25th and 75th percentiles, respectively; the line inside the box indicates the median; the “whiskers” extend below and above the box up to the minimum and maximum data values, respectively. The ‘+’ marker symbol outside the whiskers represents the outliers.
Applsci 12 05991 g004aApplsci 12 05991 g004b
Figure 5. Reading task: boxplot of global efficiency for each hemisphere at time (a) T0 and (b) T1; boxplot of local efficiency for each hemisphere at time (c) T0 and (d) T1. On each box, the bottom and the top edges denote the 25th and 75th percentiles, respectively; the line inside the box indicates the median; the “whiskers” extend below and above the box up to the minimum and maximum data values, respectively. The ‘+’ marker symbol outside the whiskers represents the outliers.
Applsci 12 05991 g005
Figure 6. AAT test score at T0 and T1.
Applsci 12 05991 g006
Table 1. Results of the Wilcoxon rank-sum test.
Network
Parameters
Naming Task
p-Value
Repetition Task
p-Value
Reading Task
p-Value
T0T1T0T1T0T1
Global Efficiency0.0456 *0.67280.0136 *0.50980.0193 *0.3922
Local Efficiency0.05970.53410.0023 *0.19920.0033 *0.1340
* denotes statistically significant differences (p < 0.05).
Publisher’s Note: MDPI stays neutral with regard to jurisdictional claims in published maps and institutional affiliations.

