
Climate Impact Reduction Potentials of Synthetic Kerosene and Green Hydrogen Powered Mid-Range Aircraft Concepts

 , , , , ,
Abstract
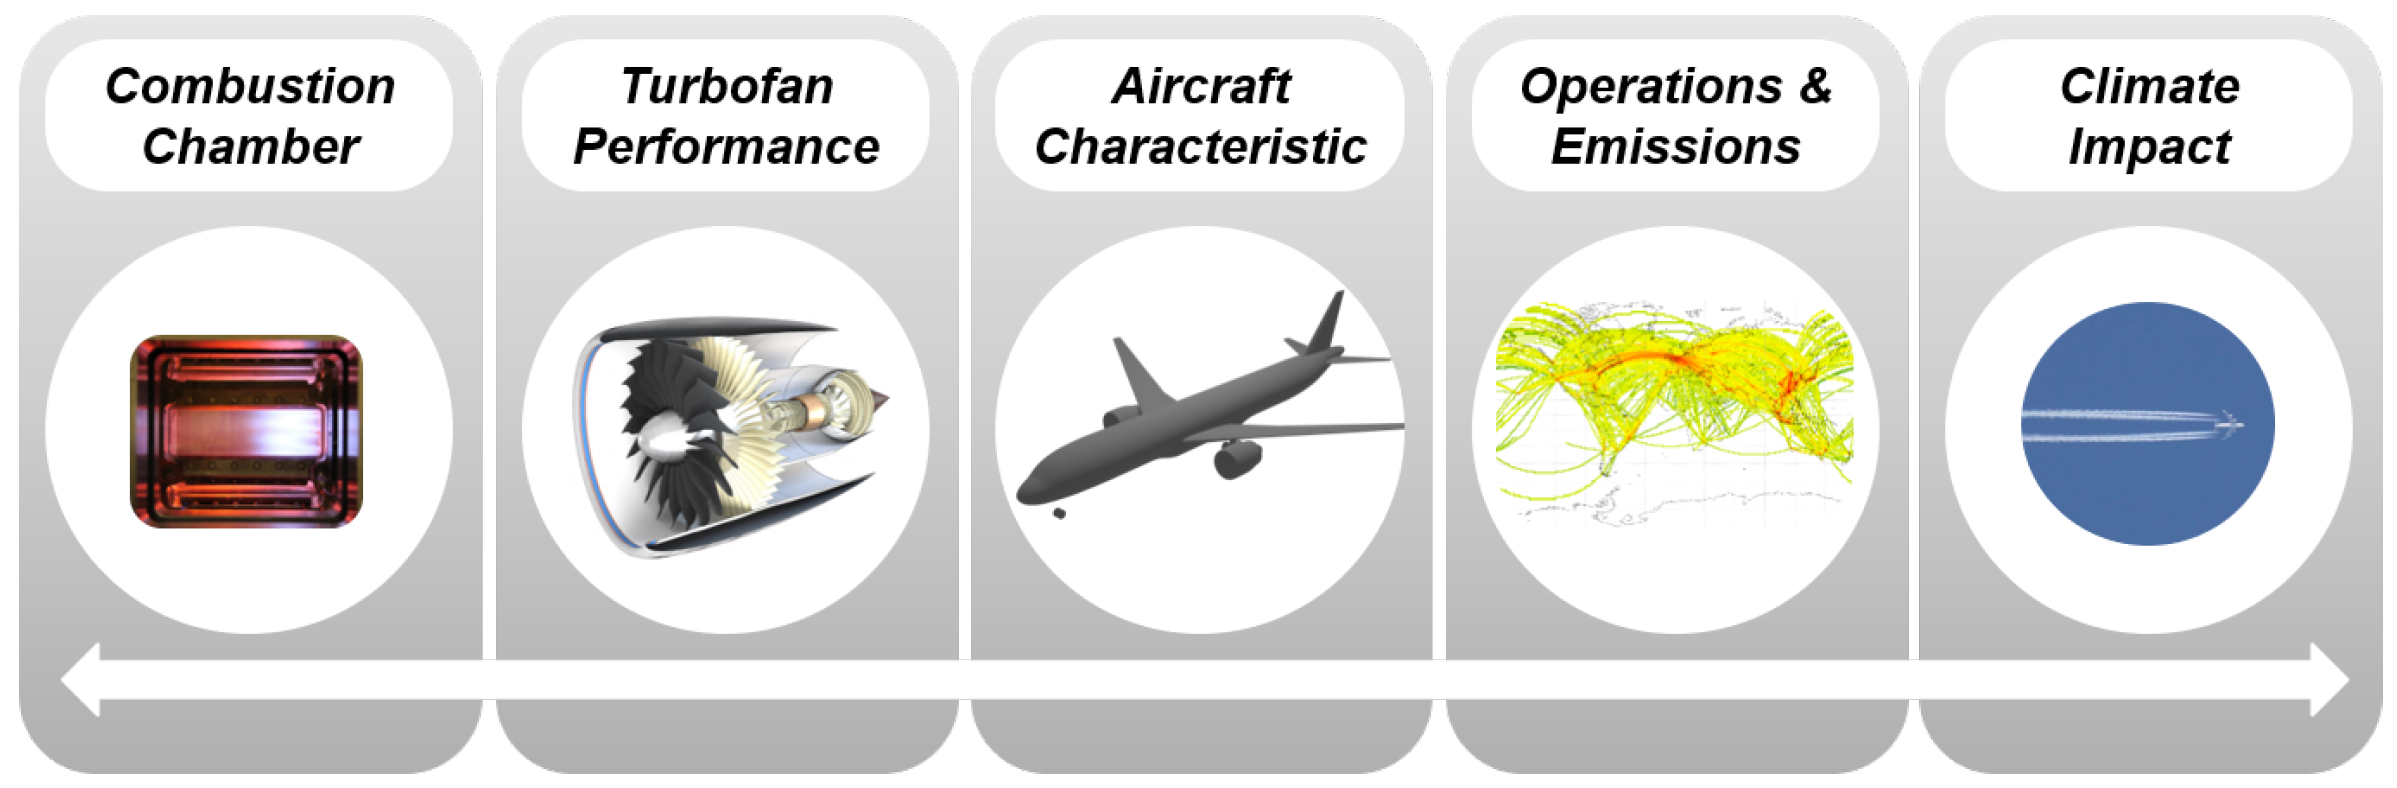
:1. Introduction
- Direct CO2 effects;
- Total NOx impact;
- Water vapour;
- Contrail induced cloudiness (CiC).
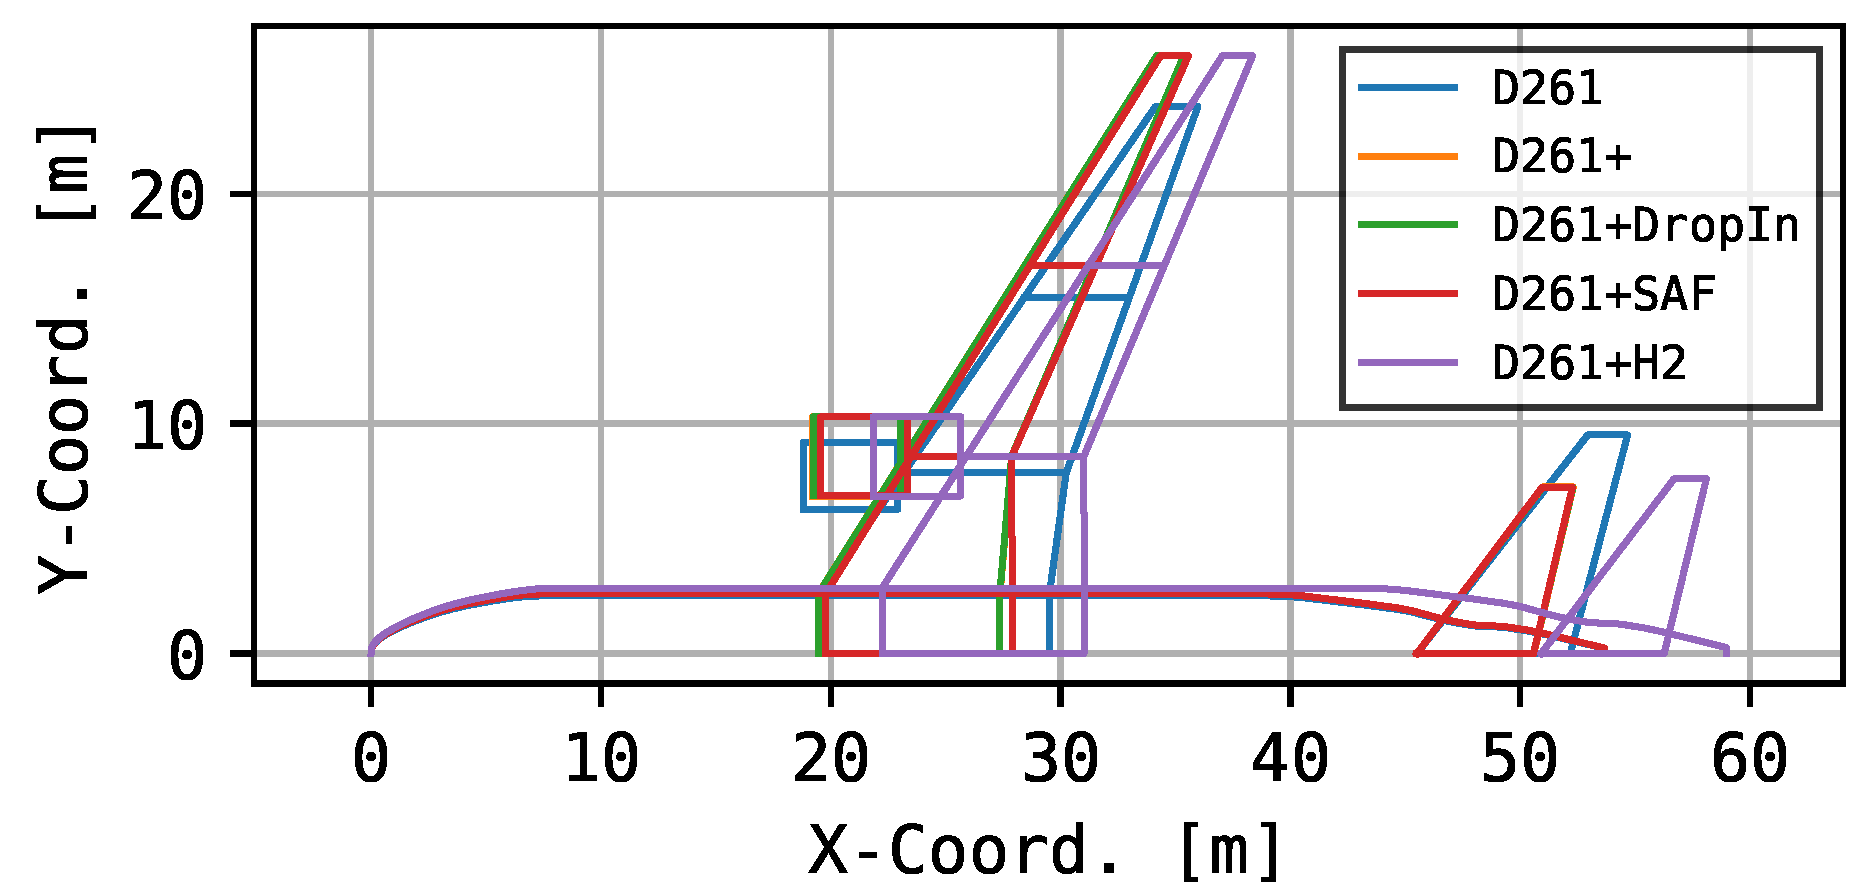
- D261: Reference based on B767-300.
- D261+: Baseline for entry into service (EIS) 2040 with evolutionary advancements and fossil kerosene.
- D261+DropIn: Similar to D261+, but designed and operated with 50% drop-in blend.
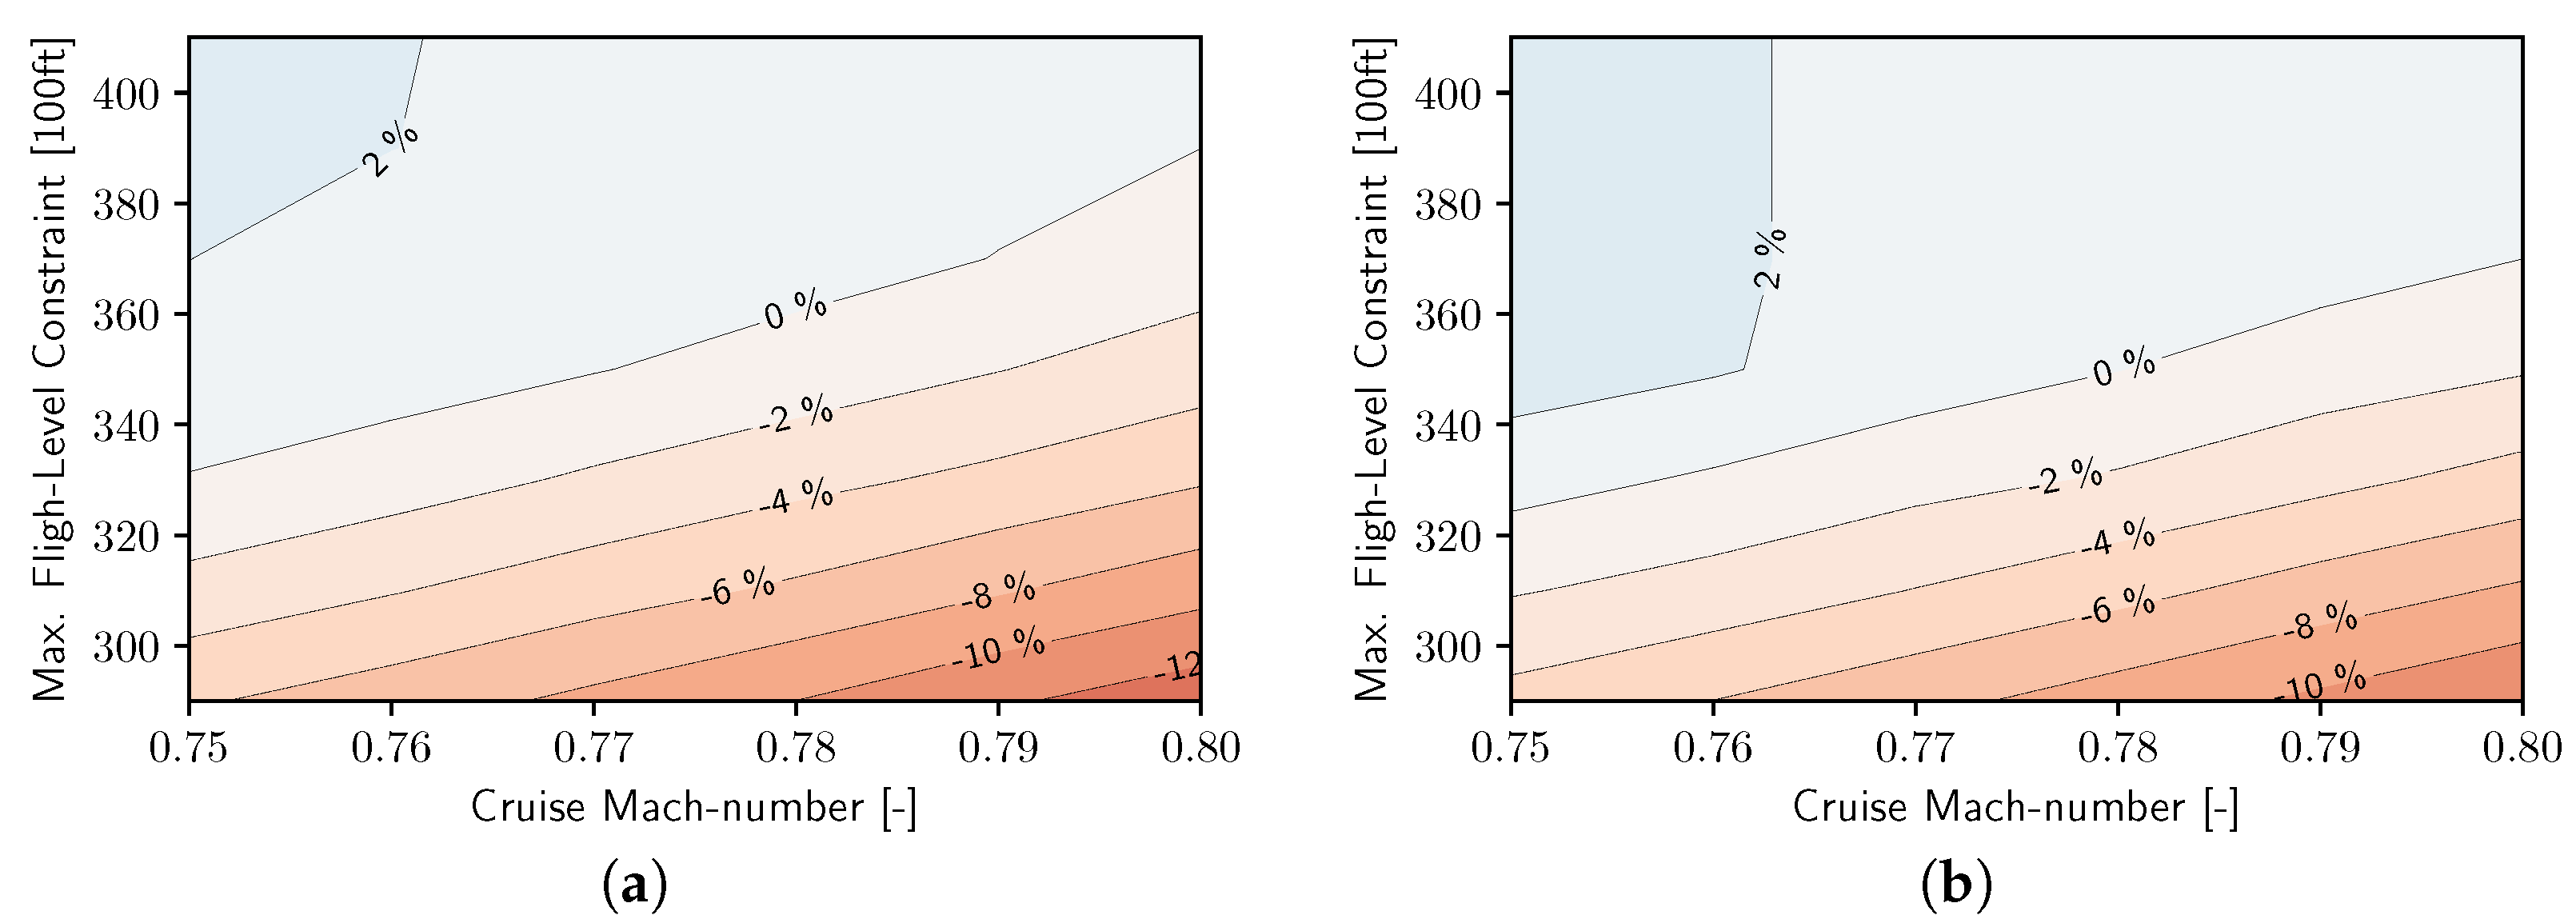
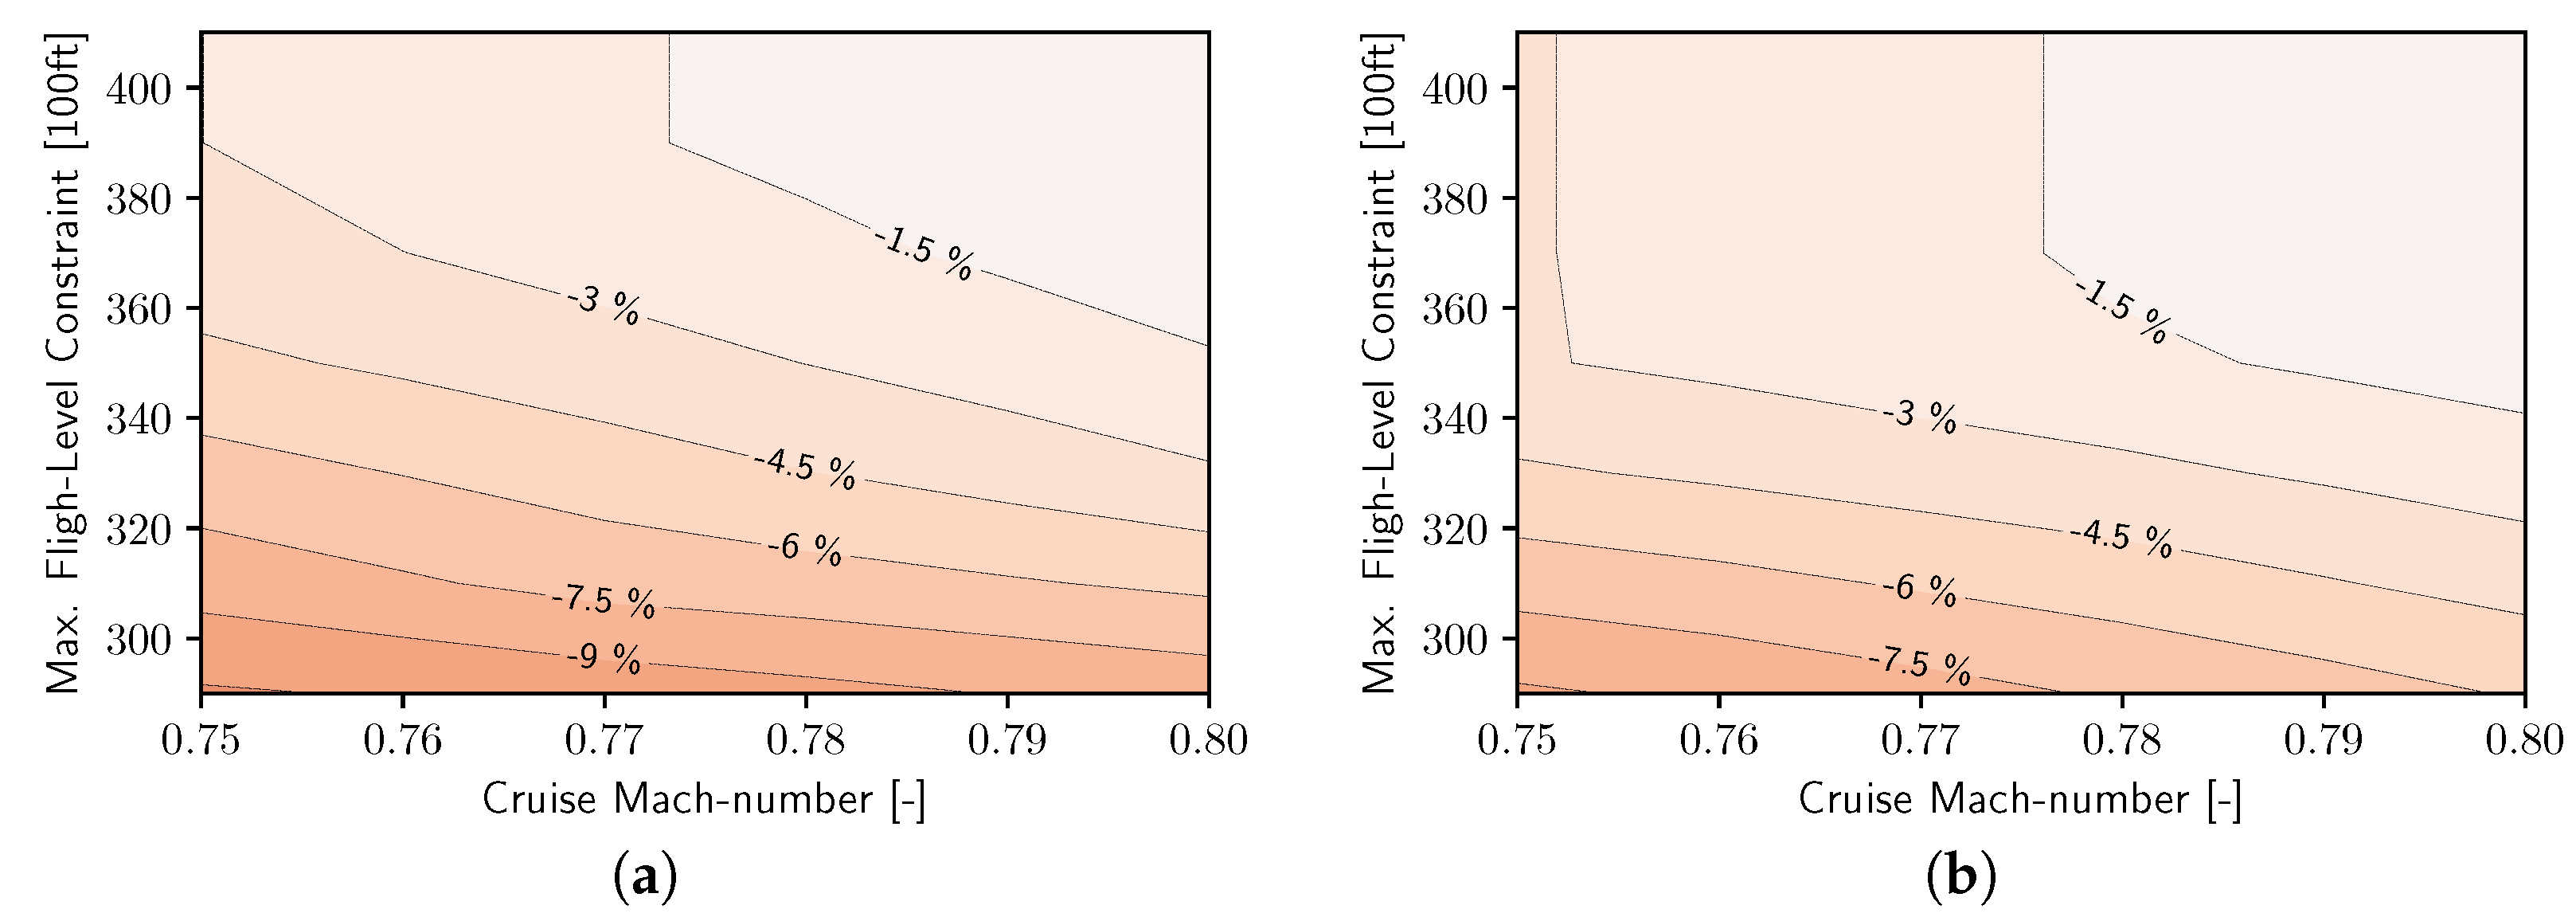
- D261+SAF: Similar to D261+, but designed and operated with 100% synthetic kerosene. An altitude constraint, cruise Mach number trade, is conducted.
- D261+H2: Same technological assumptions as D261+ but designed and operated with 100% green liquid hydrogen. An altitude constraint—cruise Mach number trade is conducted.
2. Materials and Methods
2.1. Energy Carrier Characteristics
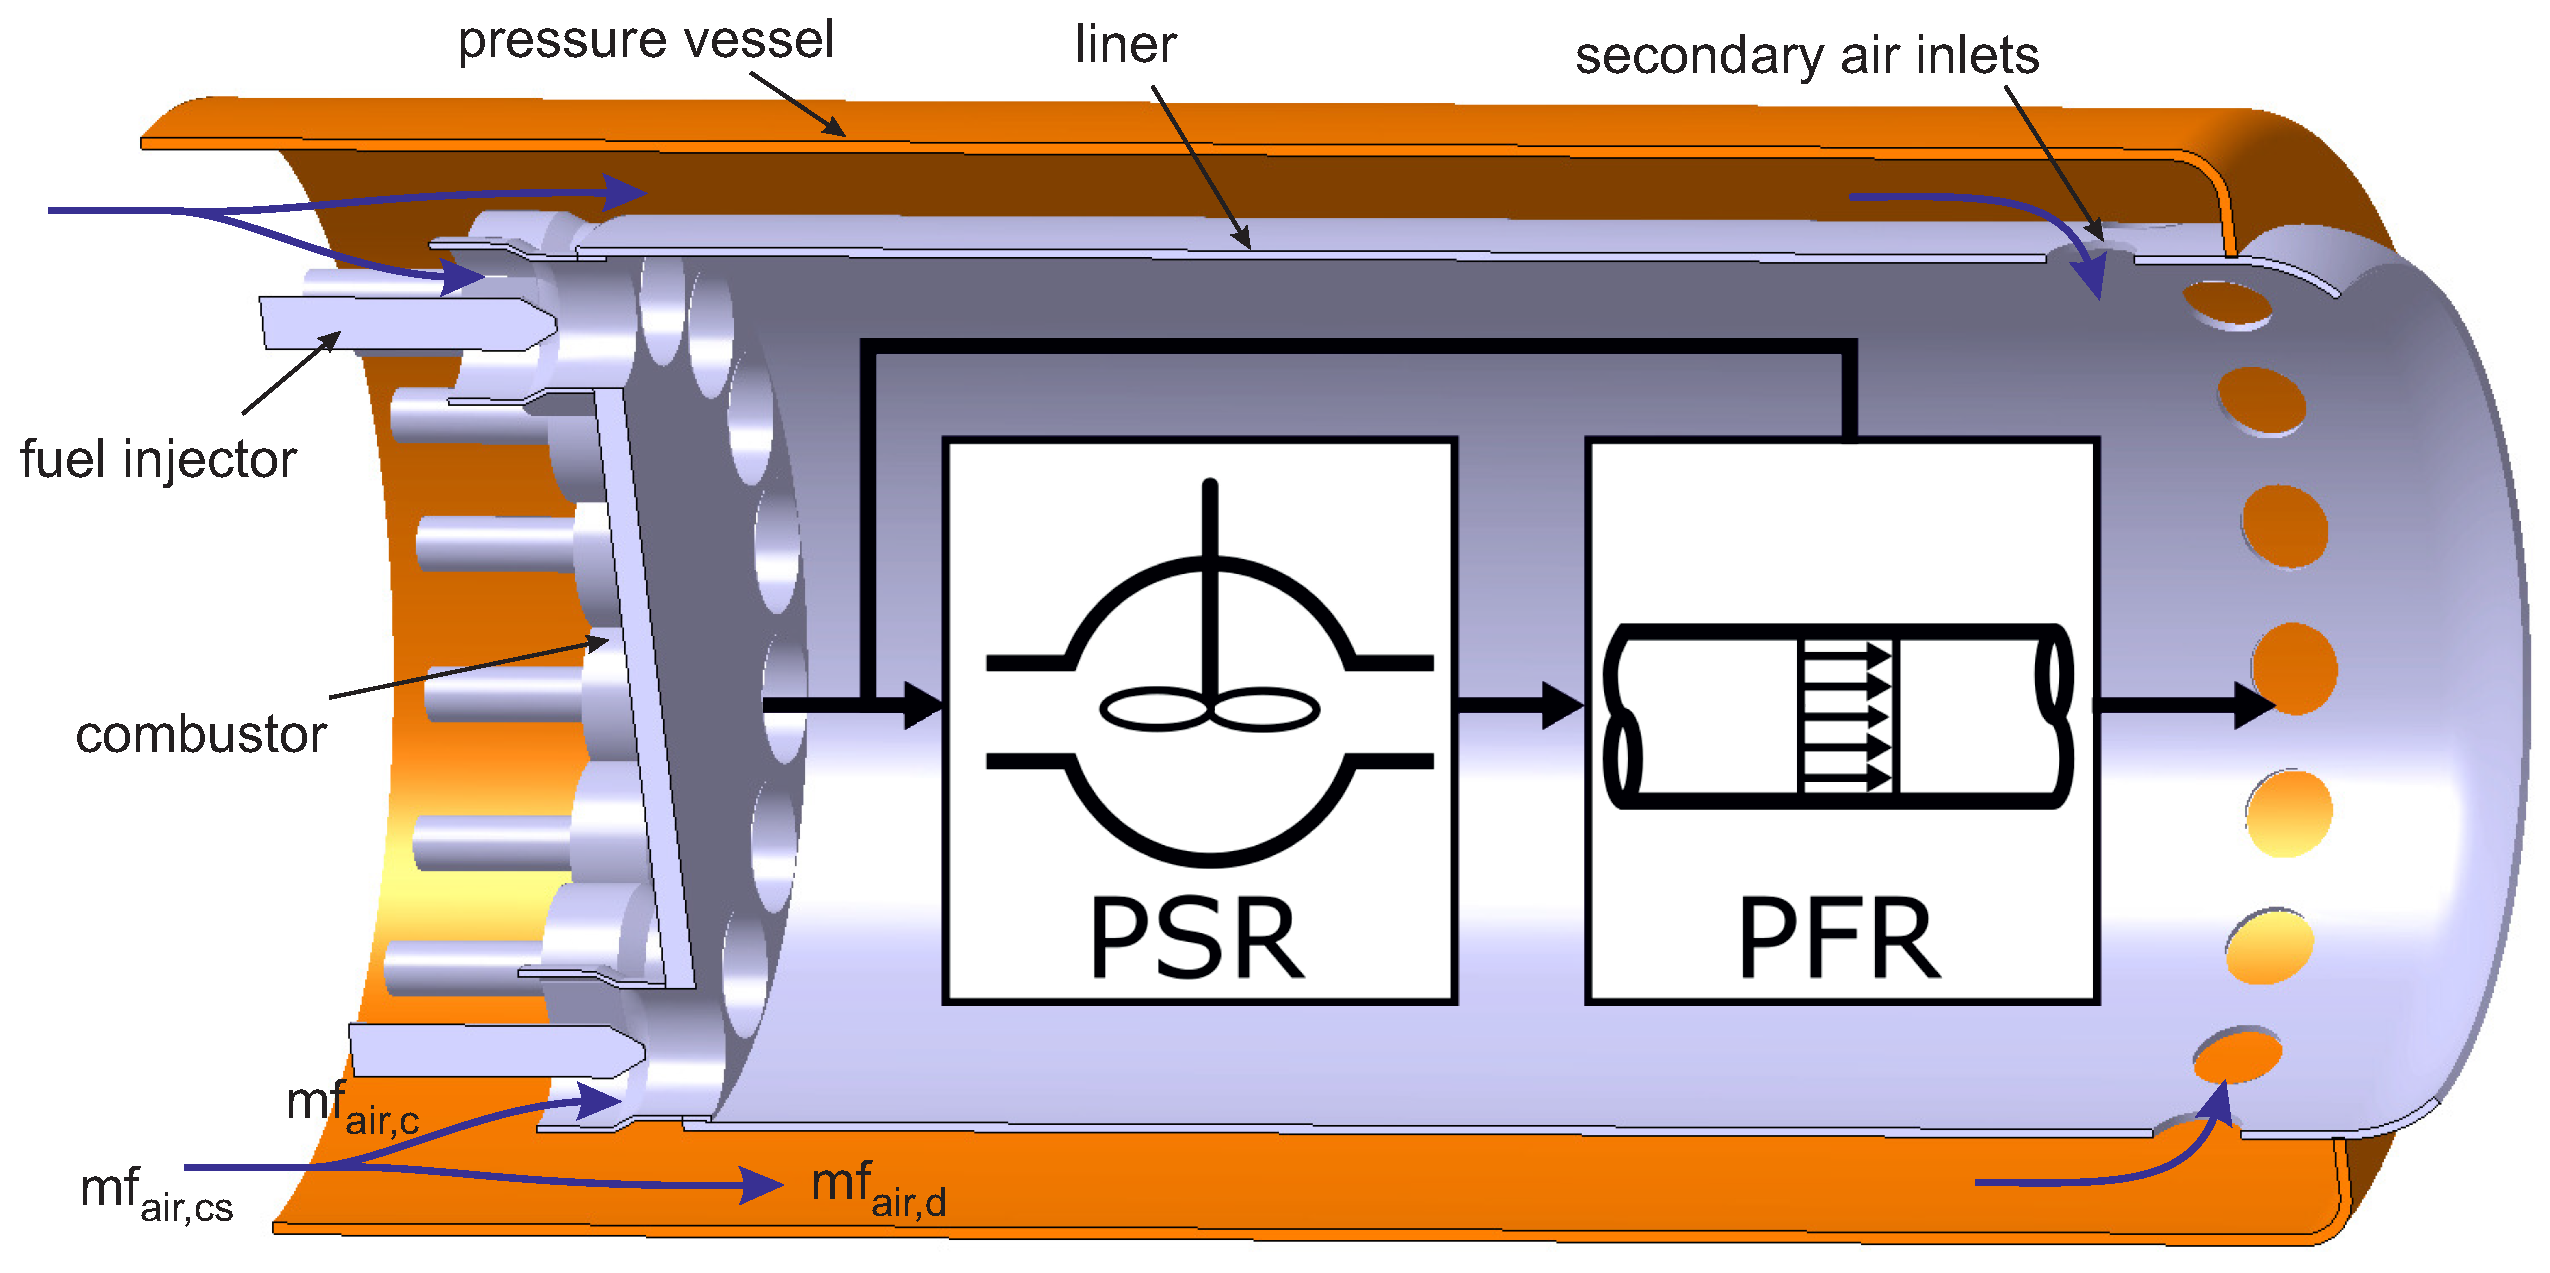
2.2. Combustion Chamber
2.2.1. Conventional Combustion
2.2.2. Advanced Combustion
2.2.3. Soot Emissions
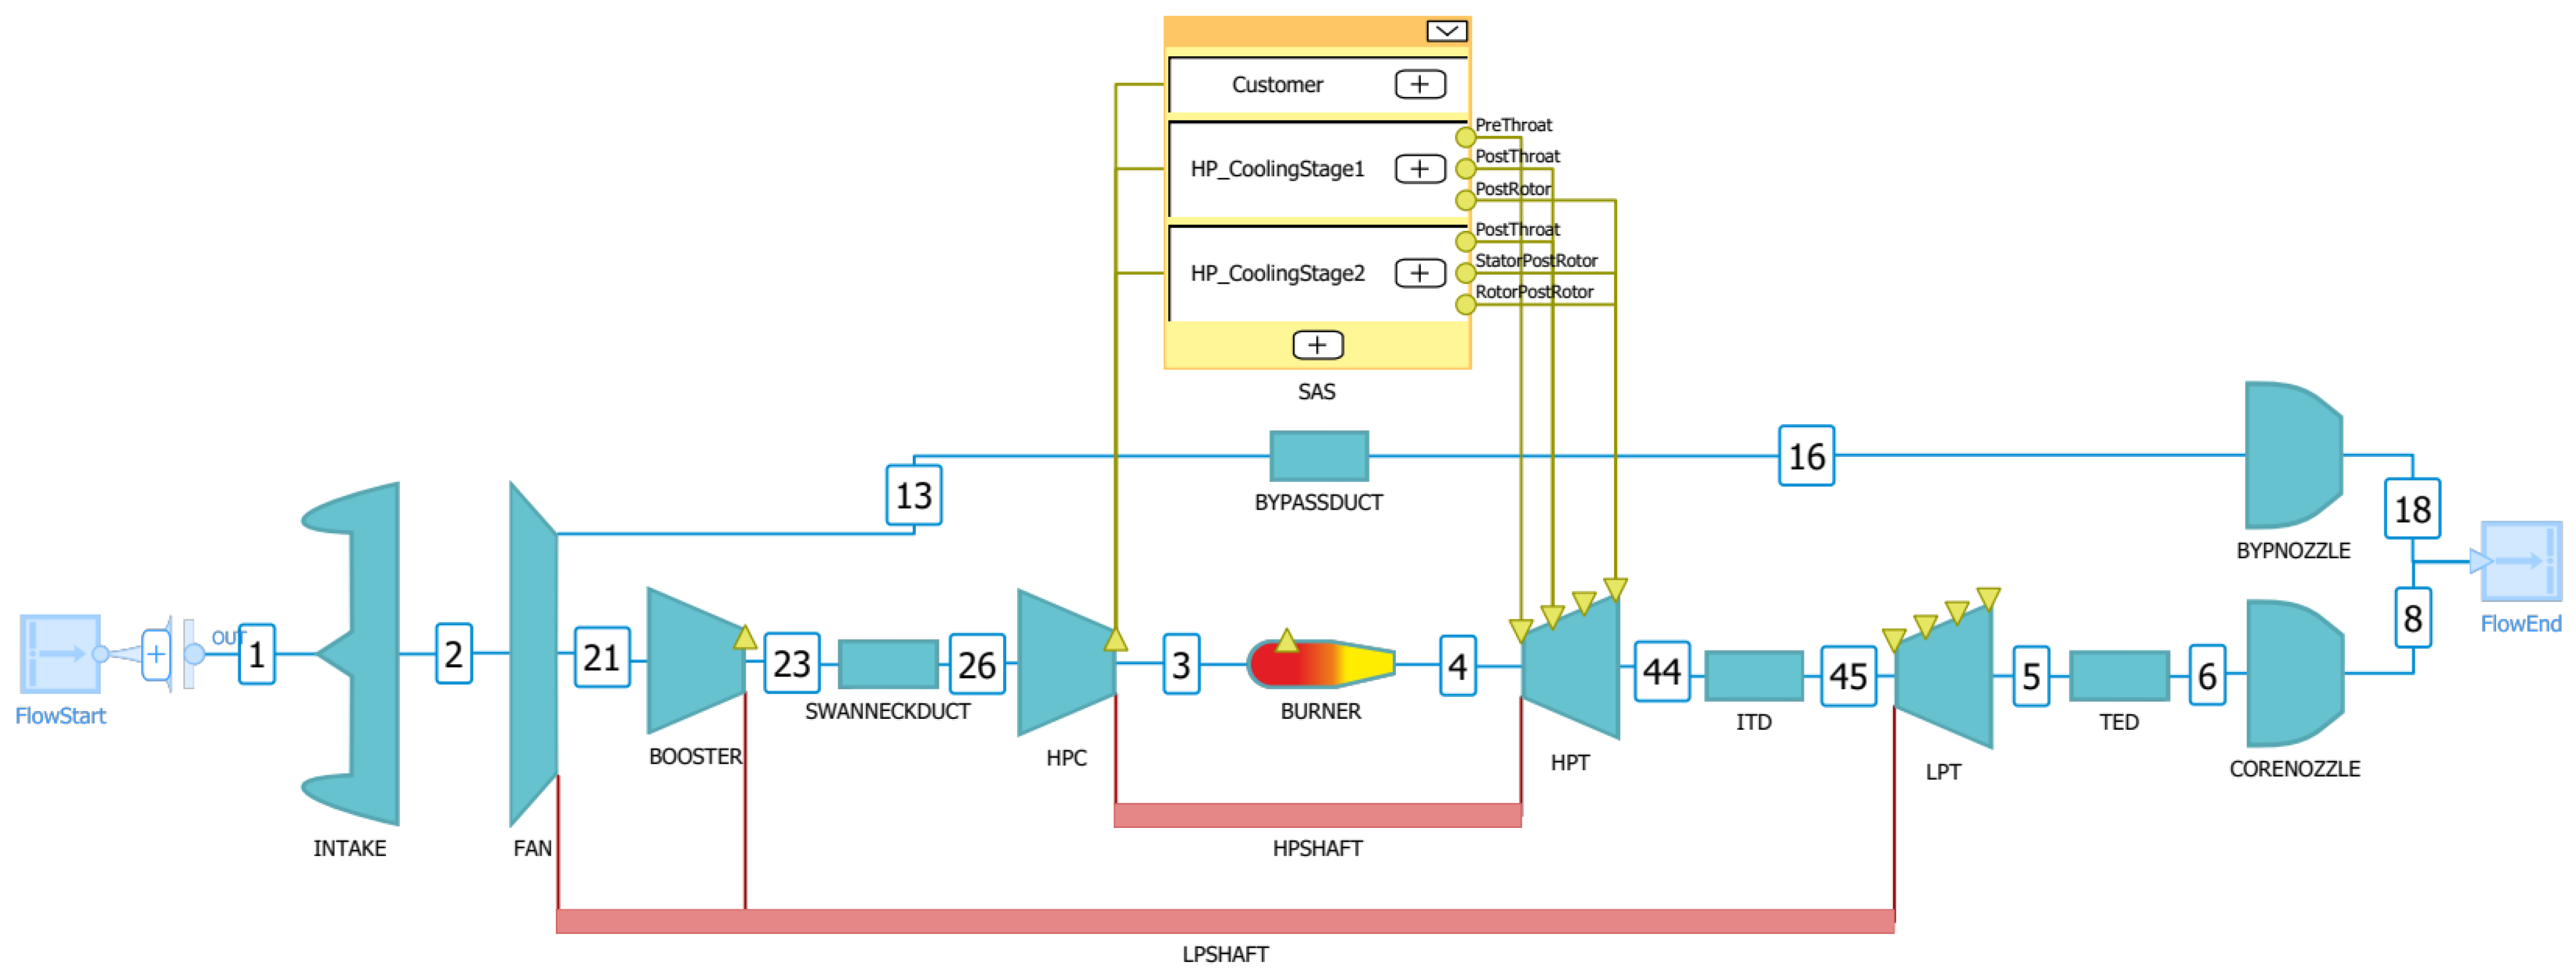
2.3. Turbofan Engine Performance
2.4. Aircraft Design and Operating Costs
2.5. Global Fleet Analysis and Operations
2.6. Climate Impact
3. Results
3.1. NOx Reduction Potential
3.2. Turbofan Engine Performance
3.3. Aircraft Design
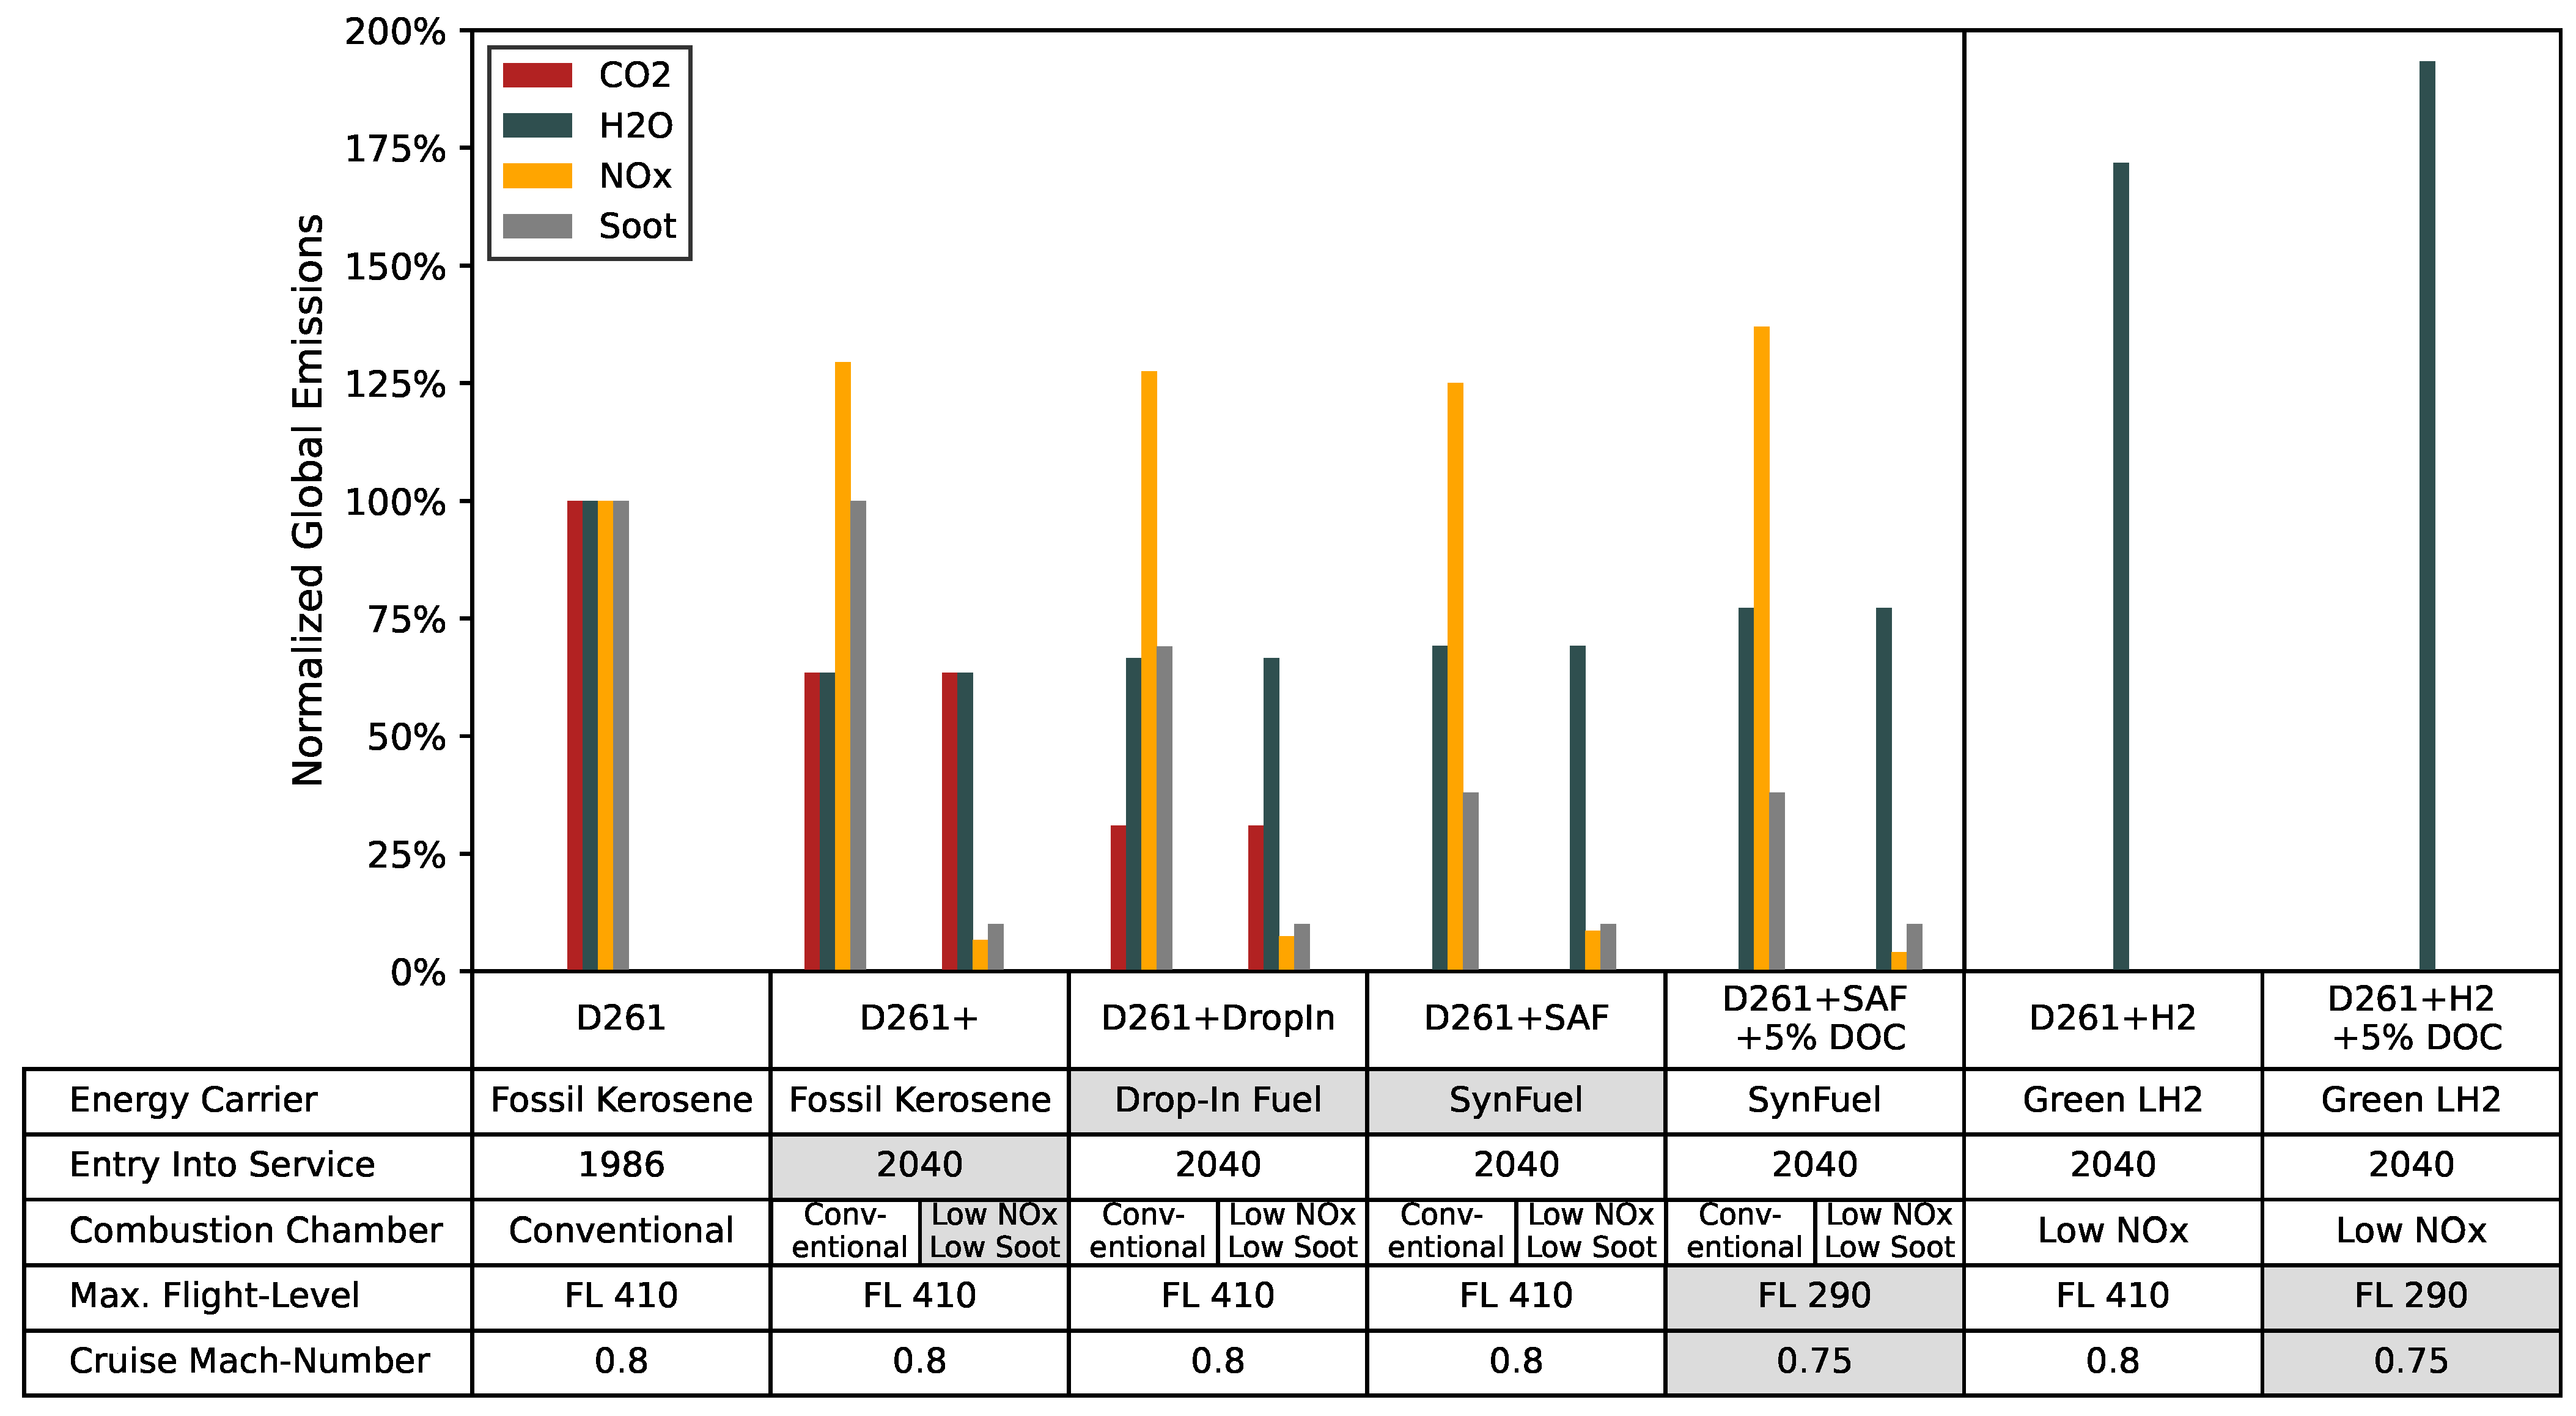
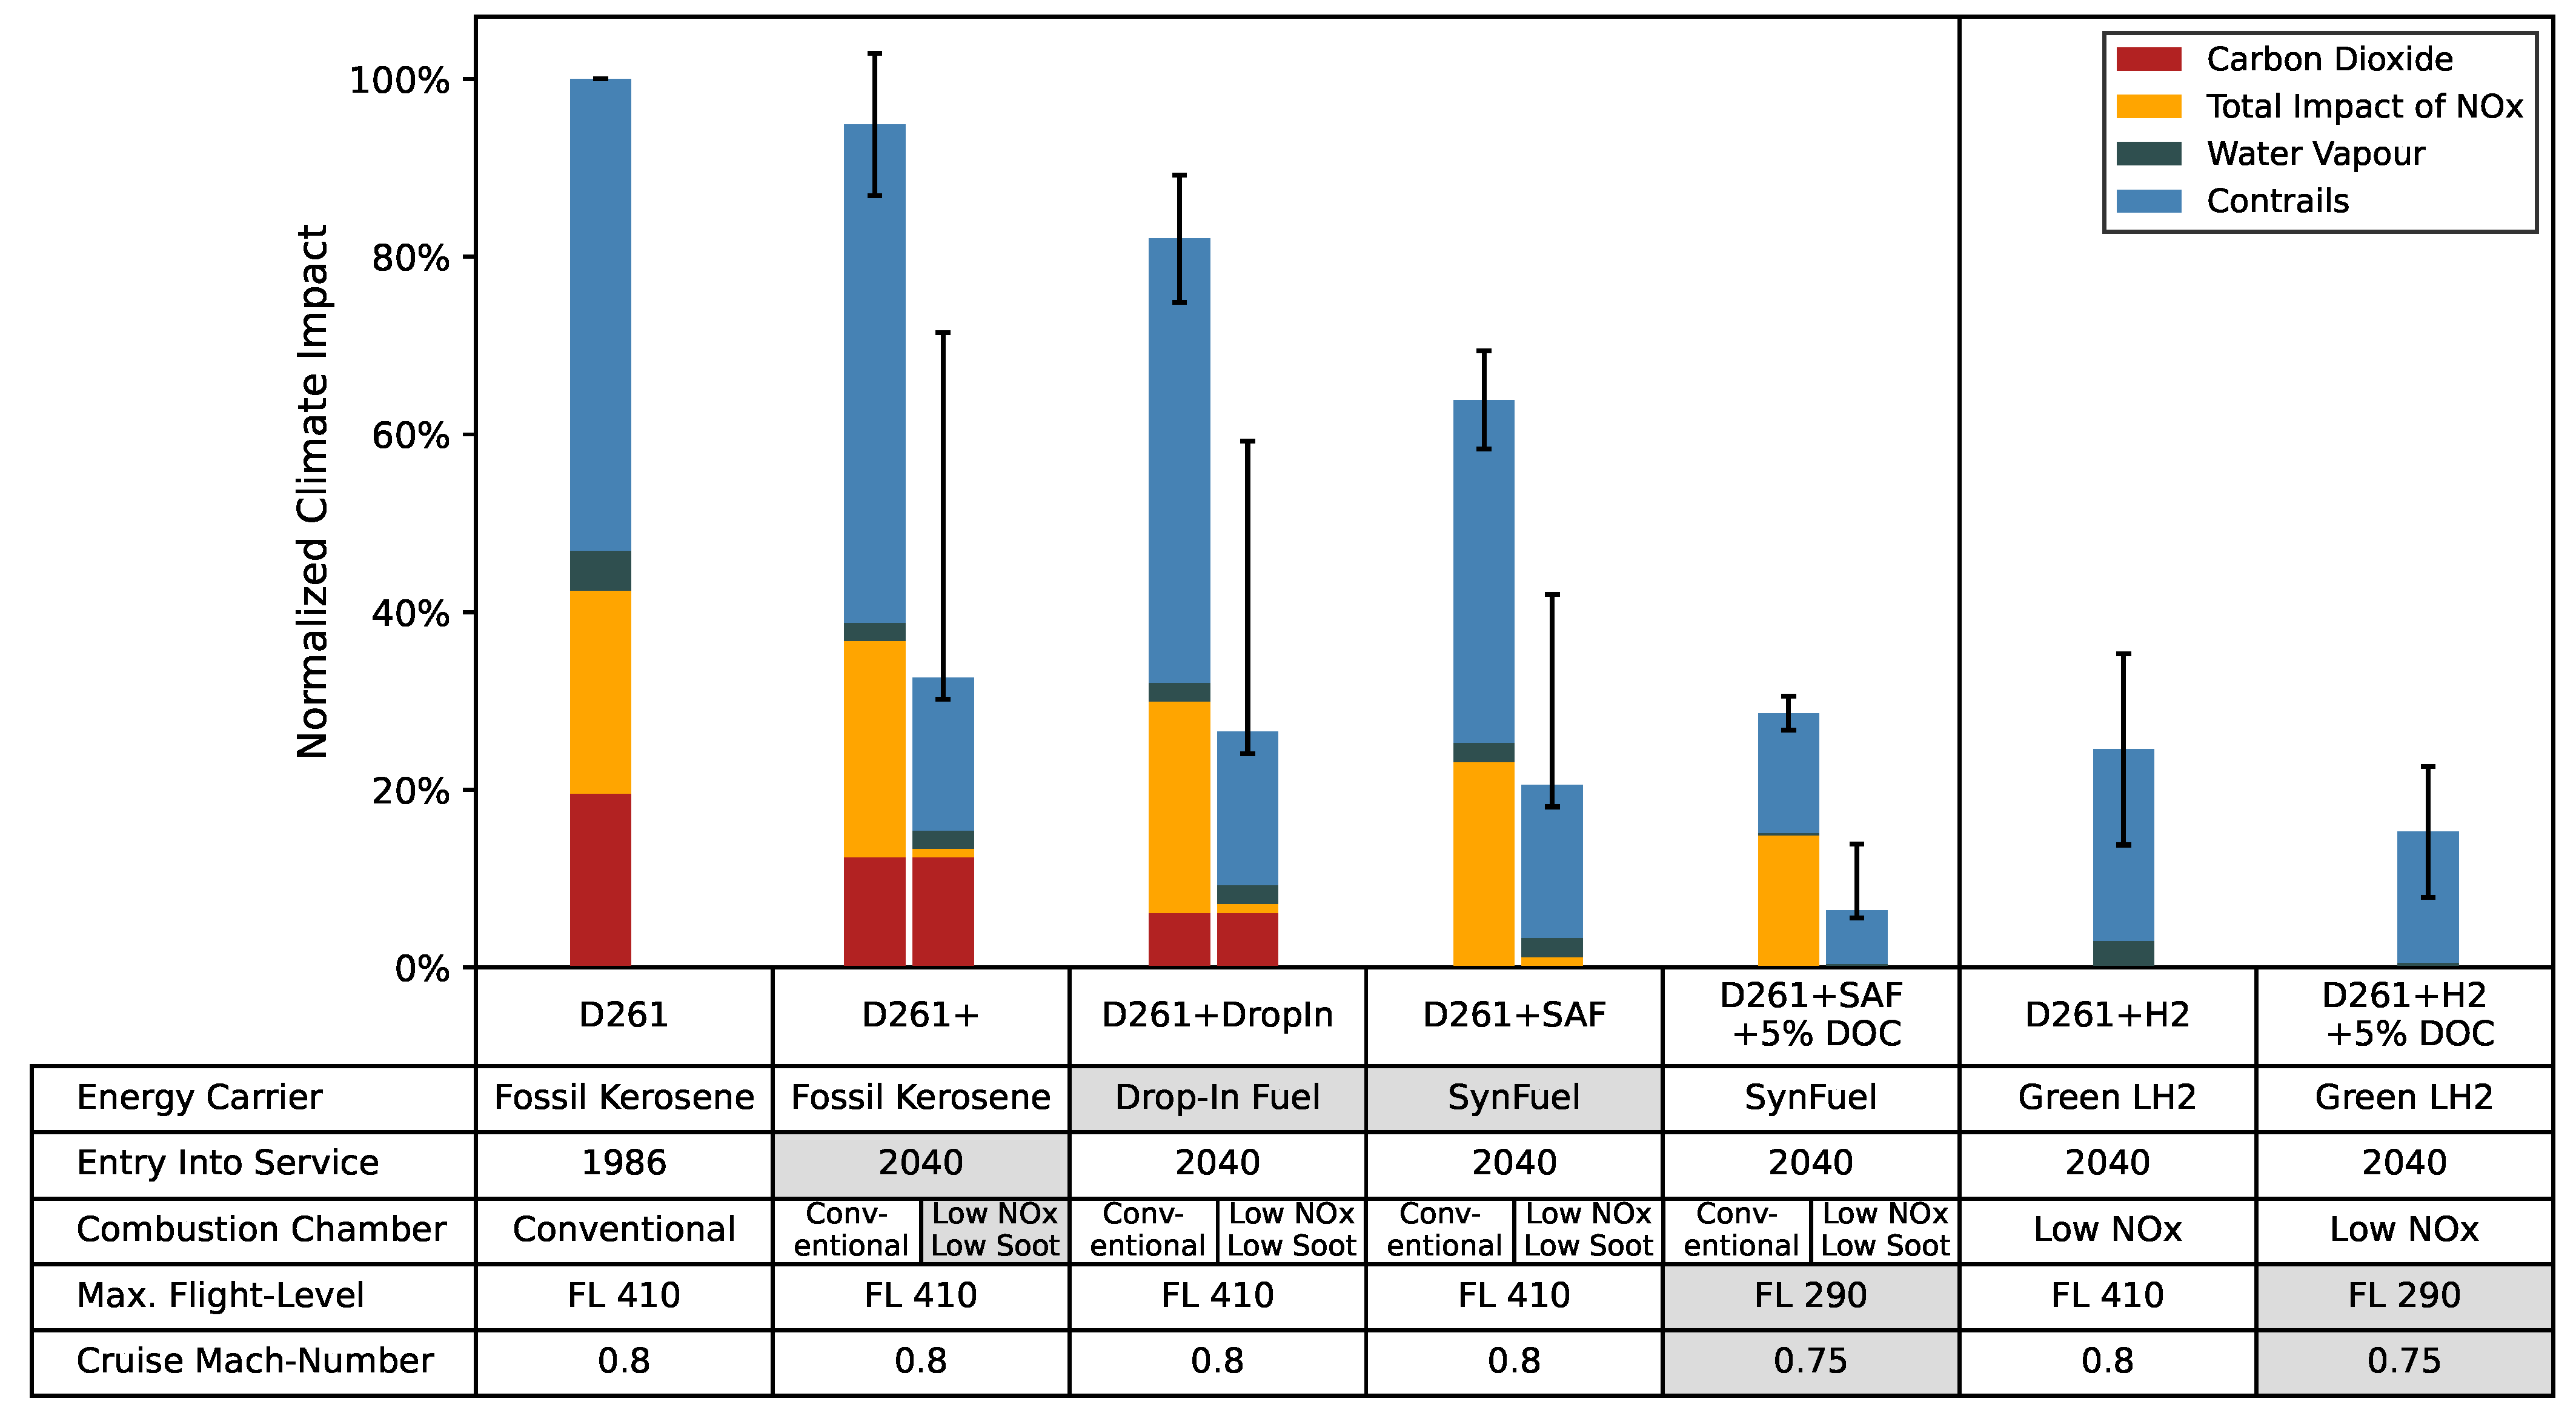
3.4. Global Emissions and Climate Impact Results
4. Conclusions
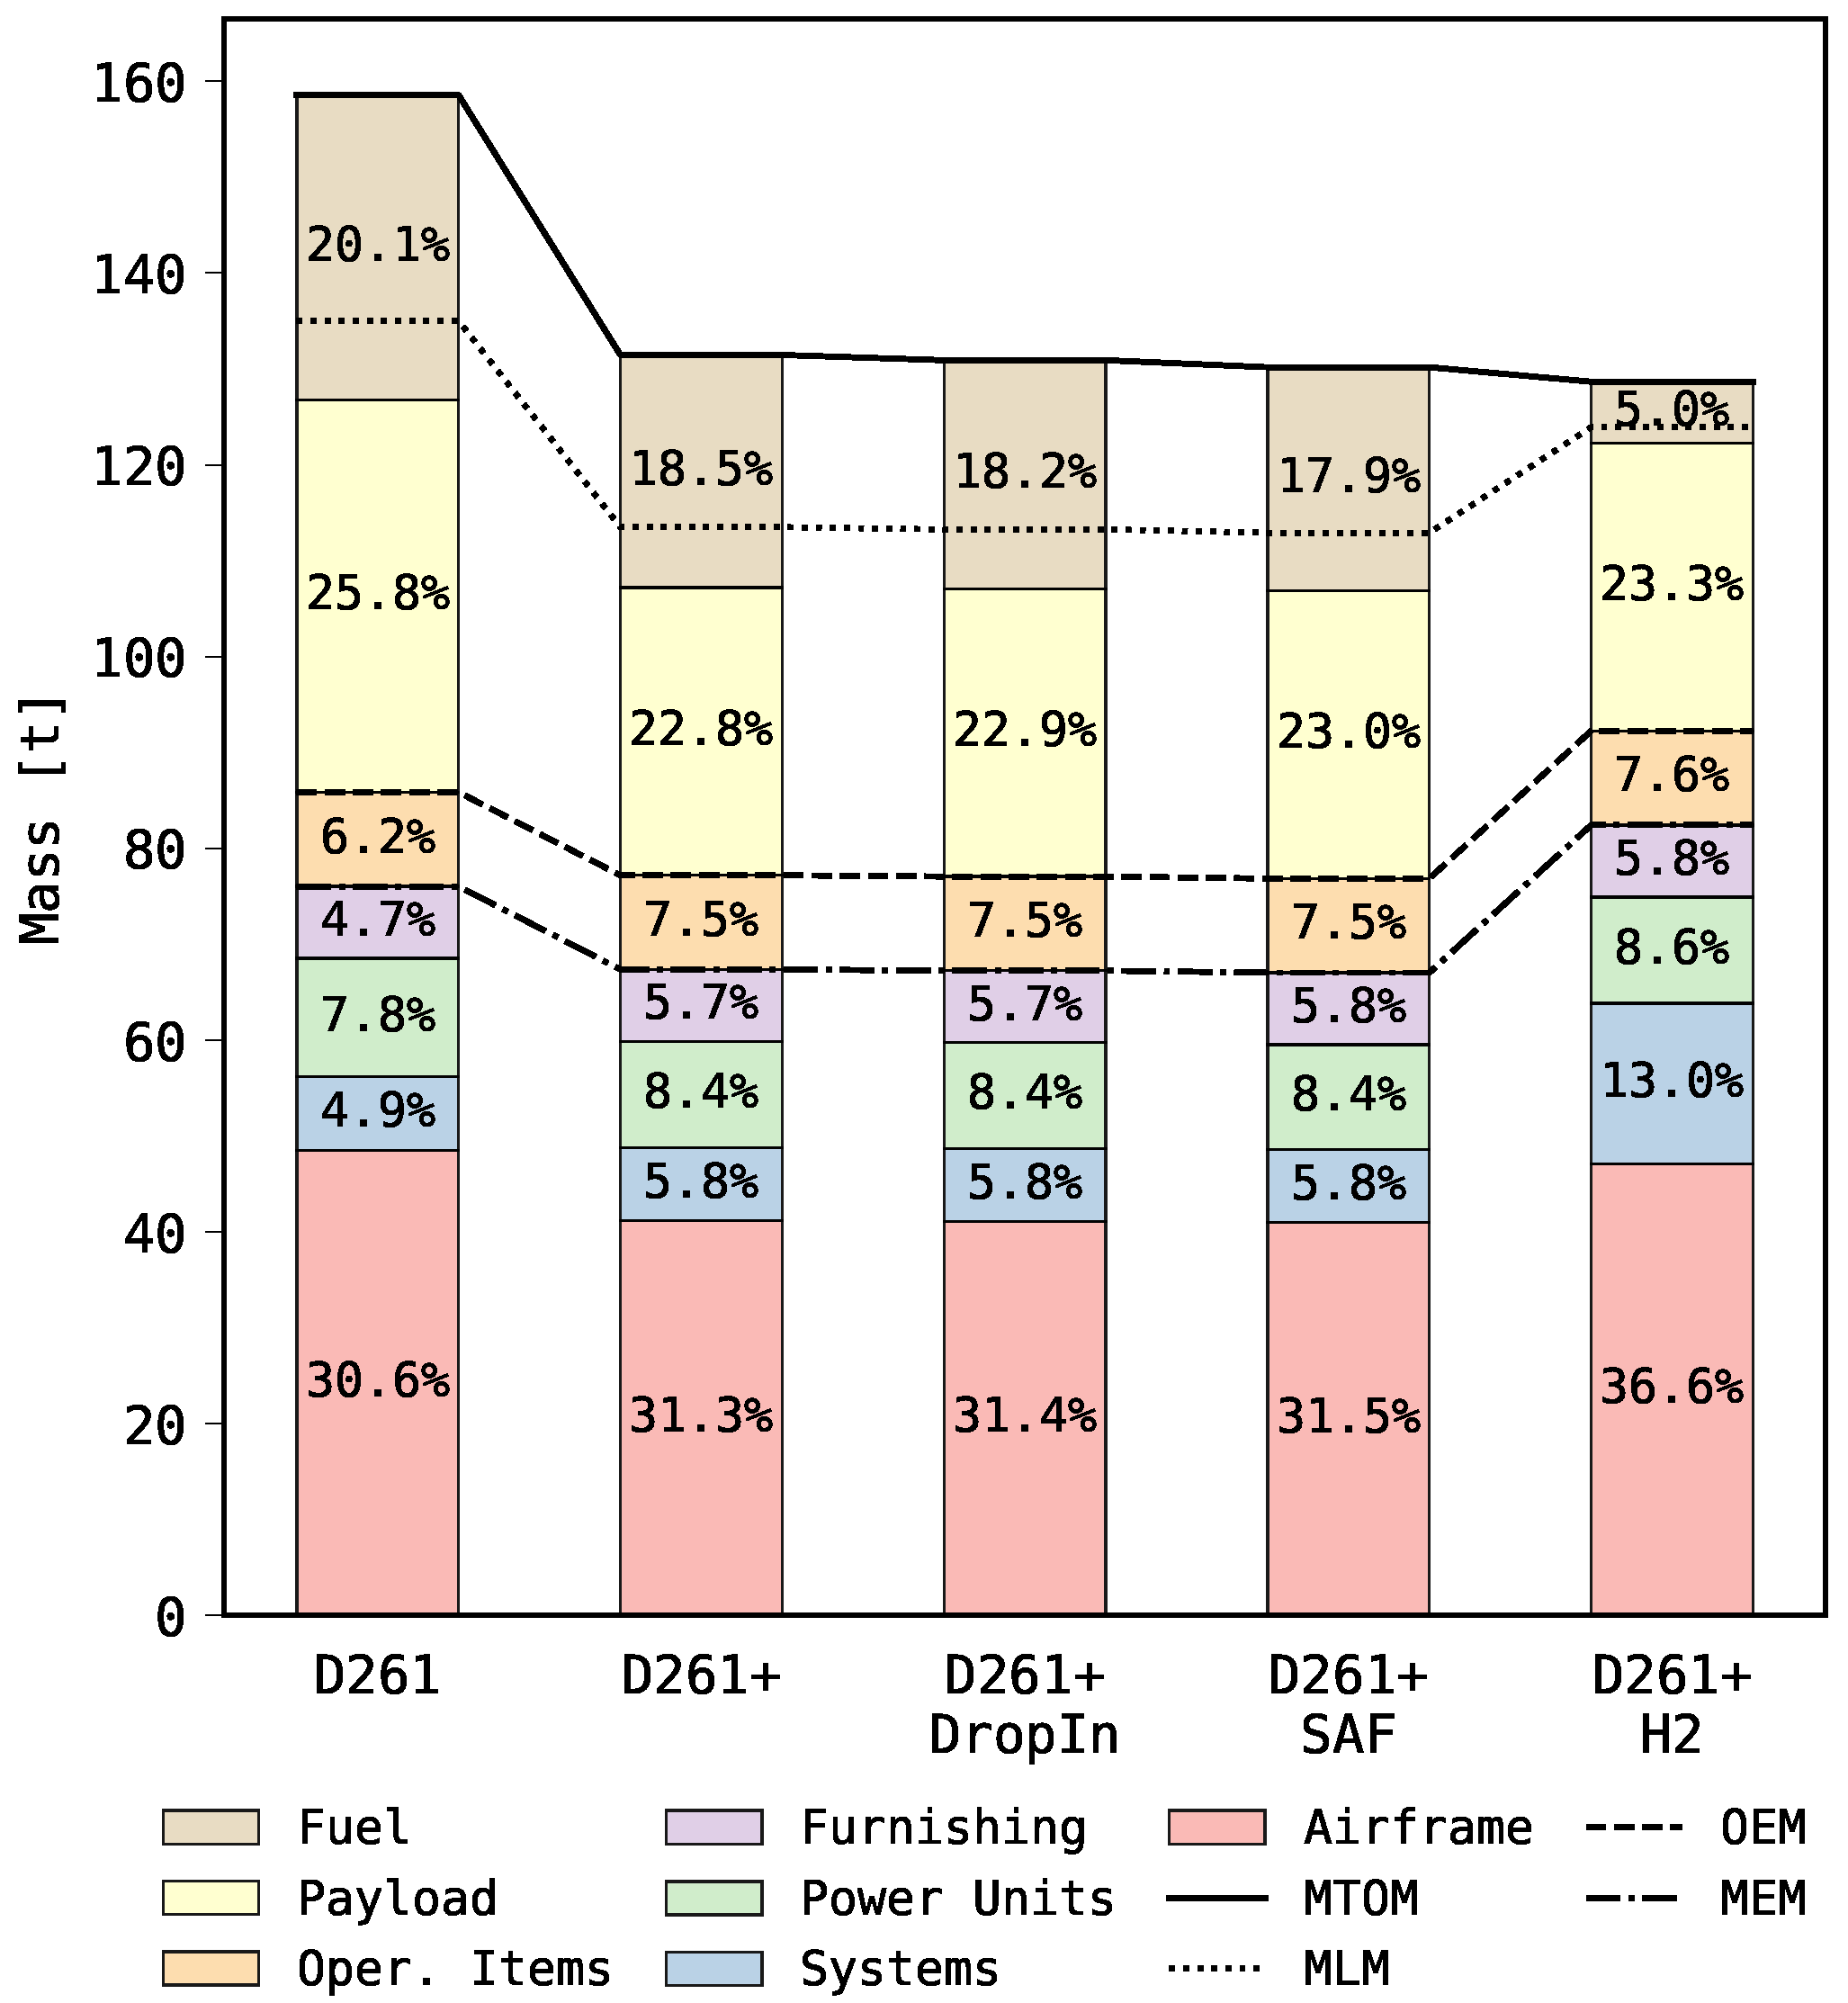
- The block-energy for the design mission of the liquid hydrogen (LH2) concept is just 3% higher than the synthetic kerosene one. This is due to the increased overall turbofan engine efficiency of about 7% which counteracts the aerodynamic and structural penalties.
- The increased engine efficiency results from the higher water content in the exhaust. This leads to a higher energy density due to the increased heat capacity which results in more powerful turbines for the same mass flow.
- The LH2 concept shows relaxed, low-speed thrust requirements leading to lower turbine entry temperatures at take-off engine rating compared with the kerosene concepts. This is due to the smaller difference between MTOM and MLM which results from the higher energy density of LH2. The wing area and high-lift system is sized for Maximum Landing Mass (MLM) condition leading to lower wing loadings at Maximum Take-Off Mass (MTOM).
- Compared to the reference concept, the advanced combustion technology based on the Flameless Oxidation (FLOX) concept achieves 91% and 99.8% global NOx emission reduction for kerosene and hydrogen, respectively.
- The biggest lever in climate impact reduction is the advanced low-NOx and low-soot combustion chamber technology. The difference between the D261+ which is an evolutionary baseline concept for entry into service (EIS) 2040 and fossil fuel with conventional combustion and the one with advanced combustion chambers (FLOX) is 67%. This reduction is due to the strongly decreased NOx and particles emission, which causes a reduction in the total NOx and contrail induced cloudiness (CiC) impact. In other words, the rigorously implementation of advanced low-NOx and low-soot combustion chamber technology leads to 67% impact reduction.
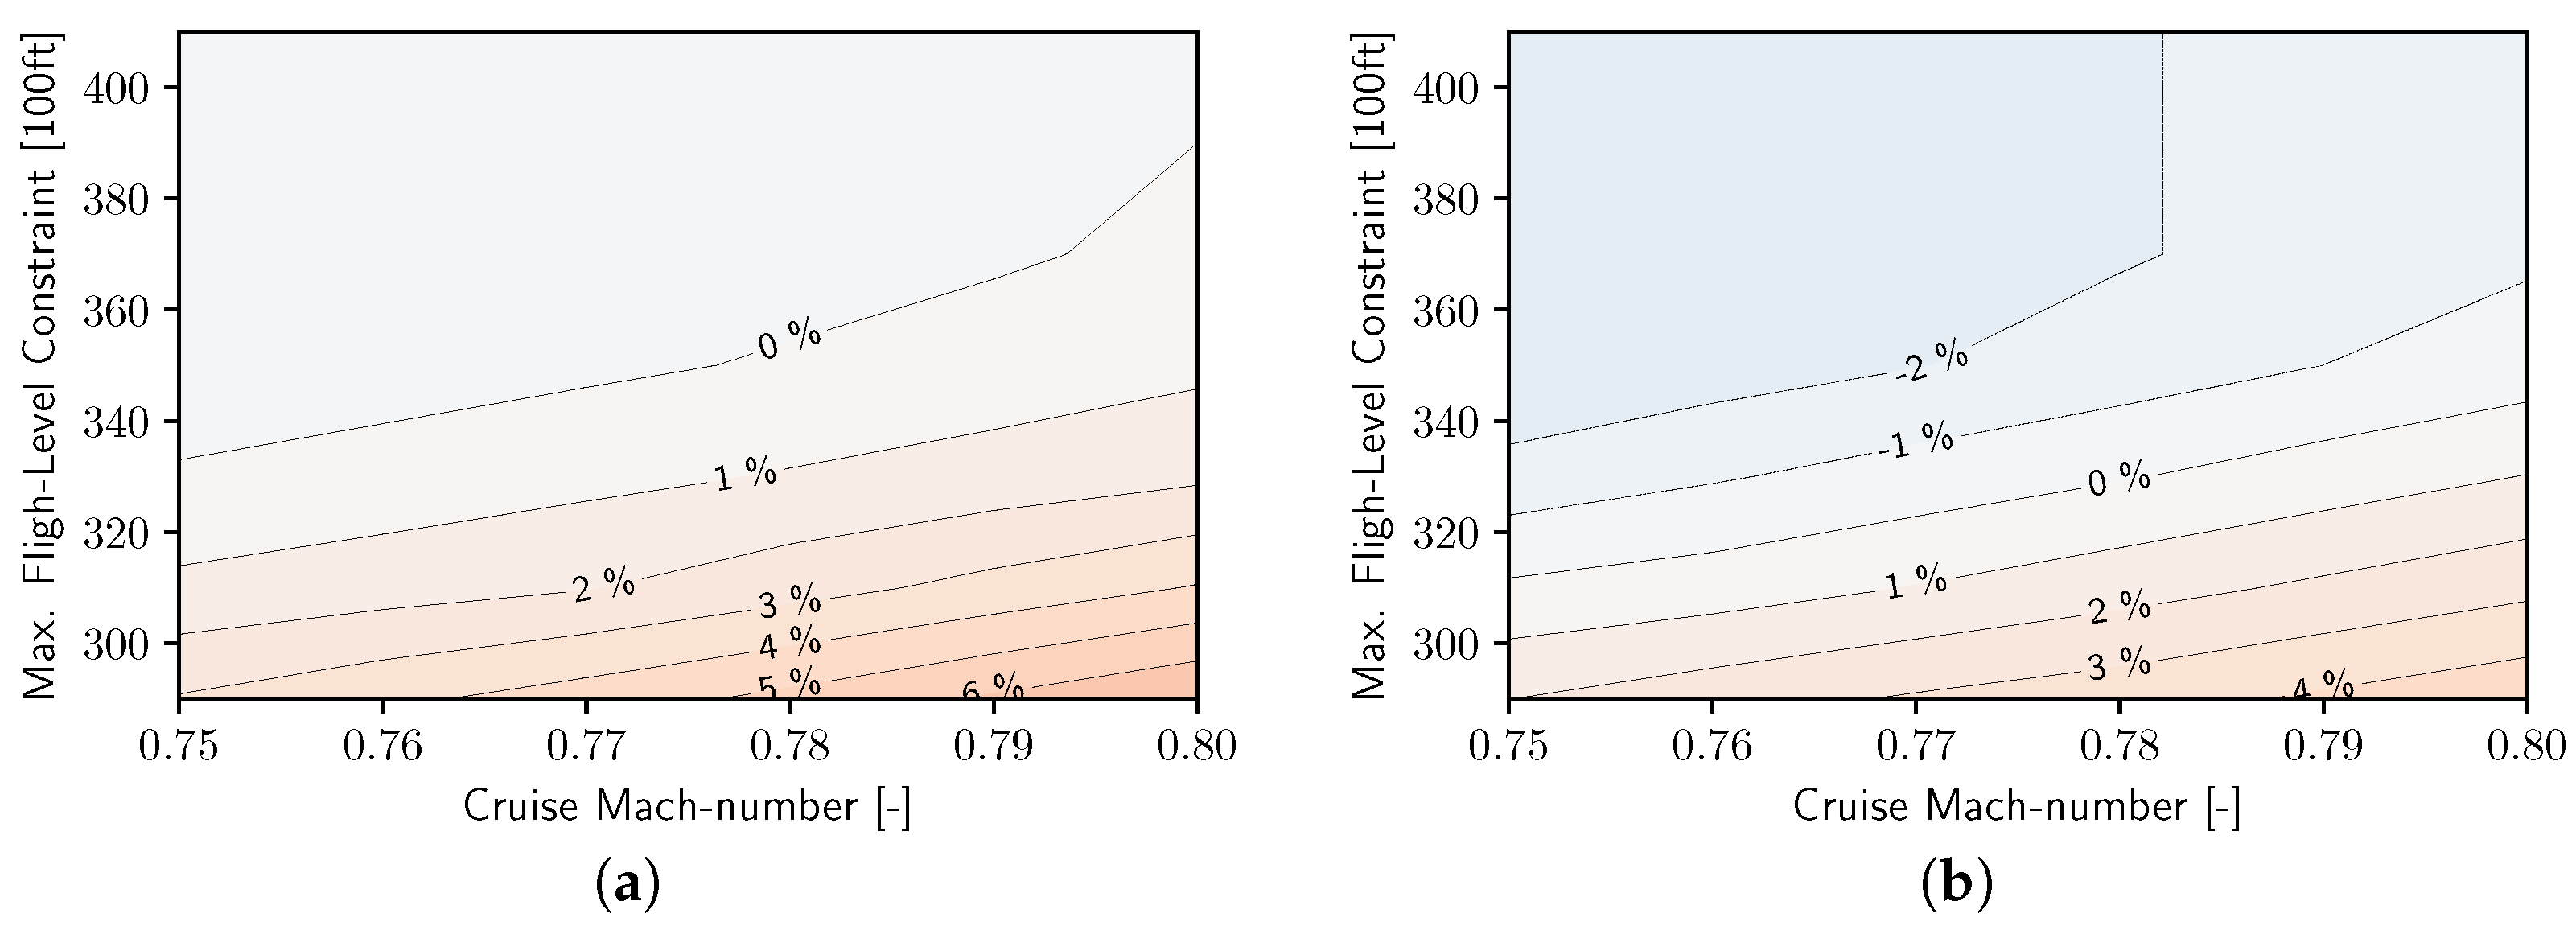
- The second biggest lever is the implementation of flying in lower altitudes to effectively reduce the non-CO2 effects. In this study, a pure altitude constraint of flight level 290 and an reduced Mach number of 0.75 is applied leading to significant non-CO2 impact reductions, but also to 5% higher global fleet level Direct Operating Costs. This impact reduction can potentially be further increased if additional, more precise measures, such as flexible no-fly zones for very sensitive airspaces, are employed.
- The third biggest lever is the use of sustainable energy carriers. Together with the previous two measures and the assumption of green hydrogen and synthetic kerosene with renewable carbon sources, a combined climate impact reduction of 85% and 93% for the LH2 and the synthetic kerosene case can be achieved, respectively. Although the impact in terms of Average Temperature Response (ATR) is only the third biggest, the reduction in CO2 emissions is very important, on the one hand due to the very long lifetime of CO2 in the atmosphere, and on the other hand due to the additional fuel consumption for flying in lower altitudes for avoidance of non-CO2 effects.
- Significant climate impact reductions with pure efficiency improvements are not possible. However, combined with the described additional measures, it plays an important role to counteract the increasing costs of renewable energy carriers.
- Due to the small database for the prediction of contrails by hydrogen burning turbofan engines, there is a significant uncertainty which will be tackled in future work. Furthermore, the uncertainties for low-NOx and low-soot combustion of the hydro-carbon powered concepts is rather high, as the effect of reduced soot emissions at contrail impact reduction is not yet understood profoundly.
- The Mach number and altitude constraint variation should be increased in future studies, also including the change in thrust provider from ducted fans to open rotors down to propellers for lower Mach numbers. This could significantly boost the vehicle performance and reduce the climate impact even more.
- Overall, it can be concluded that a significant climate impact reduction in these representative mid-range aircraft is possible with both synthetic kerosene and liquid hydrogen together with advanced combustion chamber technologies and effective contrail avoidance strategies. However, it cannot be concluded which energy carrier has a higher potential for this scenario, as the uncertainties, especially for contrail impact, are rather high.
Author Contributions
Funding
Institutional Review Board Statement
Informed Consent Statement
Data Availability Statement
Conflicts of Interest
Abbreviations
| AN | Turbine loading parameter |
| ATR | Average Temperature Response |
| BE | Block Energy |
| BPR | Bypass Ratio |
| C | High Lift Coefficient |
| CAPEX | Capital Expenditures |
| CFRP | Carbon Fibre Reinforced Polymers |
| CiC | Contrail Induced Cloudiness |
| CPACS | Common Parametric Aircraft Configuration Schema |
| DAC | Direct Air Capturing |
| DOC | Direct Operating Costs |
| EI | Emission Index |
| EIS | Entry Into Service |
| FAR | Fuel-to-Air Ratio |
| FL | Flight Level |
| FLOX | Flameless Oxidation |
| GTlab | Gas Turbine Laboratory |
| HEFA | Hydroprocessed Esters and Fatty Acids |
| ISA | International Standard Atmosphere |
| ICAO | International Civil Aviation Organization |
| LBO | Lean Blow Off |
| LH2 | Liquid Hydrogen |
| LHV | Lower Heating Value |
| LoD | Lift-over-Drag ratio |
| LTO | Landing and Take-Off cycle |
| Air mass flow | |
| MEM | Manufacturing Empty Mass |
| MLM | Maximum Landing Mass |
| MTOM | Maximum Take-Off Mass |
| nvPM | non volatile particles |
| OEM | Operating Empty Mass |
| OPR | Overall Pressure Ratio |
| Pressure at combustion chamber entry | |
| PAX | Passengers |
| PFR | Plug Flow Reactor |
| PSR | Perfectly Stirred Reactor |
| PtL | Power to Liquid |
| Weighting factor | |
| R | Universal gas constant J/(Mol K) |
| RC | Recurring Costs |
| RCE | Remote Component Environment |
| RF | Radiative Forcing |
| S | Air Split |
| SAC | Schmidt-Appleman Criterion |
| SAF | Sustainable Aviation Fuel |
| SL | Sea Level |
| Temperature at combustion chamber entry | |
| Equilibrium temperature | |
| Stoichiometry temperature | |
| Flame temperature | |
| Primary zone temperature | |
| TET | Turbine Entry Temperature |
| TLARs | Top Level Aircraft Requirements |
| TO | Take-Off |
| TOC | Top Of Climb |
| TOFL | Take-Off Field Lengths |
| TSEC | Thrust Specific Energy Consumption |
| TSFC | Thrust Specific Fuel Consumption |
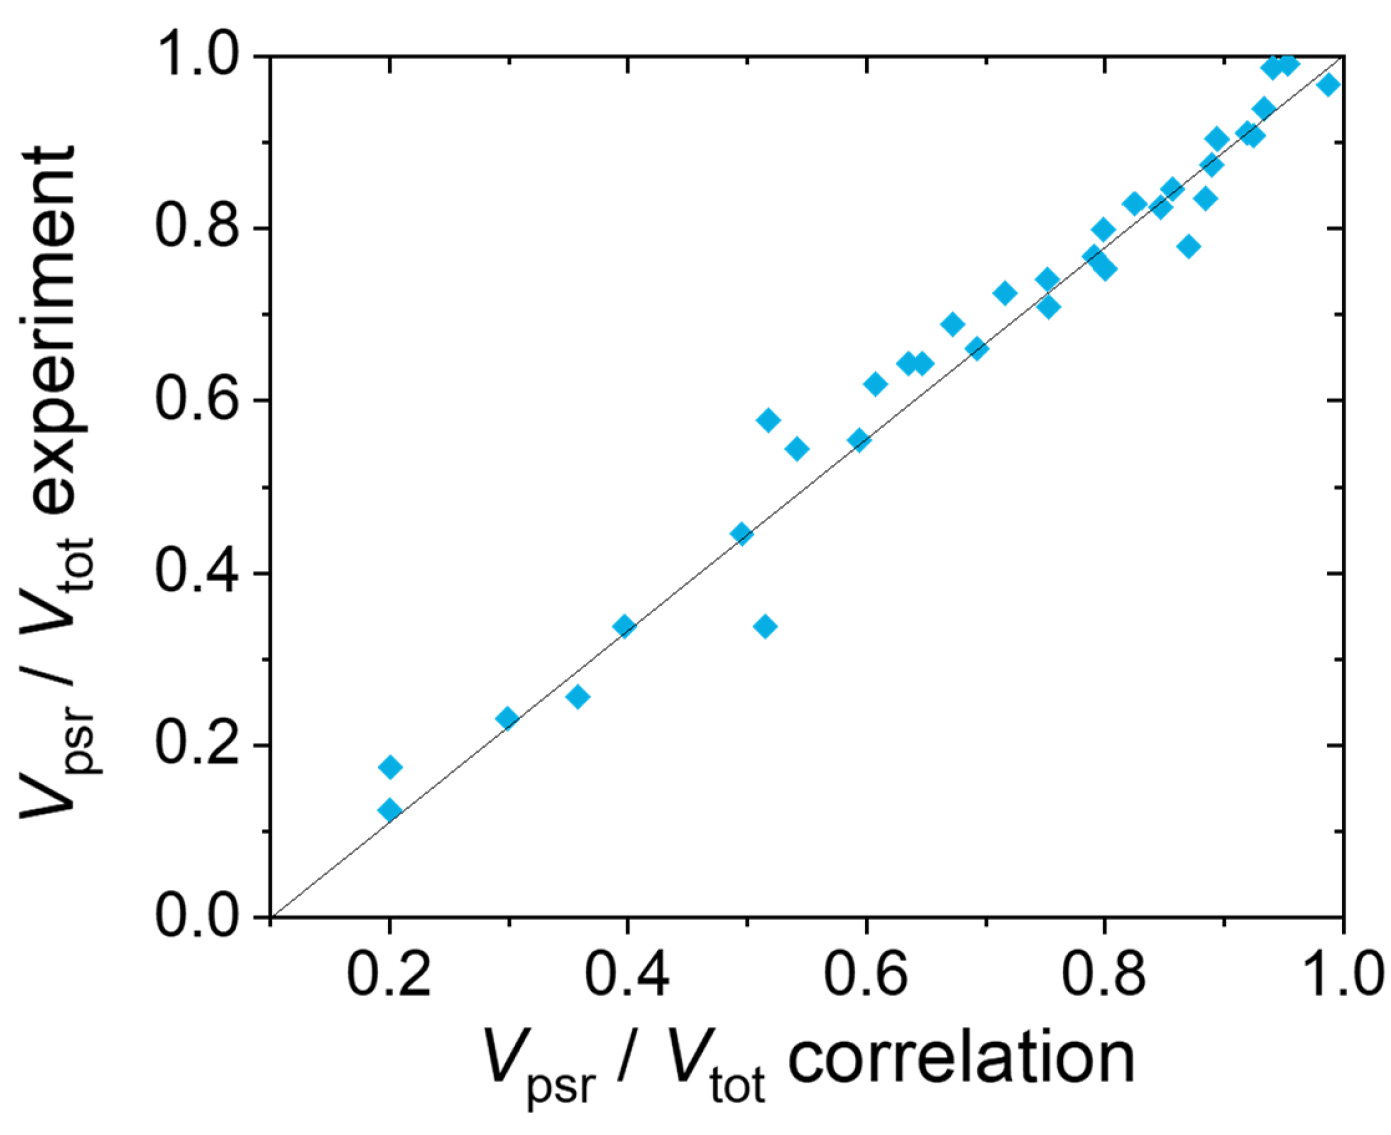
| Volume of the perfectly stirred reactor | |
| Volume of total combustion chamber | |
| vPM | volatile particles |
| Relative change in particle number emissions | |
| Overall propulsion efficiency | |
| Air-fuel equivalence ratio |
Appendix A

References
- Voigt, C.; Kleine, J.; Sauer, D.; Moore, R.H.; Bräuer, T.; Le Clercq, P.; Kaufmann, S.; Scheibe, M.; Jurkat-Witschas, T.; Aigner, M.; et al. Cleaner burning aviation fuels can reduce contrail cloudiness. Commun. Earth Environ. 2021, 2, 114. [Google Scholar] [CrossRef]
- Kramer, S.; Andac, G.; Heyne, J.; Ellsworth, J.; Herzig, P.; Lewis, K.C. Perspectives on Fully Synthesized Sustainable Aviation Fuels: Direction and Opportunities. Front. Energy Res. 2022, 9, 782823. [Google Scholar] [CrossRef]
- Goodwin, D.G.; Moffat, H.K.; Speth, R.L. Cantera: An Object-Oriented Software Toolkit for Chemical Kinetics, Thermodynamics, and Transport Processes; Caltech: Pasadena, CA, USA, 2009; Volume 124. [Google Scholar]
- Chandrasekaran, N.; Guha, A. Study of Prediction Methods for NOx Emission from Turbofan Engines. J. Propuls. Power 2012, 28, 170–180. [Google Scholar] [CrossRef]
- ICAO. Aircraft Engine Emissions Data Bank; Version 28; ICAO: Montreal, QC, Canada, 2021. [Google Scholar]
- Plohr, M. Anwendungsorientierte Methoden zur Analyse und Modellierung des Emissionsverhaltens Moderner Triebwerke mit Gestuften, Mageren Brennkammersystemen auf Basis Thermodynamischer Triebwerksmodelle. Ph.D. Thesis, Ruhr-Universität Bochum, Universitätsbibliothek, Bochum, Germany, 2016. [Google Scholar]
- Stöppler, B. Entwicklung einer verbesserten Korrelation für die Stickoxidemission von Flugtriebwerken; Technical Report; Institute of Propulsion Technology, German Aerospace Center (DLR): Berlin, Germany, 1992. [Google Scholar]
- Grewe, V.; Stenke, A.; Plohr, M.; Korovkin, V.D. Climate functions for the use in multi-disciplinary optimisation in the pre-design of supersonic business jet. Aeronaut. J. 2010, 114, 259–269. [Google Scholar] [CrossRef]
- Zanger, J.; Monz, T.; Aigner, M. Experimental Investigation of the Combustion Characteristics of a Double-Staged FLOX-Based Combustor on an Atmospheric and a Micro Gas Turbine Test Rig. In Proceedings of the ASME Turbo Expo: Turbine Technical Conference and Exposition—2015, Montreal, QC, Canada, 15–19 June 2015. [Google Scholar]
- Seliger-Ost, H.; Kutne, P.; Zanger, J.; Aigner, M. Experimental Investigation of the Impact of Biogas on a 3 kW Micro Gas Turbine FLOX®-Based Combustor. J. Eng. Gas Turbines Power 2021, 143, 081020. [Google Scholar] [CrossRef]
- Hasemann, S.; Huber, A.; Naumann, C.; Aigner, M. Investigation of a FLOX-based Combustor For a Micro gas Turbine With Exhaust Gas Recircuulation. In Proceedings of the ASME Turbo Expo: Turbine Technical Conference and Exposition, Charlotte, NC, USA, 26–30 June 2017. [Google Scholar]
- Lingstädt, T.; Grimm, F.; Krummrein, T.; Kutne, P.; Aigner, M. Atmospheric Experimental Investigations of a Jet-Stabilized SOFC Off-Gas Combustor for a Hybrid Power Plant operated with Biogas. In Proceedings of the AIAA Scitech 2019 Forum, San Diego, CA, USA, 7–11 January 2019. [Google Scholar] [CrossRef]
- Schwärzle, A.; Monz, T.O.; Huber, A.; Aigner, M. Detailed Examination of a Modified Two-Stage Micro Gas Turbine Combustor. J. Eng. Gas Turbines Power 2017, 140, 021501. [Google Scholar] [CrossRef]
- Zornek, T.; Monz, T.; Aigner, M. Performance analysis of the micro gas turbine Turbec T100 with a new FLOX-combustion system for low calorific fuels. Appl. Energy 2015, 159, 276–284. [Google Scholar] [CrossRef]
- Lammel, O.; Schütz, H.; Schmitz, G.; Lückerath, R.; Stöhr, M.; Noll, B.; Aigner, M.; Hase, M.; Krebs, W. FLOX® Combustion at High Power Density and High Flame Temperatures. J. Eng. Gas Turbines Power 2010, 132, 121503. [Google Scholar] [CrossRef]
- Grimm, F.; Lingstädt, T.; Kutne, P.; Aigner, M. Numerical and Experimental Study of a Jet-and-Recirculation Stabilized Low Calorific Combustor for a Hybrid Power Plant. Energies 2021, 14, 537. [Google Scholar] [CrossRef]
- Lückerath, R.; Meier, W.; Aigner, M. FLOX Combustion at High Pressure With Different Fuel Compositions. J. Eng. Gas Turbines Power 2008, 130, 011505. [Google Scholar] [CrossRef]
- Schmitz, O.; Kaiser, S.; Klingels, H.; Kufner, P.; Obermüller, M.; Henke, M.; Zanger, J.; Grimm, F.; Schuldt, B.; Marcellan, A.; et al. Aero-Engine Concepts Beyond 2030: Part 3—Experimental Demonstration of Technological Feasibility. ASME J. Eng. Gas Turbines Power 2021, 143, 021003. [Google Scholar] [CrossRef]
- Seliger, H.; Huber, A.; Aigner, M. Experimental Investigation of a FLOX-Based Combustor For a Small-Scale Gas Turbine Based CHP System Under Atmospheric Conditions. In Proceedings of the ASME Turbo Expo: Turbine Technical Conference and Exposition, Montreal, QC, Canada, 15–19 June 2015. [Google Scholar] [CrossRef]
- Zanger, J. Experimentelle Charakterisierung eines atmosphärisch betriebenen, jet-stabilisierten Mikrogasturbinenbrenners für Erdgas. Ph.D. Thesis, University of Stuttgart, Stuttgart, Germany, 2016. [Google Scholar]
- Kathrotia, T.; Oßwald, P.; Zinsmeister, J.; Methling, T.; Köhler, M. Combustion kinetics of alternative jet fuels, Part-III: Fuel modeling and surrogate strategy. Fuel 2021, 302, 120737. [Google Scholar] [CrossRef]
- Kathrotia, T.; Oßwald, P.; Naumann, C.; Richter, S.; Köhler, M. Combustion kinetics of alternative jet fuels, Part-II: Reaction model for fuel surrogate. Fuel 2021, 302, 120736. [Google Scholar] [CrossRef]
- Glarborg, P.; Miller, J.A.; Ruscic, B.; Klippenstein, S.J. Modeling nitrogen chemistry in combustion. Prog. Energy Combust. Sci. 2018, 67, 31–68. [Google Scholar] [CrossRef]
- ICAO. Engine Exhaust Emissions Databank; ICAO: Montreal, QC, Canada, 2021. [Google Scholar]
- Reitenbach, S.; Krumme, A.; Behrendt, T.; Schnös, M.; Schmidt, T.; Hönig, S.; Mischke, R.; Mörland, E. Design and application of a multidisciplinary predesign process for novel engine concepts. J. Eng. Gas Turbines Power 2019, 141, 011017. [Google Scholar] [CrossRef]
- Reitenbach, S.; Vieweg, M.; Becker, R.; Hollmann, C.; Wolters, F.; Schmeink, J.; Otten, T.; Siggel, M. Collaborative Aircraft Engine Preliminary Design using a Virtual Engine Platform, Part A: Architecture and Methodology. In Proceedings of the AIAA Scitech 2020 Forum, Orlando, FL, USA, 6–10 January 2020. [Google Scholar] [CrossRef]
- Becker, R.G.; Wolters, F.; Nauroz, M.; Otten, T. Development of a gas turbine performance code and its application to preliminary engine design. In Proceedings of the Development of a Gas Turbine Performance Code and Its Application to Preliminary Engine Design, Bremen, Deutschland, 27–29 September 2011. [Google Scholar]
- Walsh, P.P.; Fletcher, P. Gas Turbine Performance; John Wiley & Sons, Ltd.: Hoboken, NJ, USA, 2004. [Google Scholar]
- Grieb, H. Projektierung von Turboflugtriebwerken; Springer: Berlin/Heidelberg, Germany, 2013. [Google Scholar]
- Guha, A. Optimum fan pressure ratio for bypass engines with separate or mixed exhaust streams. J. Propuls. Power 2001, 17, 1117–1122. [Google Scholar] [CrossRef]
- Vieweg, M.; Reitenbach, S.; Hollmann, C.; Schnös, M.; Behrendt, T.; Krumme, A.; Otten, T.; zu Ummeln, R.M. Collaborative Aircraft Engine Preliminary Design using a Virtual Engine Platform, Part B: Application. In Proceedings of the AIAA Scitech 2020 Forum, Orlando, FL, USA, 6–10 January 2020. [Google Scholar] [CrossRef]
- Larsson, L.; Grönstedt, T.; Kyprianidis, K.G. Conceptual design and mission analysis for a geared turbofan and an open rotor configuration. In Proceedings of the ASME 2011 Turbo Expo: Turbine Technical Conference and Exposition, Vancouver, BC, Canada, 6–10 June 2011; Volume 54617, pp. 359–370. [Google Scholar]
- German Aerospace Center (DLR). Simulation and Software Technology, Intelligent and Distributed Systems; Remote Component Environment; German Aerospace Center: Cologne, Germany, 2020. [Google Scholar]
- German Aerospace Center (DLR). Institute of System Architecture in Aeronautics; Common Parametric Aircraft Configuration Schema; German Aerospace Center: Cologne, Germany, 2018. [Google Scholar]
- Alder, M.; Moerland, E.; Jepsen, J. Recent advances in establishing a common language for aircraft design with CPACS. In Proceedings of the Aerospace Europe Conference, Bordeaux, Frankreich, 25–28 February 2020. [Google Scholar]
- Woehler, S.; Atanasov, G.; Silberhorn, D.; Froehler, B.; Zill, T. Preliminary Aircraft Design within a Multidisciplinary and Multi-fidelity Design Environment. In Proceedings of the Aerospace Europe Conference, Bordeaux, Frankreich, 25–28 February 2020. [Google Scholar]
- Silberhorn, D.; Arzberger, M.J.; Mennicken, M.; Wolters, F.; Hollmann, C.; Iwanizki, M. Multidisciplinary Investigation of Partially Turboelectric, Boundary Layer Ingesting Aircraft Concepts. In Proceedings of the AIAA Scitech 2020 Forum, Orlando, FL, USA, 6–10 January 2020; p. 0504. [Google Scholar] [CrossRef]
- Boeing Commercial Airplanes. 767 Airplane Characteristics for Airport Planning; D6-58328; Boeing Commercial Airplanes: Seattle, WA, USA, 2021. [Google Scholar]
- Burschyk, T.; Cabac, Y.; Silberhorn, D.; Boden, B.; Nagel, B. Liquid hydrogen storage design trades for a short-range aircraft concept. In Proceedings of the Deutscher Luft- und Raumfahrtkongress 2021, Online, 31 August–2 September 2021. [Google Scholar]
- Brewer, G.D. Hydrogen Aircraft Technology; Routledge: London, UK, 2017. [Google Scholar] [CrossRef]
- Hoelzen, J.; Silberhorn, D.; Zill, T.; Bensmann, B.; Hanke-Rauschenbach, R. Hydrogen-powered aviation and its reliance on green hydrogen infrastructure–Review and research gaps. Int. J. Hydrogen Energy 2021, 47, 3108–3130. [Google Scholar] [CrossRef]
- Silberhorn, D.; Hartmann, J.; Dzikus, N.; Atanasov, G.; Zill, T.; Gomez Trillos, J.C.; Oswald, M.; Brand, U.; Vogt, T.; Grimme, W. The Air-Vehicle as a Complex System of Air Transport Energy Systems. In Proceedings of the AIAA Aviation 2020 Forum, Virtual Event, 15–19 June 2020. [Google Scholar]
- Thorbeck, J.; Scholz, D. DOC-Assessment Method. In Proceedings of the 3rd Symposium on Collaboration in Aircraft Design, Toulouse, France, 19 September 2013. [Google Scholar]
- Thorbeck, J. From Aircraft Performance to Aircraft Assessment. DGLR Short Course: Aircraft Desing. In Proceedings of the Deutsche Gesellschaft für Luft- und Raumfahrt—Lilienthal-Oberth e.V., München, Germany, 5–7 September 2007; pp. 1–56. [Google Scholar]
- Beltramo, M.N.; Trapp, D.L.; Kimoto, B.W.; Marsh, D.P. Parametric Study of Transport Aircraft Systems Cost and Weight; Science Applications: Los Angeles, CA, USA, 1977. [Google Scholar]
- Mottschall, M.; Kasten, P.; Kühnel, S.; Minnich, L. Sensitivitäten zur Bewertung der Kosten Verschiedener Energieversorgungsoptionen des Verkehrs bis zum Jahr 2050—Abschlussbericht. Umweltbundesamt: Dessau-Rosslau, Germany, 2019. [Google Scholar]
- Grewe, V.; Dahlmann, K.; Flink, J.; Frömming, C.; Ghosh, R.; Gierens, K.; Heller, R.; Hendricks, J.; Jöckel, P.; Kaufmann, S.; et al. Mitigating the Climate Impact from Aviation: Achievements and Results of the DLR WeCare Project. Aerospace 2017, 4, 34. [Google Scholar] [CrossRef]
- Linke, F.; Dahlmann, K.; Gerlinger, B.; Wöhler, S.; Otten, T.; Plohr, M.; Presto, F.; Hartmann, J.; Weiss, M. The impact of a new mid-range aircraft with advanced technologies on air traffic emissions and climate. In Proceedings of the 2020 AIAA AVIATION, Virtual Event, 15–19 June 2020. [Google Scholar]
- Linke, F. Environmental Analysis of Operational Air Transportation Concepts (German: Ökologische Analyse Operationeller Lufttransportkonzepte). Ph.D. thesis, Hamburg University of Technology, Hamburg, Germany, 2016. [Google Scholar]
- Linke, F.; Grewe, V.; Gollnick, V. The Implications of Intermediate Stop Operations on Aviation Emissions and Climate. Meteorol. Z. 2017, 26, 697–709. [Google Scholar] [CrossRef]
- Grewe, V.; Stenke, A. AirClim: An efficient tool for climate evaluation of aircraft technology. Atmos. Chem. Phys. 2008, 8, 4621–4639. [Google Scholar] [CrossRef]
- Dahlmann, K.; Koch, A.; Linke, F.; Lührs, B.; Grewe, V.; Otten, T.; Seider, D.; Gollnick, V.; Schumann, U. Climate-Compatible Air Transport System—Climate Impact Mitigation Potential for Actual and Future Aircraft. Aerospace 2016, 3, 38. [Google Scholar] [CrossRef]
- Stenke, A.; Grewe, V.; Ponater, M. Lagranian transport of water vapor and cloud water in the ECHAM4 GCM and its impact on the cold bias. Clim. Dyn. 2008, 31, 491–506. [Google Scholar] [CrossRef]
- Burkhardt, U.; Kärcher, B. Process-based simulation of contrail cirrus in a global climate model. J. Geophys. Res. 2009, 114, D16201. [Google Scholar] [CrossRef]
- Hasselmann, K.; Hasselmann, S.; Giering, R.; Ocana, V.; Storch, H.V. Sensitivity Study of Optimal CO2 Emission Paths Using a Simplified Structural Integrated Assessment Model (SIAM). Clim. Chang. 1997, 37, 345–386. [Google Scholar] [CrossRef]
- Burkhardt, U.; Bock, L.; Bier, A. Mitigating the contrail cirrus climate impact by reducing aircraft soot number emissions. NPJ Clim. Atmos. Sci. 2018, 1, 37. [Google Scholar] [CrossRef]
- Grewe, V.; Gangoli Rao, A.; Grönstedt, T.; Xisto, C.; Linke, F.; Melkert, J.; Middel, J.; Ohlenforst, B.; Blakey, S.; Christie, S.; et al. Evaluating the climate impact of aviation emission scenarios towards the Paris agreement including COVID-19 effects. Nat. Commun. 2021, 12, 3841. [Google Scholar] [CrossRef] [PubMed]
- Gierens, K. Selected topics on the interaction between cirrus clouds and embedded contrails. Atmos. Chem. Phys. 2012, 12, 11943–11949. [Google Scholar] [CrossRef]
- Meinshausen, M.; Smith, S.J.; Calvin, K.; Daniel, J.S.; Kainuma, M.L.T.; Lamarque, J.F.; Matsumoto, K.; Montzka, S.A.; Raper, S.C.B.; Riahi, K.; et al. The RCP greenhouse gas concentrations and their extensions from 1765 to 2300. Clim. Chang. 2011, 109, 213–241. [Google Scholar] [CrossRef]
- Zanger, J.; Monz, T.; Aigner, M. Experimental Investigation of the Influence of Combustor Cooling on the Characteristics of a FLOX-Based Micro Gas Turbine Combustor. In Progress in Gas Turbine Performance; Benini, E., Ed.; InTech: Lodon, UK, 2013; ISBN 978-953-51-1166-5. pp. 165–184. [Google Scholar]
- European Union Aviation Safety Agency. Certification Specifications and Acceptable Means of Compliance for Large Aeroplanes CS-25, Amendment 26; European Union Aviation Safety Agency: Cologne, Germany, 2020.


| Unit | Jet A-1 | Drop-In | PtL | LH2 | |
|---|---|---|---|---|---|
| LHV | MJ/kg | 43.138 | 43.639 | 44.184 | 119.96 |
| Density | kg/m3 | 814.7 | 777.2 | 752.7 | 70.2 |
| EI CO2 | kgCO2/kgFuel | 3.164 | 3.132 | 3.101 | 0.0 |
| EI H2O | kgH2O/kgFuel | 1.220 | 1.297 | 1.374 | 8.937 |
| Unit | Jet A-1 | Drop-In | PtL | LH2 | |
|---|---|---|---|---|---|
| Conventional Combustion | % | 100 | 69 | 38 | 0 |
| Low NO/Soot Combustion | % | <10 | <10 | <10 | 0 |
| Unit | Value | |
|---|---|---|
| Design Range | NM | 3900 |
| Design PAX (two class) | - | 261 |
| Design Payload | kg | 26,100 |
| Cruise Mach number | - | 0.8 |
| TOFL (ISA SL) | m | 2400 |
| Approach Speed (MLM) | kt | 140 |
| Wing Span Limit | m | 52 |
| Unit | D261+SAF | D261+H2 | |
|---|---|---|---|
| BPR | - | 16.2 | 17.3 |
| OPR | - | 51.0 | 50.9 |
| TET max | K | 1850 | 1731 |
| TET mid. cruise | K | 1613 | 1613 |
| Thrust mid. cruise | kN | 29.3 | 31.7 |
| Thrust SL static | kN | 189.5 | 168.6 |
| TSEC | W/N | 579 | 540 |
| Unit | D261 | D261+ | D261+DropIn | D261+SAF | D261+H2 | |
|---|---|---|---|---|---|---|
| MTOM | kg | 158,550 | 131,455 | 130,905 | 130,170 | 128,670 |
| OEM | kg | 85,850 | 77,190 | 77,060 | 76,850 | 92,245 |
| MLM | kg | 135,010 | 113,500 | 113,260 | 112,910 | 123,915 |
| Ref. Wing Area | m | 283.3 | 217.9 | 217.4 | 214.3 | 241.6 |
| Wing Span | m | 47.6 | 52 | 52 | 52 | 52 |
| Thrust loading TO | - | 0.291 | 0.292 | 0.291 | 0.289 | 0.261 |
| Thrust loading TOC | - | 0.230 | 0.263 | 0.263 | 0.263 | 0.270 |
| Wing Loading (MTOM) | kg/m | 559.7 | 603.3 | 602.2 | 607.4 | 532.5 |
| Overall Efficiency (FL350) | % | 32.4 | 40.4 | 40.4 | 40.4 | 43.6 |
| LoD mid. Cruise | - | 18.3 | 20.7 | 20.7 | 20.7 | 19.6 |
| CL max. Landing | - | 2.23 | 2.43 | 2.43 | 2.43 | 2.39 |
| Block-Energy (3900 NM) | GJ | 1720 | 1054 | 1050 | 1044 | 1074 |
Publisher’s Note: MDPI stays neutral with regard to jurisdictional claims in published maps and institutional affiliations. |
© 2022 by the authors. Licensee MDPI, Basel, Switzerland. This article is an open access article distributed under the terms and conditions of the Creative Commons Attribution (CC BY) license (https://creativecommons.org/licenses/by/4.0/).
Share and Cite
Silberhorn, D.; Dahlmann, K.; Görtz, A.; Linke, F.; Zanger, J.; Rauch, B.; Methling, T.; Janzer, C.; Hartmann, J. Climate Impact Reduction Potentials of Synthetic Kerosene and Green Hydrogen Powered Mid-Range Aircraft Concepts. Appl. Sci. 2022, 12, 5950. https://doi.org/10.3390/app12125950
Silberhorn D, Dahlmann K, Görtz A, Linke F, Zanger J, Rauch B, Methling T, Janzer C, Hartmann J. Climate Impact Reduction Potentials of Synthetic Kerosene and Green Hydrogen Powered Mid-Range Aircraft Concepts. Applied Sciences. 2022; 12(12):5950. https://doi.org/10.3390/app12125950
Chicago/Turabian StyleSilberhorn, Daniel, Katrin Dahlmann, Alexander Görtz, Florian Linke, Jan Zanger, Bastian Rauch, Torsten Methling, Corina Janzer, and Johannes Hartmann. 2022. "Climate Impact Reduction Potentials of Synthetic Kerosene and Green Hydrogen Powered Mid-Range Aircraft Concepts" Applied Sciences 12, no. 12: 5950. https://doi.org/10.3390/app12125950
APA StyleSilberhorn, D., Dahlmann, K., Görtz, A., Linke, F., Zanger, J., Rauch, B., Methling, T., Janzer, C., & Hartmann, J. (2022). Climate Impact Reduction Potentials of Synthetic Kerosene and Green Hydrogen Powered Mid-Range Aircraft Concepts. Applied Sciences, 12(12), 5950. https://doi.org/10.3390/app12125950