1. Introduction
Combine harvesters are machines that “combine” the processes of harvesting, threshing, and washing grain. When the combine harvester is working, due to the uneven planting density of grains in the field, the feeding rate will suddenly change, which will cause multi-source vibration [
1]. The vibration will destroy the balance of the excitation response of the mechanical structure, resulting in some abnormal working conditions. Therefore, it is necessary to improve the stability of the mechanical structure and optimize the structure of the plate body and the shell.
Based on different vibration excitation, the vibration responses of the plate–shell structure are also different. The parameter properties of the structure will change its vibration response, and sometimes it is necessary to adjust the structure parameters to optimize the vibration response of the structure. There has been much research on vibration response. Liu et al. [
2] studied the free vibration and transfer response of torsional vibration of a torus plate, and Ying et al. [
3] used the magnetorheological viscoelastic body as the intelligent core to control the random micro-vibration of the sandwich plate. The micro-vibration responses of sandwich panels with MRVE cores and bearing masses under random bearing motion excitation were investigated and compared to evaluate their ability to dampen vibrations. Kong et al. [
4] combined the experiment and simulation to study the vibration of the volute structure. Some researchers put forward some new theories about vibration response. Through the combination of numerical calculation and prototype test, Cao et al. [
5] compared and analyzed the vibration conditions of nine different positions in the volute and optimized according to the results. Taleb et al. [
6] developed a new hyperbolic shear deformation theory for free vibrational response analysis, and Cao et al. [
7] studied the vibration response of a sandwich panel, and the governing equations were derived based on Mindling’s theory and Hamilton’s principle. In addition, some scholars have used the finite element analysis method [
8], the triangular zigzag theoretical analysis [
9], the Newmark method combined with the finite element method [
10], modified power law response [
11], and the modal superposition method [
12] to analyze various vibration responses.
The vibration problem of combine harvesters has always been a problem that people are concerned about. Researchers have performed a lot of research on the vibration response of each component on the combine harvester, Chen et al. [
13] studied the vibration response of the combine harvester frame in the multi-source excitation vibration environment by establishing a dynamic model. Jiang et al. [
14] studied the main influencing factors of road excitation on human body comfort under the harvester working condition. Yilmaz et al. [
15] used sensors to analyze noise and vibration during the operation of conventional combine harvester threshing units. However, few people had paid attention to the plate and shell structure. The plate and shell structure cover the whole body of the combine harvester, which not only provides a sealing function but also provides a lot of load-bearing functions. Therefore, it is also necessary to study the vibration of the plate and shell structure of the combine harvester.
There are few studies on the plate and shell structure of the combine harvester, so in addition to the research on the vibration characteristics of the plate and shell structure, it is necessary to carry out corresponding structural optimization to adapt to its multi-source excitation vibration environment. Many scholars have conducted in-depth research on the specific structural design research and optimization of plate–shell structures on different machines. Xu et al. [
16] improved the hydraulic performance of the centrifugal pump, the topology optimization method was used for the topology optimization design of the centrifugal pump volute, and the optimization mathematical model was established. The optimization objective function was to minimize the total pressure loss of the fluid. Zhang et al. [
17] introduced a topology optimization method based on the geometric projection method for the stiffness-based structural design of fixed-thickness curved plate structures. Kropiowska et al. [
18] performed approximate thickness optimization for rectangular Kirchhoff-Love plates with variable stiffness under uniform loading. Sun et al. [
19] investigated the structural optimization method of topology optimization for removing internal resonance plates of rotated rectangular thin plates. Moita et al. [
20] used higher-order shear deformation theory to develop discrete models for structural and sensitivity analysis for material distribution and size optimization of functionally graded material (FGM) structures. Halaku et al. [
21] used the isogeometric level set method for topology optimization of plate structures. Deepika et al. [
22] built an optimization framework by integrating finite element methods, analytical sensitivity techniques, and optimization algorithms, and the design objectives were the minimization of weight.
However, there had always been a blank in the structural optimization design of the combine harvester plate and shell structure. Therefore, it is necessary to explore a structural design optimization scheme suitable for the plate and shell structure of the combine harvester. As a more convenient and fast optimization method than the finite element model, surrogate model optimization has been widely used in the field of plate and shell structure design optimization. Dezyani et al. [
23] proposed a two-stage design optimization method for compression-reinforced panel dimensions. The first level is the concept description of the strengthened panel index based on the structural formula, and the second level is the surrogate model optimization based on the finite element method. Compared with the traditional method, this method is more efficient and effective through experiments. Taking into account material properties and geometric uncertainties, Farokhi et al. [
24] used a global surrogate model of the composite structure to complete multi-objective optimization for reliability and robustness analysis. Rikards et al. [
25] and Morteza et al. [
26], respectively, used surrogate modeling techniques to reduce the number of finite element analyses, the composite reinforced shells and both types of solid hardened boards were optimized, and good optimization results were obtained. Referring to the above research, In this paper, the surrogate model optimization is applied to the optimal design of the plate–shell structure of the combine harvester.
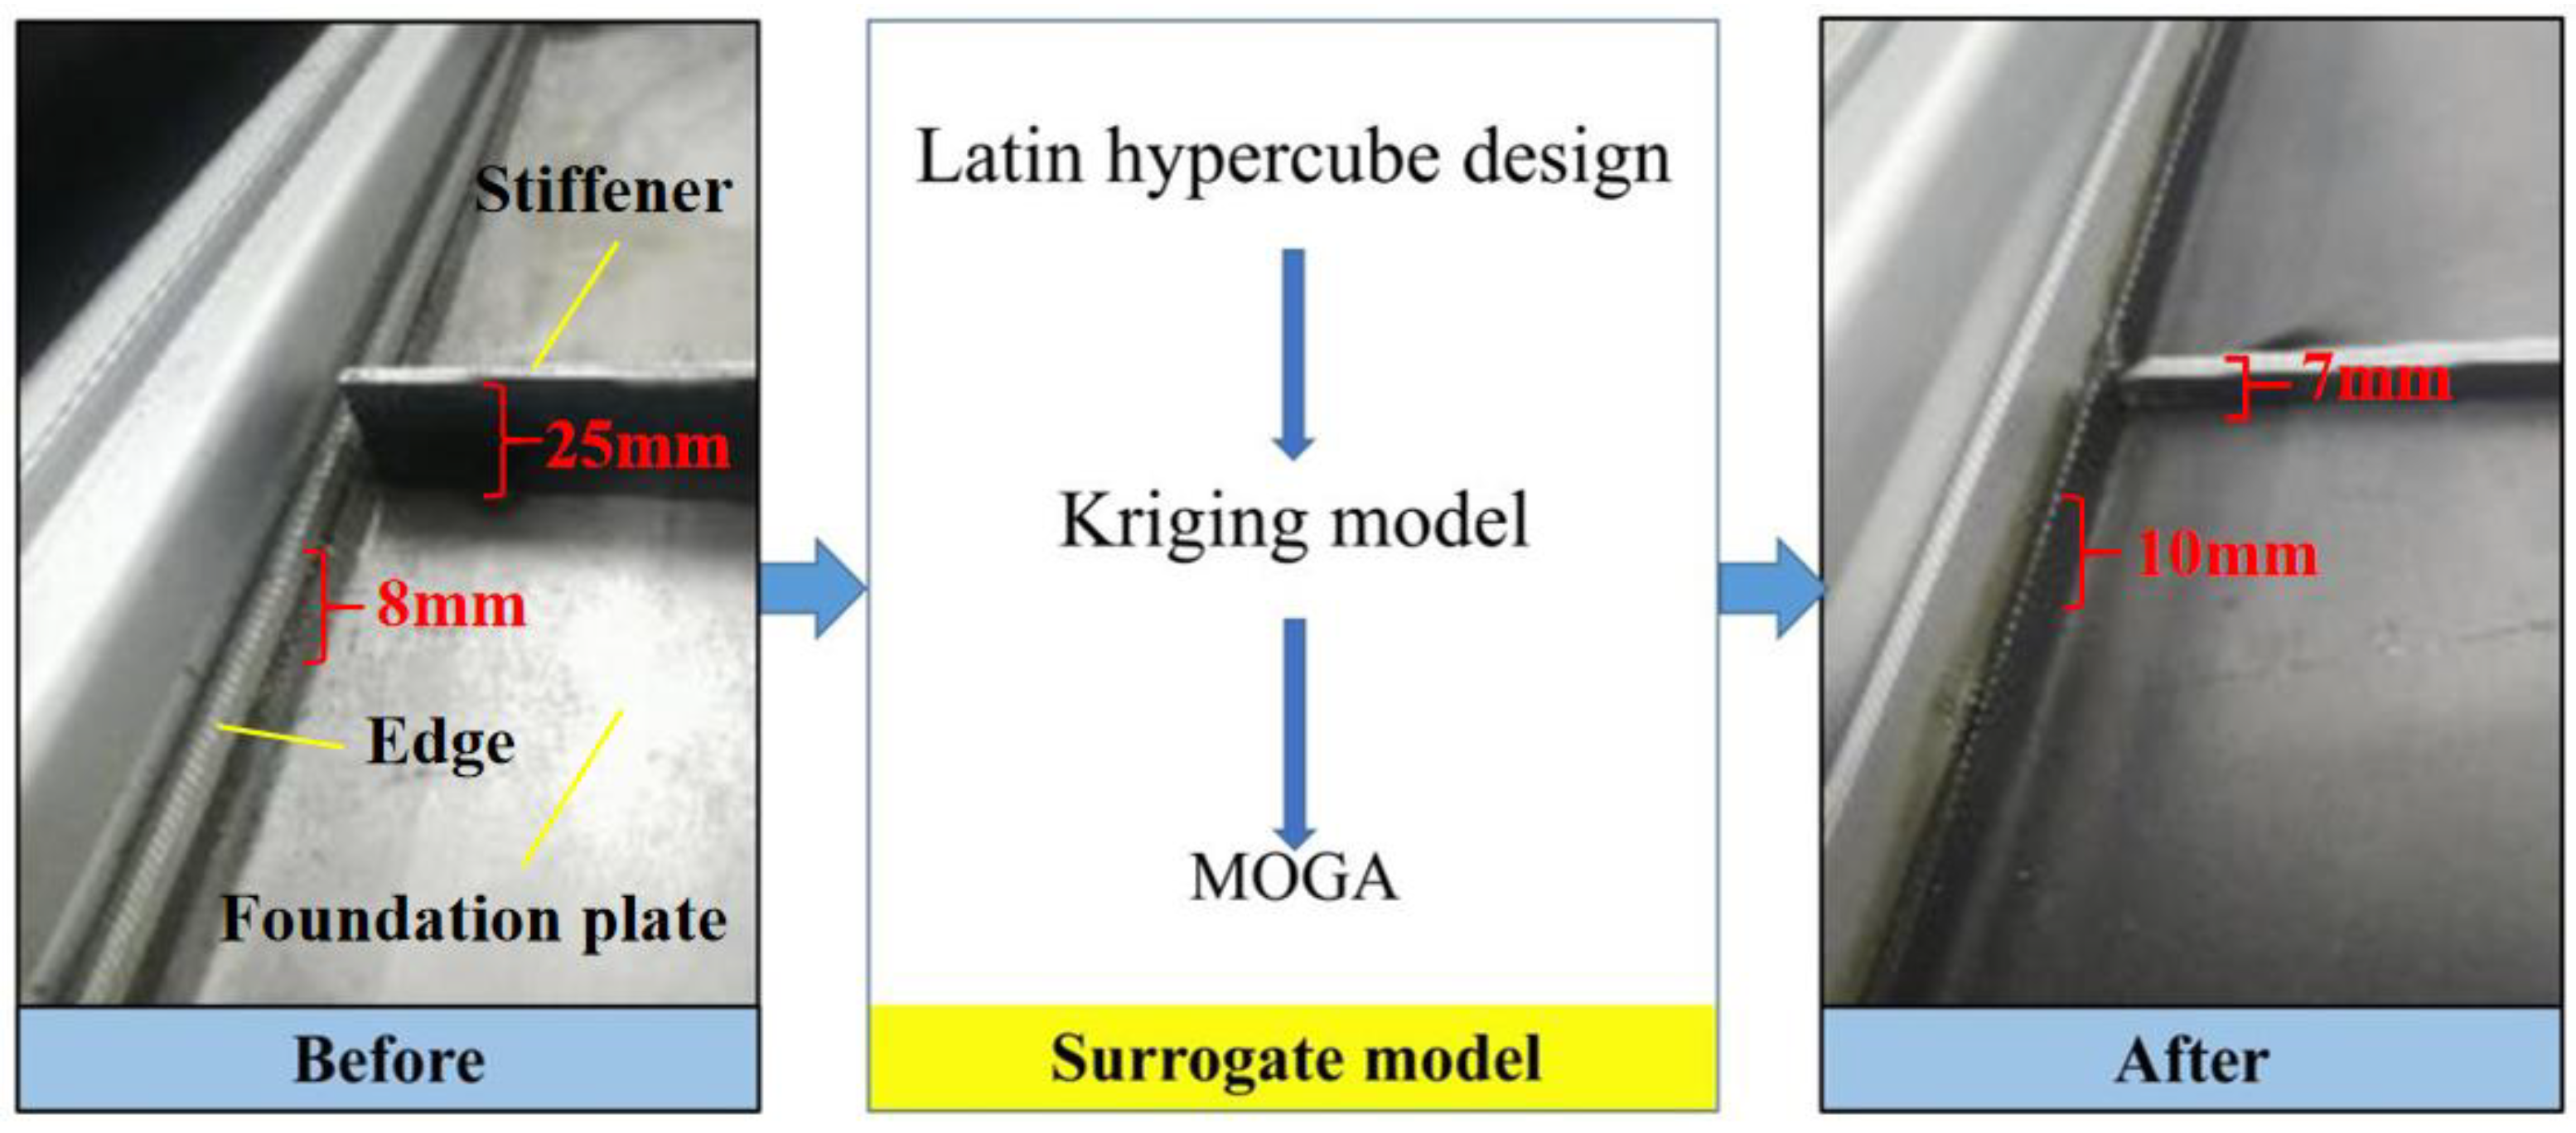
Aiming at the vibration problem of the plate–shell structure of the combine harvester, this paper proposes structural optimization with a surrogate model instead of the finite element model. The structural design is carried out through the Latin hypercube design, the response surface model is generated based on the Kriging model, and the parameter optimization is carried out with the multi-objective genetic algorithm as the optimization algorithm. In this paper, the structural parameters that have a great influence on the forced vibration of the plate–shell structure under the multi-point excitation environment are determined, and the parameters of the plate–shell structure are optimized. For the results of optimization, this paper also produces the corresponding plate for verification.
2. Materials and Methods
2.1. Experiment Object
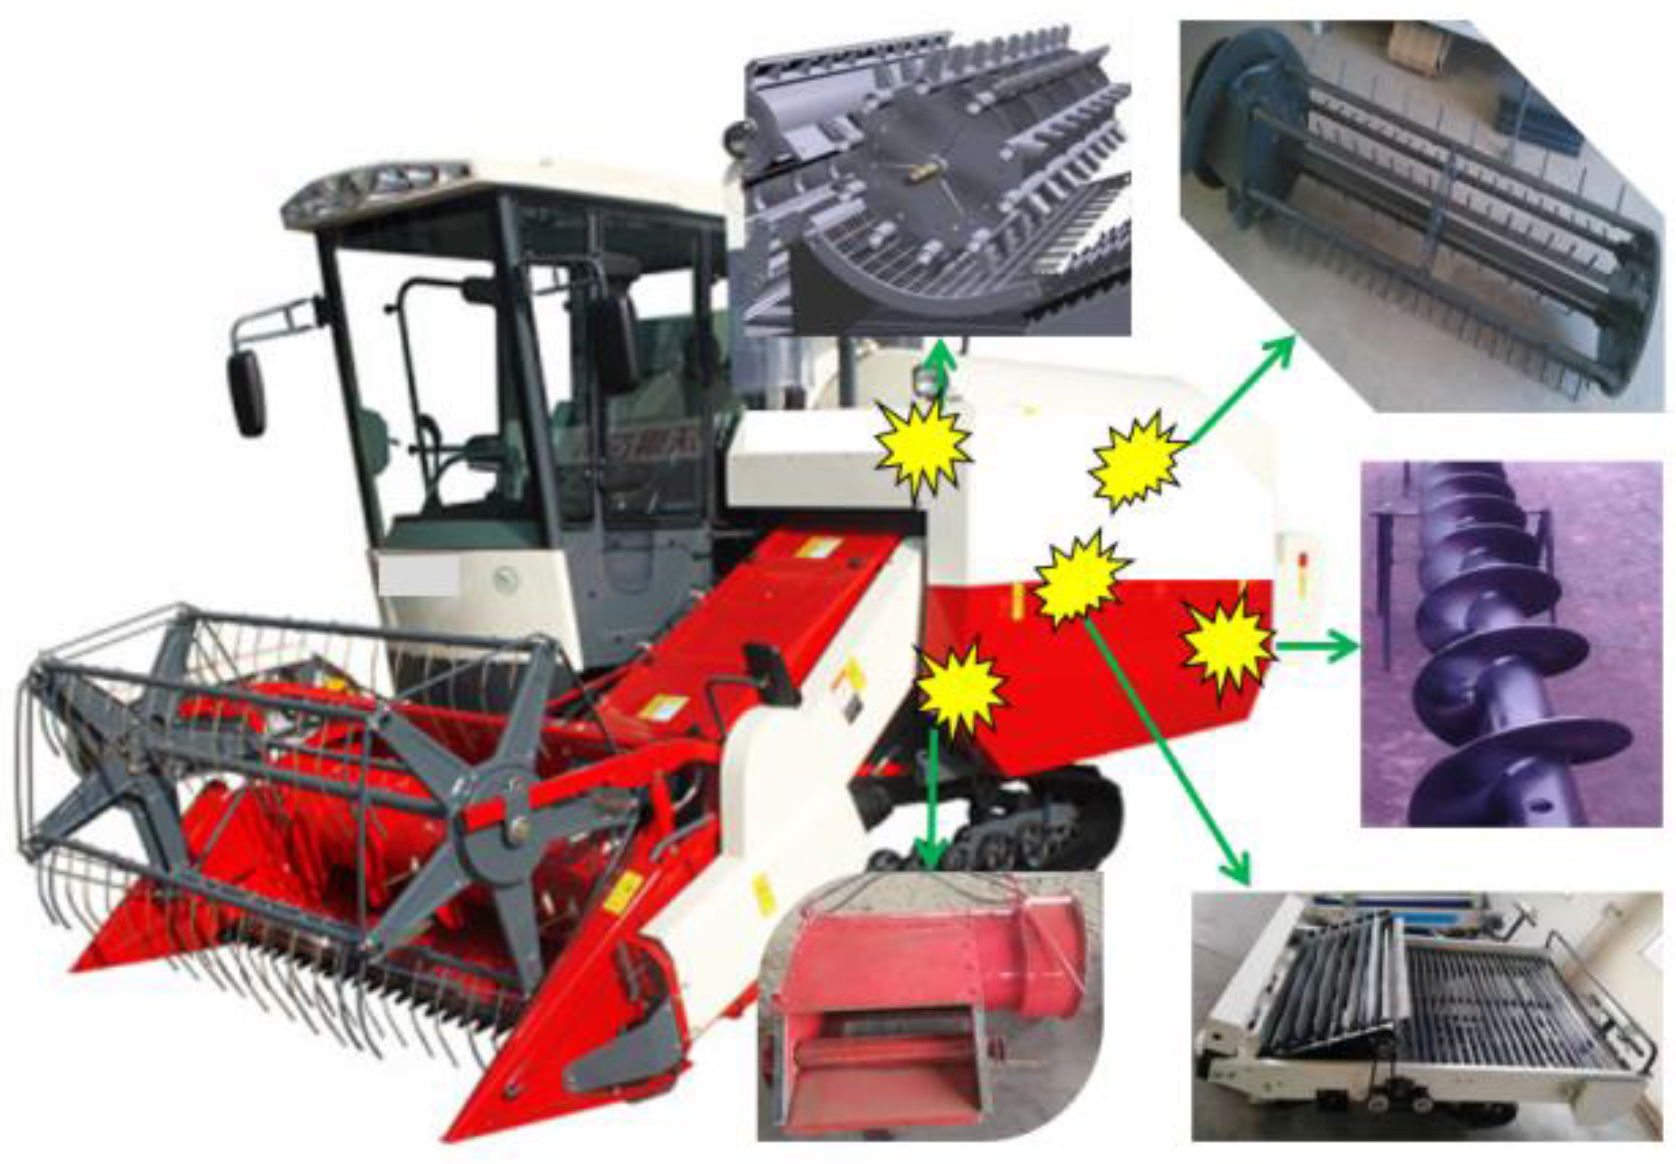
There are many vibration sources in the working process of the combine harvester, such as ground excitation, engine, various rotating parts, etc. Among them, the rotating parts include headers, threshing drums, fans, and grain feeding augers. So many excitation sources constitute the multi-source excitation vibration environment of the combine harvester. The multi-point excitations are superimposed and coupled with each other and then applied to the parts of the body, which makes the forced response of each part more complicated.
Figure 1 is the structure diagram of the multi-point excitation of the combine harvester. The plate and shell structure occupies more than 55% of the whole machine. As the load-bearing and closed parts of the body, the forced vibration of the plate–shell structure depends on the location and surrounding environment. This paper mainly studies the vibration of the plate and shell of the combine harvester.
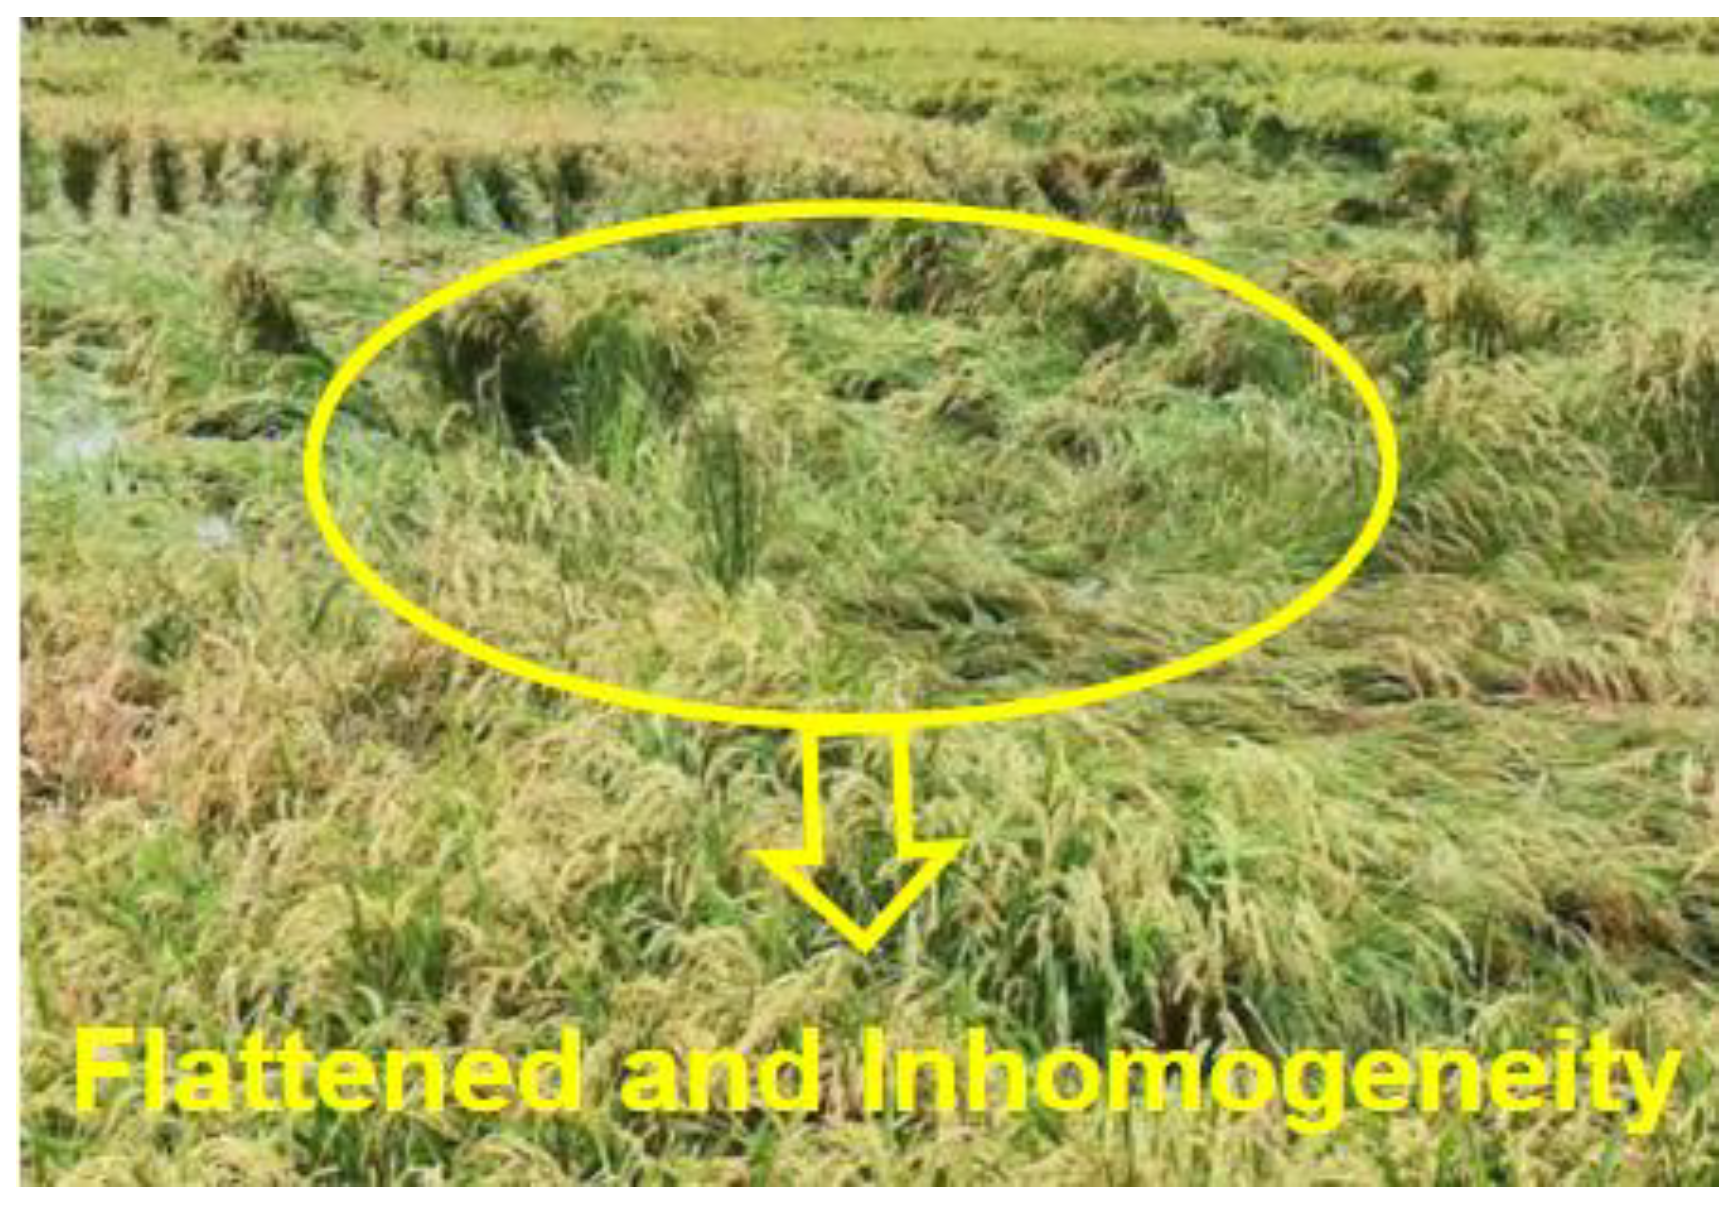
In the no-load state, the response state of each component on the combine harvester is relatively stable under the multi-source excitation vibration environment. However, due to uneven planting and lodging of crops in the growing process (as shown in
Figure 2), the feed rate has a sudden change. This unstable working condition will cause the unbalanced forced vibration of each component. Therefore, it is very necessary to study the vibration response state of the combine harvester plate and shell structure under the multi-source excitation environment.
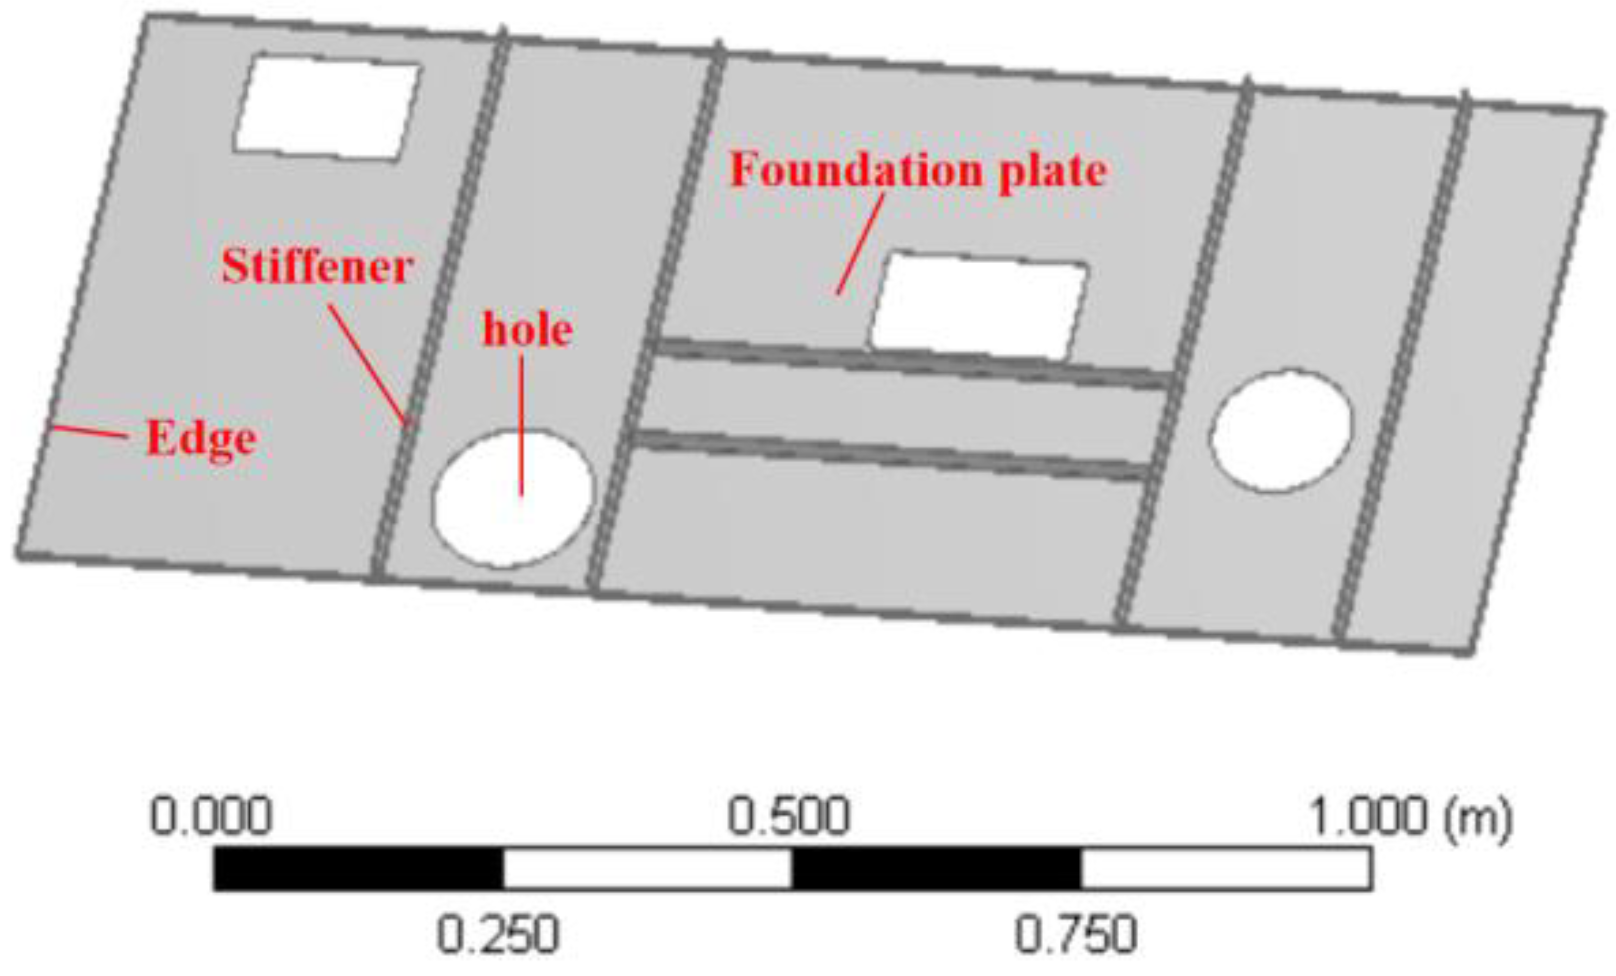
Since the research object of this paper is the plate and shell structure of the combine harvester, plate and shell part of the thresher part of a certain type of combine harvester is selected as the target for research. The size of foundation plate is 1310 mm × 560 mm long and 1.2 mm thick; the size of edge is 8 mm wide and 1.2 mm thick; the size of stiffener is 25 mm wide and 3 mm thick; the diameters of the two holes are 143 mm and 125 mm respectively. The structural material is structural steel, the density is 7850 kg/m
3, and Young’s modulus is 2.1 ×
MPa, and the Poisson’s ratio is 0.3. The structure shape is shown in
Figure 3 and
Figure 4.
2.2. Experimenting Equipment
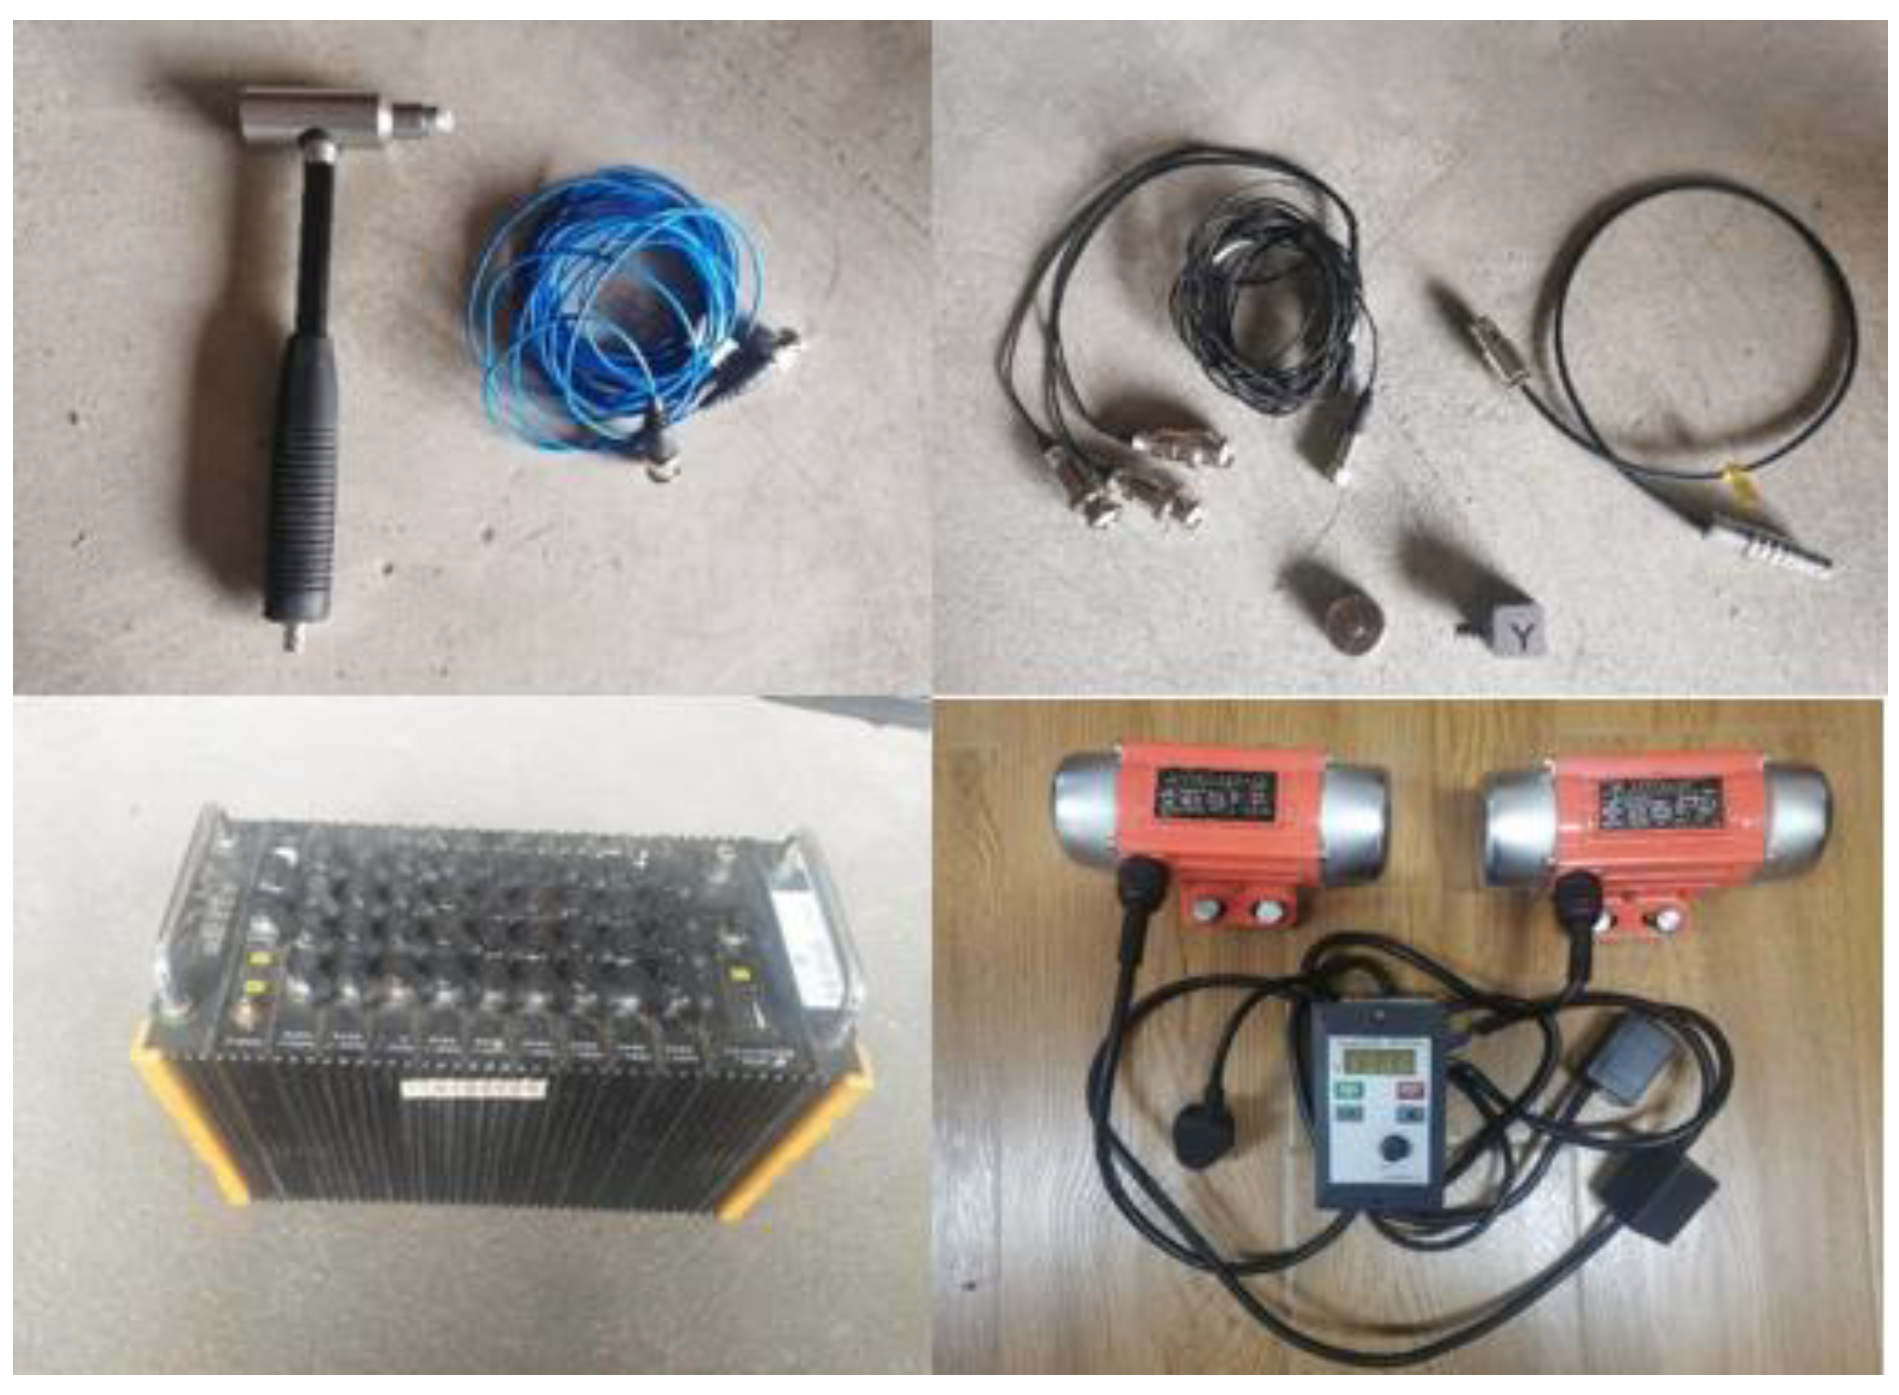
In order to test the dynamic characteristics of the experimental object, Donghua dynamic test system is used in this paper. The experimental instruments mainly include DH5902 vibration signal acquisition instrument, piezoelectric acceleration sensor, force sensor, and exciting force hammer. Details are shown in
Table 1.
The pictures of main test instruments are shown in
Figure 5.
2.3. Test Bench
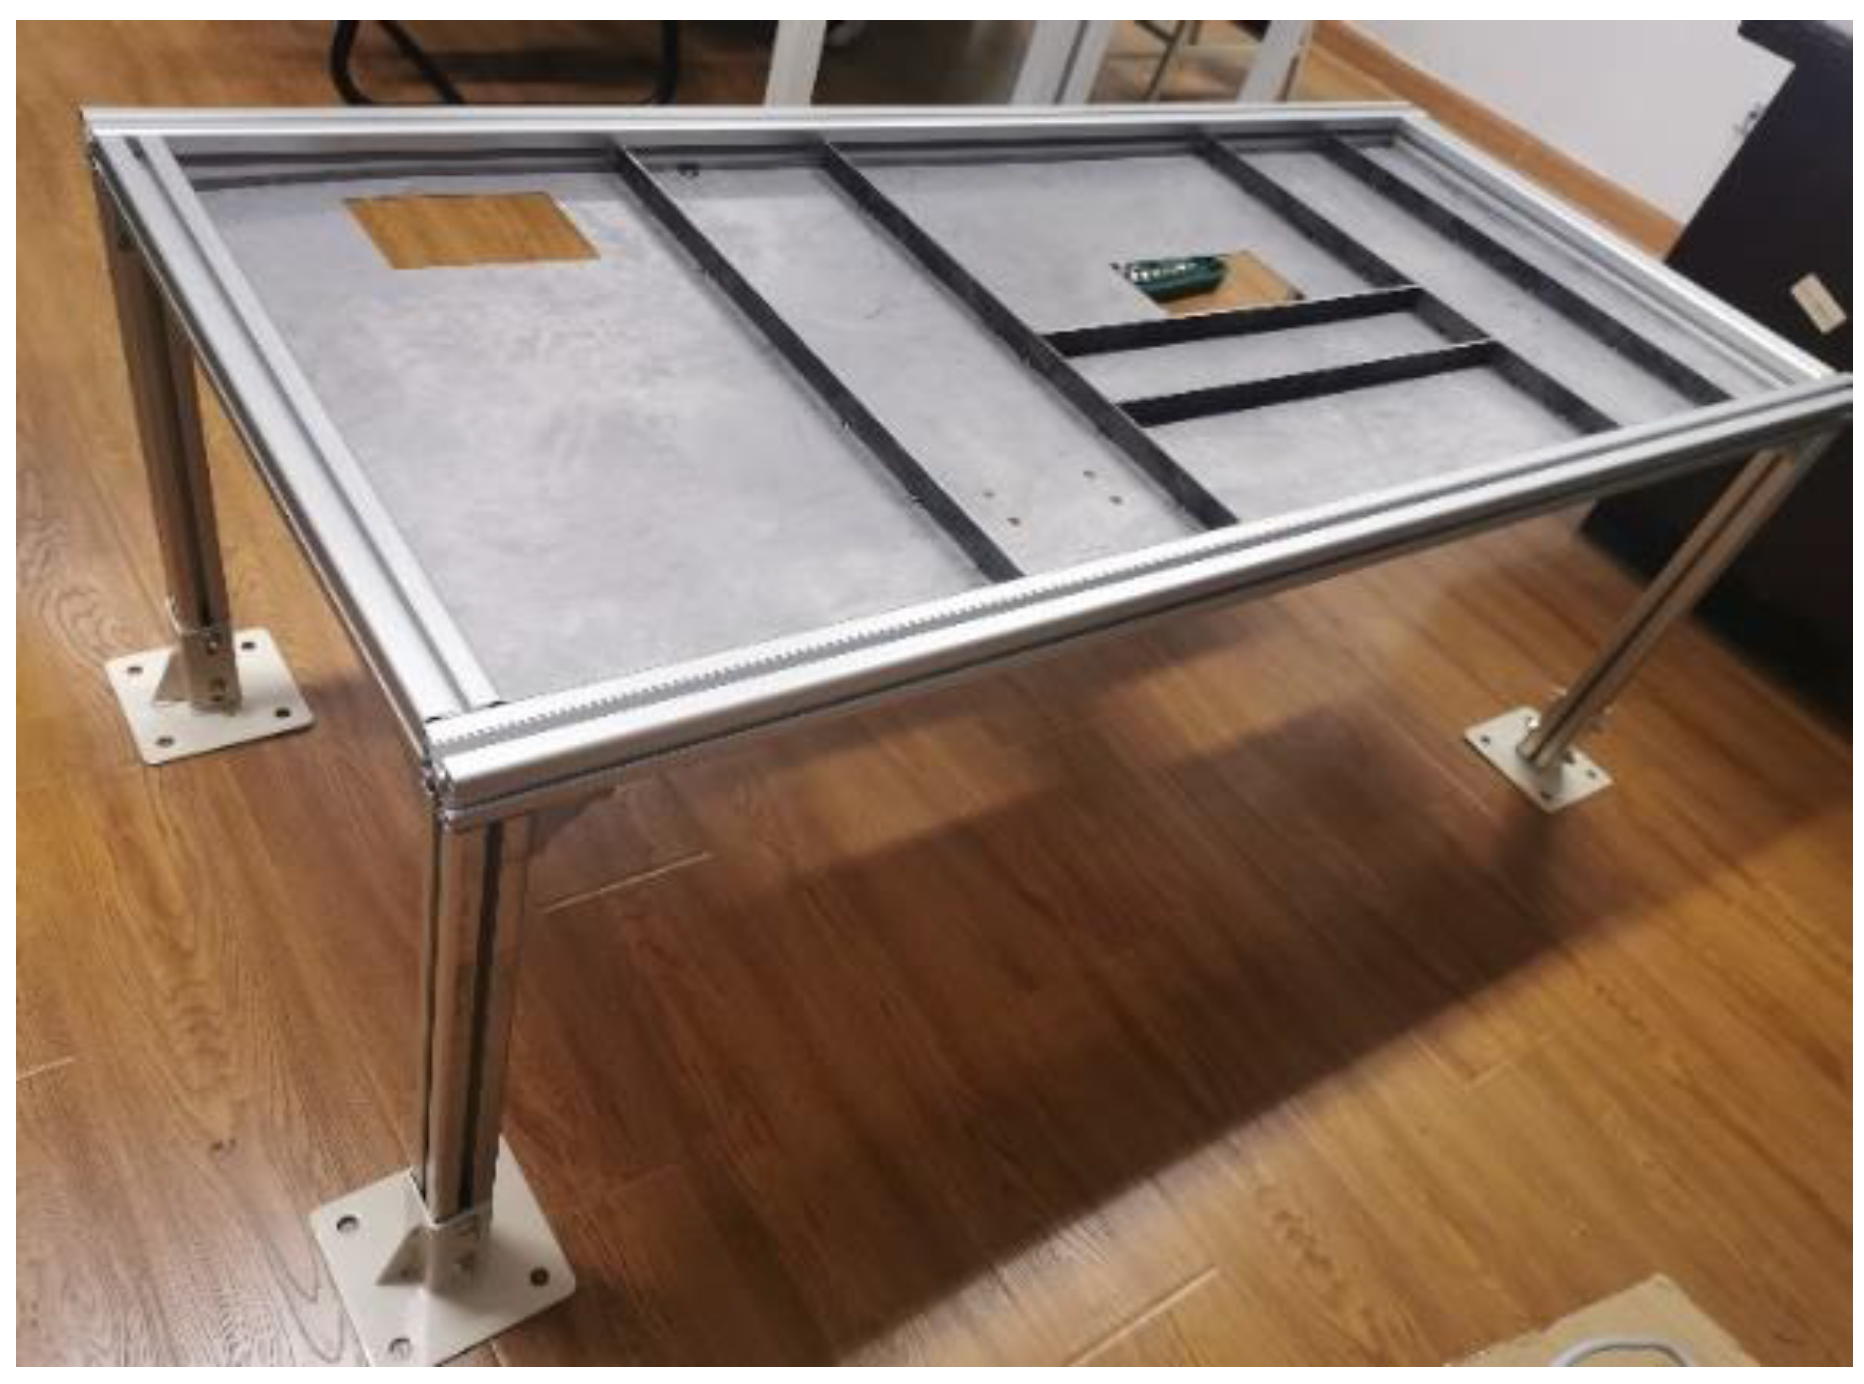
In order to carry out the dynamic test of plates, the relevant bench is made to simulate the real working conditions. The test bench is shown in
Figure 6. The processed plates and shells are connected to the frame by gluing to simulate the boundary conditions of fixed support on four sides. Donghua vibration test instrument is selected as the test instrument, and the concentrated simple harmonic force is applied through the exciter (
Figure 5). The vibration exciter used can be controlled by the speed controller to adjust the excitation force.
2.4. Optimization Method Based on the Surrogate Model
The surrogate model [
27] refers to an analytical model with a small amount of calculation, but its calculation results are similar to those of a high-precision model. It is a kind of model that uses the response information of known points to predict the response value of unknown points [
28]. This type of model can be mathematically implemented by fitting and interpolation, using known points to construct a fitting function to predict the unknown point response, or using the information of the known points to interpolate the response at the unknown point. In the process of design optimization, the surrogate model can be used to replace the original calculation model to overcome the problem of excessive calculation, and at the same time, it can also effectively solve the problem of non-smooth mapping between the objective function and the design variables.
The surrogate model mainly includes two aspects; one is how to select the sample points for constructing the model, which is related to the sampling strategy of the surrogate model and belongs to the scope of experimental design; the other is the modeling of data fitting and prediction model, which is the main body of the surrogate model, which mathematically falls within the scope of approximation methods.
Three steps are generally required to construct a surrogate model: first, use a certain experimental design method to generate sample points of design variables; then, use a high-precision analytical model (simulation software) to analyze these sample points to obtain a set of input/output data; finally use Some fitting method to fit these input/output sample data to construct a surrogate model. The specific steps are shown in
Figure 7.
On the basis of the constructed surrogate model, it is further necessary to select an appropriate optimization algorithm. The results of the optimization and the optimization efficiency depend on the optimization algorithm. After years of development of the optimization, many corresponding algorithms have appeared. However, for different design problems, it is necessary to select the appropriate algorithm according to the specific situation.
2.5. Scheme Test Design
The method of producing test points in the design space is called test design, and the test design method studies the rationality of the number and distribution of test points. Design of Experiments can provide a reasonable and effective method to obtain information and data. The number of test points produced by different test design methods and the distribution of test points in the design space are different. The common test design methods are: full factor design, orthogonal array, center combination design, and Latin hypercube design (LHD) [
29]. The Latin hypercube design is selected as the test design method.
The principle is that in the dimension space, each dimensional coordinate interval, is divided into m intervals, and each interval is recorded as . The m points are randomly selected and ensuring that each level of factor is considered once, constituting n dimensional Latin hypercube design with m sample, recorded as m × n LHD.
The advantages of the Latin Hypercube design are:
- (1)
Effective space-filling ability. Latin Hypercube Design Number of Trials = Number of Levels Factors + 1. For example, a two-factor 9-level study requires 81 (=9 × 9) points for the full factor, while the Latin hypercube design only needs to study 9 points.
- (2)
Fit the nonlinear response. Compared with the orthogonal experiment, the Latin hypercube design can study more combinations with the same number of points. For example, using 9 sample points for a two-factor experiment, an orthogonal experiment can only study 3 levels of each factor, so it can only fit a relationship of no more than second order; Latin hypercube design can study 9 levels of each factor, thus capable of fitting second-order or more nonlinear relationships.
Compared with the orthogonal test, the Latin hypercube design has a looser classification of horizontal values, and the number of tests can be controlled artificially.
2.6. Approximate Model
As an alternative to the finite element model, the agent model can greatly reduce the time of computational iteration in the optimization design process. The sample points generated by trial design can obtain the corresponding response value after test. In order to accurately establish the agent model between the design variable and the corresponding response value and accurately describe the approximate relationship between the design variable and the response value, the appropriate agent model approximate method needs to be selected. Approximate model method is to approximate a set of input variables (independent variables) and output variables (response variables) through the mathematical model method. In the field of structural optimization, the commonly used approximation methods can be divided into two categories, namely regression and interpolation methods. Regression type approximation method includes polynomial response surface method, and interpolation method includes Kriging interpolation method, radial basis function interpolation method, and artificial neural network method.
This paper mainly introduces the polynomial response surface method [
30] and the Kriging interpolation method [
31,
32]:
Polynomial response surface is the most common proxy model approximation method. The basic idea is to obtain the relationship between design parameters and responses by conducting polynomial regression analysis of the design variables constructed by the trial design and the corresponding response sample points. Common polynomial response surfaces are of the first or second order form:
In the formula, is the approximate function, which represents the response surface value corresponding to the design variable; k represents the number of terms of the polynomial; , , represents the form of the selected polynomial; , , represents the coefficient corresponding to the polynomial; Error sum of squares between the response surface and the experimental are calculated, obtains an expression which β as a variable. According to the least square principle, the vector β that minimizes ) is the regression coefficient of the polynomial response surface.
Kriging, also known as spatial local interpolation, is a method based on variation function and structural analysis. It is one of the main contents of geostatistics.
Set
as the unobserved point that needs to be estimated,
, , …, is its surrounding observation point, the observed value is corresponding to
The estimate of the unmeasured point is recorded as
, which is obtained by the weighted sum of the known observations of the adjacent observation points:
is the undetermined coefficient. The key to Kriging is to calculate the weight coefficients. It must satisfy two conditions:
Unbiased estimation Set the true value of the value point
. Due to the existence of model space variability,
,
can be regarded as random variables. When unbiased estimate
The variance of the difference between the estimated value
and the true value
is the smallest,
In the formula, represents the semi-variance value of the parameter when the distance between is used as the distance h, and represents the semi-variance value of the parameter when the distance between the and is used as the distance h.
2.7. Optimization Algorithm
The multi-objective genetic algorithm (MOGA) [
33] is essentially an improvement of the parallel distributed genetic algorithm, and it has better global solving ability and computational efficiency than the traditional genetic algorithm. Genetic Algorithm [
34] (GA) was proposed by Holland in the 1960s, mainly relying on the law of “survival of the fittest” in the process of biological evolution, imitating the genetic reproduction mechanism in the process of biological evolution, and encoding the individual in the solution space of the optimization problem (Binary or other bases), and then perform genetic operations (such as: selection, crossover, mutation, etc.) on the encoded individual population, and find the combination containing the optimal solution or better solution from the new population through iteration. The process of implementing a genetic algorithm has the following aspects:
When using a genetic algorithm, the solution to the problem needs to be encoded into a genetic chain code. Each gene chain code is also called an individual and is sometimes called a chromosome. The length of chromosomes using binary coding can be determined according to the precision required by the problem.
Commonly used encoding methods include: binary encoding, Gray code encoding, real number encoding, and symbol encoding algorithms. Isight’s MOGA algorithm uses Gray coding as follows:
For the initial variable and updated variable, the pros and cons of an individual in the group compared with other individuals need to be a unified evaluation index, which is individual fitness. Individuals with higher fitness indicate that they are close to or reach the optimal solution, and the probability of one cycle to the next generation is relatively high. The index designed according to the optimization objective function to judge whether the individual is good or bad is called the fitness function.
Similar to the process of genetic inheritance and mutation of biological evolution, the basic operations of genetic algorithm to update variables can be divided into three categories: selection, crossover, and mutation.
The purpose of selection is to select excellent individuals from the current population so that they have the opportunity to produce offspring individuals as parents. The criterion for judging whether an individual is good or not is the respective fitness value, as a kind of operator, there are many ways to realize the selection operation in the genetic algorithm, and the simplest one is to use the fitness proportional method for selection. Specifically, it is to first calculate the sum of the fitness of all individuals in the group, and then calculate the proportion of the fitness of each individual and take the next as the corresponding selection probability.
The reproduction of many organisms is accomplished by the crossing of chromosomes. This concept is used in genetic algorithms, with crossover as an operator. Moreover, the crossover operator occurs with a certain crossover probability.
The realization process of the crossover operator is as follows: two individuals in the population are selected, and the two individuals are used as parents to cross the gene chain code, thereby producing two new individuals as their offspring. The simple crossover algorithm is: randomly select a truncation point, cut the gene chain code of the parents at the truncation point, and exchange the second half to form two new individuals.
Variation is an important step in the evolution of organisms. The newly created individual is differentiated from other individuals by creating mutations in certain gene locations on the chromosome. The implementation algorithm of this operator is as follows: For an individual in the group, a certain gene is randomly selected, and the gene of this bit is flipped (0 is changed to 1, 1 is changed to 0).
By repeatedly and properly using the operators and selection principles of the genetic algorithm, MOGA continuously reproduces from parent to offspring, from offspring to grandchild, and from grandchild to grandson, so that the population adaptability to the environment continues to improve. The process is as follows:
Initialize the group;
Calculate the fitness value of each individual in the group;
Select individuals who will enter the next generation according to a certain rule determined by the individual fitness value;
Carry out crossover operations according to probability;
Perform mutation operation according to probability;
If a certain stop condition is not met, go to step (2); otherwise, go to (7);
Output the chromosome with the best fitness value in the population as the satisfactory or optimal solution of the problem.
3. Results and Discussion
The thin plate on the combine harvester is mainly characterized by holes, edge stiffener, and stiffener. Therefore, this paper uses the parameters related to holes, edge stiffeners, and stiffeners as variables to study the dynamic response of the thin rectangular plate.
3.1. Parameters of Enhanced Reinforcement
There are many rotating parts on the combine harvester, and most relating parts are installed on the body frame. In the threshing machine part, such as the grain auger, the rotation axis is located in the middle of the plate. When considering the mechanical strength, reinforcing ribs are usually added to this kind of plate and shell to increase stability. From the perspective of dynamic response, the stiffener can also effectively increase the natural vibration frequency of the thin rectangular plate and also effectively suppress the vibration response of the plate to the concentrated simple harmonic force.
In this section, the concentrated harmonic force is applied at two points on the center line of the 500 mm (500 mm
800 mm, 2 mm thick), located at 300 mm and 500 mm, respectively, with the amplitude of 100 N and 0 phase, on which the dynamic response of the variable distance, variable width, and variable thickness stiffeners is studied. The research shows that when the distance between the reinforced plate and the excitation point changes, it can be seen from
Figure 8 that the farther the stiffeners are from the action point of the excitation force (100 mm/150 mm/200 mm), the greater the forced vibration response of the four-side solid support plate to the two-point excitation. This indicates that the closer the stiffener is to the excitation point, the better it suppresses the vibration.
Further, for the four-side clamped plate, only the thickness of the stiffener is controlled, and the forced vibration response of the whole plate to the multi-source excitation is studied. As shown in
Figure 9, with the gradual increase in the thickness of stiffeners (2 mm/3 mm/4 mm/5 mm), the forced vibration amplitude of the four-side fixed support plate under the two-point excitation gradually decreases. This shows that the multi-point excitation vibration response of the four-side clamped plate can be effectively controlled by increasing the thickness of the stiffener.
Finally, for the four-side clamped plate, only the width of the stiffener is controlled, and the vibration response of the entire plate to the multi-source excitation is studied. As shown in
Figure 10, with the width of the stiffeners gradually decreasing (50 mm/40 mm/30 mm/20 mm), the forced vibration amplitude of the four-side solid support plate under the two-point excitation gradually increases. As shown in
Figure 10d, when the width of the stiffener is 20 mm, the forced vibration area of the four-side solid support plate extends from the excitation point side to the unapplied incentive point side, resulting in a large increase in the amplitude of the overall plate. This shows that the multi-point excitation vibration response of the four-sided simple support plate can be effectively controlled by increasing the width of the stiffener. When the width of stiffener is less than a certain degree, the inhibitory effect of reinforcement on the vibration response of plate surface also almost disappears.
3.2. Hole Variation Parameters
Because there are many parts on the combine that need to be bolted to the frame, there are many bolt holes on the frame of combine harvester, and they are also common in the plate and shell structure. In this paper, the effect of the holes on the forced vibration of the thin plate is studied.
Apply two concentrated harmonic forces to the four-sided clamped plate with holes to control the distance between the holes and the force application point. As shown in
Figure 11, when the distance between the hole and the center of the plate increases (50 mm/100 mm/150 mm), the vibration response of the plate subjected to simple harmonic force does not change too much. This shows that the position of the hole has little effect on the forced vibration of the four-sided clamped plate.
Further, two concentrated harmonic forces are applied on the four-side clamped thin plate, and holes are punched in the same position of the thin plate at the same time, and only the size of the hole diameter is controlled. As shown in
Figure 12, with the gradual increase in the hole diameter (20 mm/40 mm/60 mm), the amplitude of the vibration response of the thin plate to the two concentrated harmonic forces tends to increase. Therefore, the larger the hole on the plate surface, the greater the forced vibration response.
3.3. Change of Parameter of Edge-Stiffened Plate
The thin plate of the thresher part on the combine harvester mostly has a folding edge. Its main function is to meet the needs of welding and assembly. The thin plate usually needs to be connected to the combine harvester frame. Therefore, this paper further studies the vibration response of the thin plate with edge stiffener under the multi-source excitation environment.
By controlling the width of the edge-stiffened plate, the forced response of the four-side clamped plate under multi-point excitation is studied. As shown in
Figure 13, there is a gradual decrease in the width of the edge-stiffened plate (50 mm/40 mm/30 mm/20 mm). This shows that by reducing the width of the edge stiffened plate, the response of the four-sided clamped plate to the multi-point excitation forced vibration can be suppressed.
By controlling the thickness of the edge-stiffened plate, the forced response of the four-side clamped plate under multi-point excitation is studied. As shown in
Figure 14, with the gradual increase in the thickness of the edge stiffener (2 mm/3 mm/4 mm/5 mm), the vibration response amplitude of the four-side solid support plate for multi-point excitation is almost unchanged. This shows that the thickness of the edge stiffener has little effect on the forced response of the four-side clamped plate.
From the above research, it can be seen that in the multi-source excitation environment, the factors that have a greater impact on the forced vibration response of the four-side clamped plate mainly include the width, thickness, and position of the stiffened plate; the size of the hole and the width of the edge stiffener. Based on the above conclusions and the actual situation, this paper determines the main parameters for structural optimization of the plate and shell, namely the thickness of the foundation plate, the width of the stiffener, and the width of the edge stiffening.
3.4. Results of Optimization
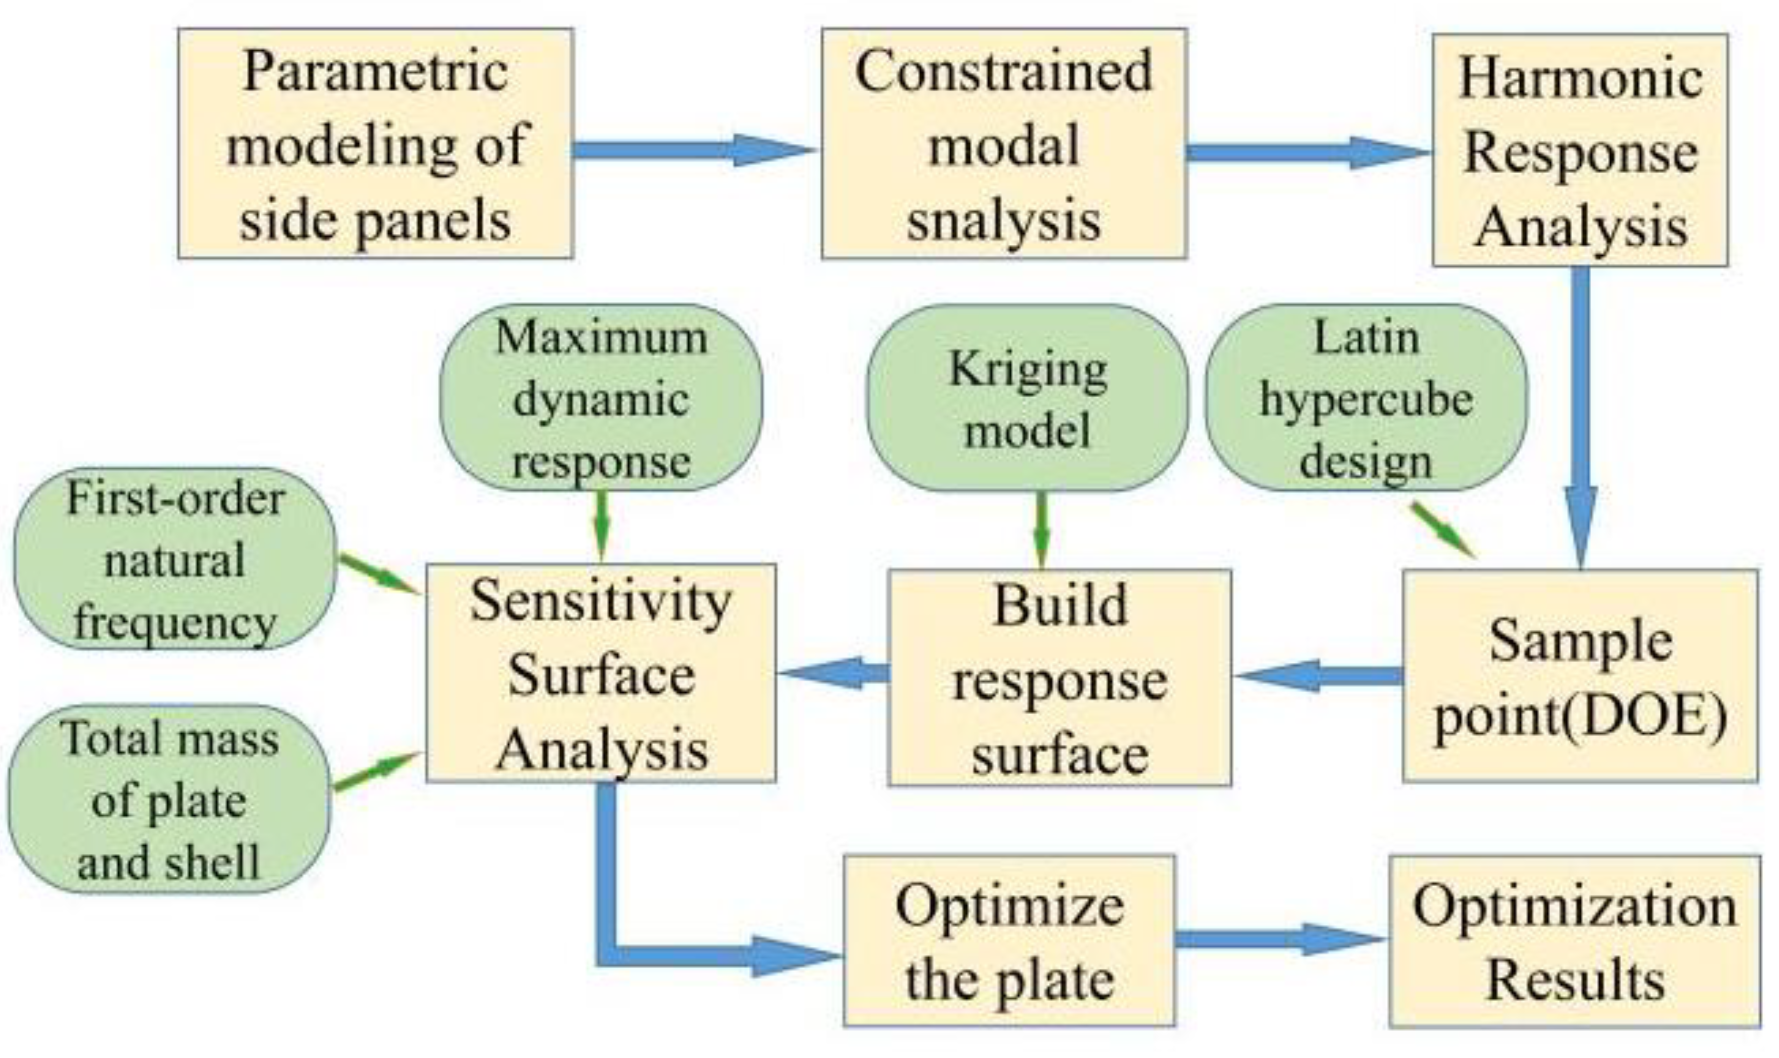
Based on the response surface optimization module in Workbench, this paper conducts the structural optimization design of the studied plate–shell structure. Since the engine speed of the combine harvester is 2400 rpm and the frequency reaches 90 Hz, which will cause resonance effects on most of the plate and shell structures on the body. Therefore, it is necessary to raise the fundamental frequency of the plate to avoid the resonance region of the excitation source. In addition, it is necessary to optimize the structure of the plate for its vibration response in a multi-source excitation environment. The specific steps of structural optimization design are DOE experimental design, construction of response surface model, and optimization of algorithm parameters.
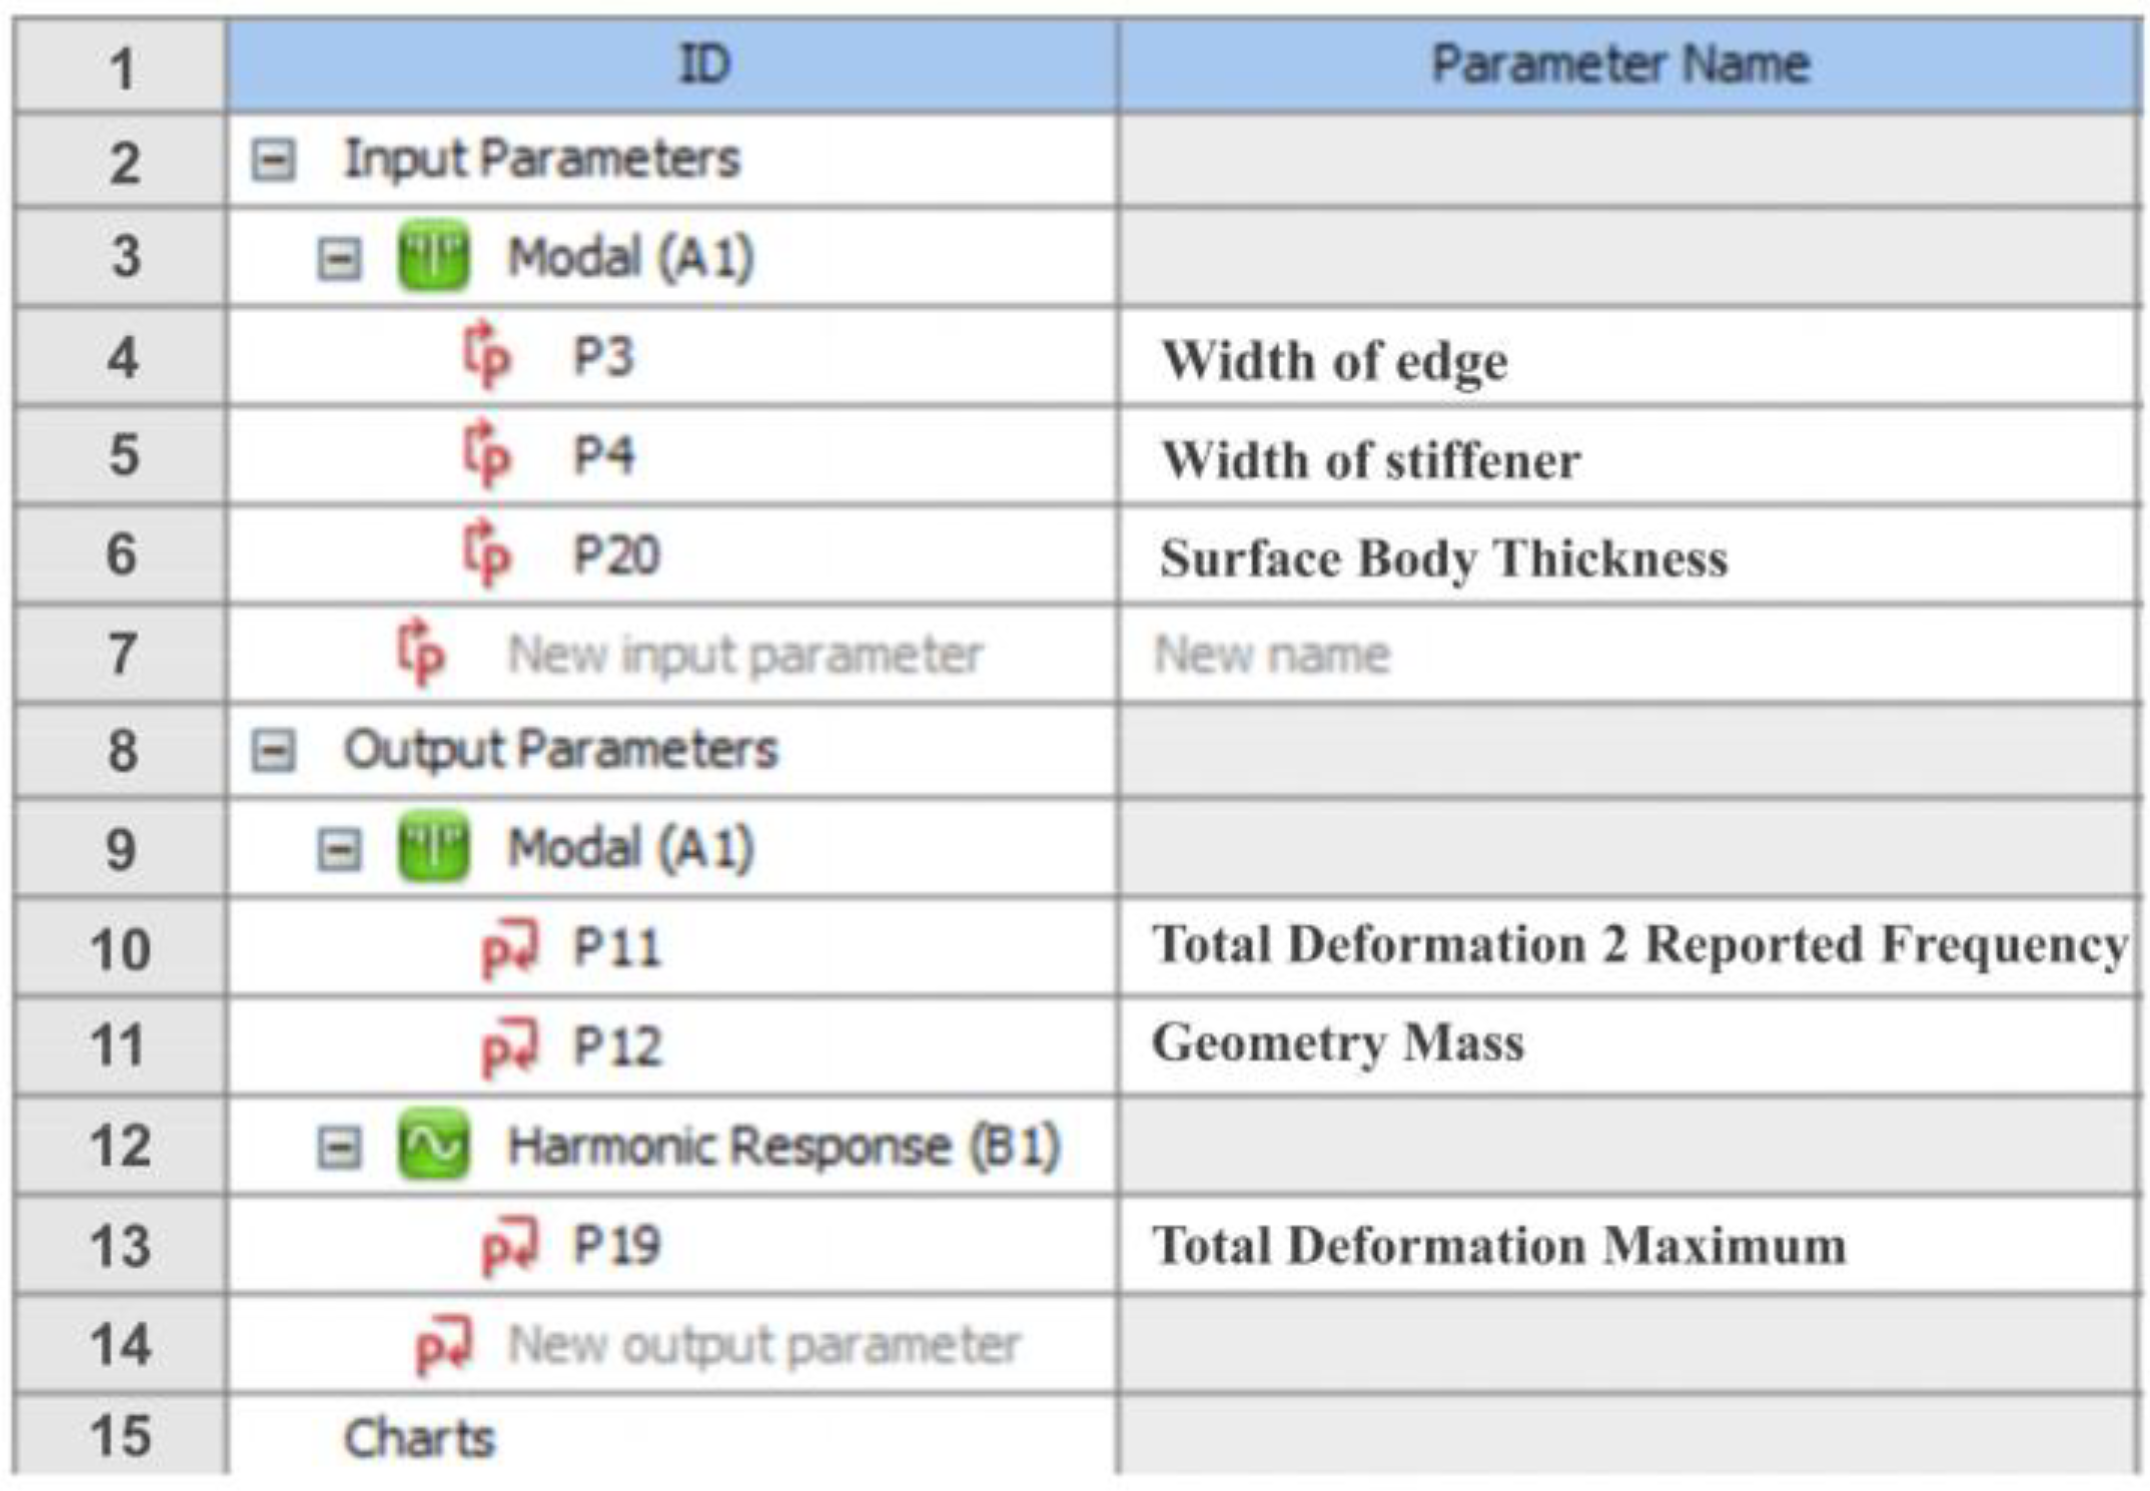
Figure 15 and
Figure 16 are the optimization steps of Workbench and the parametric table in Workbench.
The purpose of structural optimization in this paper is to: a. Raise the fundamental frequency of the plate–shell structure to avoid the resonance range of each vibration source on the combine harvester; b. Improve the vibration response of the plate–shell structure to the multi-source excitation vibration environment. In addition, since the structural optimization in engineering design should be based on not increasing the weight of structural materials, the structural optimization design is based on the fact that the overall mass of the plate and shell is less than or equal to the original structural weight. For the plate–shell structure described in the example, the main factors are the width of the edge stiffener, the width of the stiffener, and the thickness of the foundation plate, the overall quality of the plate and shell is the constraint condition, and the first-order natural frequency and the maximum dynamic response are the optimization objectives. The plate–shell structure is structurally optimized. The optimization problem can be formulated as:
Among them, X = is the design variable, n is the number of design variables; is the first-order natural frequency, is the maximum dynamic response; is the overall quality constraint of the plate–shell structure; is the upper and lower limits of the ith component of the design variable X.
Since the above three influencing factors are all continuous variables, this paper restricts the numerical range of them according to the actual situation. The value range of each parameter is shown in
Table 2. In the DOE experimental design, the Latin hypercube experimental design is used to generate 100 sample points, as shown in
Table 3, and the finite element analysis of the parametric model is used to obtain the overall mass of the plate and shell corresponding to these sample points, the first-order natural frequency and Dynamic response under the action of two-point concentrated harmonic force.
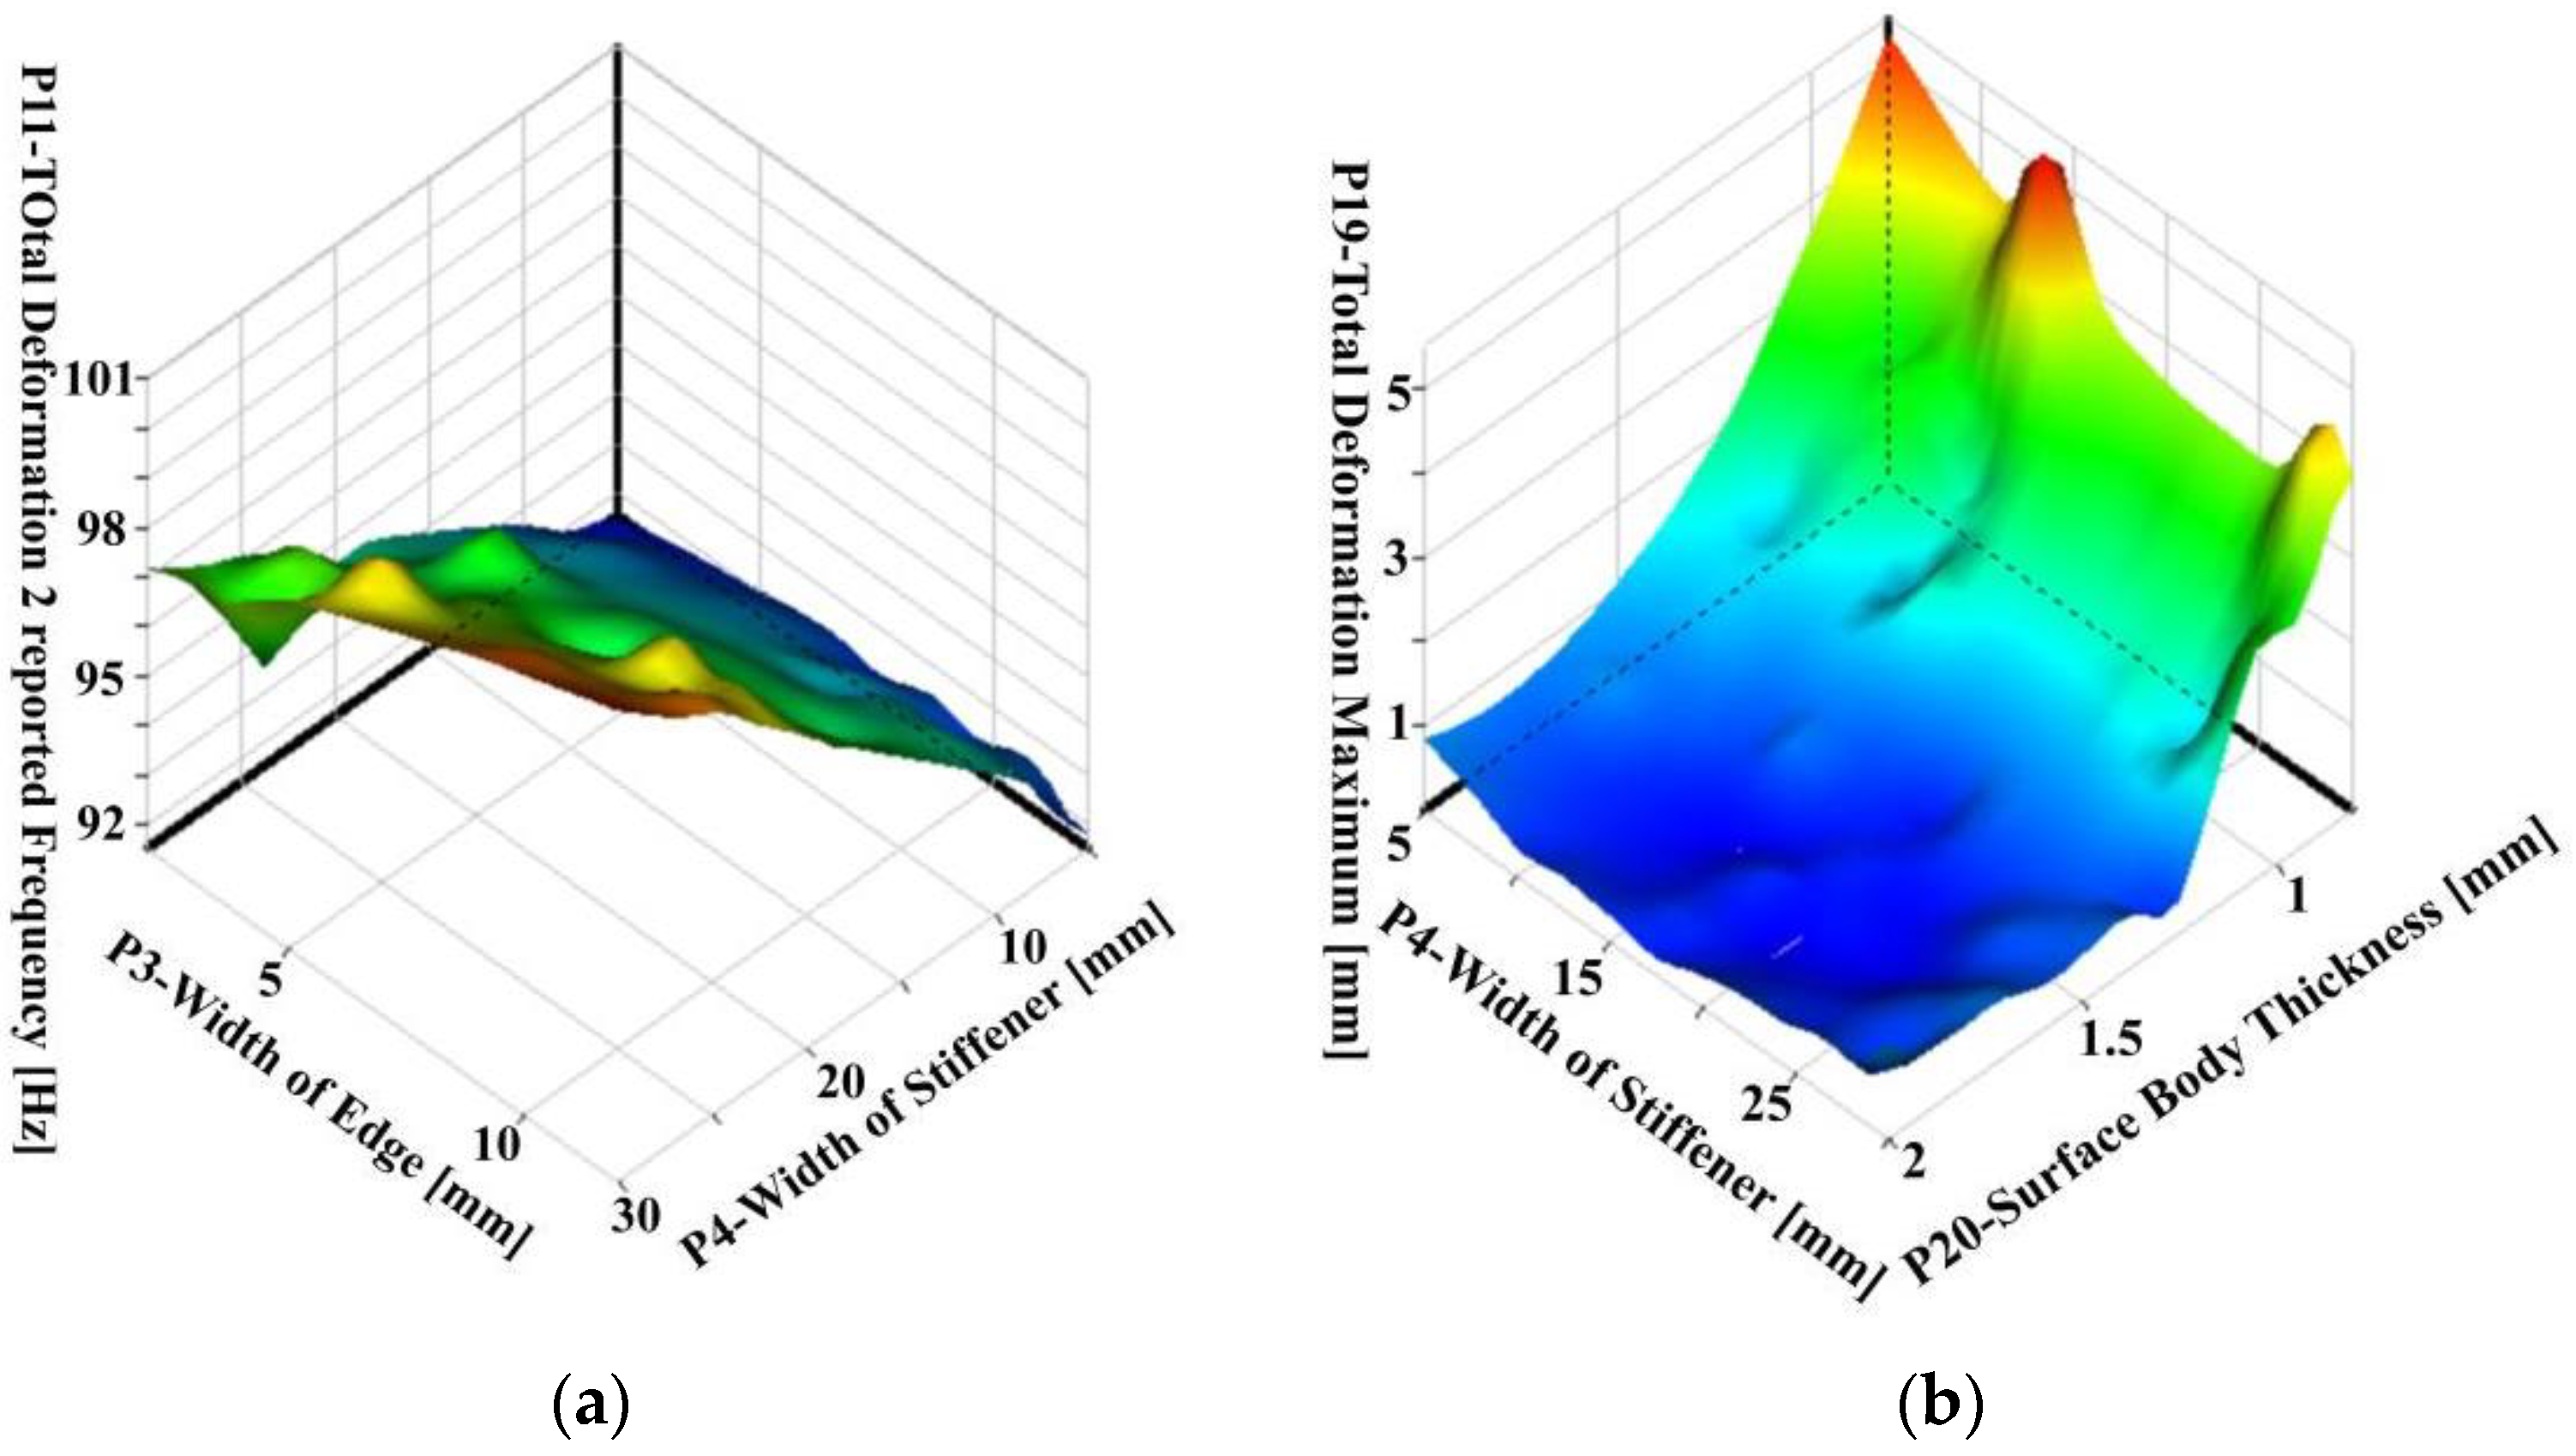
Existing structural optimization categories are divided into response surface optimization and direct optimization. Direct optimization refers to the optimization iteration directly on the finite element model. This method is more accurate but requires a large number of iterations and a lot of time. The method of generating the response surface by sampling can greatly reduce the number of optimization iterations and reduce the time cost, but the relative accuracy will be reduced. This paper adopts the response surface optimization method to optimize the structure. According to the sampling points generated by the above-mentioned Latin hypercube experimental design, the Kriging model in the response surface model is selected for interpolation approximation, and the generated surrogate model is shown in
Figure 17 below:
In this paper, the quality of the plate and shell is taken as the constraint, the maximum first-order natural frequency and the maximum dynamic response are taken as the optimization objective, and the optimal value of the relevant parameter value in a limited range can be obtained by optimizing the relevant parameters through the genetic algorithm. By the structure optimization module of Workbench, three groups of optimal parameter candidate points are finally obtained. Three groups of optimal parameter candidate points are shown in
Table 4.
It can be seen from the table that if the maximum first-order natural frequency and the maximum dynamic response are taken as the optimization goals, combined with the quality constraints, the relevant parameters of candidate point three are the best choices. Through data rounding, the final optimization parameters are:
It can be seen from
Table 5 that through the structural optimization, the overall quality of the plate and shell structure did not improve, and its first-order natural frequency increased by 9.6%, which avoids the resonance range of the main rotating parts on the combine harvester. At the same time, the maximum dynamic response under the action of point concentrated harmonic force decreases by 62.4%, which greatly reduces the amplitude of the plate–shell structure. In general, through the method studied in this paper, a substantial optimization of the two main parameter variables of the plate and the shell structure is achieved so that the plate and shell structure can better adapt to the vibration environment of the combine harvester multi-source excitation, for future combine harvesting. The chassis structure design provides a reference.
3.5. Test Verification
In order to verify the accuracy of the structural optimization method studied in this paper, the optimized plate is processed on the basis of the above optimization simulation.
Figure 18 is the outline view of the panel before and after optimization. The original plate and the optimized plate are dynamically tested from the fundamental frequency of the restrained mode and the vibration response under multi-point vibration, so as to verify the optimization results.
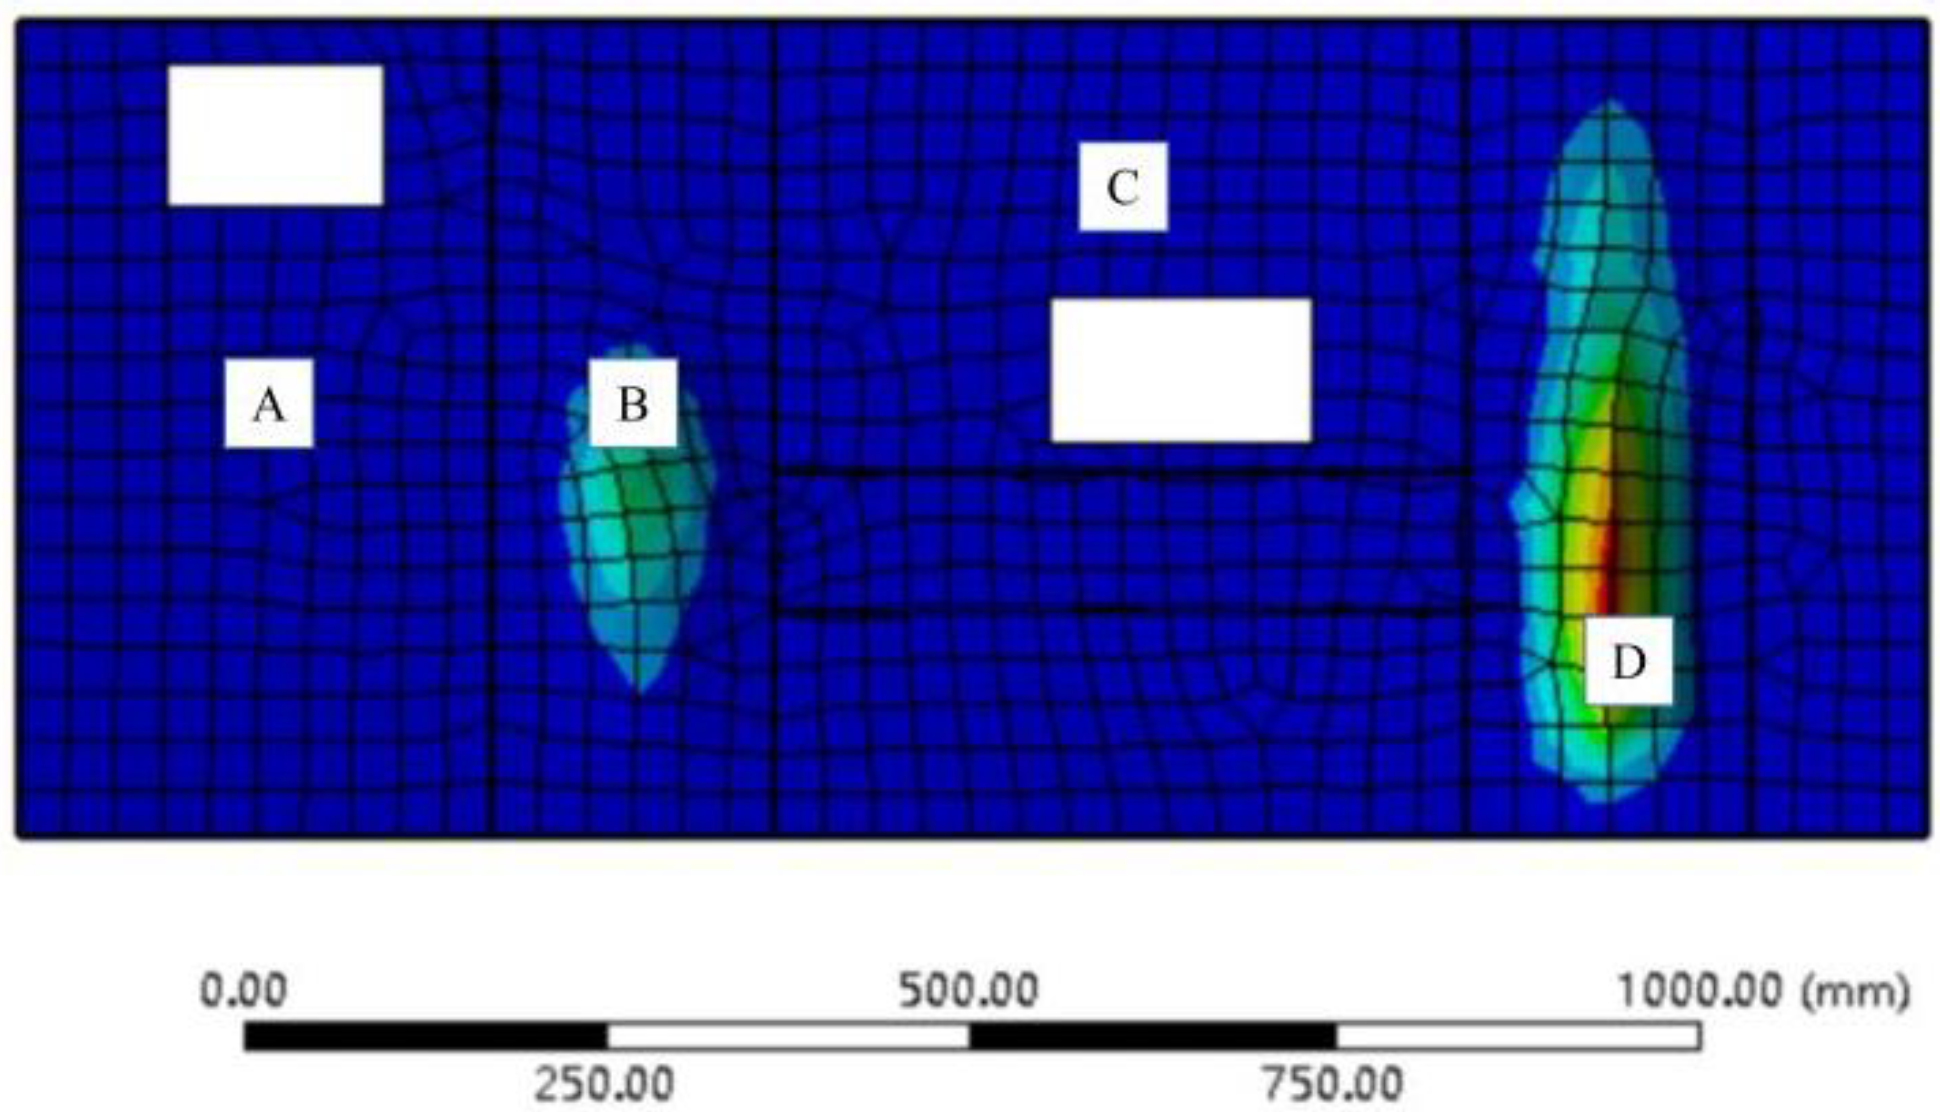
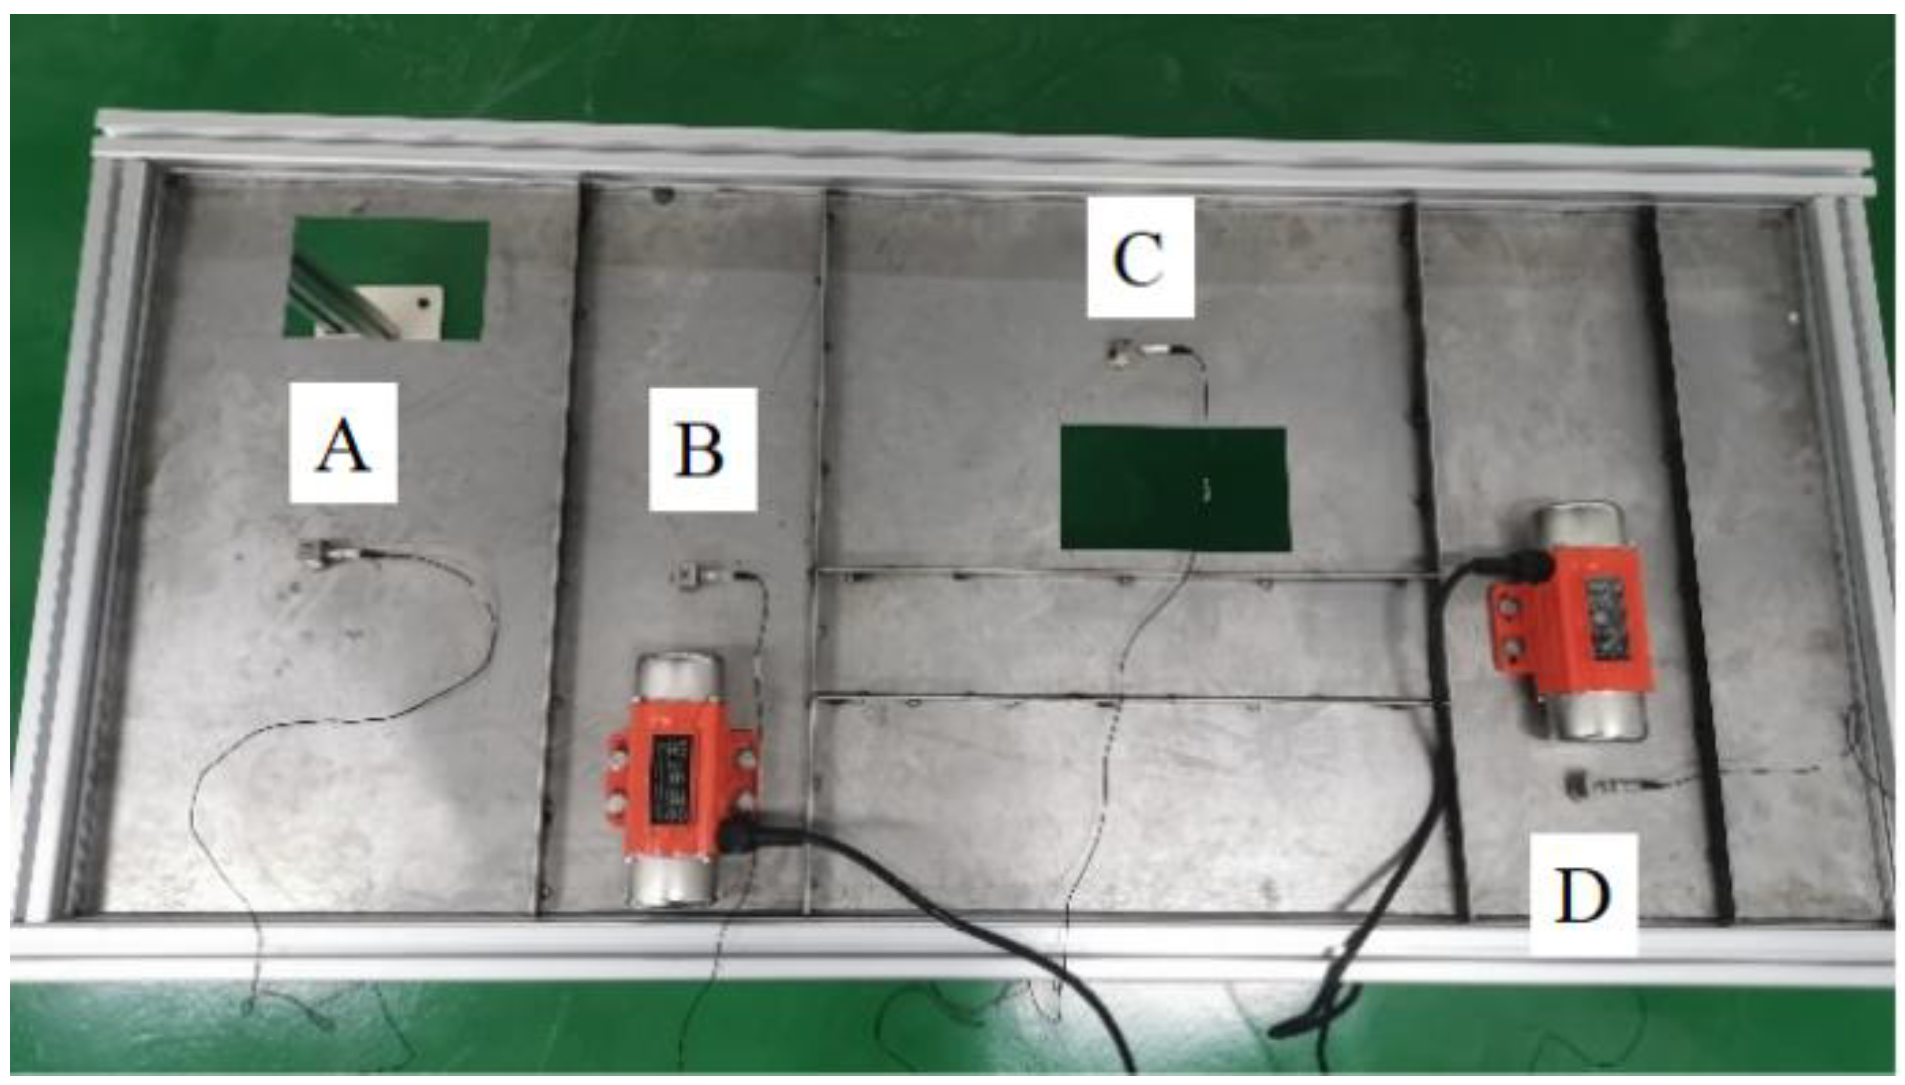
The position of the exciter refers to the position of the concentrated force on the combine harvester, where the grain conveying auger and the miscellaneous auger are located. Referring to the simulation results (
Figure 19), the vibration displacement is collected at the place where the amplitude of the plate and shell is large. There are four measurement points, marked as A, B, C, and D.
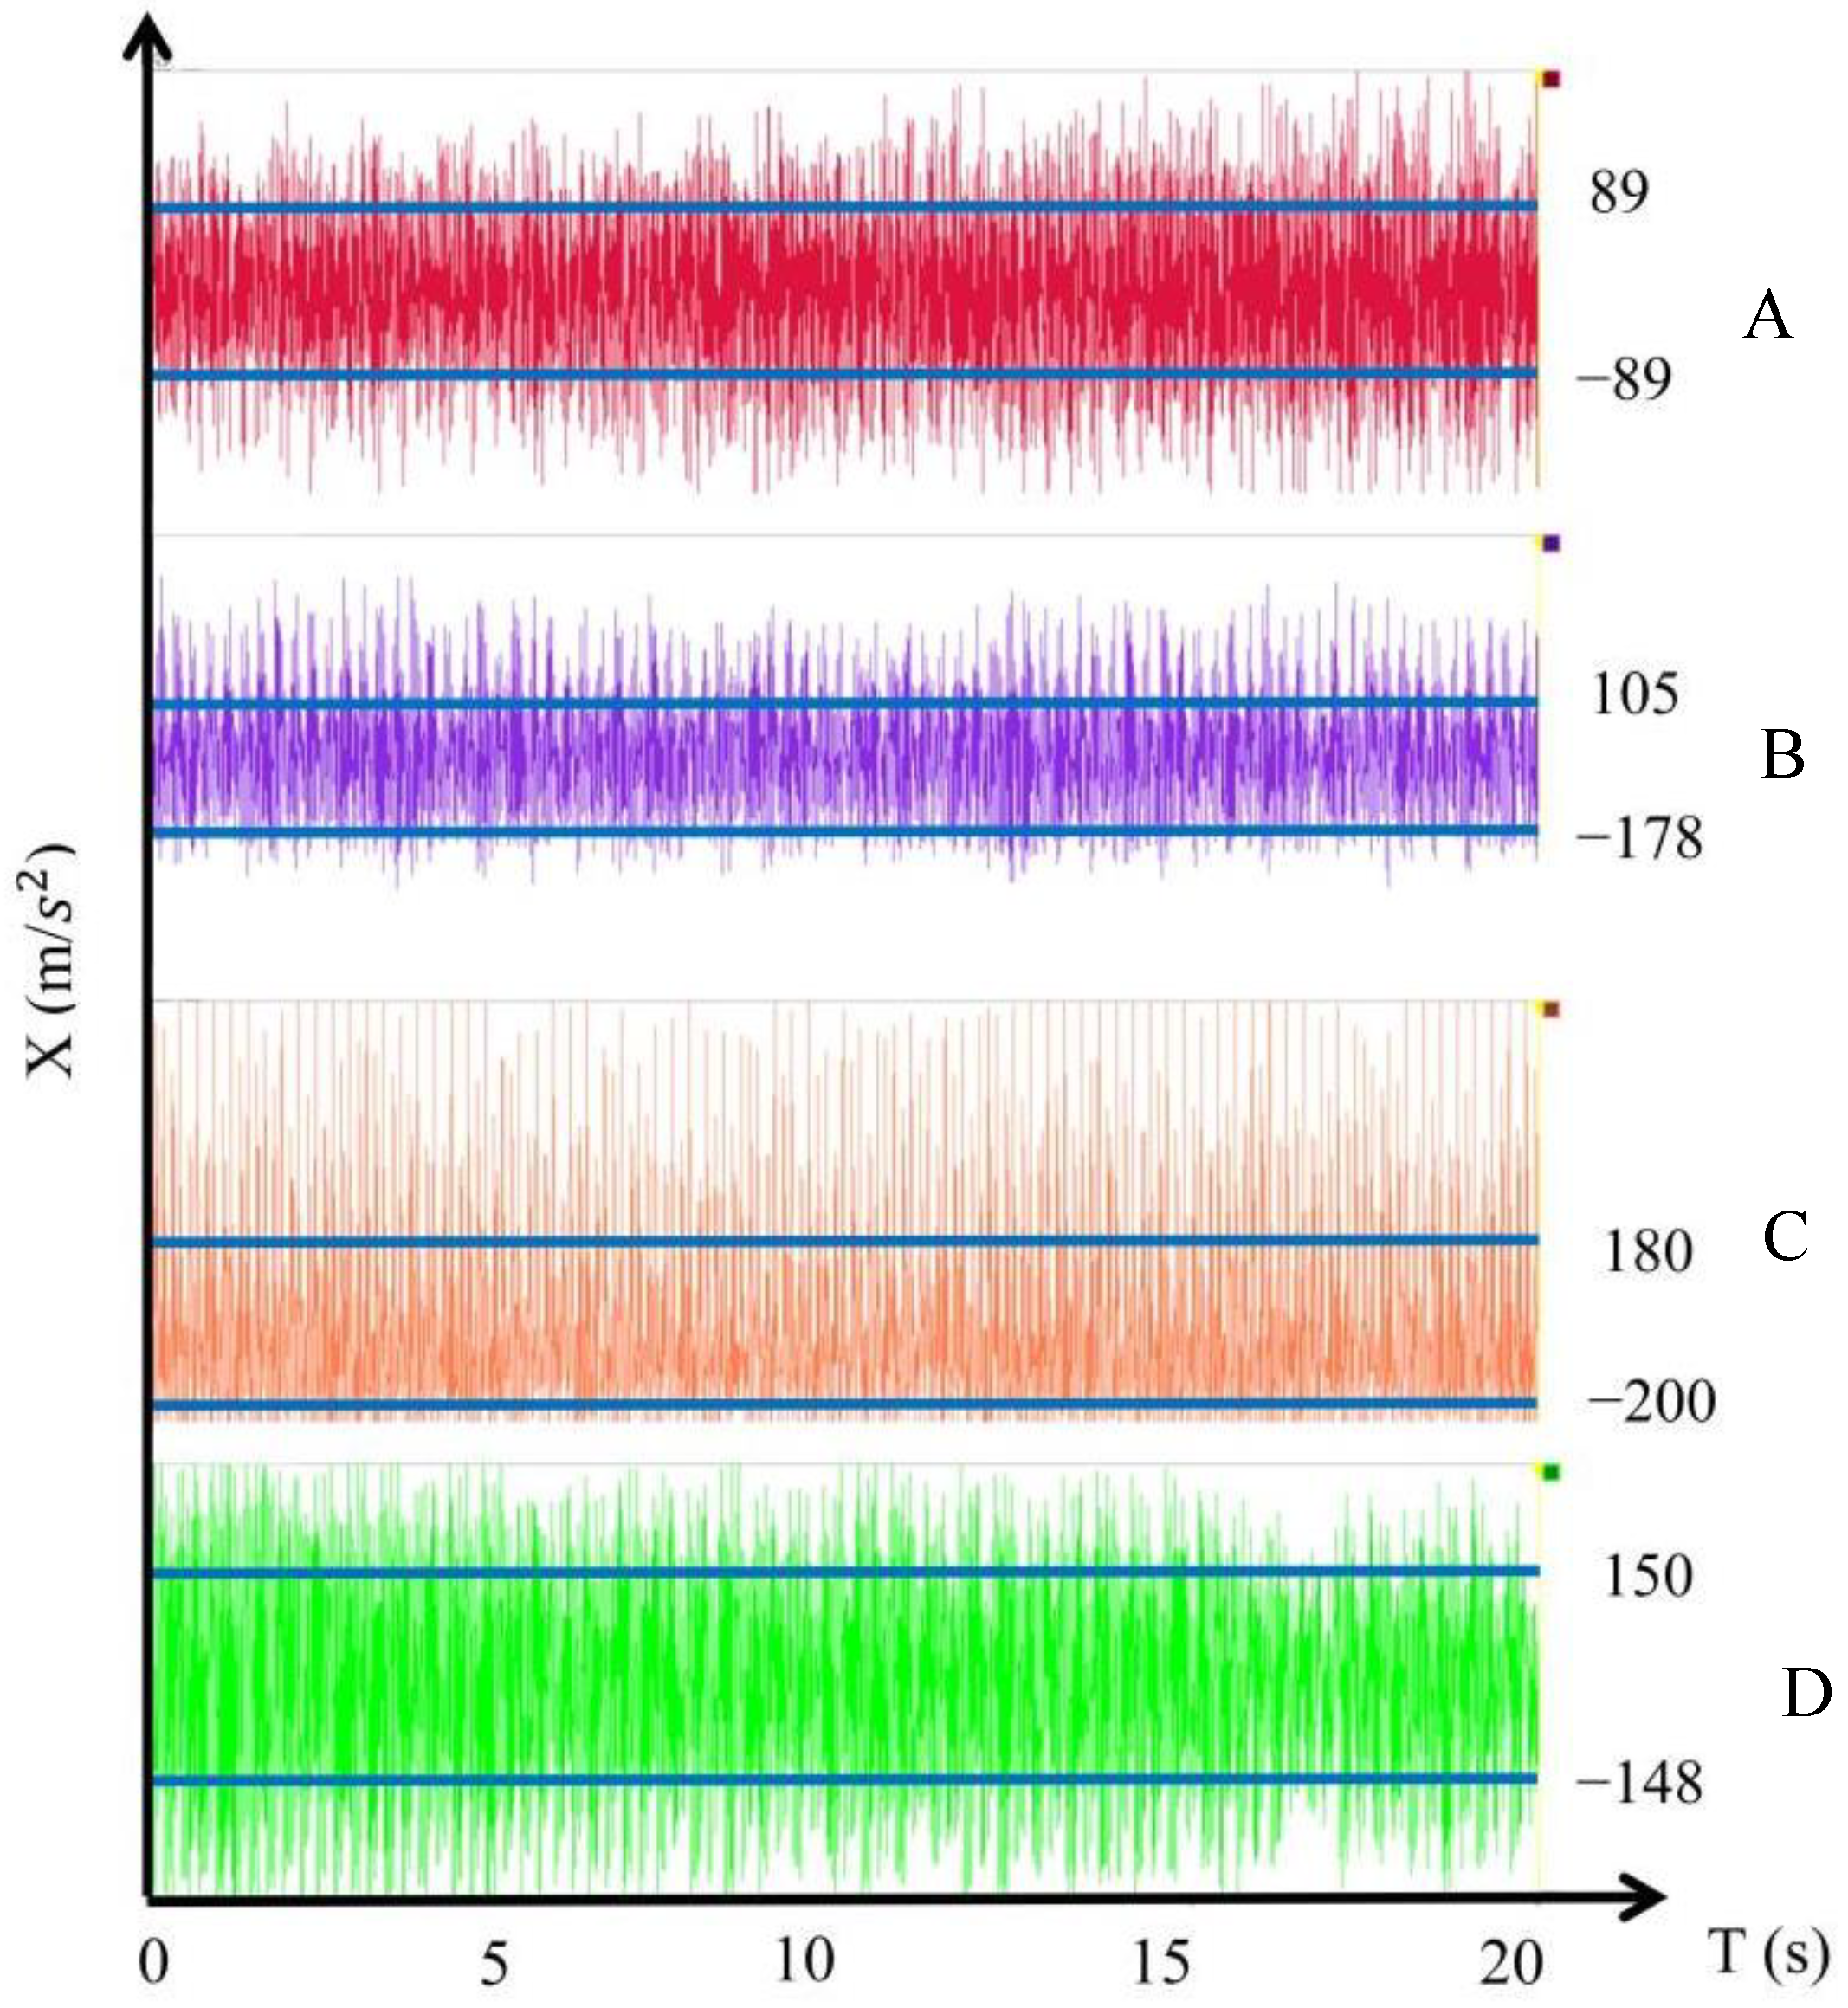
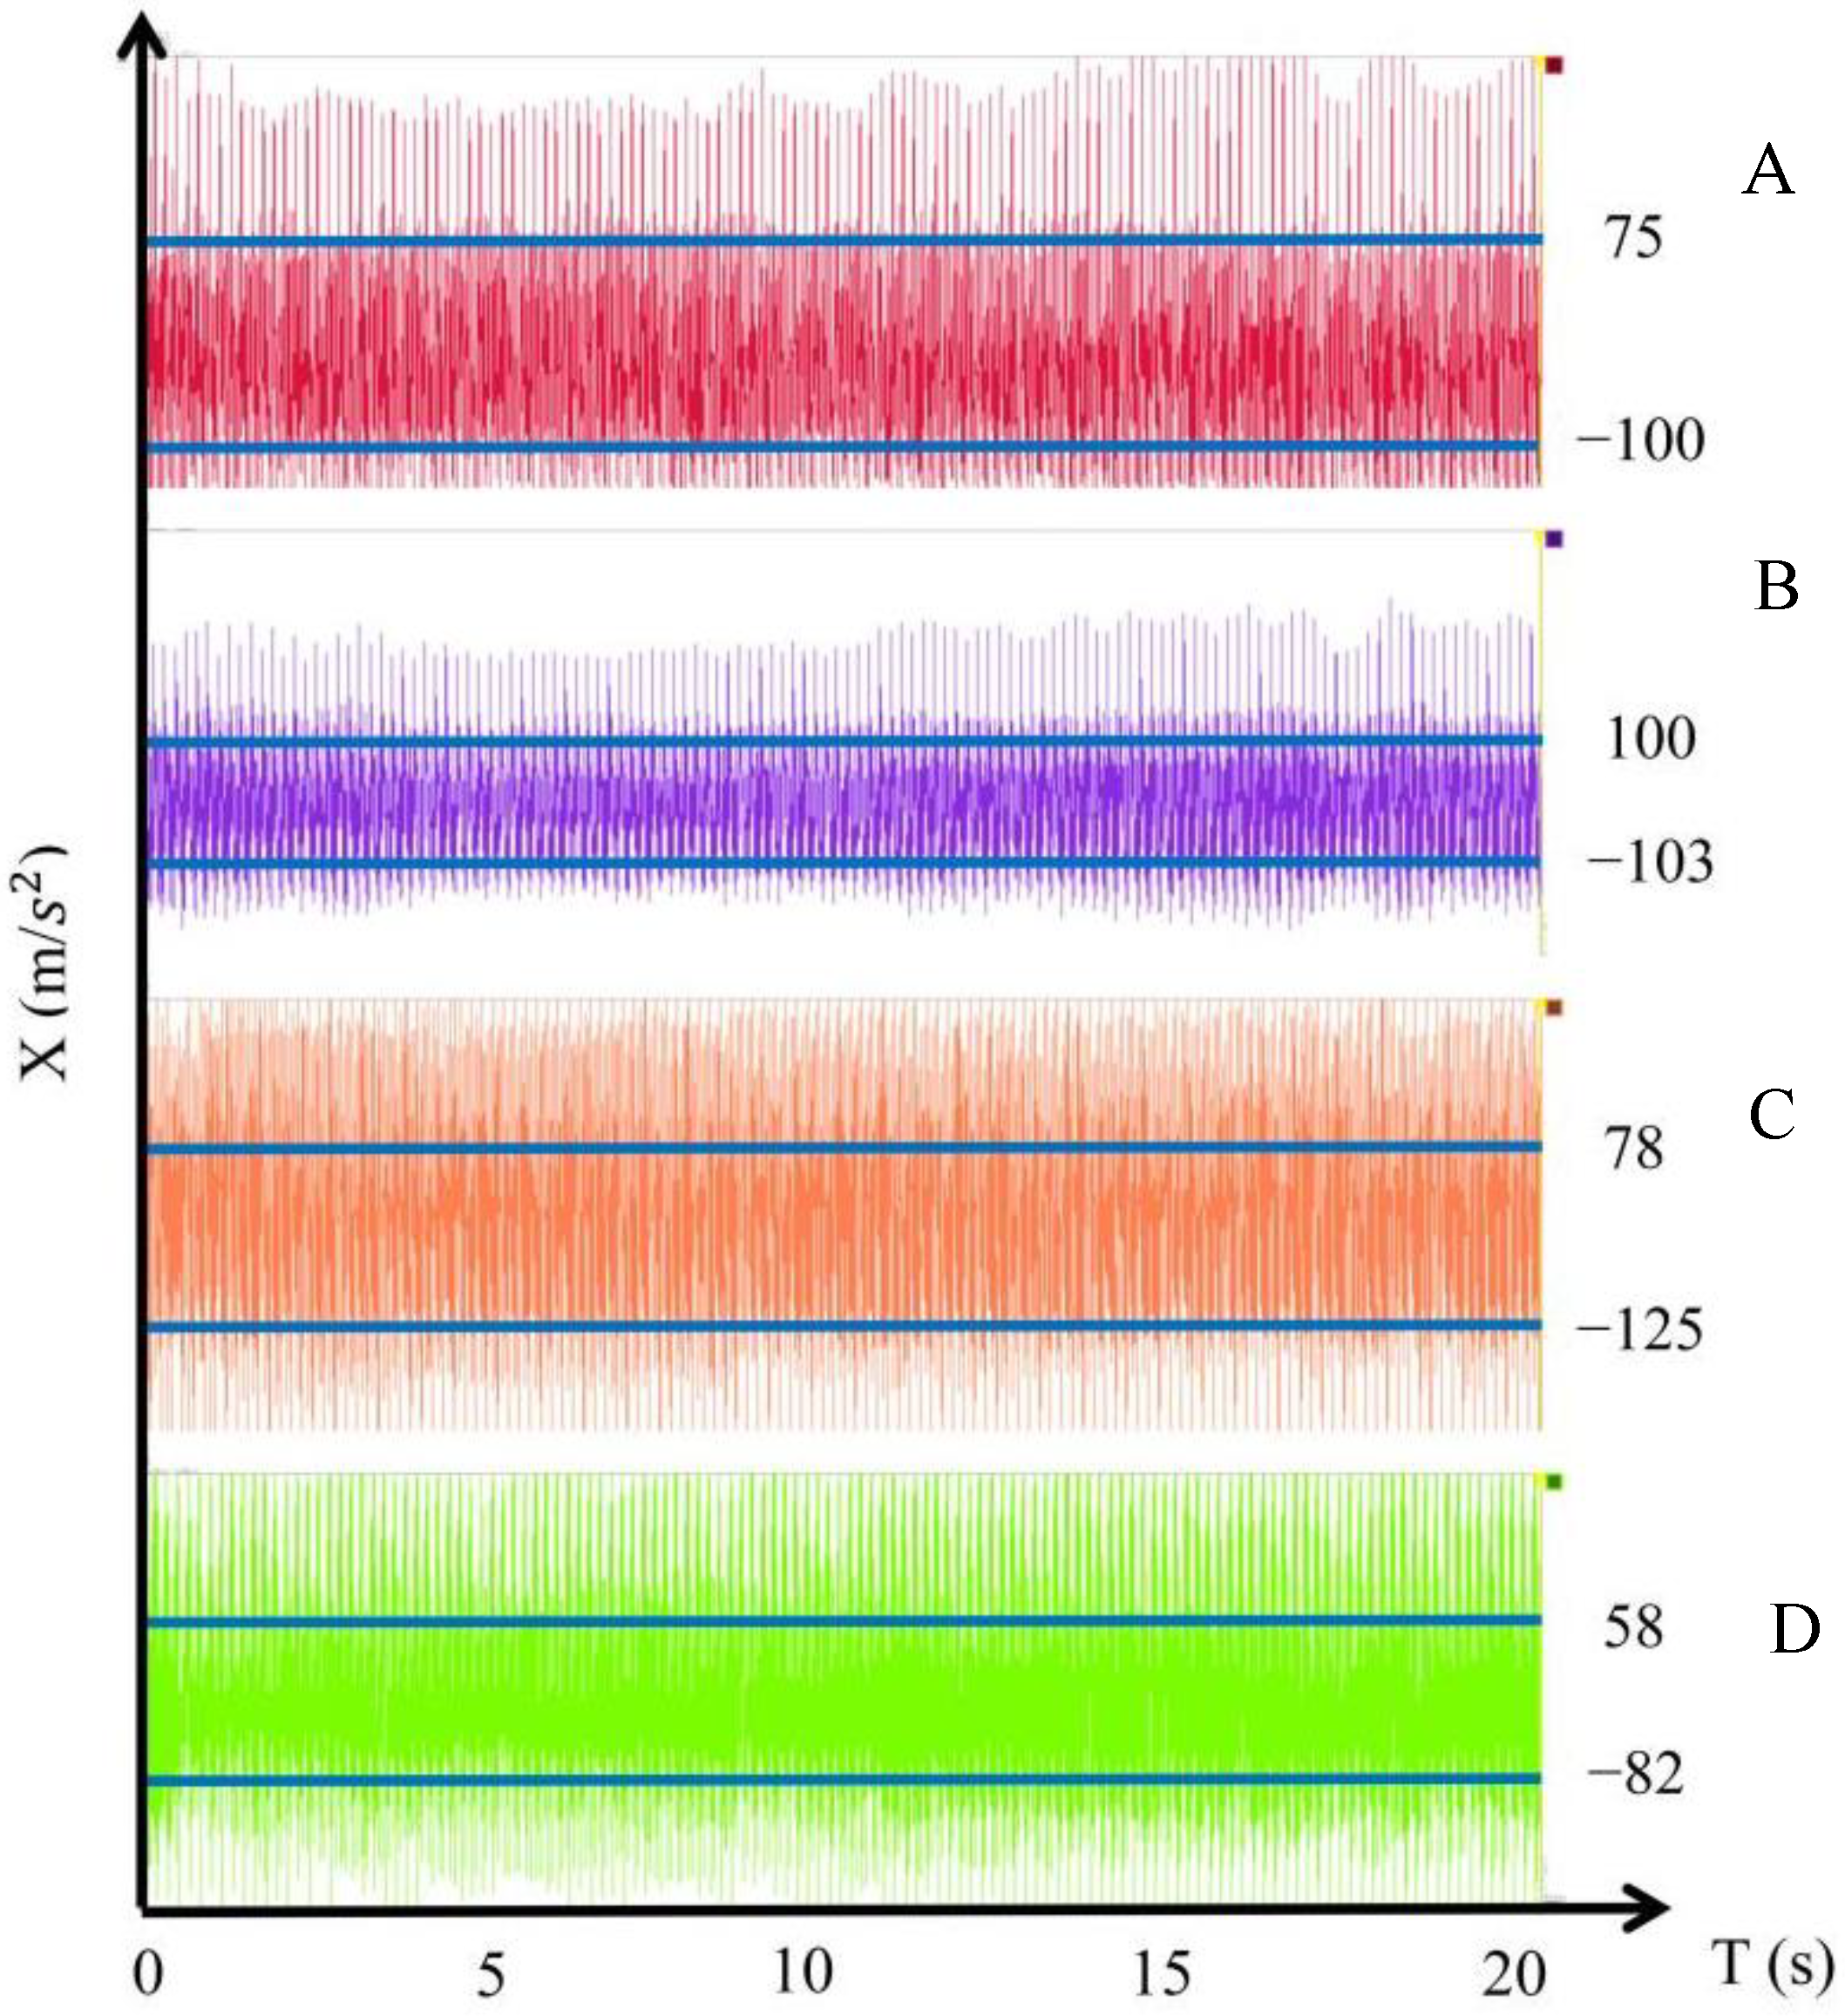
By adjusting the rotational speed of the exciter, the exciting force on the plate shell can reach 1000 N. Under the action of two concentrated harmonic forces, the displacement responses of the original plate and the optimized plate at points A, B, C, and D are shown in
Figure 20.
It can be seen from
Figure 21 and
Figure 22 that the two plates before and after optimization have larger vibration responses at points B and D near the exciter, while point C between the two excitation sources is the place with the largest vibration response, which may be due to that point C is located at the superposition of the two vibrations. Comparing the data of the above two panels before and after optimization, the amplitude of vibration response of the optimized panel is smaller than that of the panel before optimization at all four points. This shows that the optimized plate–shell structure effectively reduces the vibration response under the reuse of two-point concentrated harmonic force.
In addition, it is necessary to verify whether the fundamental frequency of the optimized plate–shell structure is improved. Therefore, in this paper, constrained modal tests are carried out on the original plate and the optimized plate, and the fundamental frequencies of the two plates before and after optimization are obtained through the test. The test results of the two plate–shell structures obtained are shown in the
Table 6.
It can be seen from the table that the first-order natural frequency of the optimized plate–shell structure has increased by 14.6%, from 88.08 to 100.95, avoiding the resonance range of the main components on the combine harvester. At the same time, the fundamental frequencies of other orders have also been greatly improved. It is also close to the simulation results.
To sum up, the fundamental frequency and dynamic response of the two panels before and after optimization are compared through dynamic testing. The experimental data show that the vibration response of the optimized panel under the action of the two-point concentrated harmonic force is greatly reduced. The first-order natural frequency has been increased. Therefore, the feasibility of the structure optimization method in this paper is verified by experiments.
