
Analysis of the Effects and Causes of Driver Horn Use on the Acoustic Environment at Urban Intersections in Taiwan


 and
and
Abstract
:1. Introduction
2. Procedures
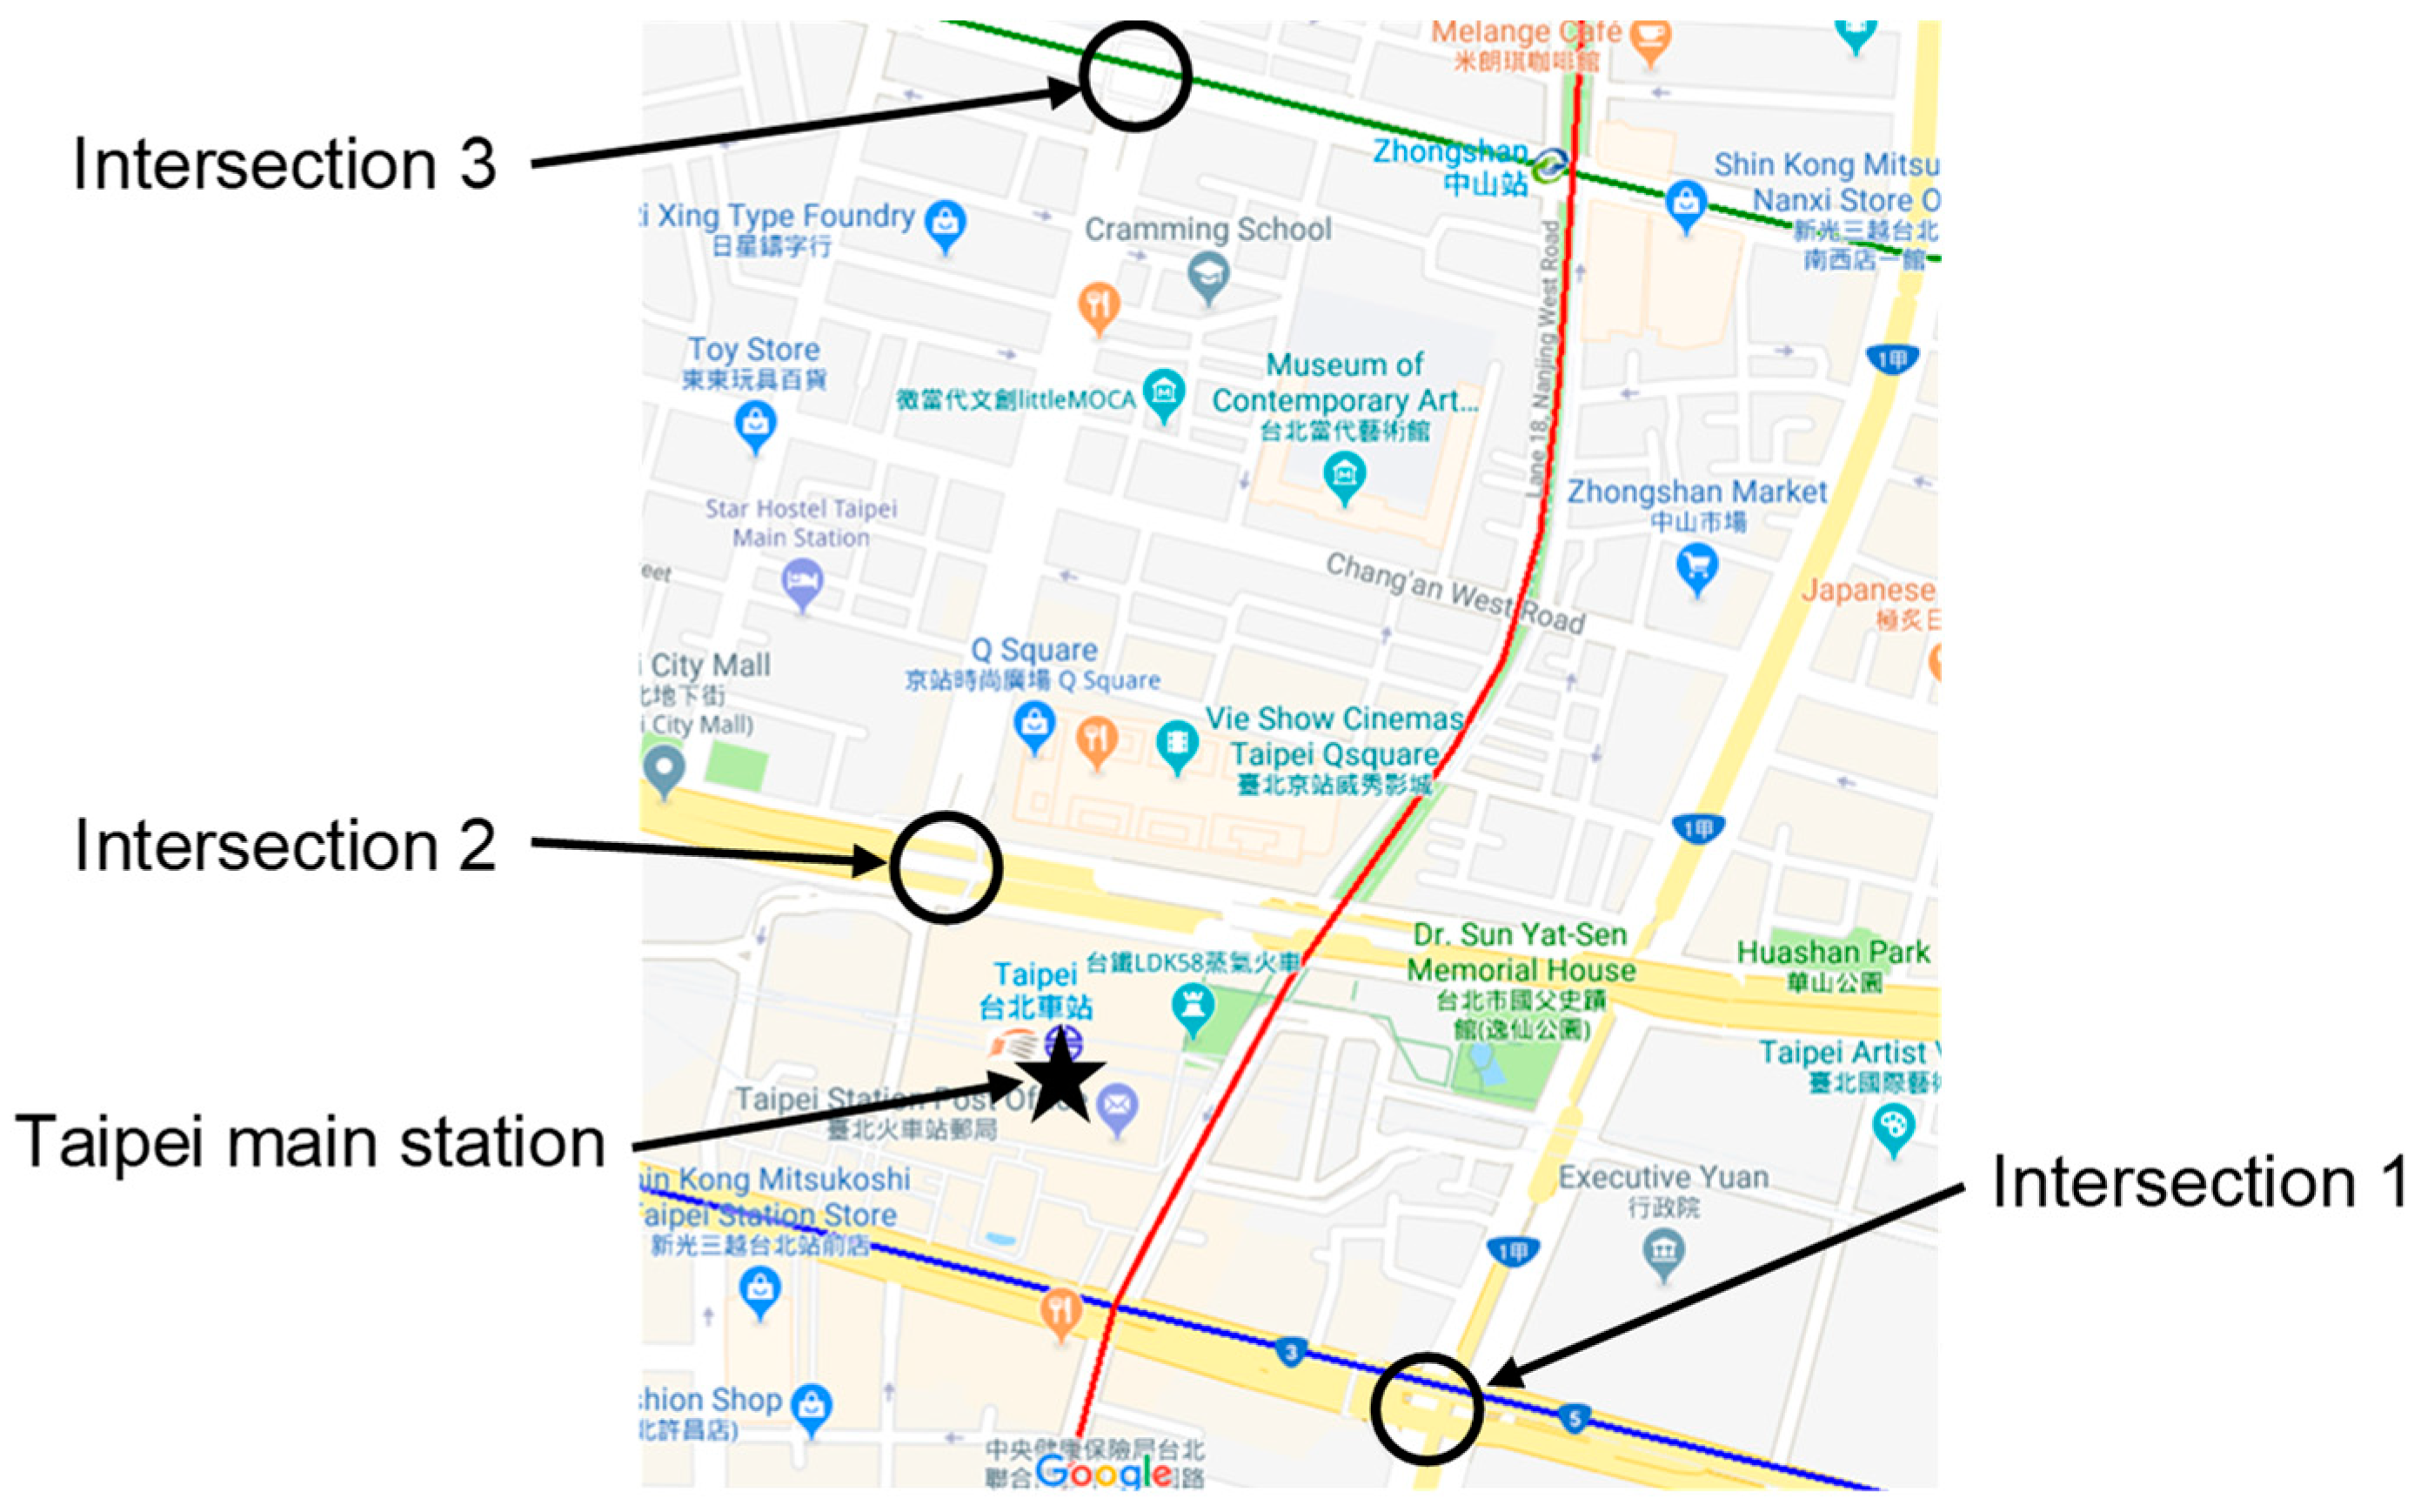
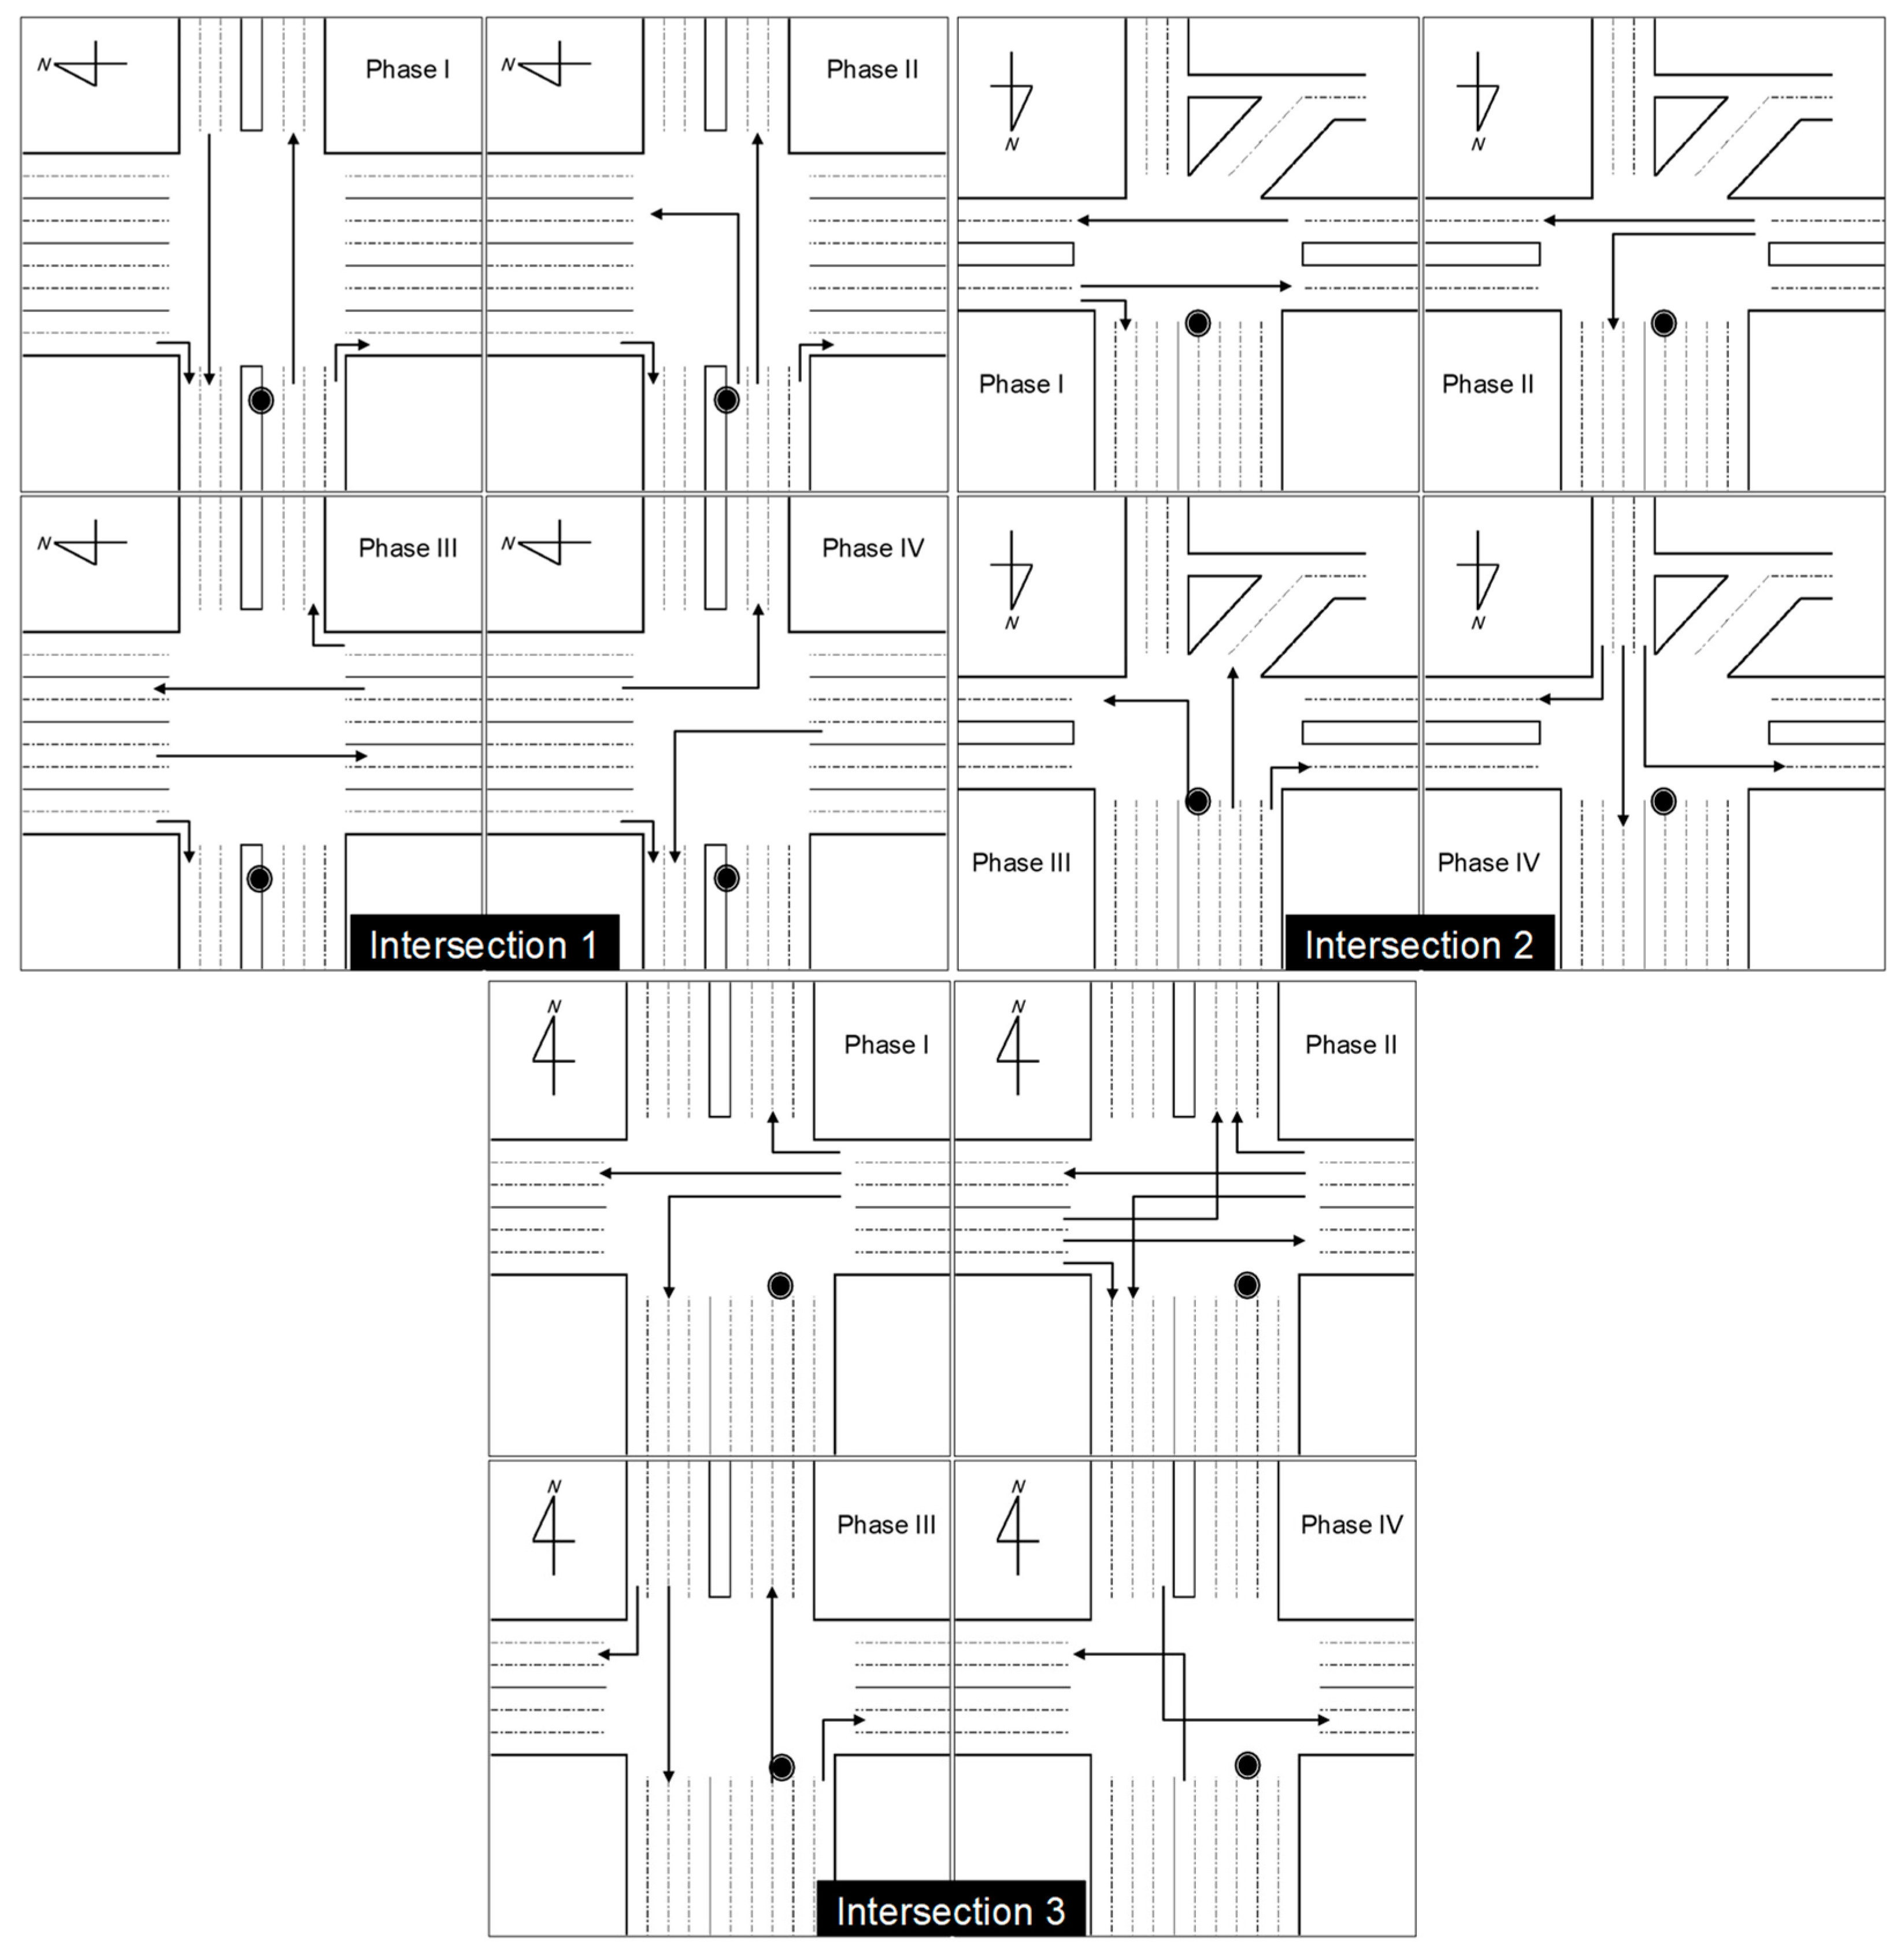
2.1. Surveyed Sites and Equipment
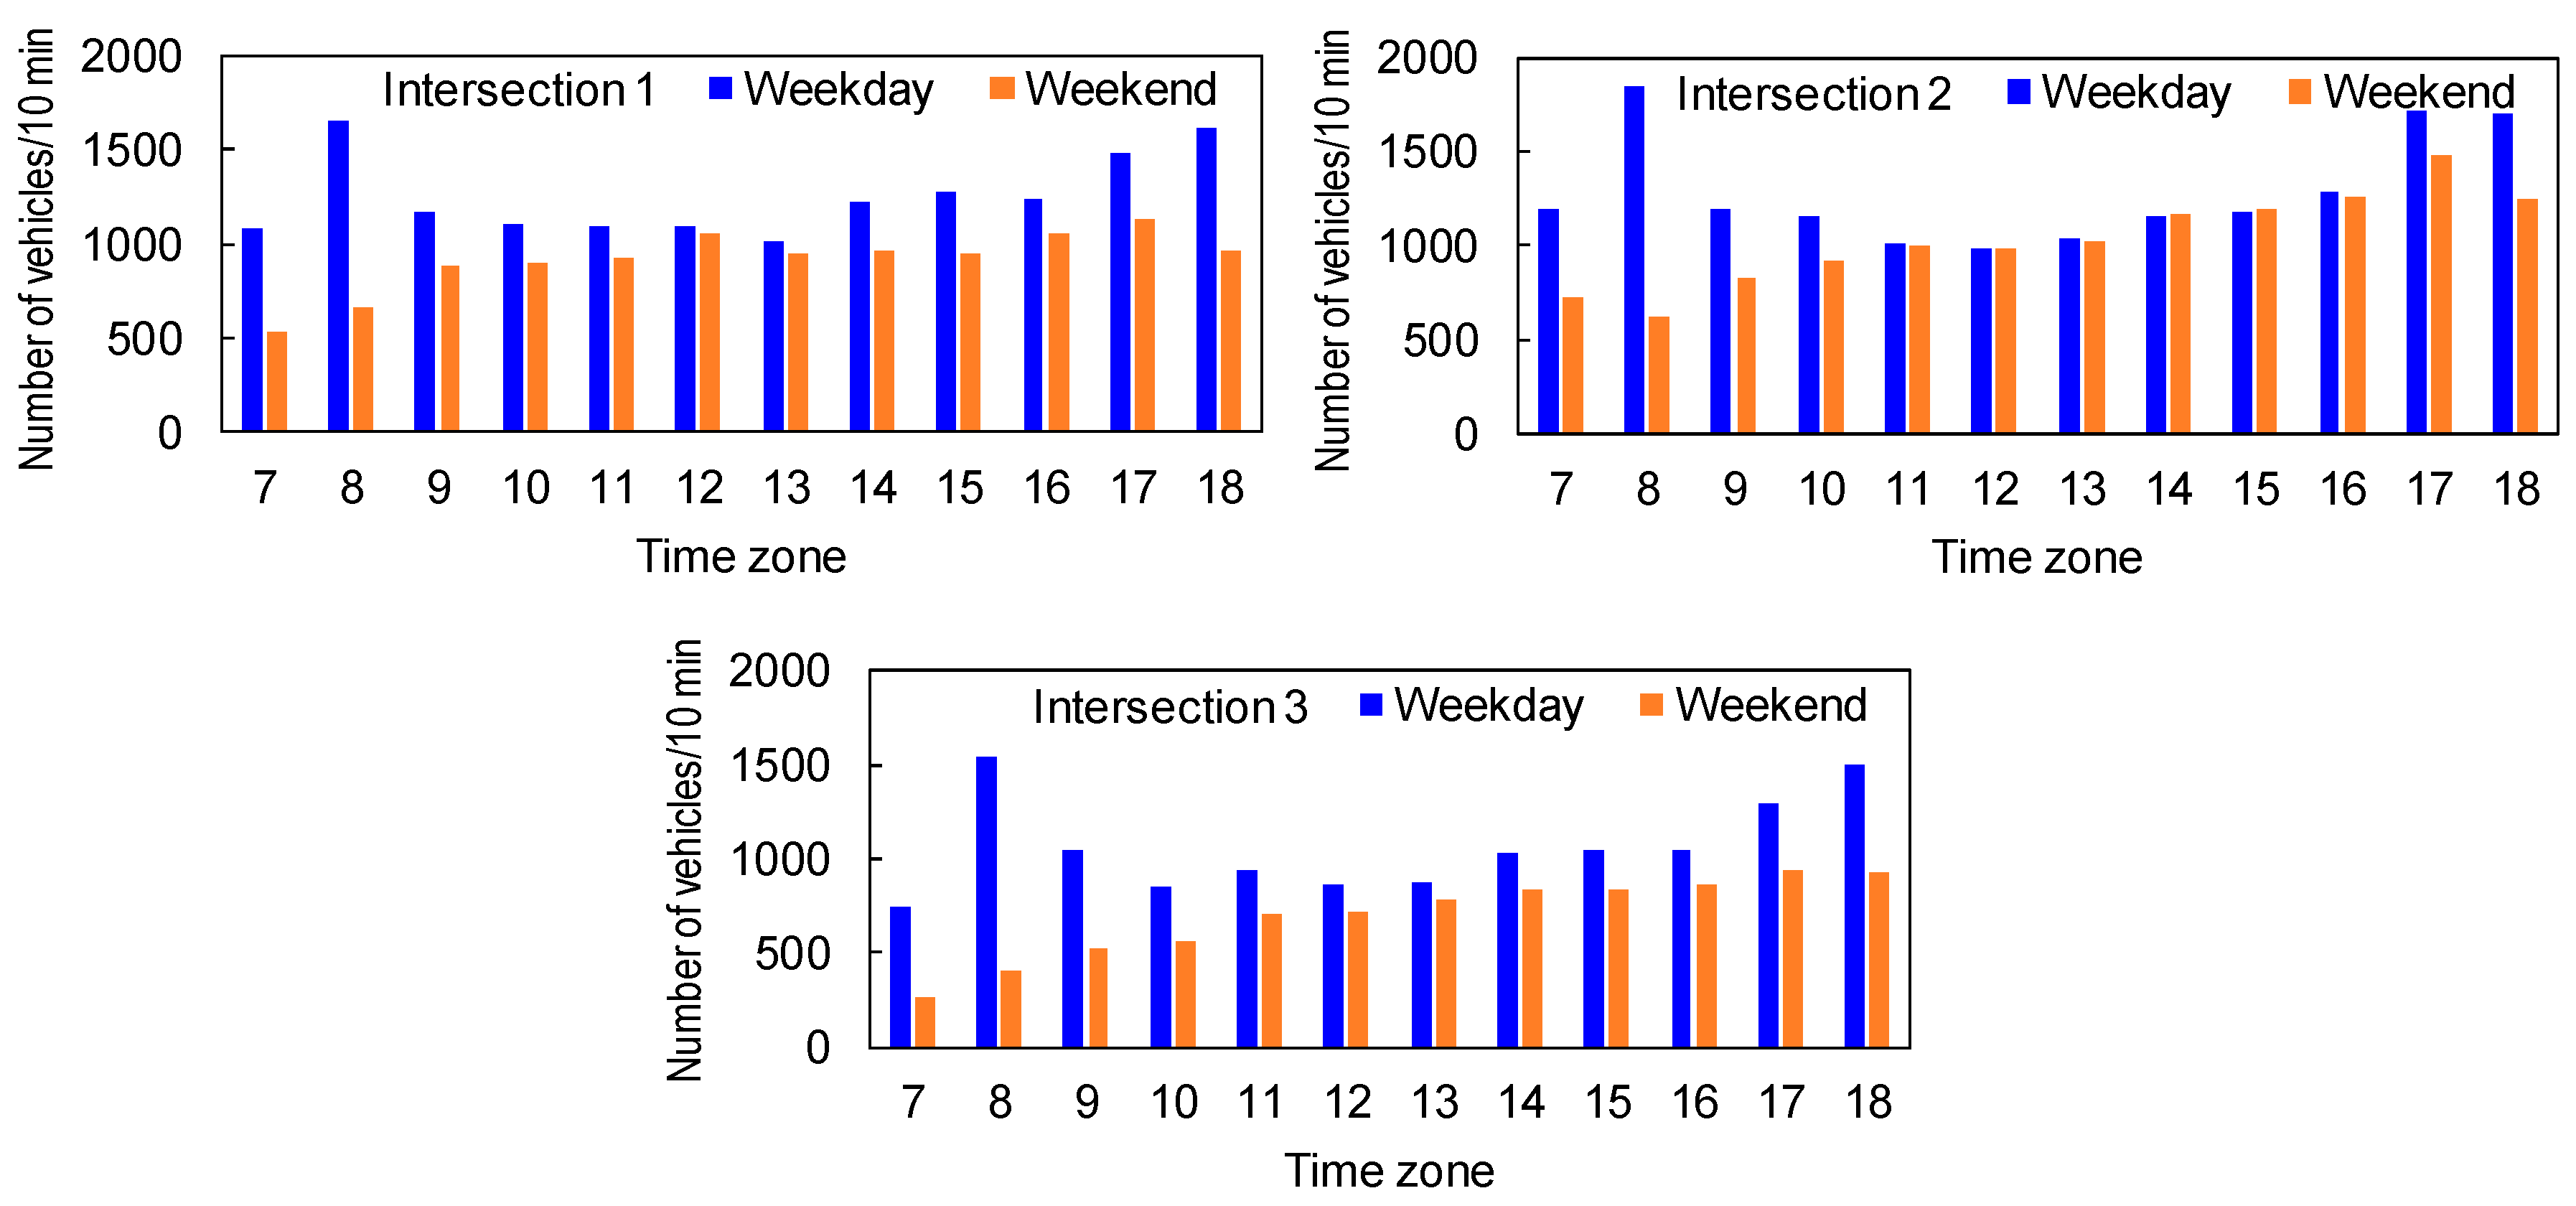
2.2. Traffic Volume at Intersections
2.3. Analysis of Horn Honking
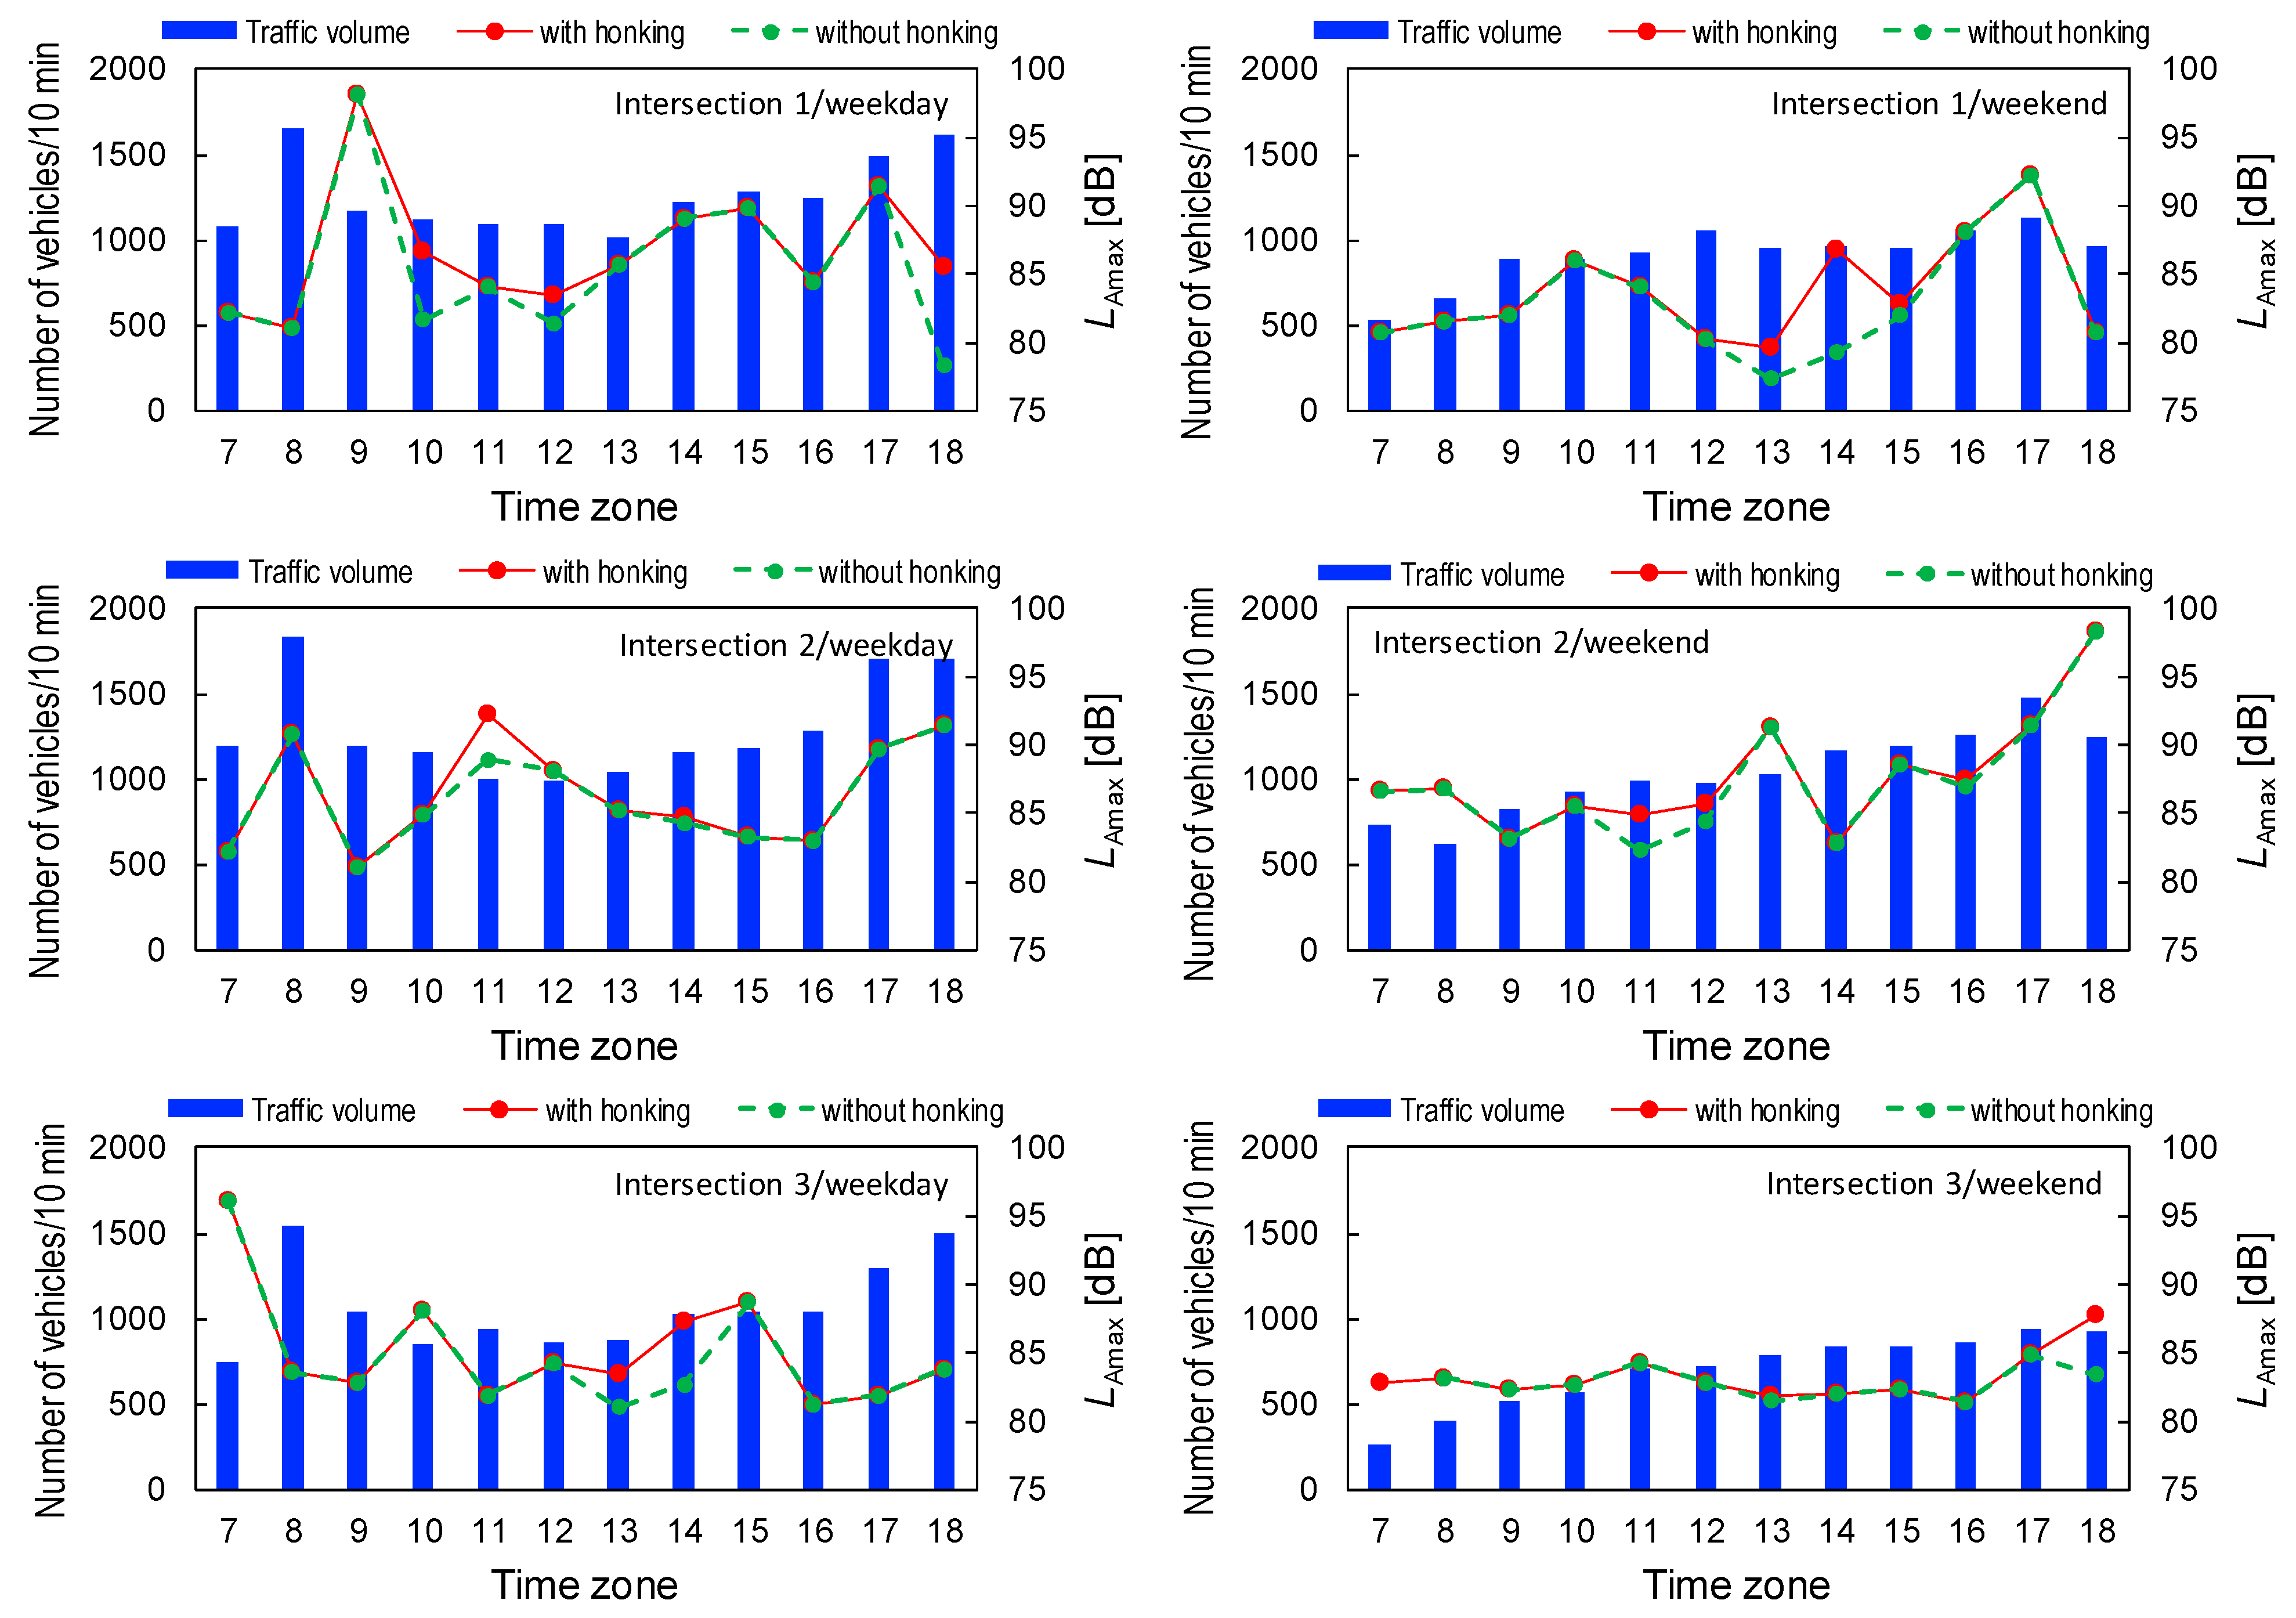
3. Results
4. Analysis
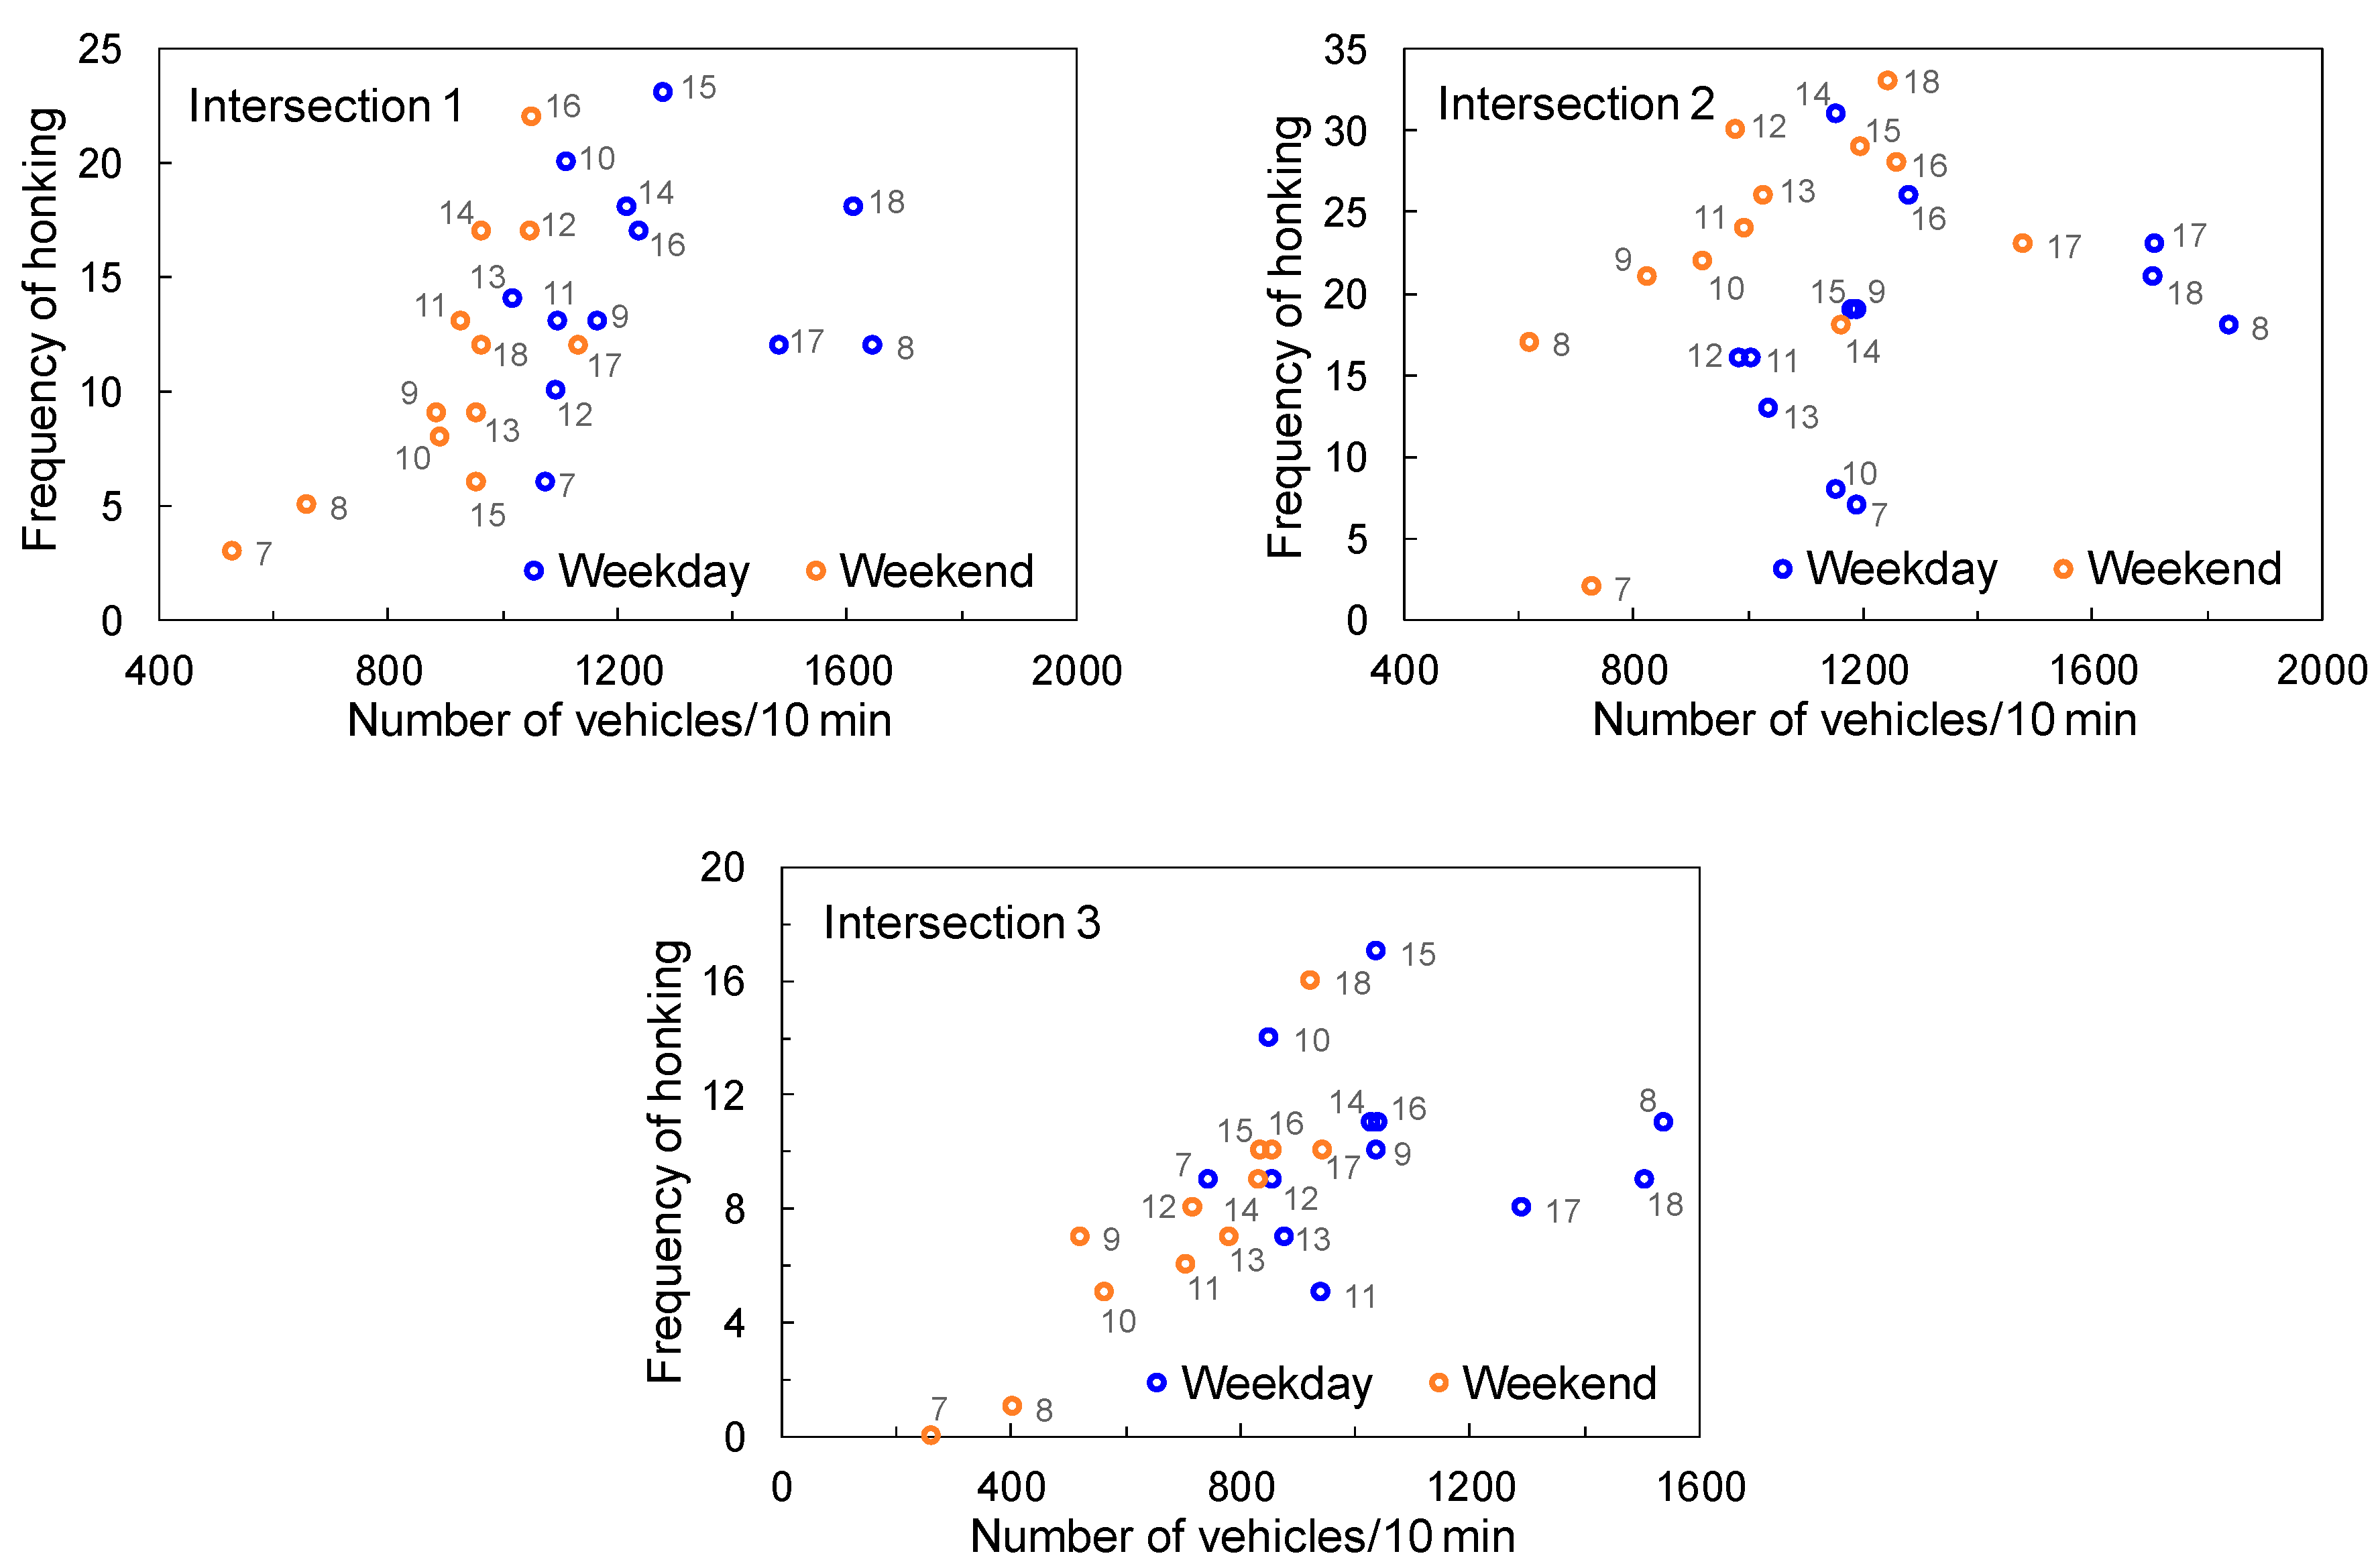
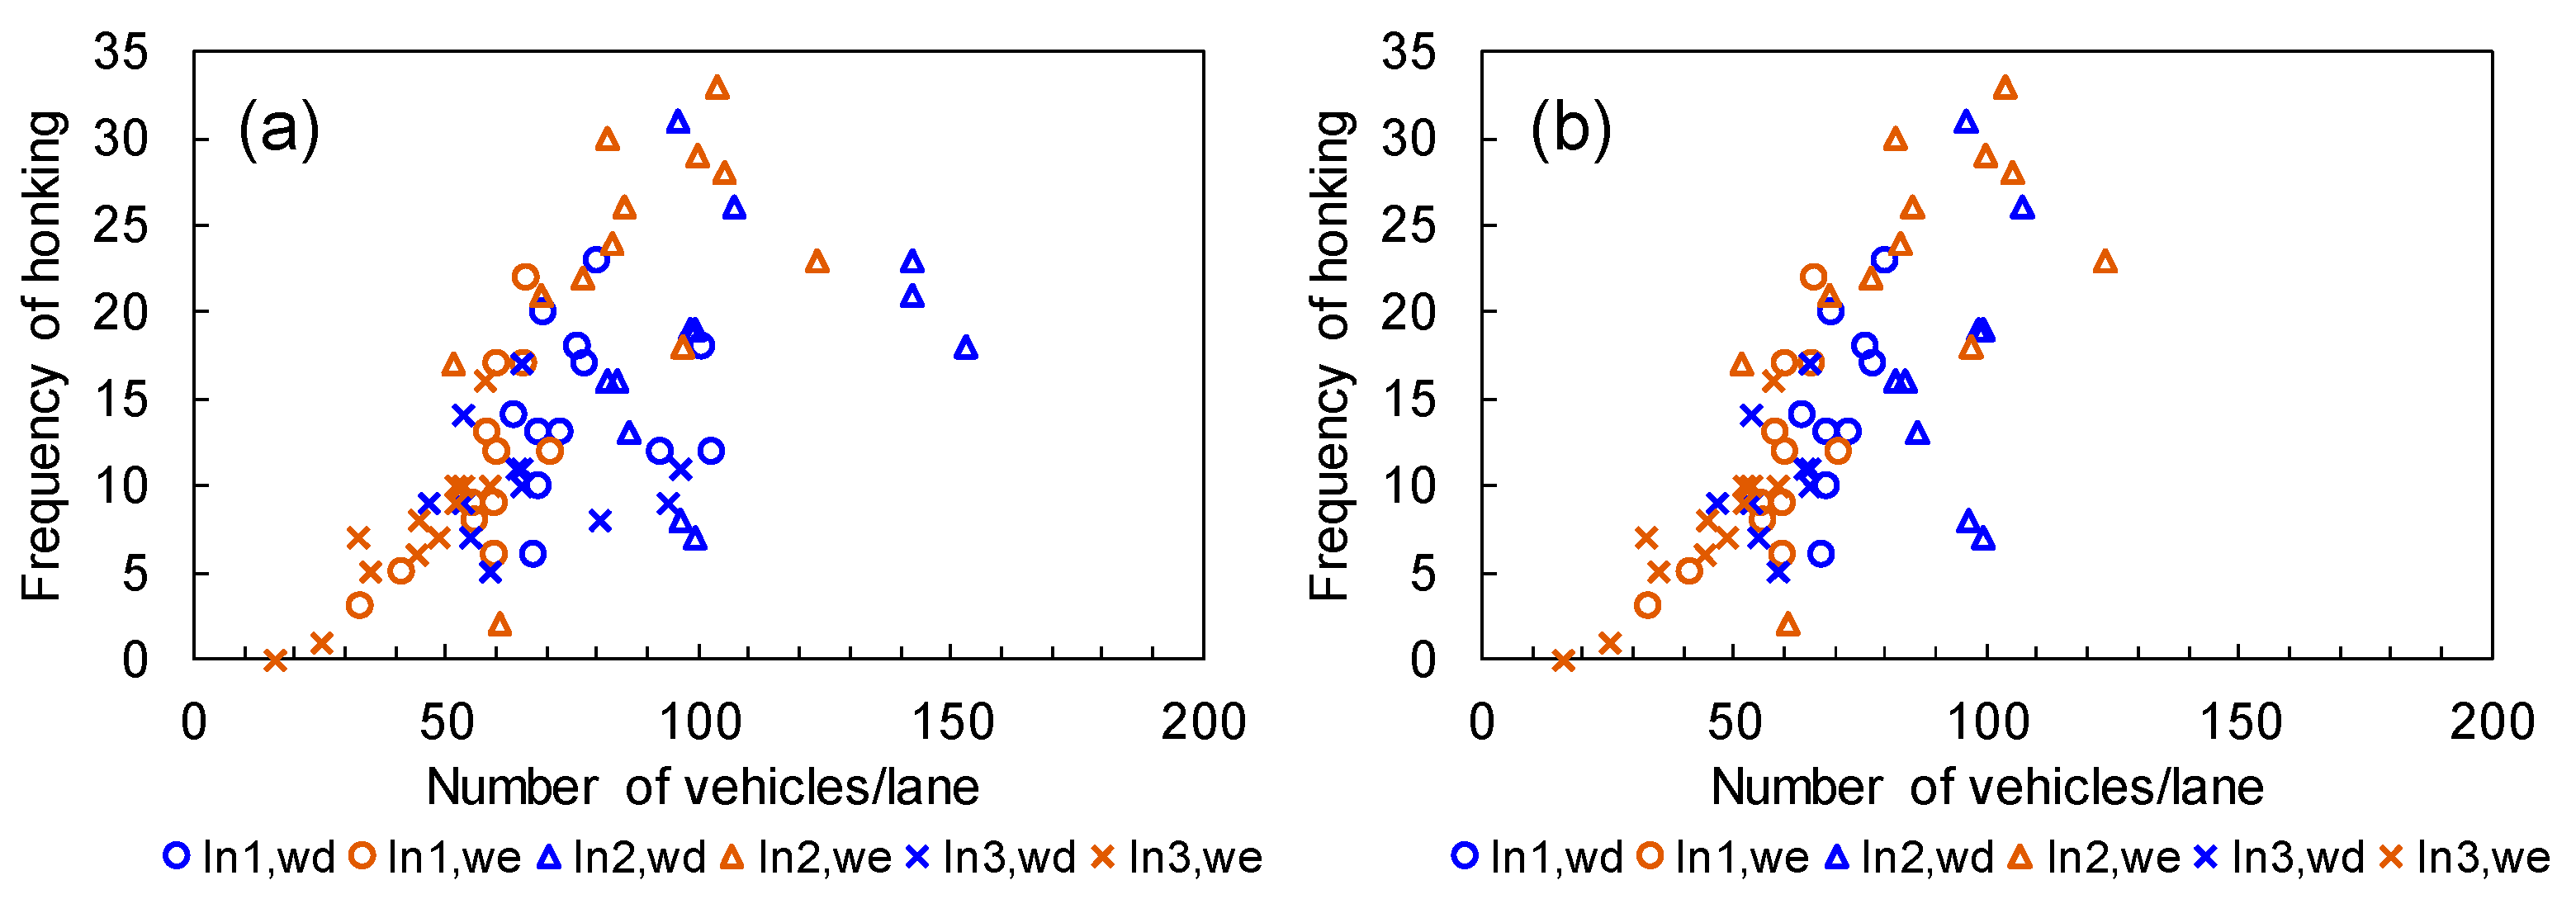
4.1. Relationship between Traffic Volume and Horn Honking
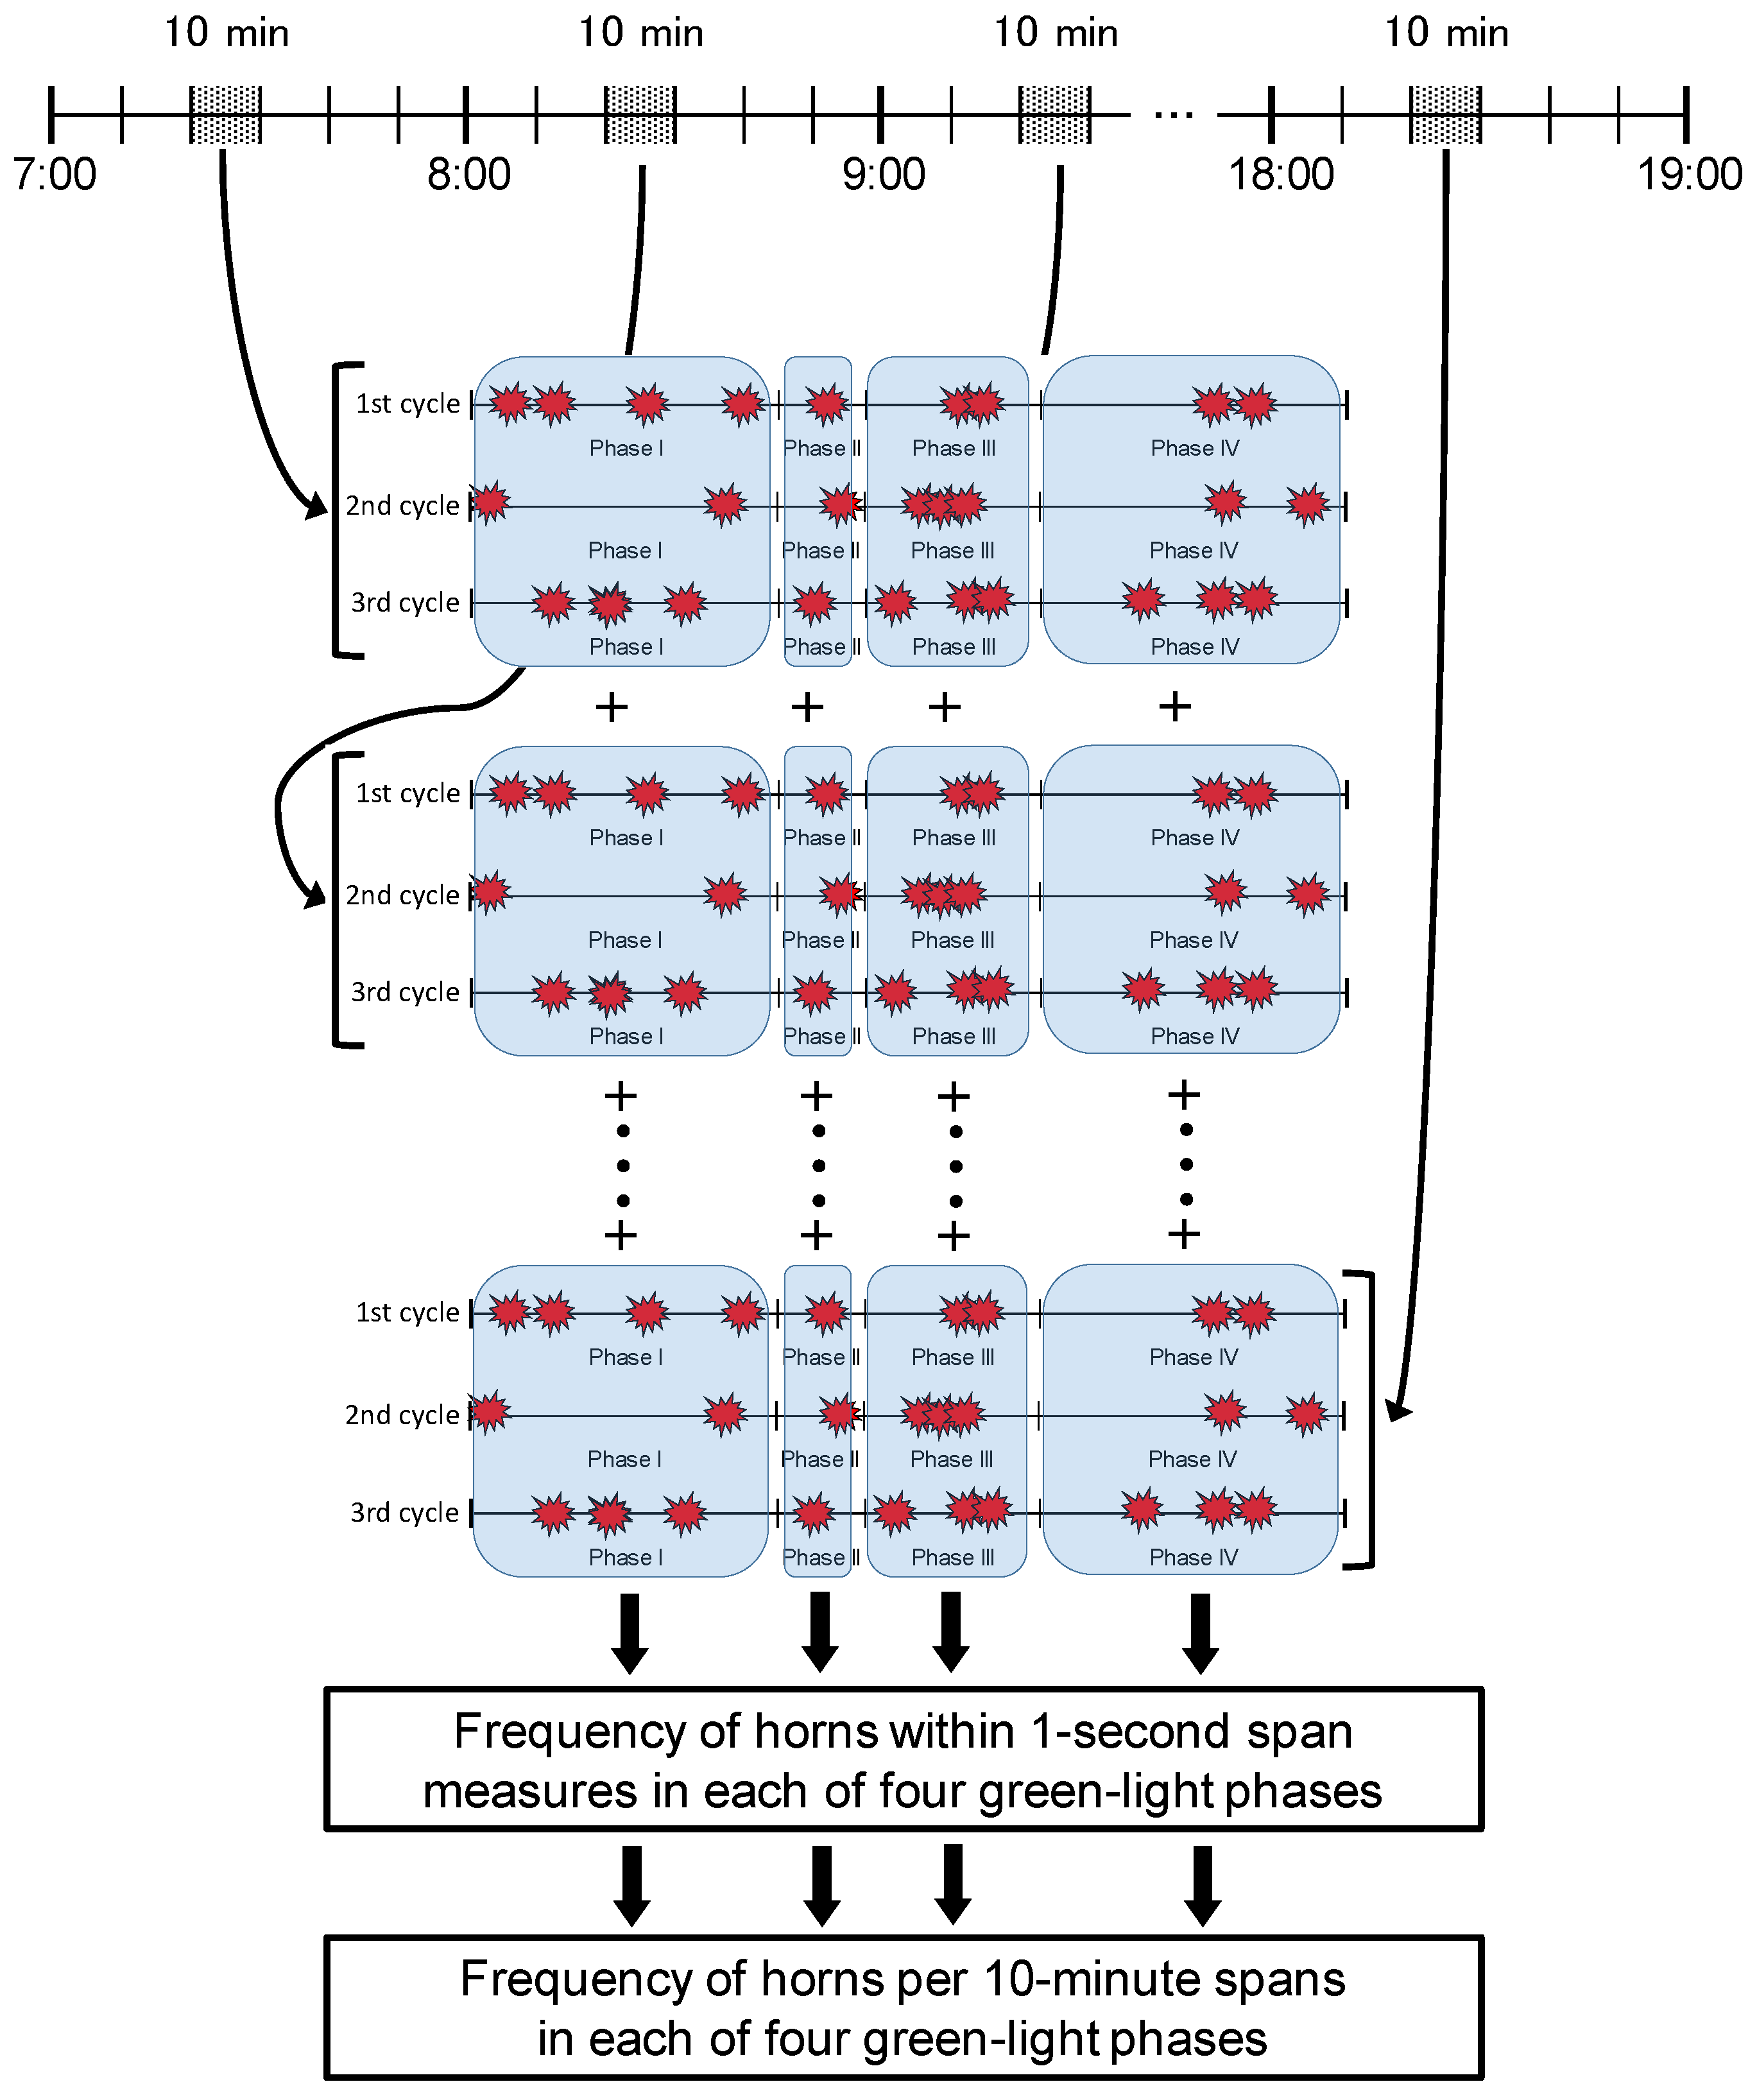
4.2. Horn Honking during Traffic Signal Cycles
4.3. Analysis of Causes of Horn Use in Green Light Phases When Left Turns Were Possible
4.4. Noise Level in Situations with and without Honking
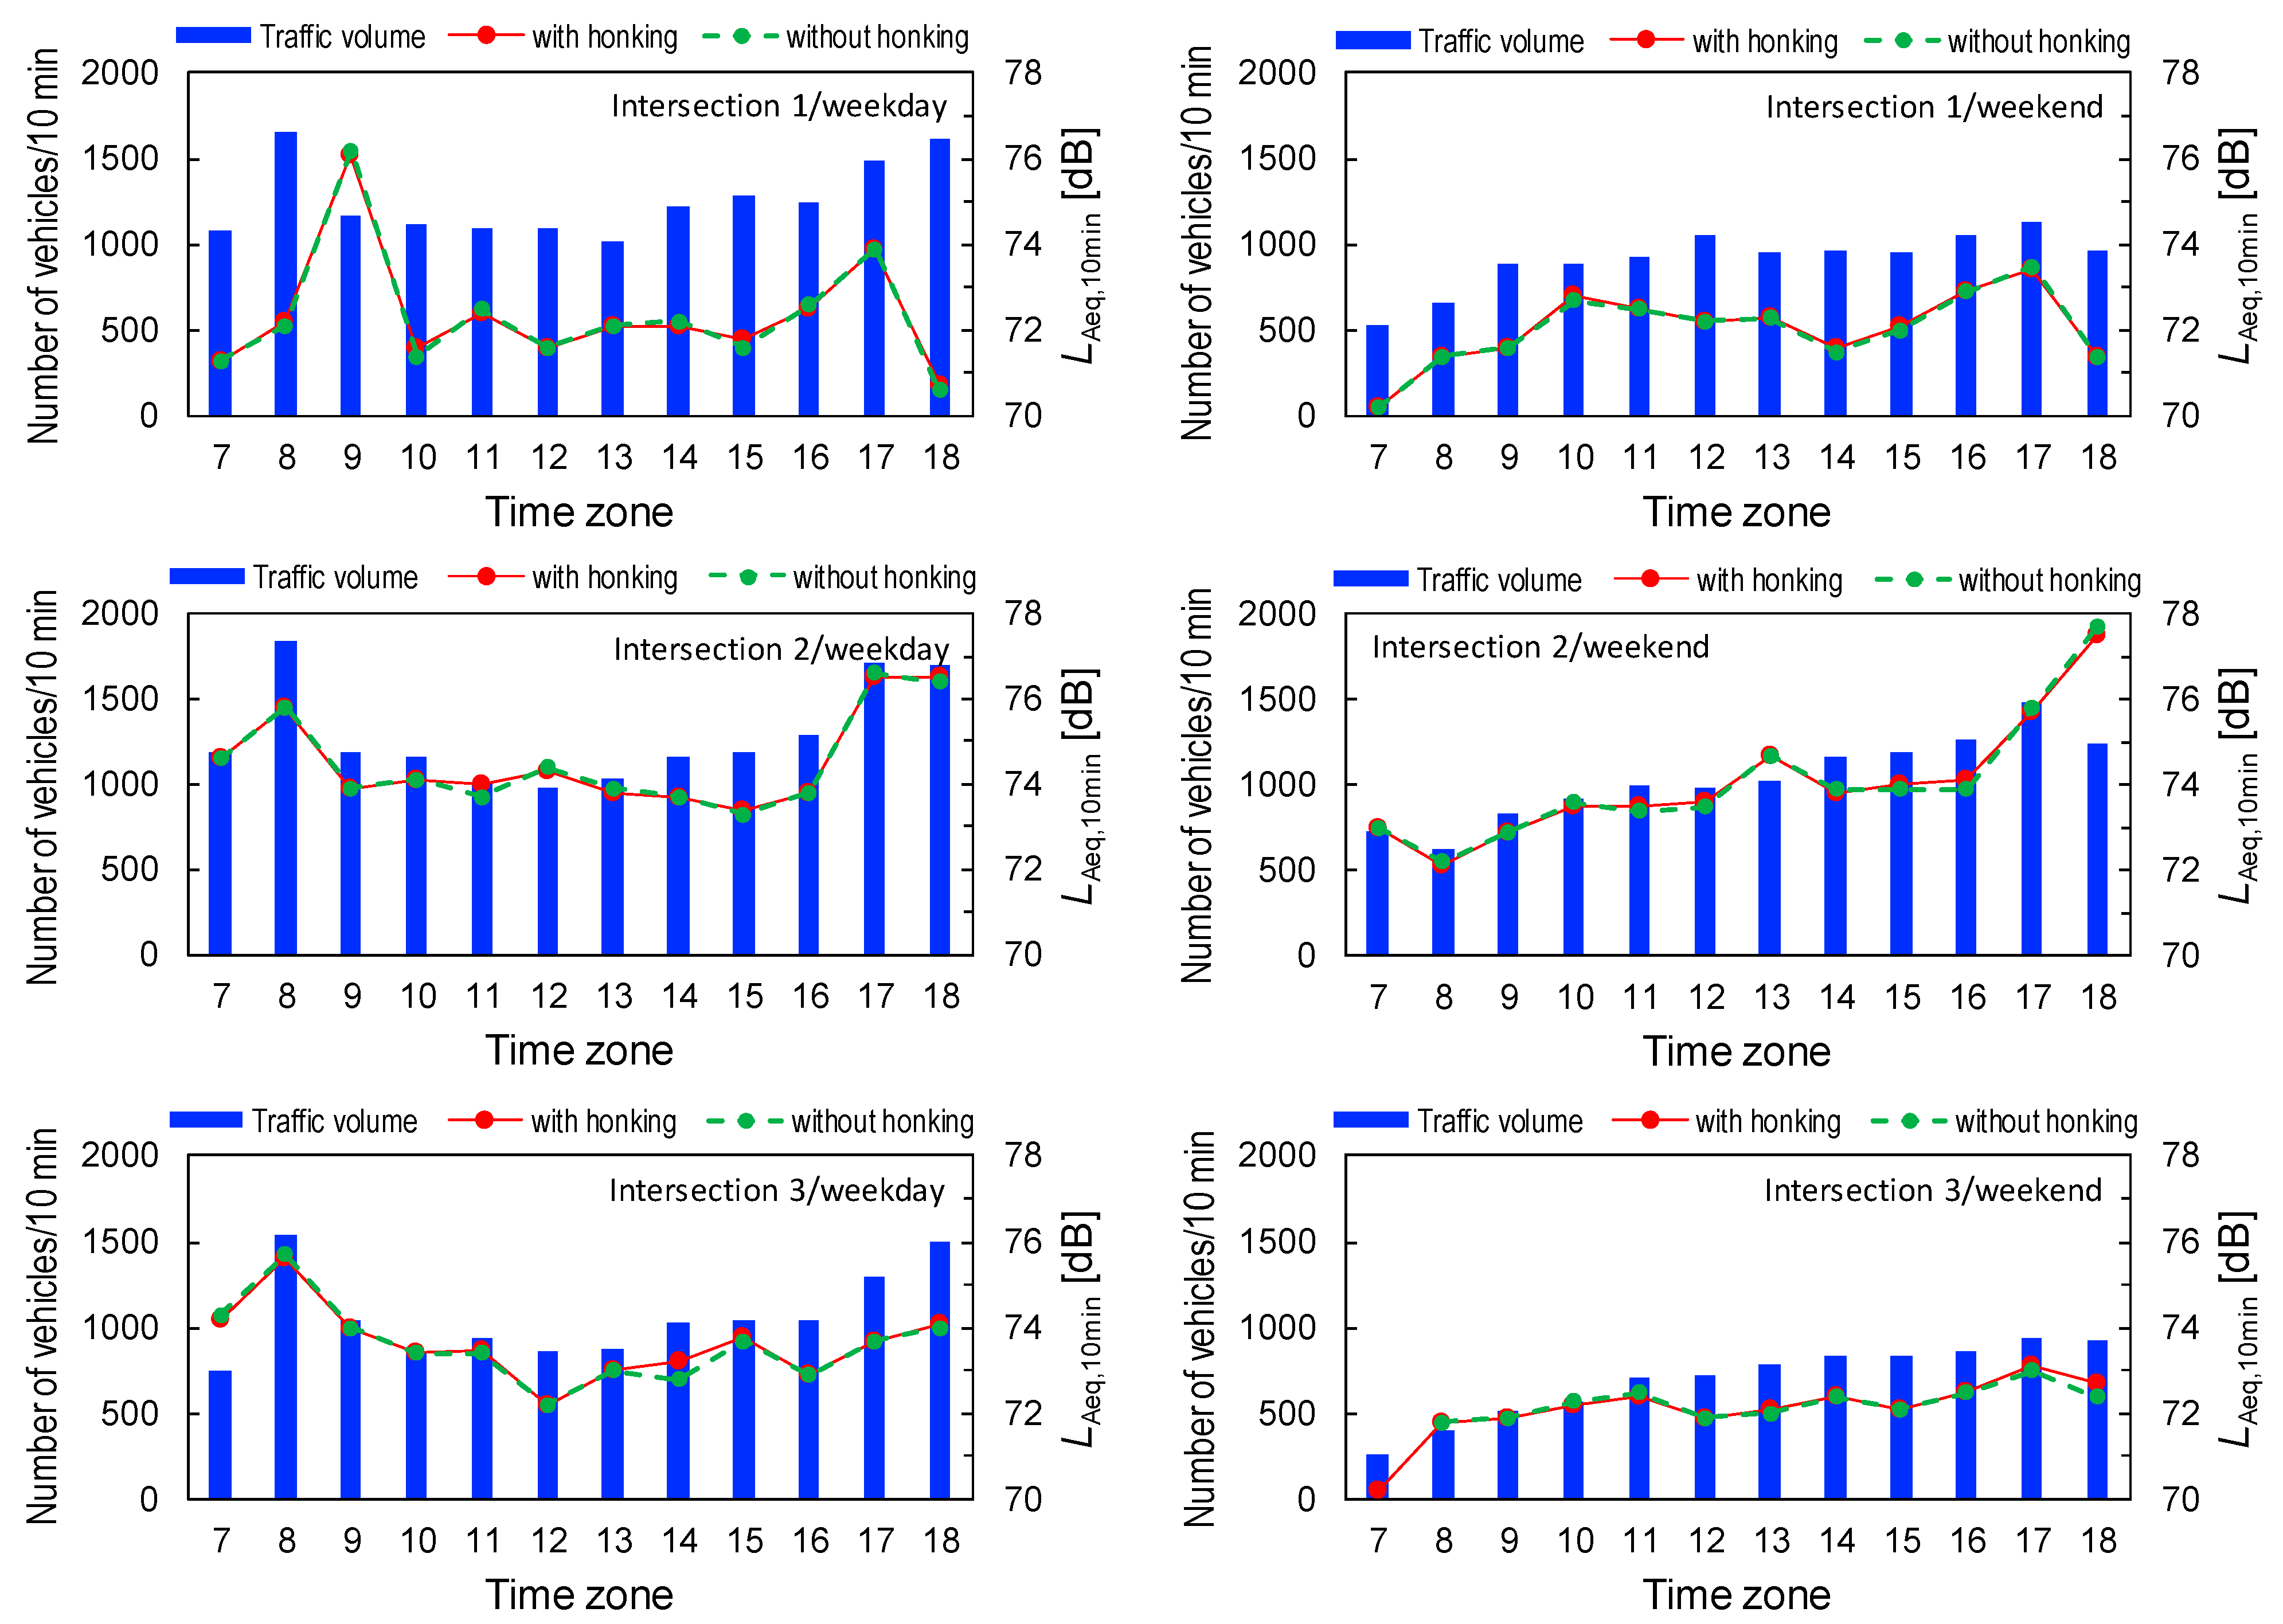
4.5. Relationship between Noise Level and the Traffic Environment
5. Discussion
5.1. Relationship between the Acoustic Environment around Intersections and Horn Honking and the Traffic Environment
5.2. Relationship between Horn Honking Use and Traffic Volume
5.3. Relationships between Driver Horn Use and Various Factors on Vehicular Environment
6. Conclusions
Author Contributions
Funding
Institutional Review Board Statement
Informed Consent Statement
Acknowledgments
Conflicts of Interest
References
- Kryter, K.D. The Handbook of Hearing and the Effects of Noise; Academic Press: San Diego, CA, USA, 1994. [Google Scholar]
- Luxon, L.M.; Prasher, D. (Eds.) Noise and Its Effects; John Wiley & Sons: Chichester, West Sussex, UK, 2007. [Google Scholar]
- Langdon, F.J. Noise nuisance caused by road traffic in residential areas, Part I. J. Sound Vib. 1976, 47, 243–263. [Google Scholar] [CrossRef]
- Langdon, F.J. Noise nuisance caused by road traffic in residential areas, Part II. J. Sound Vib. 1976, 47, 265–282. [Google Scholar] [CrossRef]
- Gambart, R.; Myncke, H.; Cops, A. Study of annoyance by traffic noise in Leuven (Belgium). Appl. Acoust. 1976, 9, 193–203. [Google Scholar] [CrossRef]
- Rylander, R.; Sörensen, S.; Kajland, A. Traffic noise exposure and annoyance reactions. J. Sound Vib. 1976, 47, 237–242. [Google Scholar] [CrossRef]
- Hall, F.L.; Tayler, S.M. Predicting community response to road traffic noise. J. Sound Vib. 1977, 52, 387–399. [Google Scholar] [CrossRef]
- Schultz, T.J. Synthesis of social surveys on noise annoyance. J. Acoust. Soc. Am. 1978, 64, 377–405. [Google Scholar] [CrossRef] [Green Version]
- Kryter, K.D. Community annoyance from aircraft and ground vehicle noise. J. Acoust. Soc. Am. 1982, 72, 1222–1242. [Google Scholar] [CrossRef]
- Miedema, H.M.E.; Vos, H. Exposure-response relationships for transportation noise. J. Acoust. Soc. Am. 1998, 104, 3432–3445. [Google Scholar] [CrossRef]
- Miedema, H.M.E.; Oudshoorn, C.G.M. Annoyance from transportation noise: Relationships with exposure metrics DNL and DENL and their confidence intervals. Environ. Health Perspect. 2001, 109, 409–416. [Google Scholar] [CrossRef]
- Ali, S.A.; Tamura, A. Road traffic noise mitigation strategies in Greater Cairo, Egypt. Appl. Acoust. 2002, 63, 1257–1265. [Google Scholar] [CrossRef]
- Martín, M.A.; Tarrero, A.; González, J.; Machimbarrena, M. Exposure–effect relationships between road traffic noise annoyance and noise cost valuations in Valladolid, Spain. Appl. Acoust. 2006, 67, 945–958. [Google Scholar] [CrossRef]
- Phan, H.Y.T.; Yano, T.; Phan, H.A.T.; Nishimura, T.; Sato, T.; Hashimoto, Y. Community responses to road traffic noise in Hanoi and Ho Chi Minh City. Appl. Acoust. 2010, 71, 107–114. [Google Scholar] [CrossRef]
- Brown, A.L.; Lam, K.C.; van Kamp, I. Quantification of the exposure and effects of road traffic noise in a dense Asian city: A comparison with western cities. Environ. Health 2015, 14, 22. [Google Scholar] [CrossRef] [PubMed] [Green Version]
- Vallet, M.; Gagneux, J.M.; Blanchet, V.; Favre, B.; Labiale, G. Long term sleep disturbance due to traffic noise. J. Sound Vib. 1983, 90, 173–191. [Google Scholar] [CrossRef]
- Öhrström, E.; Skånberg, A. Sleep disturbances from road traffic and ventilation noise—Laboratory and field experiments. J. Sound Vib. 2004, 271, 279–296. [Google Scholar] [CrossRef]
- Öhrström, E.; Skånberg, A. Longitudinal surveys on effects of road traffic noise: Substudy on sleep assessed by wrist actigraphs and sleep logs. J. Sound Vib. 2004, 272, 1097–1109. [Google Scholar] [CrossRef]
- Öhrström, E. Longitudinal surveys on effects of changes in road traffic noise: Effects on sleep assessed by general questionnaires and 3-day sleep logs. J. Sound Vib. 2004, 276, 713–727. [Google Scholar] [CrossRef]
- Griefahn, B.; Marks, A.; Robens, S. Noise emitted from road, rail and air traffic and their effects on sleep. J. Sound Vib. 2006, 295, 129–140. [Google Scholar] [CrossRef]
- Hong, J.; Kim, J.; Lim, C.; Kim, K.; Lee, S. The effects of long-term exposure to railway and road traffic noise on subjective sleep disturbance. J. Acoust. Soc. Am. 2010, 128, 2829–2835. [Google Scholar] [CrossRef] [Green Version]
- Ristovska, G.; Lekaviciute, J. Environmental noise and sleep disturbance: Research in Central, Eastern and South-Eastern Europe and Newly Independent States. Noise Health 2013, 15, 6–11. [Google Scholar] [CrossRef]
- Regecová, V.; Kellerová, E. Effects of urban noise pollution on blood pressure and heart rate in preschool children. J. Hypertens. 1995, 13, 405–412. [Google Scholar] [CrossRef] [PubMed]
- Babisch, W.; Fromme, H.; Beyer, A.; Ising, H. Elevated catecholamine levels in urine in traffic noise exposed subjects. Proc. Inter. Noise 96 1996, 2153–2158. [Google Scholar]
- Babisch, W. The NaRoMI-Study: Executive summary—Traffic noise. In Chronic Noise as a Risk Factor for Myocardial Infarction, The NaRoMI Study; Umweltbundesamt: Berlin, Germany, 2004; pp. I-1–I-59. [Google Scholar]
- Sørensen, M.; Andersen, Z.J.; Nordsborg, R.B.; Jensen, S.S.; Lillelund, K.G.; Beelen, R.; Schmidt, E.B.; Tjønneland, A.; Overvad, K.; Raaschou-Nielsen, O. Road traffic noise and incident myocardial infarction: A prospective cohort study. PLoS ONE 2012, 7, e39283. [Google Scholar] [CrossRef] [PubMed]
- Basner, M.; Babisch, W.; Davis, A.; Brink, M.; Clark, C.; Janssen, S.; Stansfeld, S. Auditory and non-auditory effects of noise on health. Lancet 2014, 383, 1325–1332. [Google Scholar] [CrossRef] [Green Version]
- Phan, H.Y.T.; Yano, T.; Sato, T.; Nishimura, T. Characteristics of road traffic noise in Hanoi and Ho Chi Minh City, Vietnam. Appl. Acoust. 2010, 71, 479–485. [Google Scholar] [CrossRef]
- Aditya, K.; Chowdary, V. Influence of honking on the road traffic noise generated at urban rotaries for heterogeneous traffic. Environ. Clim. Technol. 2020, 24, 23–42. [Google Scholar] [CrossRef] [Green Version]
- Vijay, R.; Sharma, A.; Chakrabarti, T.; Gupta, R. Assessment of honking impact on traffic noise in urban traffic environment of Nagpur, India. J. Environ. Health Sci. Eng. 2015, 13, 10. [Google Scholar] [CrossRef] [Green Version]
- Nassiri, P.; Dehrashid, S.A.; Hashemi, M.; Shalkouhi, P.J. Traffic noise prediction and the influence of vehicle horn noise. J. Low Freq. Noise Vib. Act. Control. 2013, 32, 285–292. [Google Scholar] [CrossRef]
- Ministry of Land, Infrastructure, Transport and Tourism. Road Traffic Act; Japanese Law Translation; Ministry of Justice: Tokyo, Japan, 2021; Chapter 3.
- Economic and Social Council of United Nations. Proposal for Amendments to Regulation No. 28; ECE/TRANS/WP.29/GRB/2014/4; The International Organization of Motor Vehicle Manufacturers (OICA): Paris, France, 2014.
- Hustim, M.; Fujimoto, K. Road traffic noise reduction using TDM-TMS strategies in Makassar city, Indonesia. J. Environ. Eng. (Trans. AIJ) 2013, 78, 551–559. [Google Scholar] [CrossRef] [Green Version]
- Shinar, D. Aggressive driving: The contribution of the drivers and the situation. Transp. Res. Part. F 1998, 1, 137–160. [Google Scholar] [CrossRef]
- Lajunen, T.; Parker, D.; Summala, H. The Manchester Driver Behaviour Questionnaire: A cross-cultural study. Accid. Anal. Prev. 2004, 36, 231–238. [Google Scholar] [CrossRef]
- Fujii, S. Social psychological approach of travel behavior. In Modeling of Travel Behavior; Kitamura, R., Morikawa, T., Eds.; Gihodo Shuppan: Tokyo, Japan, 2002. (In Japanese) [Google Scholar]
- Takada, M.; Suzuki, S.; Kim, K.H.; Shin, J.H.; Iwamiya, S. Driver’s vehicle horn and its effects on other drivers and pedestrians: A case study in South Korea. Mech. Eng. J. 2017, 4, 16–00433. [Google Scholar] [CrossRef] [Green Version]
- Takada, M.; Fukuda, Y.; Iwamiya, S. Questionnaire survey on vehicle horn use and its effects on drivers and pedestrians. Acoust. Sci. Technol. 2013, 34, 187–196. [Google Scholar] [CrossRef] [Green Version]
- Tsunekawa, S.; Hashimoto, K.; Inada, T.; Takada, M.; Oeda, Y.; Yamauchi, K.; Kim, K.H.; Iwamiya, S. Survey on vehicle horn use at intersections in Taipei City, Taiwan. In Proceedings of the INTER-NOISE and NOISE-CON Congress and Conference Proceedings, InterNoise 18, Chicago, IL, USA, 26–29 August 2018; pp. 3170–3181. [Google Scholar]
- Takada, M.; Tsunekawa, S.; Hashimoto, K.; Inada, T.; Oeda, Y.; Yamauchi, K.; Kim, K.H.; Iwamiya, S.I. Analysis of vehicle horn use and factors at intersections in an urban area of Taiwan. In Proceedings of the 23rd International Congress on Acoustics: Integrating 4th EAA Euroregio, Aachen, Germany, 9–13 September 2019; pp. 7188–7195. [Google Scholar]
- Yoshii, T.; Shimoi, Y.; Kitamura, R. Capacity analysis of mixed traffic flow with motorcycles. Int. Assoc. Traffic Saf. Sci. 2004, 29, 178–187. [Google Scholar]
- Ministry of Transportation and Communications. Road Traffic Safety Regulations; Laws and Regulations Database of the Republic of China (Taiwan): Taipei, Taiwan, 2021; Chapter 4. (In Chinese)
- Kalaiselvi, R.; Ramachandraiah, A. Honking noise corrections for traffic noise prediction models in heterogeneous traffic conditions like India. Appl. Acoust. 2016, 111, 25–38. [Google Scholar] [CrossRef]
- Lee, E.Y.; Jerrett, M.; Ross, Z.; Coogan, P.F.; Seto, E.Y.W. Assessment of traffic-related noise in three cities in the United States. Environ. Res. 2014, 132, 182–189. [Google Scholar] [CrossRef] [Green Version]
- Inoue, D.; Okada, A.; Matsumori, T.; Aihara, K.; Yoshida, H. Traffic signal optimization on a square lattice with quantum annealing. Sci. Rep. 2021, 11, 3303. [Google Scholar] [CrossRef]
- Gu, J.; Lee, M.; Jun, C.; Han, Y.; Kim, Y.; Kim, J. Traffic signal optimization for multiple intersections based on reinforcement learning. Appl. Sci. 2021, 11, 10688. [Google Scholar] [CrossRef]


| The Number of Lanes at an Entrance (Lanes Exclusive to Left Turns)/Lanes at an Exit | ||||
|---|---|---|---|---|
| North | South | West | East | |
| Intersection 1 | 5(1)/4 | 5(2)/4 | 4(2)/3 | 3(0)/3 |
| Intersection 2 | 5(1)/4 | 3(1)/2 | 2(0)/2 | 2(1)/2 |
| Intersection 3 | 4(1)/4 | 6(1)/4 | 3(1)/3 | 3(1)/3 |
| Green Light Duration on Weekdays (S)/on Weekends (S) | Traffic Signal Cycle Duration (S) | |||||
|---|---|---|---|---|---|---|
| Phase I | Phase II | Phase III | Phase IV | Weekday | Weekend | |
| Int. 1 | 35–45/36–45 | 41–46/29–37 | 72/41–47 | 42–47/30–38 | 200 | 150 |
| Int. 2 | 70–75/74–84 | 11–15/15 | 43–48/40 | 62–69/61–71 | 200 | 200 |
| Int. 3 | 15/15 | 65–85/45–55 | 70–85/50–60 | 30–35/25–30 | 200 | 150 |
| Min.–Max. (Number of Vehicles per 10 min) | ||
|---|---|---|
| Weekday | Weekend | |
| Intersection 1 | 1020–1648 | 531–1135 |
| Intersection 2 | 986–1839 | 621–1480 |
| Intersection 3 | 747–1541 | 263–944 |
| Time Zone | 7 | 8 | 9 | 10 | 11 | 12 | 13 | 14 | 15 | 16 | 17 | 18 | ||
|---|---|---|---|---|---|---|---|---|---|---|---|---|---|---|
| Int. 1 | Week-day | Motorcycle | 470 | 790 | 410 | 374 | 357 | 366 | 334 | 400 | 439 | 448 | 638 | 733 |
| Standard | 509 | 726 | 618 | 615 | 619 | 635 | 592 | 700 | 727 | 706 | 743 | 792 | ||
| Large | 97 | 132 | 139 | 124 | 121 | 94 | 94 | 120 | 116 | 86 | 103 | 89 | ||
| Week-end | Motorcycle | 235 | 223 | 283 | 238 | 252 | 296 | 287 | 278 | 286 | 352 | 416 | 298 | |
| Standard | 224 | 346 | 508 | 543 | 589 | 655 | 599 | 605 | 574 | 619 | 646 | 589 | ||
| Large | 72 | 92 | 95 | 111 | 89 | 99 | 70 | 81 | 95 | 83 | 73 | 79 | ||
| Int. 2 | Week-day | Motorcycle | 950 | 1498 | 822 | 777 | 611 | 600 | 625 | 700 | 699 | 846 | 1306 | 1285 |
| Standard | 194 | 288 | 328 | 340 | 360 | 347 | 383 | 424 | 443 | 403 | 359 | 378 | ||
| Large | 48 | 53 | 40 | 38 | 36 | 39 | 29 | 30 | 41 | 34 | 45 | 43 | ||
| Week-end | Motorcycle | 580 | 408 | 558 | 594 | 582 | 601 | 641 | 691 | 716 | 787 | 1033 | 828 | |
| Standard | 119 | 174 | 220 | 289 | 278 | 342 | 344 | 442 | 438 | 444 | 408 | 393 | ||
| Large | 30 | 39 | 47 | 40 | 36 | 38 | 42 | 32 | 42 | 32 | 39 | 36 | ||
| Int. 3 | Week-day | Motorcycle | 484 | 1062 | 572 | 432 | 443 | 382 | 403 | 505 | 516 | 531 | 798 | 964 |
| Standard | 208 | 420 | 407 | 371 | 445 | 425 | 417 | 475 | 467 | 453 | 435 | 485 | ||
| Large | 55 | 59 | 61 | 50 | 54 | 51 | 59 | 49 | 55 | 58 | 58 | 56 | ||
| Week-end | Motorcycle | 159 | 230 | 293 | 275 | 310 | 334 | 362 | 375 | 355 | 385 | 488 | 458 | |
| Standard | 77 | 135 | 190 | 247 | 348 | 339 | 374 | 407 | 424 | 407 | 402 | 417 | ||
| Large | 27 | 40 | 39 | 43 | 48 | 47 | 45 | 51 | 57 | 65 | 54 | 49 |
| Types of Vehicles | Weekday | Weekend | |
|---|---|---|---|
| Intersection 1 | Motorcycle | −0.08 | 0.53 |
| Standard | 0.54 | 0.72 ** | |
| Large | 0.13 | −0.04 | |
| Intersection 2 | Motorcycle | 0.13 | 0.38 |
| Standard | 0.65 * | 0.72 ** | |
| Large | −0.27 | 0.08 | |
| Intersection 3 | Motorcycle | 0.00 | 0.90 ** |
| Standard | 0.09 | 0.85 ** | |
| Large | −0.22 | 0.70 ** |
| Phase I | Phase II | Phase III | Phase IV | ||
|---|---|---|---|---|---|
| Intersection 1 | Weekday | 48 | 56 | 37 | 35 |
| Weekend | 47 | 39 | 19 | 28 | |
| Total | 95 | 95 | 56 | 63 | |
| Intersection 2 | Weekday | 64 | 16 | 74 | 77 |
| Weekend | 50 | 26 | 66 | 131 | |
| Total | 114 | 42 | 140 | 208 | |
| Intersection 3 | Weekday | 10 | 47 | 36 | 28 |
| Weekend | 13 | 29 | 31 | 16 | |
| Total | 23 | 76 | 67 | 44 |
| Phase I | Phase II | Phase III | Phase IV | |
|---|---|---|---|---|
| Intersection 1 | 17 | 19 | 7 | 12 |
| Intersection 2 | 13 | 25 | 27 | 25 |
| Intersection 3 | 11 | 9 | 7 | 11 |
| Types of Situations When Horns Were Used | Without Honking | |||||
|---|---|---|---|---|---|---|
| (1) Cutting In Line | (2) Slowness | (3) Sudden Stop | (4) Stopping State (Delay) | (5) Unclear | ||
| Intersection 1 | 10 | 4 | 3 | 27 | 55 | 117 |
| Intersection 2 | 2 | 3 | 1 | 24 | 14 | 34 |
| Intersection 3 | 2 | 6 | 0 | 6 | 29 | 95 |
| Number of Situations | Mean Start Delay Time (S) | p-Value | ||
|---|---|---|---|---|
| Intersection 1 | With honking | 27 | 4.6 | p < 0.01 |
| Without honking | 117 | 2.2 | ||
| Intersection 2 | With honking | 24 | 6.2 | p < 0.01 |
| Without honking | 34 | 2.0 | ||
| Intersection 3 | With honking | 6 | 4.2 | p < 0.01 |
| Without honking | 95 | 2.1 | ||
| All intersections | With honking | 57 | 5.2 | p < 0.01 |
| Without honking | 246 | 2.2 |
| Independent Variables | Standardized Partial Regression Coefficient | p Value |
|---|---|---|
| Traffic volume of motorcycles | 0.670 | <0.001 |
| Traffic volume of standard-sized vehicles | −0.095 | 0.518 |
| Traffic volume of large-sized vehicles | −0.030 | 0.827 |
| Total number of exiting lanes | 0.022 | 0.883 |
| Honking frequency | 0.201 | 0.109 |
| Independent Variables | Standardized Partial Regression Coefficient | p Value |
|---|---|---|
| Traffic volume of motorcycles | 0.221 | 0.118 |
| Traffic volume of standard-sized vehicles | −0.303 | 0.144 |
| Traffic volume of large-sized vehicles | 0.301 | 0.117 |
| Total number of exiting lanes | 0.144 | 0.494 |
| Honking frequency | 0.542 | 0.003 |
Publisher’s Note: MDPI stays neutral with regard to jurisdictional claims in published maps and institutional affiliations. |
© 2022 by the authors. Licensee MDPI, Basel, Switzerland. This article is an open access article distributed under the terms and conditions of the Creative Commons Attribution (CC BY) license (https://creativecommons.org/licenses/by/4.0/).
Share and Cite
Takada, M.; Tsunekawa, S.; Hashimoto, K.; Inada, T.; Kim, K.-H.; Oeda, Y.; Yamauchi, K.; Iwamiya, S.-i. Analysis of the Effects and Causes of Driver Horn Use on the Acoustic Environment at Urban Intersections in Taiwan. Appl. Sci. 2022, 12, 5917. https://doi.org/10.3390/app12125917
Takada M, Tsunekawa S, Hashimoto K, Inada T, Kim K-H, Oeda Y, Yamauchi K, Iwamiya S-i. Analysis of the Effects and Causes of Driver Horn Use on the Acoustic Environment at Urban Intersections in Taiwan. Applied Sciences. 2022; 12(12):5917. https://doi.org/10.3390/app12125917
Chicago/Turabian StyleTakada, Masayuki, Shoki Tsunekawa, Kazuma Hashimoto, Tamaki Inada, Ki-Hong Kim, Yoshinao Oeda, Katsuya Yamauchi, and Shin-ichiro Iwamiya. 2022. "Analysis of the Effects and Causes of Driver Horn Use on the Acoustic Environment at Urban Intersections in Taiwan" Applied Sciences 12, no. 12: 5917. https://doi.org/10.3390/app12125917
APA StyleTakada, M., Tsunekawa, S., Hashimoto, K., Inada, T., Kim, K.-H., Oeda, Y., Yamauchi, K., & Iwamiya, S.-i. (2022). Analysis of the Effects and Causes of Driver Horn Use on the Acoustic Environment at Urban Intersections in Taiwan. Applied Sciences, 12(12), 5917. https://doi.org/10.3390/app12125917