Article

Study on the Microwave Ablation Effect of Inflated Porcine Lung

Faculty of Environment and Life, Beijing International Science and Technology Cooperation Base for Intelligent Physiological Measurement and Clinical Transformation, Beijing University of Technology, Beijing 100124, China
*
Author to whom correspondence should be addressed.
Appl. Sci. 2022, 12(12), 5916; https://doi.org/10.3390/app12125916
Submission received: 29 April 2022 / Revised: 4 June 2022 / Accepted: 8 June 2022 / Published: 10 June 2022
(This article belongs to the Section Biomedical Engineering)

Abstract

:
(1) Background: Microwave ablation (MWA) has an efficient killing effect on primary and metastatic lung cancer. However, the treatment effect will be affected by the air in the lung, which makes it very difficult to accurately predict and control the ablation area; (2) Methods: In this paper, in vitro experiments combined with simulations are used to study the microwave ablation area of inflated porcine lung. The in vitro experiment is divided into inflated group and deflated group, combined with different ablation power (40 W, 50 W, 60 W) and ablation time (100 s, 200 s, 300 s) for experiment, each power and time combination are repeated five times. A total of 90 ablation experiments were performed. The simulation experiment uses COMSOL Multiphysics software to simulate the microwave ablation area of the inflated lung; (3) Results and Conclusions: When the ablation power is 40 W, 50 W, and 60 W, the average long diameter of the deflated group are 20.8–30.9%, 7.6–22.6%, 10.4–19.8% larger than those of the inflated group, respectively; the average short diameter of the deflated group is 24.5–41.4%, 31.6–45.7%, 27.3–42.9% larger than that of the inflated group. The results show that the ablation area of inflated lung is smaller than deflated lung, which is mainly due to the smaller ablation short diameter.

1. Introduction

Lung cancer is one of the greatest threats to human health and life. About 2.1 million of the total diagnosed lung cancer patients worldwide are diagnosed annually, and the highest incidence rate of malignancies in the world [1]. Surgical resection is the main treatment for primary lung cancer, but only one-third of patients are suitable for surgery. For non-surgical lung cancer patients, thermal ablation has become an important and effective treatment option [2,3,4,5].
In recent years, thermal ablation has become one of the treatment methods for unresectable primary and secondary tumors [6]. According to different ablation principles, thermal ablation is mainly divided into microwave ablation (MWA), radio frequency ablation (RFA), high intensity focused ultrasound (HIFU) and laser ablation (LA) [7]. As a local treatment, thermal ablation has a highly effective killing effect on primary and metastatic lung cancer, and has the advantages of less damage to surrounding normal tissues and rapid postoperative recovery [8,9].
At present, RFA is the most commonly used thermal ablation therapy for cancer. The advantage of RFA is its rich experience in clinical application. Since Dupuy et al. [10] reported three cases of lung cancer in 2000, this technique has been applied to lung cancer for about 20 years. However, this treatment method is easily affected by the heat sink effect of peripheral blood vessels and tissue carbonization, resulting in incomplete ablation. Therefore, it cannot achieve ideal therapeutic effect in the treatment of lung cancer [11,12].
MWA is one of the local minimally invasive treatment techniques for lung tumors, which has been developed in recent years. At present, microwave ablation has been widely used in parts of Western countries, mainly for the ablation of solid tumors of liver, spleen, lung, adrenal and other organs [13]. Due to its effectiveness in the treatment of solid organ tumors, the use of MWA in patients with primary or metastatic lung tumors is gradually increasing [14]. Compared with RFA, microwave ablation is not easy to be affected by heat sink effect, and can produce higher temperature and larger ablation area in a shorter time. Therefore, MWA is more suitable for the treatment of lung tumors, and has received more and more attention in clinical applications [15,16,17].
However, the current clinical microwave ablation lacks the best imaging guidance mode, and cannot monitor the size of the ablation area in real time. Therefore, microwave ablation may not be effective for some large or irregularly shaped tumors. Gao et al. [5] have carried out some in vitro experiments and simulation studies on microwave ablation of porcine lungs and established prediction models, but did not consider the effect of air in the lungs on the microwave ablation. In contrast with other solid organs, the lungs are filled with hot and humid air, which makes the lung tissue have a natural high impedance [18,19,20], which will affect the temperature distribution of the microwave ablation area and cause great difficulties in accurately predicting and controlling the microwave ablation area.
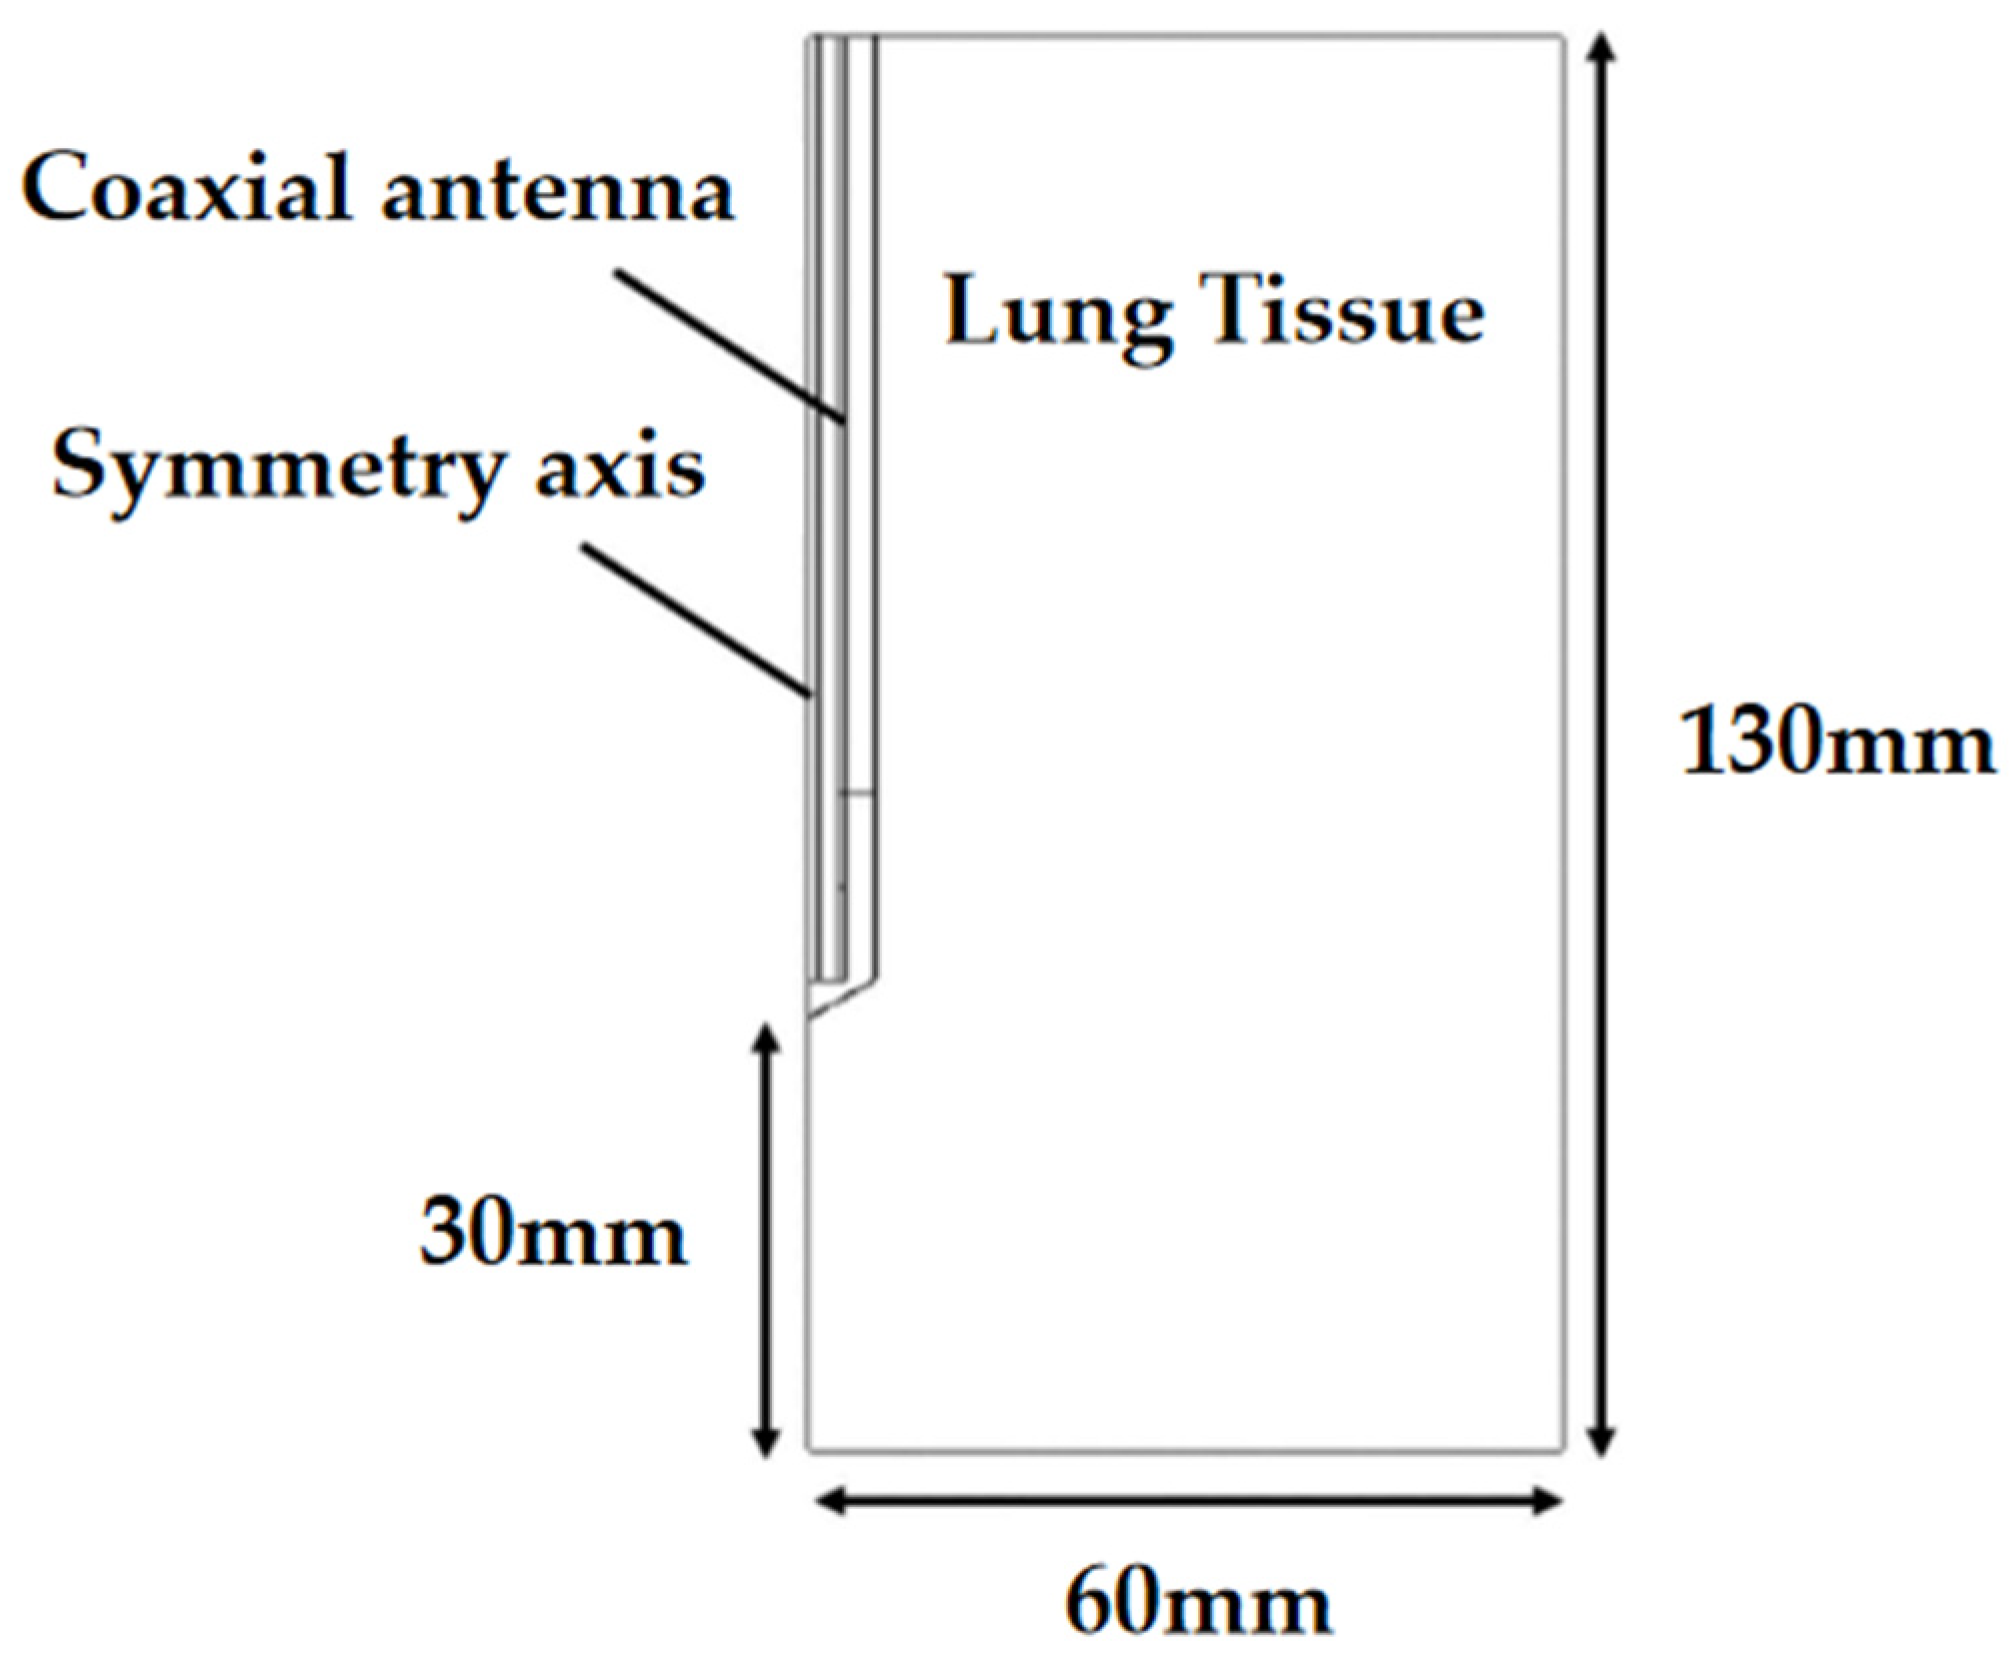
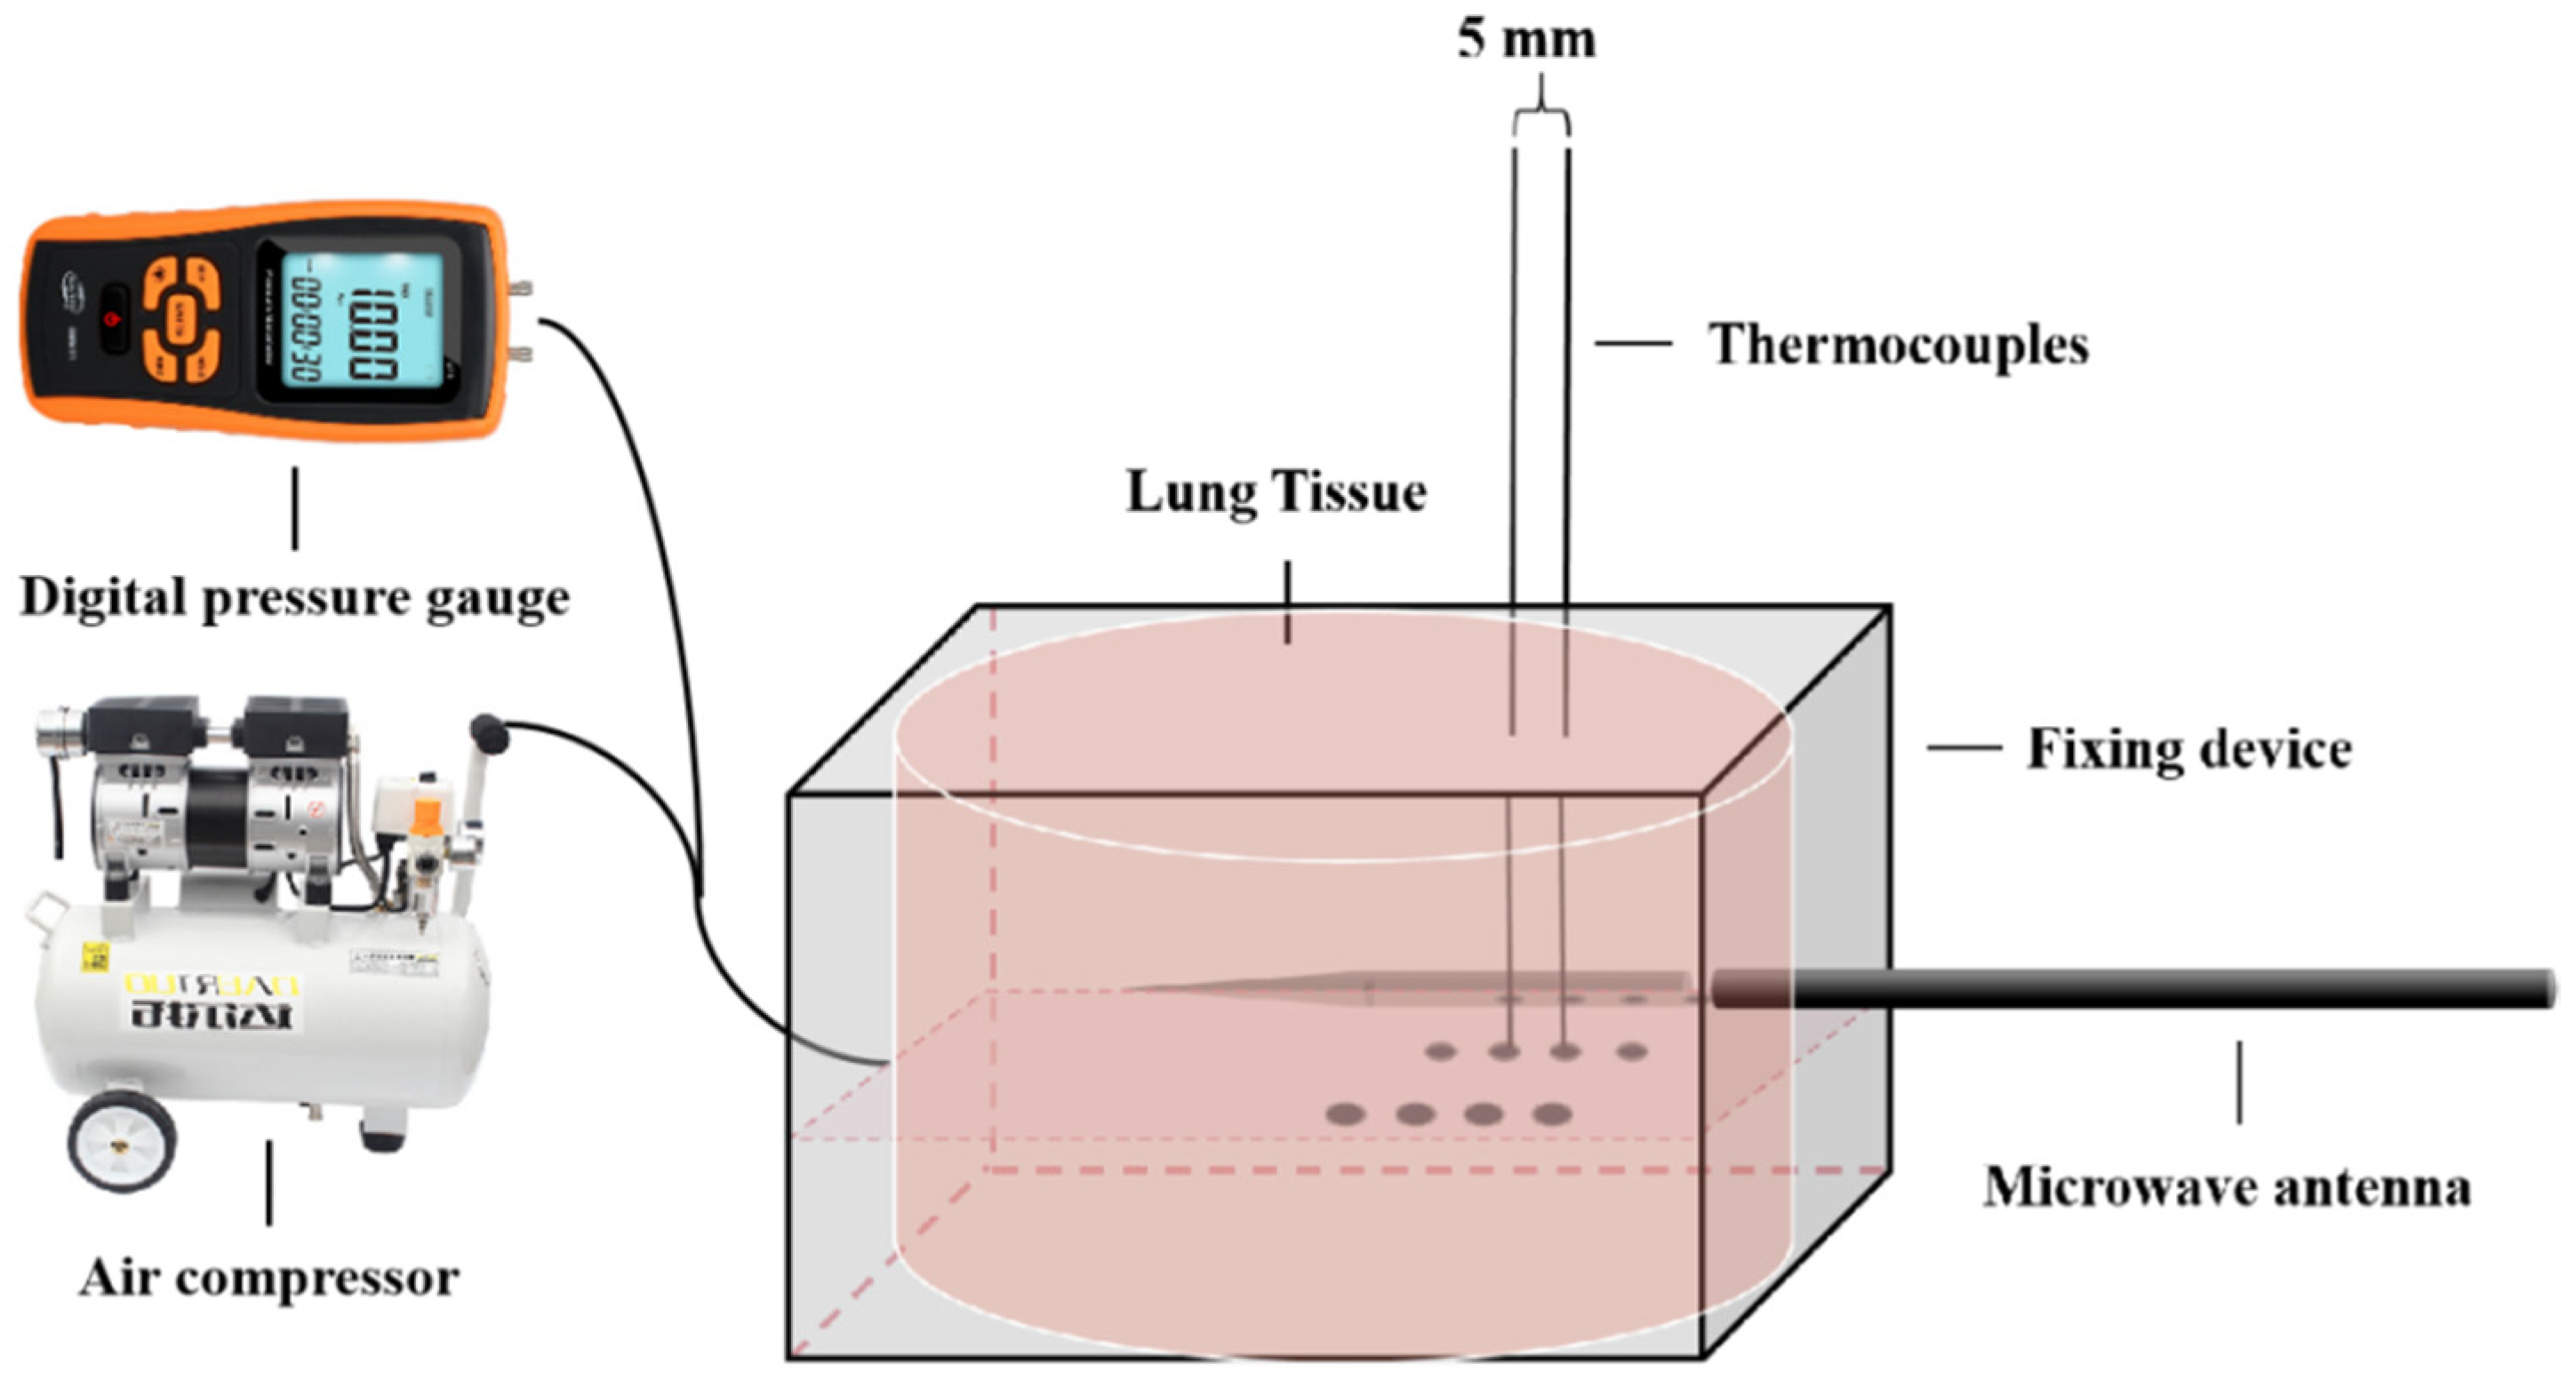
In this paper, in vitro experiments and simulations of microwave ablation of porcine lung were designed, and the two were verified by each other to determine the effect of microwave ablation in the inflated lung, and compared with the deflated lung.

2. Materials and Methods

2.1. Ex-Vivo Experiment

2.1.1. Experimental Grouping

The experiment was divided into two groups: inflated group and deflated group. Different ablation power (40 W, 50 W, 60 W) and ablation time (100 s, 200 s, 300 s) were used to conduct the experiment. Each power and time combination were repeated five times. A total of 90 ablation experiments were conducted.

2.1.2. Experimental Equipment

The microwave ablation system includes MTC-3 microwave ablation instrument, microwave operating frequency is 2450 MHz (When using a single insulated microwave antenna of 2450 MHz, the diameter of the ablation area and power deposition is greater than 915 MHz [21]), MTC-3CA-II7 water-cooled circulating microwave antenna (17 g in diameter and 180 mm in length) (produced by Nanjing Viking Kyushu Medical Instrument Co., Ltd., Nanjing, China), and is equipped with low loss coaxial cable transmission line with peristaltic pump to provide water-cooled circulation of microwave antenna. Table 1 describes the main performance parameters of the microwave ablation instrument.
The air compressor used in the inflation system is 380-4L silent oil-free air compressor produced by Daertuo company (Shanghai, China), which is used with GM510 high-precision handheld digital pressure gauge produced by Benetech company (Palo Alto, CA, USA), so as to control the inlet pressure of isolated pig lung.
The data acquisition instrument is the 34972A multipoint data acquisition instrument produced by Agilent. It is used with thermocouples with 1 mm diameter. The Agilent Benchlink Data Logger software (version 1.0, Agilent Technologies Co., Ltd., Beijing, China) is used to set the test parameters, collect and archive the measurement data, and display and analyze the input measurement data in real time.
During the experiment, the thermocouples was directly punctured into the ex-vivo inflatable pig lung, and the tip of the thermocouples and the microwave antenna were in the same horizontal plane. The distribution of temperature field during microwave ablation can be obtained by monitoring the data of thermocouples. The insertion direction of the microwave antenna is the Y-axis, and the thermocouples are evenly distributed on the right side of the microwave antenna at 5 mm intervals. In addition, a thermocouple is arranged at the emission point of the microwave antenna slot to obtain the highest temperature of the ablation area. The ablation length along the Y-axis is the long diameter (Dl) of ablation area, and the ablation length along the X-axis is the short diameter (Ds) of ablation area. The thermocouple distribution is shown in the Figure 1 and Figure 2.

2.1.3. Experimental Process

The experiment used fresh porcine lungs excised from the local slaughterhouse on the same day. Before the experiment, the lungs were placed in a constant temperature water bath to rewarm to 37 °C, and then the microwave antenna was connected to the water-cooling circulation system. The cable is connected to the antenna to provide microwave energy; the air compressor is connected to the main trachea of lungs, and the air pressure is monitored in real time with a hand-held digital pressure gauge; the thermocouple is used to collect temperature data in real time. During the experiment, the porcine lungs were inflated at a constant rate, and the air compressor provided air to the lungs at a constant rate of 3.0 L/min, and the lungs were inflated to an atmospheric pressure of 3.0 kpa to maintain a stable inflation state [22]. After the ablation was over, the microwave transmitter and air compressor were turned off, the data acquisition process was stopped, the temperature data was output to a file, and the thermocouple was pulled out. The pig lung was cut horizontally along the insertion direction of the microwave antenna, the long and short diameters of the carbonized area after ablation were measured, and the isoperimetric ratio of the ablation area was calculated [23]. In the microwave heating process, the data collected by the thermocouple is the voltage value of each temperature measurement point. The voltage value is converted into a temperature value through the corresponding formula, and the temperature data of each temperature measurement point is obtained. The relationship between temperature and time was plotted using Originlab software. The control variables were input microwave power (40 W, 50 W, 60 W) and ablation heating time (100 s, 200 s, 300 s). At the same time, a control group, namely the non-pneumatic group, was set up for lung ablation.

2.2. Finite Element Simulation

In order to study the effect of lung inflation on the ablation area, a finite element method combining electromagnetic field and biological heat transfer was used to establish a simulation model of lung airflow during microwave ablation. The model takes into account changes in several key physical parameters, including the relative permittivity, conductivity, and density of lung tissue.

2.2.1. Geometric Model

Comsol Multiphysics version 5.5 software (COMSOL Co., Ltd., Shanghai, China) was used in the simulation, and the microwave antenna model, water-cooled circulation system and lung tissue model were constructed, respectively.
The ablation probe (antenna) is made of slender coaxial cable. In order to manufacture the antenna, a small annular groove with specified width is cut on the outer conductor near the short-circuit end of the antenna to allow electromagnetic wave to propagate into the tissue. This design uses a 1 mm wide crack [24]. In addition, the antenna was inserted into the PTFE catheter to prevent the antenna from adhering to the dry ablation tissue. The geometric model and size of the microwave antenna are shown in Figure 3 and Table 2 [25], and the microwave frequency is 2450 MHz.
In this study, an ideal lung model was constructed. Since the ablation area is axisymmetric, the geometric model is simplified to a two-dimensional model. In this model, the lung tissue is idealized as a regular rectangle, and the pig lung is assumed to be isotropic and homogeneous tissue. The microwave antenna is inserted 100 mm into the pig lung tissue, as shown in Figure 4.

2.2.2. Mathematical Model

The ablation zone is formed by the deposition of electromagnetic wave energy around the tissue, which causes the temperature of the tissue to rise. Therefore, the electromagnetic field effect, biothermal effect and tissue specific absorption rate need to be considered in the simulation model.
The simulation model of this study uses two physical fields of electromagnetic wave and biological heat transfer, and the temperature distribution of lung tissue after microwave ablation is calculated through the coupling of these two physical fields.
Solving the electromagnetic field simulation uses the wave equation of the plane transverse magnetic field wave [26,27]. The formula is as follows:
× [ ( ε r j σ ω ε 0 ) 1 × H φ ] μ r k 0 2 H φ = 0
In this formula, ε r is the relative permittivity of lung tissue, σ   is the electrical conductivity of the tissue (S/m), ω is the angular frequency of the microwave, ε 0 is the relative permittivity of vacuum ( 8.85 × 10 12 F/m), H φ   is the magnetic field strength (A/m), μ r is the relative permeability ( μ r = 1), k 0 is the wave number of free space (rad/m).
SAR = σ lung 2 ρ | E | 2
SAR is the specific absorption rate of lung tissue to microwave, where σ lung is the electrical conductivity of the lung tissue, ρ is the density of tissue and E is the electric field strength.
The temperature rise of the tissue is caused by the deposition of microwave electromagnetic energy in the tissue, so the heat transfer of biological tissue under microwave radiation can be described by the Pennes equation [28]. The equation is as follows:
ρ c T t = · ( k T ) + ω b C b ( T b T ) + q m + q r
In the formula, T is the temperature (°C), ρ is the density (kg/m3), C is the specific heat (J/kg °C) and k is the heat conductivity of tissue (W/m °C), ω b is the blood perfusion rate (kg/m3 s), C b is the blood specific heat, T b is the blood temperature, q m is the heat production rate of tissue metabolism, and q r is the external heat source. The relationship between q r and SAR can be expressed as follows:
q r = ρ SAR = 1 2 σ lung | E | 2
Therefore, the simulation results of microwave ablation can be calculated by solving the electromagnetic wave and biological heat conduction model equations, respectively.

2.2.3. Parameters of the Model

In order to obtain the temperature distribution at different powers, the output power of microwave is 40 W, 50 W and 60 W, respectively. Due to the temperature distribution changes with time, the solver in the model is set to a complete transient solution. In order to obtain the trend of the temperature distribution during the ablation process, the total calculation time is 300 s and the time step is set to 10 s. These data will provide important reference for the final analysis results of this study. In addition, the boundary temperature of lung was set at 37 °C, and the outer surface was truncated by scattering boundary condition.
In clinical practice, it is generally believed that when the temperature of tumor tissue is higher than 60 °C, coagulation necrosis will occur [29]. Thus, we chose the 60 °C isotherm as the ablation boundary, and analyzed the size and shape of the ablation area under different power and time. The thermophysical parameters of lung tissue are set to Table 3 and Table 4 [5].

2.3. Statistical Analysis

All data were entered and analyzed using IBM SPSS version 23.0 for Windows (Akmony, New York, NY, USA). The long diameters (Dl) and short diameters (Ds) of the MWA coagulated area were recorded and reported as the mean ± standard deviation and compared among each group. A probability value less than 0.05 was considered statistically significant.

3. Results

3.1. Ex-Vivo Experiment

In ex-vivo experiments, single factor conditional experiments were used to study the ablation area of the deflated group and the inflated group, including Dl and short Ds of the MWA coagulated area and the temperature changes at the slot of the microwave antenna.

3.1.1. Ablation Area Size

Each group of experiments was repeated five times. Table 5, Table 6 and Table 7 show the average data and standard deviation, which were the average Dl and Ds data of the ablation area in the deflated group and the inflated group under different ablation power.
This section may be divided by subheadings. It should provide a concise and precise description of the experimental results, their interpretation, as well as the experimental conclusions that can be drawn.
As shown in the data in Table 5, Table 6 and Table 7 and Figure 5 and Figure 6, with the increase of ablation power and time, the long and short diameters of the ablation area gradually increased. At the same ablation power and ablation time, the long and short diameters of the ablation area in the deflated group were larger than those in the inflated group. Through further calculation, it was concluded that when the ablation power was 40 W, 50 W, and 60 W, the average long diameter of the deflated group was 20.8–30.9%, 7.6–22.6%, 10.4–19.8% higher than that of the inflated group, respectively. The average short diameter was 24.5–41.4%, 31.6–45.7%, 27.3–42.9% larger than that of the inflated group, respectively. The data show that when the lung is inflated, the microwave energy transfer is hindered, the long and short diameters of the ablation area are reduced compared with the deflated group. The difference between the long diameters of the inflated group and the deflated group was around 2 mm–6 mm, while the difference between the short diameters was around 4 mm–10 mm. Therefore, the difference between the ablation areas of the two experimental groups was more obvious in the direction perpendicular to the antenna [30].

3.1.2. Isoperimetric Ratio of Ablation Area

Lung tissue is the respiratory organ of the human body, and the air volume in the lung changes periodically with the breathing movement, resulting in changes in its physical parameters. In the current clinical application of microwave ablation, there is a lack of accurate prediction of the thermal field of microwave ablation. The choice of ablation parameters only based on the doctor’s subjective experience may lead to poor ablation of the lesion, postoperative tumor recurrence, or excessive ablation of the lesion, causing serious complications and additional harm to the patient. Therefore, it is very important to accurately predict the size and shape of the ablation area and reserve a reasonable safety margin. Considering that most lung tumors are spherical or irregular in shape, it is ideal that the shape of the ablation area tends to be round, so that the lesion can be completely covered, and the damage to the surrounding normal tissue can be minimized. Therefore, this study cites the isoperimetric ratio [31] as an index to evaluate the ablation area. The isoperimetric ratio is a measure to describe the circularity of a two-dimensional object, and the calculation method is shown in Equation (5):
isoperimetric   ratio = 4 π · S / A 2
In the formula, S is the area of the graph (cm3), and A is the perimeter of the graph (cm). When the value of isoperimetric ratio is equal to 1, the figure can be regarded as an ideal perfect circle, on the contrary, when the value of circularity is close to 0, it means that the shape is an oblate or a crack-like shape. By calculating the data in Table 5, Table 6 and Table 7, the isoperimetric ratio of the ablation area under different ablation parameters is obtained, as shown in Table 8.
From Table 8, it can be concluded that the isoperimetric ratio of the inflated group is in the range of 0.81–0.89, and the isoperimetric ratio of the deflated group is around 0.89–0.94. Under the same ablation power and ablation time, the isoperimetric ratio of the deflated group is greater than that of the inflated group, and the shape of the ablation area is closer to the regular circle. The shape of the ablation area in the inflation state is more inclined to the slender ellipse, which is mainly due to the large difference in the short diameter of the ablation area between the two groups.

3.1.3. Temperature at Different Positions

The temperature distribution around the microwave antenna is oval. Four temperature sampling points are set perpendicular to the puncture direction of the antenna, which are at the crack of the microwave antenna and 5 mm, 10 mm and 15 mm away from the crack of the antenna. The results are shown in Figure 7.
The necrotic area formed by microwave ablation is mainly determined by two factors, one is the active heating area formed by the deposition of microwave energy in the tissue, the other is the passive heating area formed by the thermal conduction of tissue due to the existence of temperature difference. The formation of the active heating zone is related to the dielectric properties of the tissue, and the passive heating zone is related to the thermal conductivity of the tissue.
In the vicinity of the microwave antenna (antenna slot, 5 mm away from the slot), the temperature of the deflated group and the inflated group increased sharply. With the extension of ablation time, the heating rate gradually slowed down and tended to be stable. Under different ablation power (60 W, 50 W, 40 W), the highest temperature at the slot in the deflated group was 103.1 °C, 101.3 °C, 88.4 °C, and the highest temperature at 5 mm away from the slot was 100.0 °C, 98.1 °C, 82.6 °C, respectively; the highest temperature at the slot in the inflatable group was 98.9 °C, 92.2 °C, 83.4 °C, and the highest temperature at 5 mm away from the slot was 95.0 °C, 86.6 °C, 75.1 °C, respectively. In the initial stage of ablation, the heating rate of the deflated group was significantly higher than that of the inflated group, and the temperature of the deflated group was always higher than that of the inflated group during the whole ablation process. The temperature growth of the lung tissue near the antenna mainly depends on the deposition of microwave energy. The relative permittivity and conductivity are the two main factors affecting the deposition of electromagnetic energy, which will significantly increase the temperature of the external heating area [32,33,34]. However, the relative permittivity and conductivity of the lung in the inflation state were lower than those in the deflation state, resulting in the temperature of the deflated group was always higher than that of the inflated group.
At a distance of 10 mm and 15 mm from the antenna, the initial heating rate of the deflated group and the inflated group increased slowly and tended to be linear. During the whole ablation process, the temperature of the deflated group was also higher than that of the inflated group. The ablation area slightly away from the antenna is formed by tissue thermal conductivity, which has a great relationship with the thermal conductivity of the tissue. The thermal conductivity of the inflatable lung is slightly lower than that of the deinflatable lung, resulting in the higher temperature of the deflated group than that of the inflated group.

3.2. Numerical Simulation

The heat transfer equation used in numerical simulation is Pennes heat transfer equation. The temperature distribution and ablation area under different ablation power (40 W, 50 W, 60 W) were studied. The calculation time is 300 s. Taking the 60 °C isotherm as the boundary of the ablation region, the long diameter (along the antenna direction) and short diameter (perpendicular to the antenna direction) of the ablation region were calculated. The simulation data are shown in Table 9, Table 10 and Table 11, and the temperature distribution is shown in Figure 8, Figure 9 and Figure 10.
From the data in Table 9, Table 10 and Table 11, it can be seen that with the increase of ablation power and ablation time, the long and short diameters of the ablation area continue to expand, and the maximum temperature continues to rise. Under the same ablation power and ablation time, the long diameter, short diameter and maximum temperature of the deflated group were larger than those in the inflated group. From Figure 8, Figure 9 and Figure 10, it can be seen intuitively that the shape of the microwave ablation area in the inflated group and the deflated group is elliptical, and the tissue temperature reaches the maximum value near the antenna slot. With increasing distance, tissue temperature gradually decreases and is eventually maintained at normothermia. In addition, it can be seen from the figure that under the same ablation parameters, the difference in the long diameter of the ablation area between the two experimental groups is not large, but the short diameter of the ablation area in the control group is significantly larger than that in the gas-filled group, resulting in a larger area and a better shape of the ablation area. tends to be circular, while the shape of the ablation area of the inflatable group tends to be elongated and oblate.
Figure 11 shows the variation of the temperature at the slot of microwave antenna with ablation time under different ablation power. The tissue temperature at the slot increased rapidly in a short time, and decreased after about 60 s, and gradually became flat. Under different ablation power (60 W, 50 W, 40 W), the highest temperature in the deflated group was 115.1 °C, 101.4 °C, 87.8 °C, respectively; the highest temperature in the inflated group was 93.5 °C, 83.4 °C, 73.2 °C, respectively. In the initial stage of ablation, the heating rate of the deflated group was slightly higher than that of the inflated group, and the temperature of the deflated group was always higher than that of the inflated group during the whole ablation process.
Table 12 shows the isoperimetric ratio of the ablation area under different ablation parameters in the simulation experiment. From the data in the table, it can be seen that the isoperimetric ratio of the inflated group is in the range of 0.75–0.8, while the isoperimetric ratio of the deflated group is about 0.82–0.86, and under the same ablation power and ablation time, the isoperimetric ratio of deflated group is higher than inflated group. The results showed that the ablation area of inflated lung was less circular than the deflated lung, and the shape of the ablation area tended to be oblate. In addition, the isoperimetric ratio of both experimental groups gradually increase with the extension of the ablation time. This is because the constant temperature boundary is set on the periphery of the microwave antenna, which simulates the microwave antenna in reality. The water-cooled circulation system keeps the temperature low during the ablation process, so the growth of the long diameter is slowed down in the middle and late stages of ablation, and the increase of the short diameter is more obvious at this time, making the isoperimetric ratio of the ablation zone gradually larger. It was also found that the isoperimetric ratio of the deflated group decreased with the increase of ablation power, while the circularity of the inflated group did not change significantly with the change of power. In the clinical application of microwave ablation, the treatment plan can be reasonably formulated according to this feature. When the tumor shape is close to a spherical shape, the ablation parameters can be selected with low power and long ablation time, in order to achieve the effect of conformal ablation.

4. Conclusions

The lung tissue contains a lot of hot and humid air, and the microwave energy is not easily transmitted in the tissue, which makes the prediction and control of the ablation area very difficult for MWA in clinical application [35]. This paper designed an ex-vivo experiment and a simulation experiment to explore the influence of lung inflation on the effect of MWA. The results of the in vitro experiments show that the inflated lung weakens the microwave ablation effect, which is due to the inflatable reduces the relative permittivity, electrical conductivity, thermal conductivity and other physics parameters of the lung tissue, which affects the transmission and accumulation of microwave energy in the tissue [
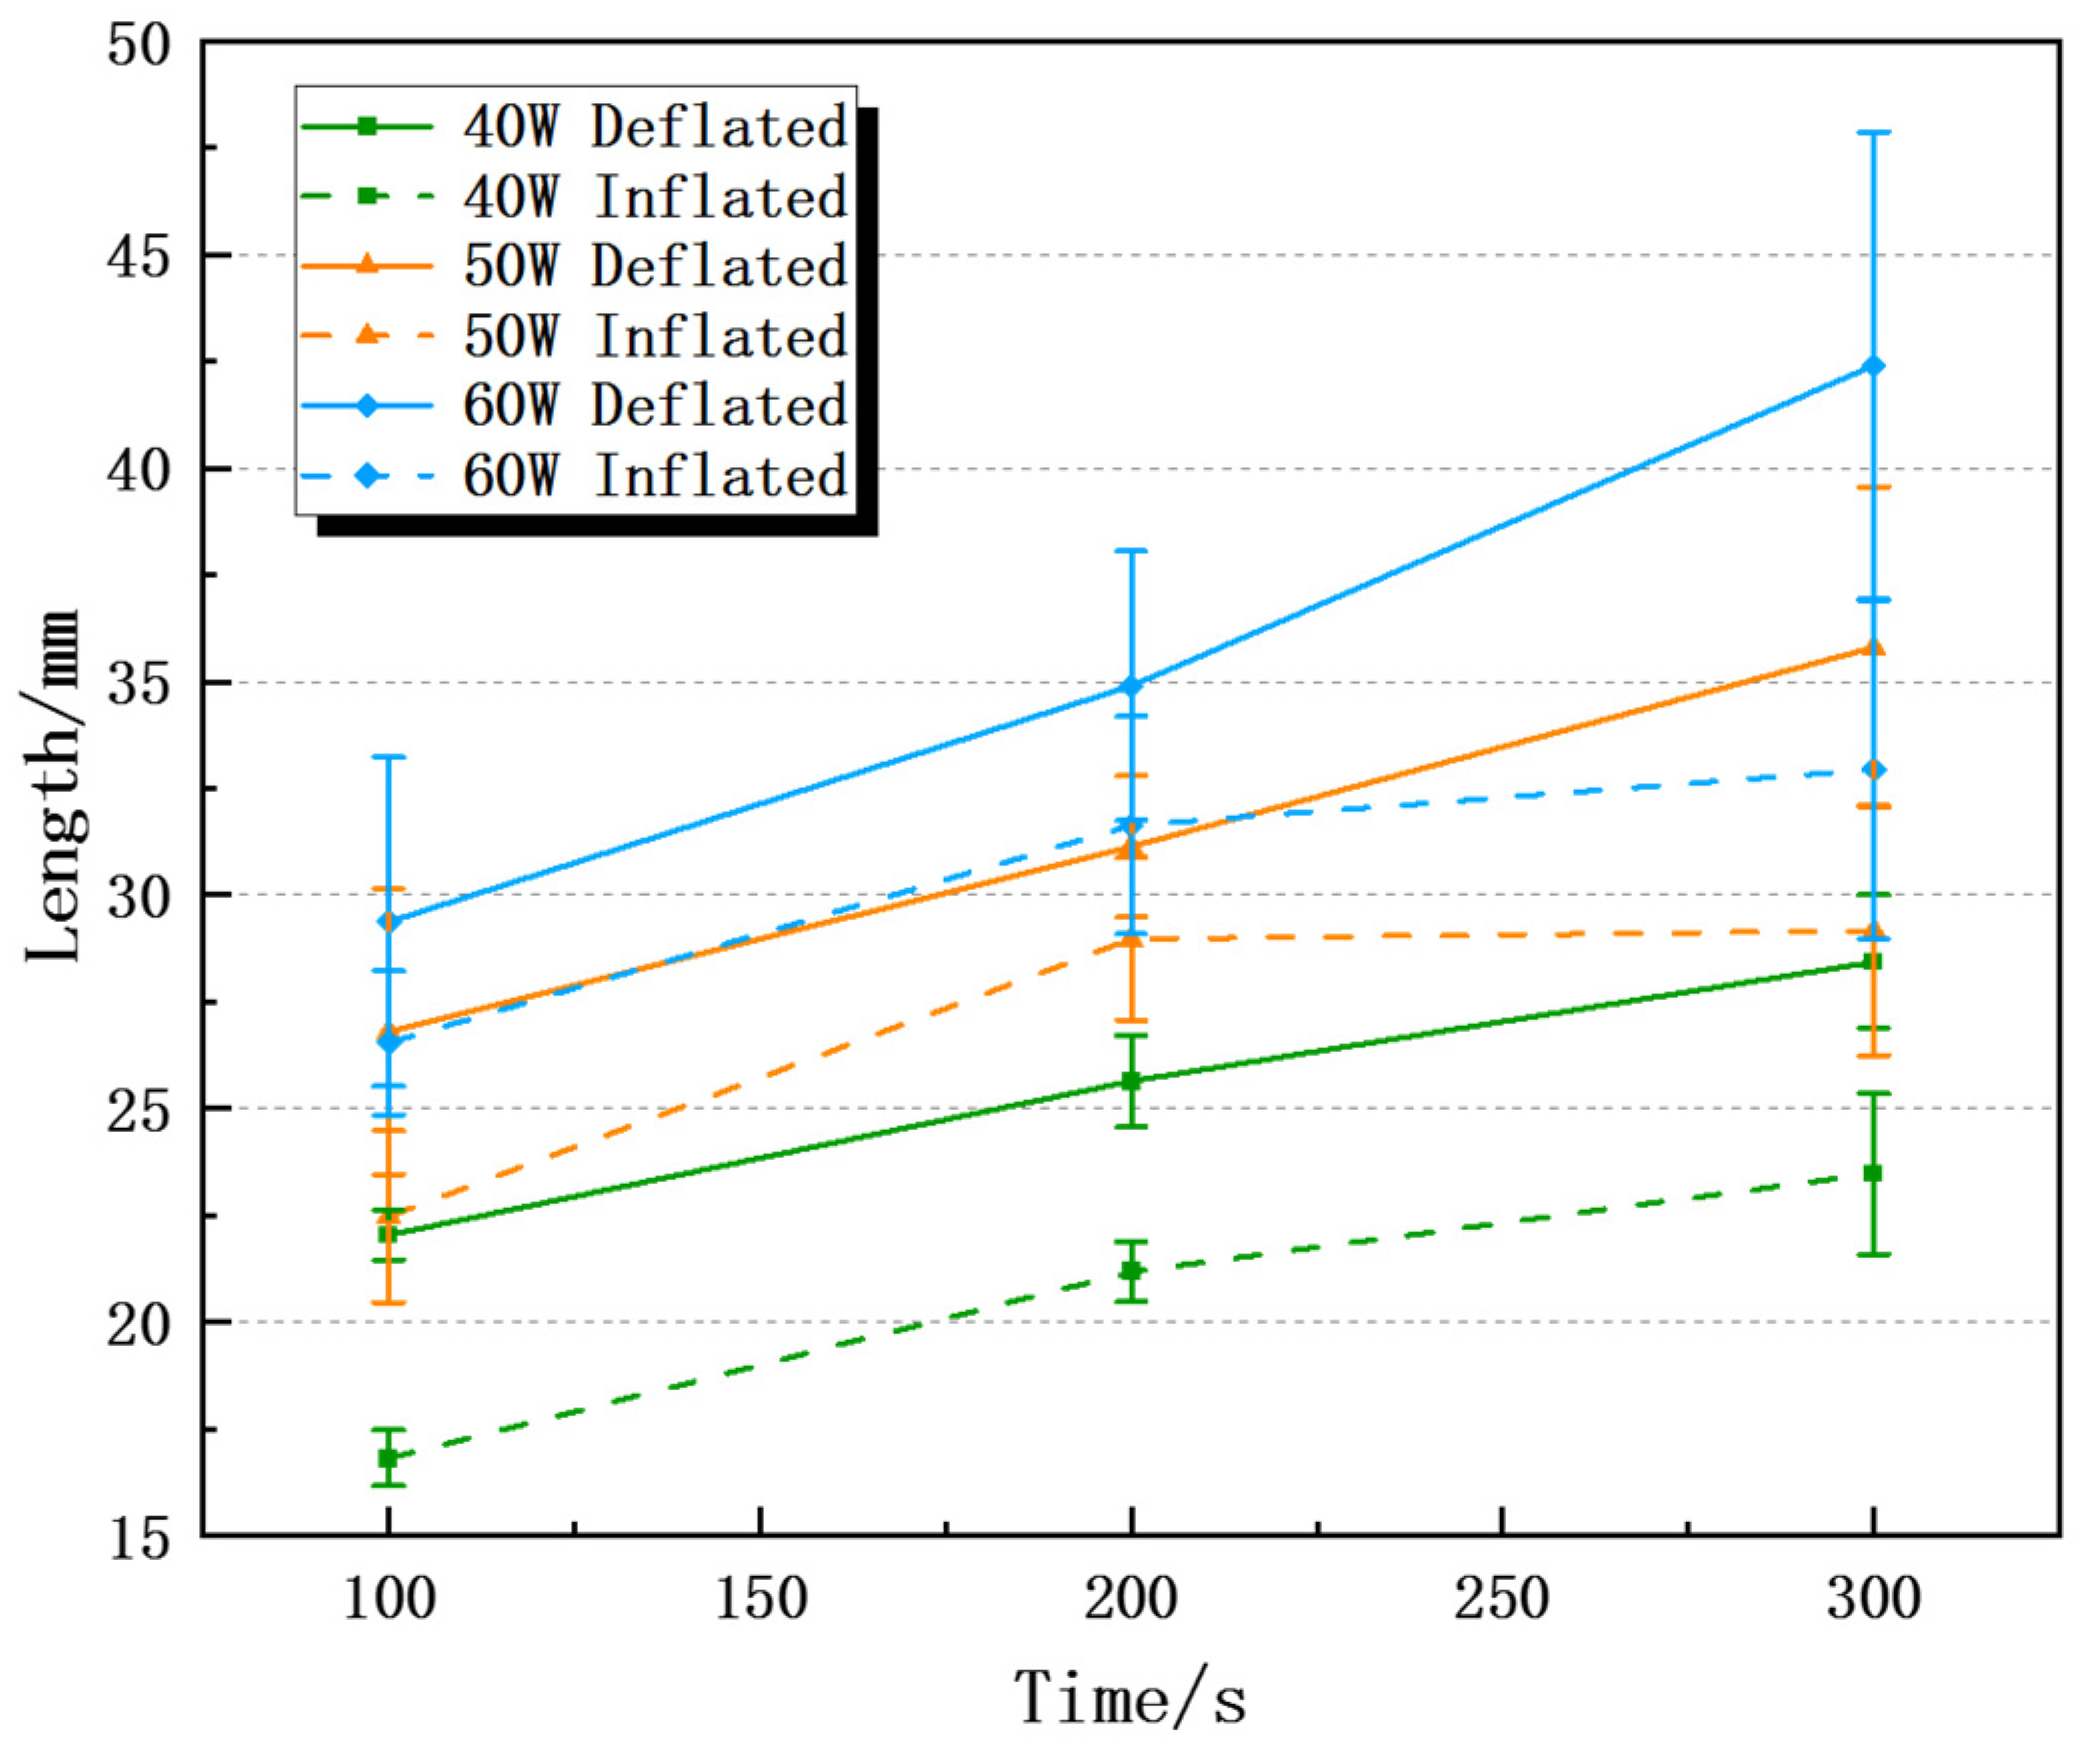
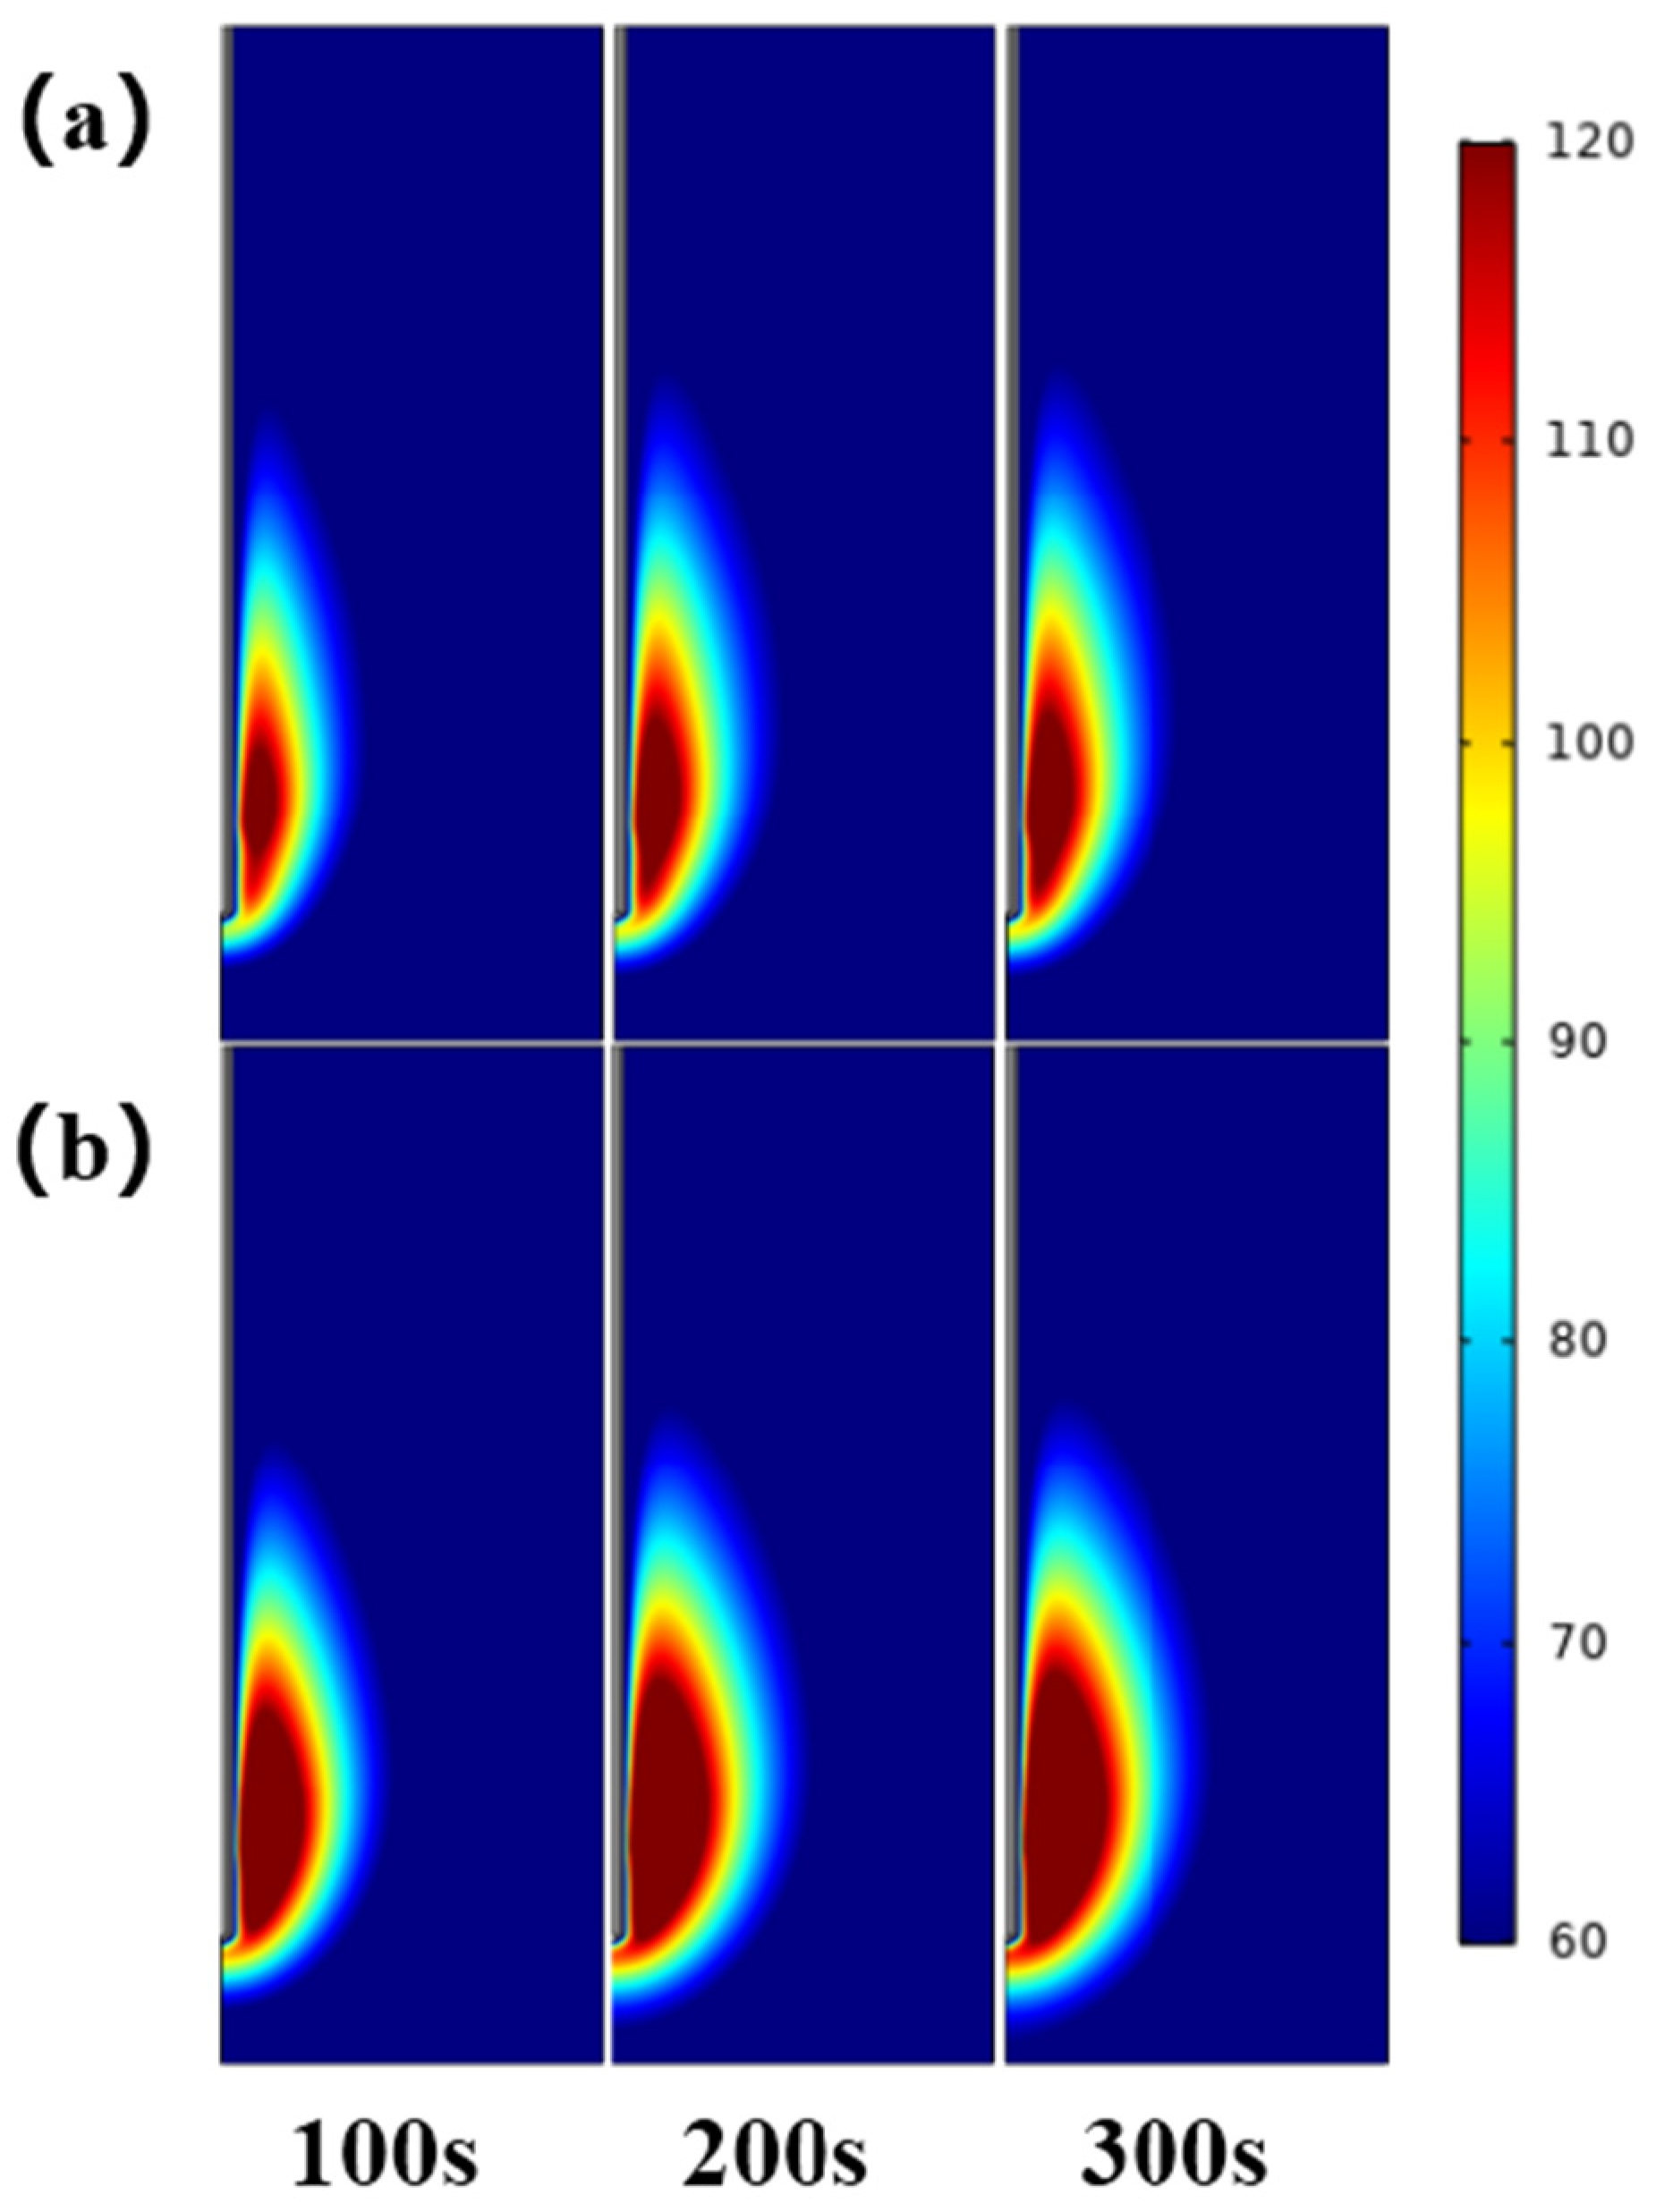
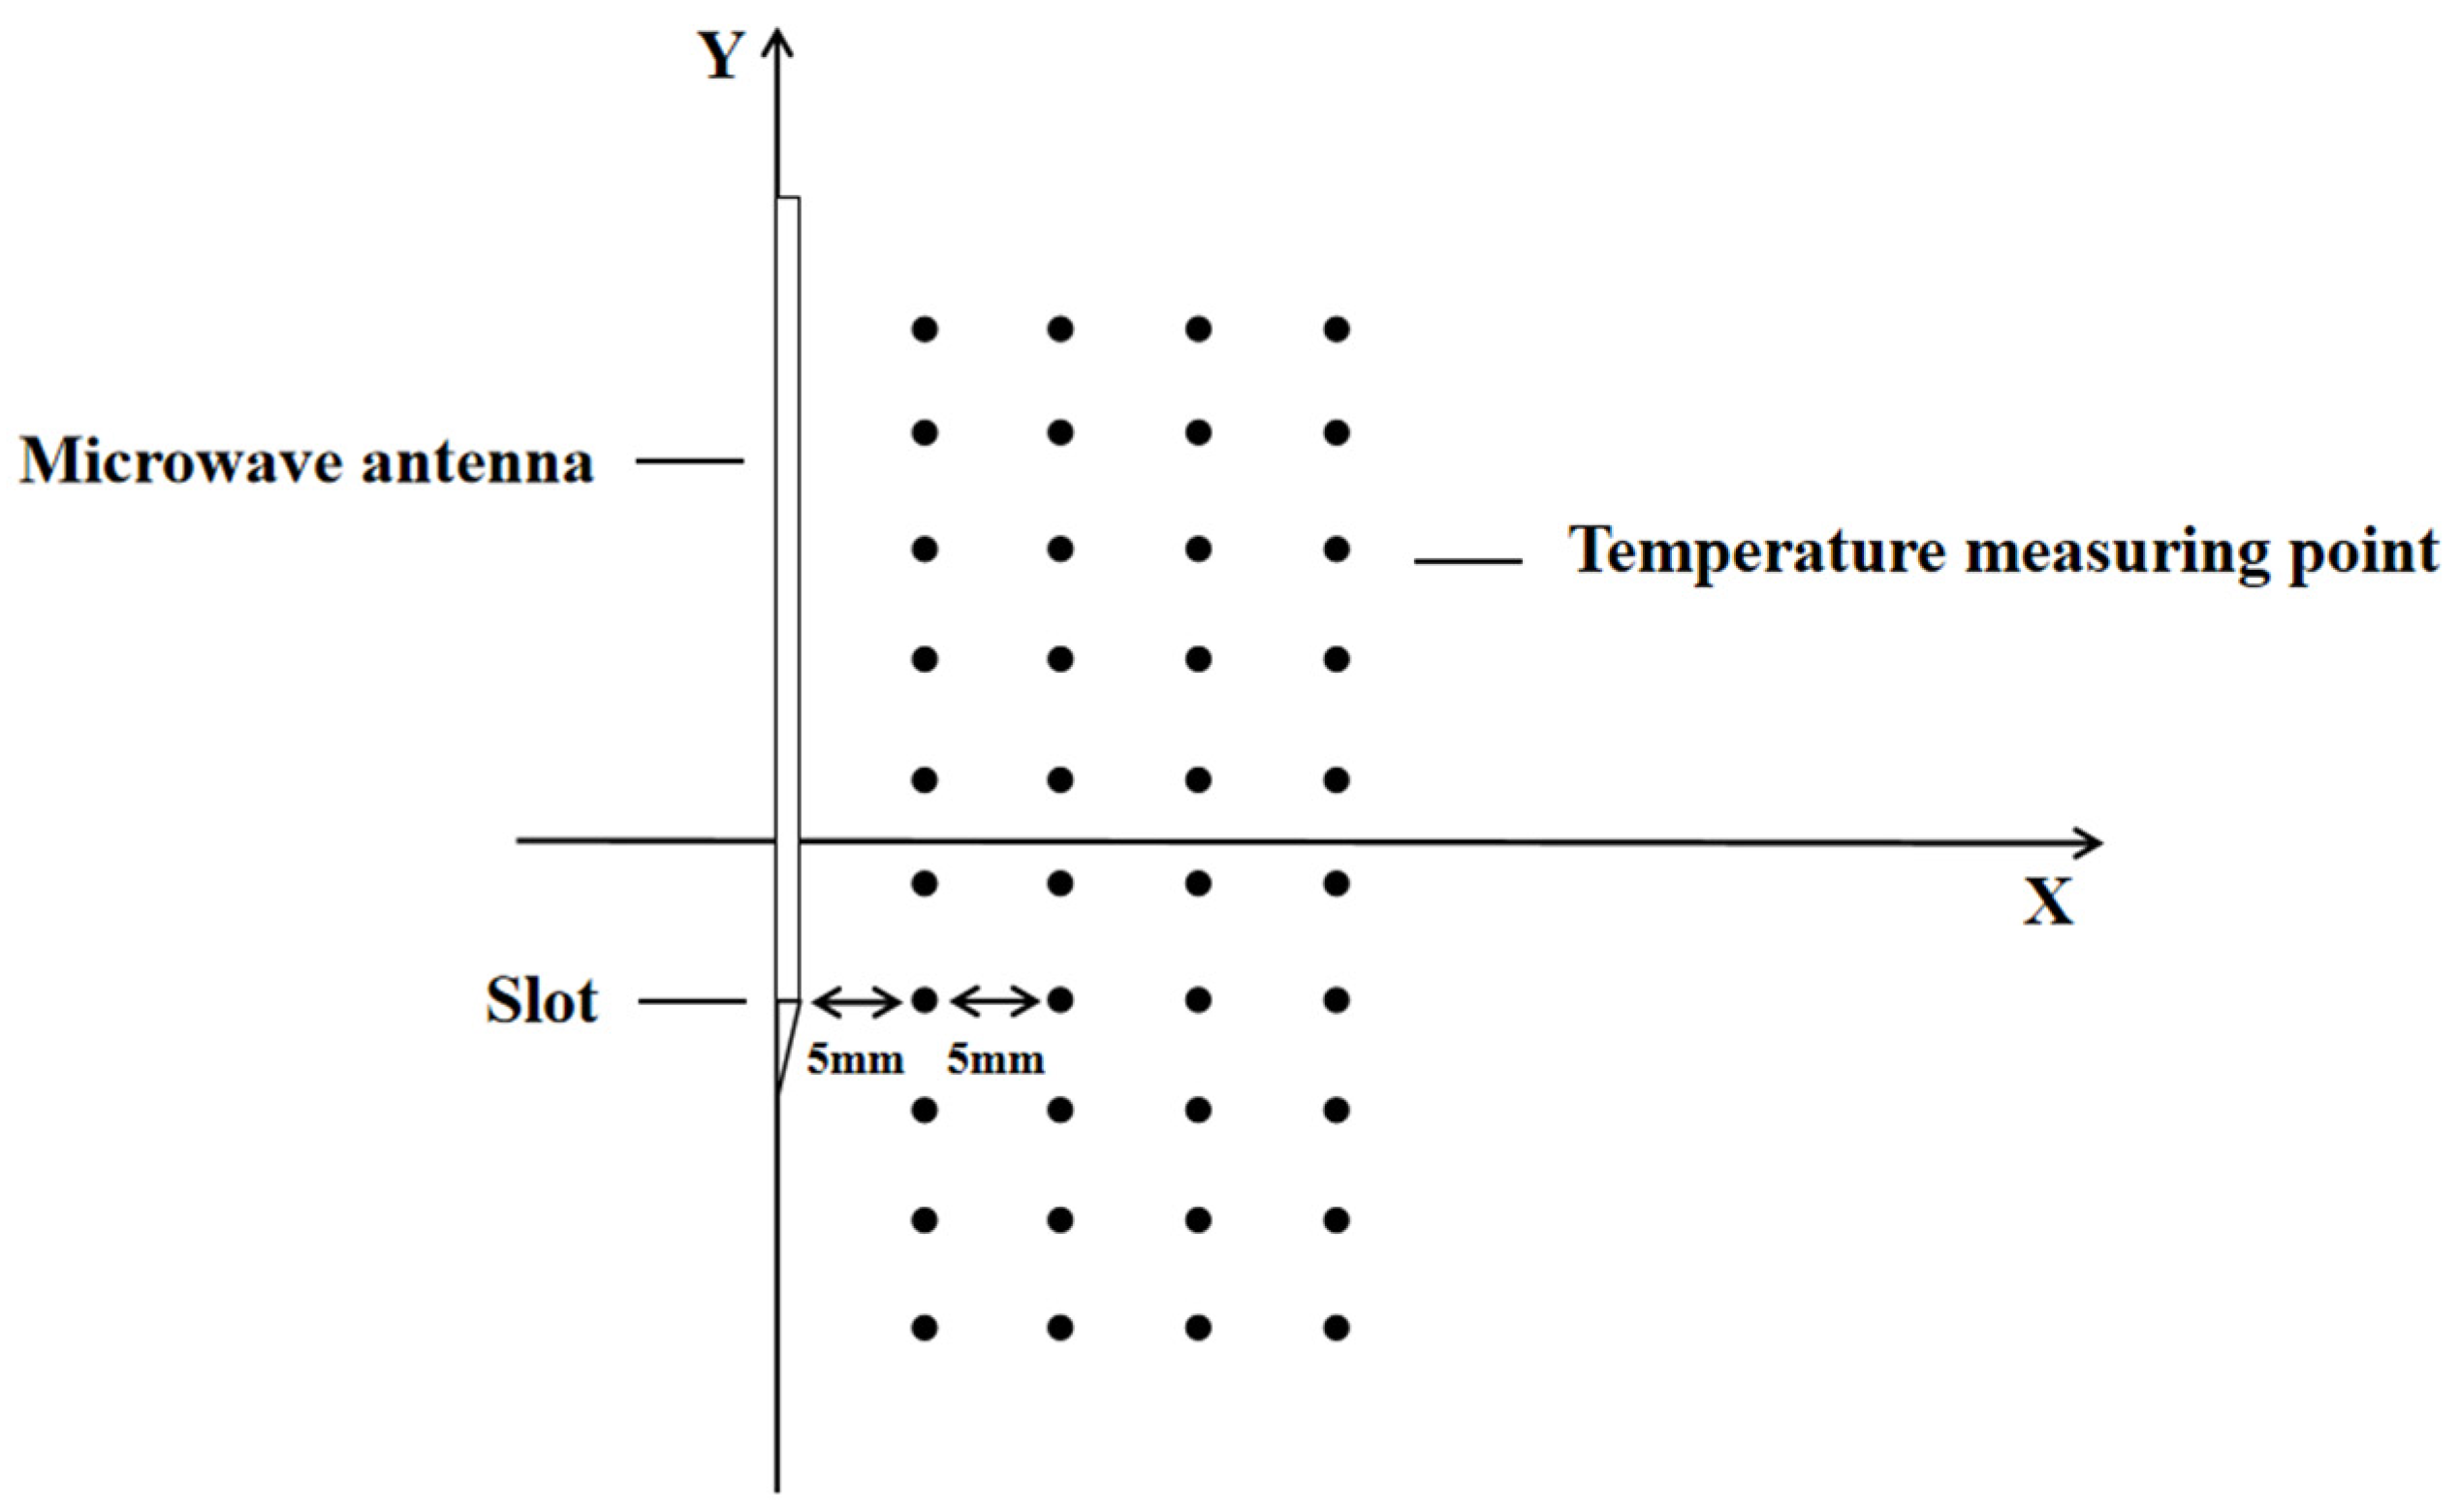
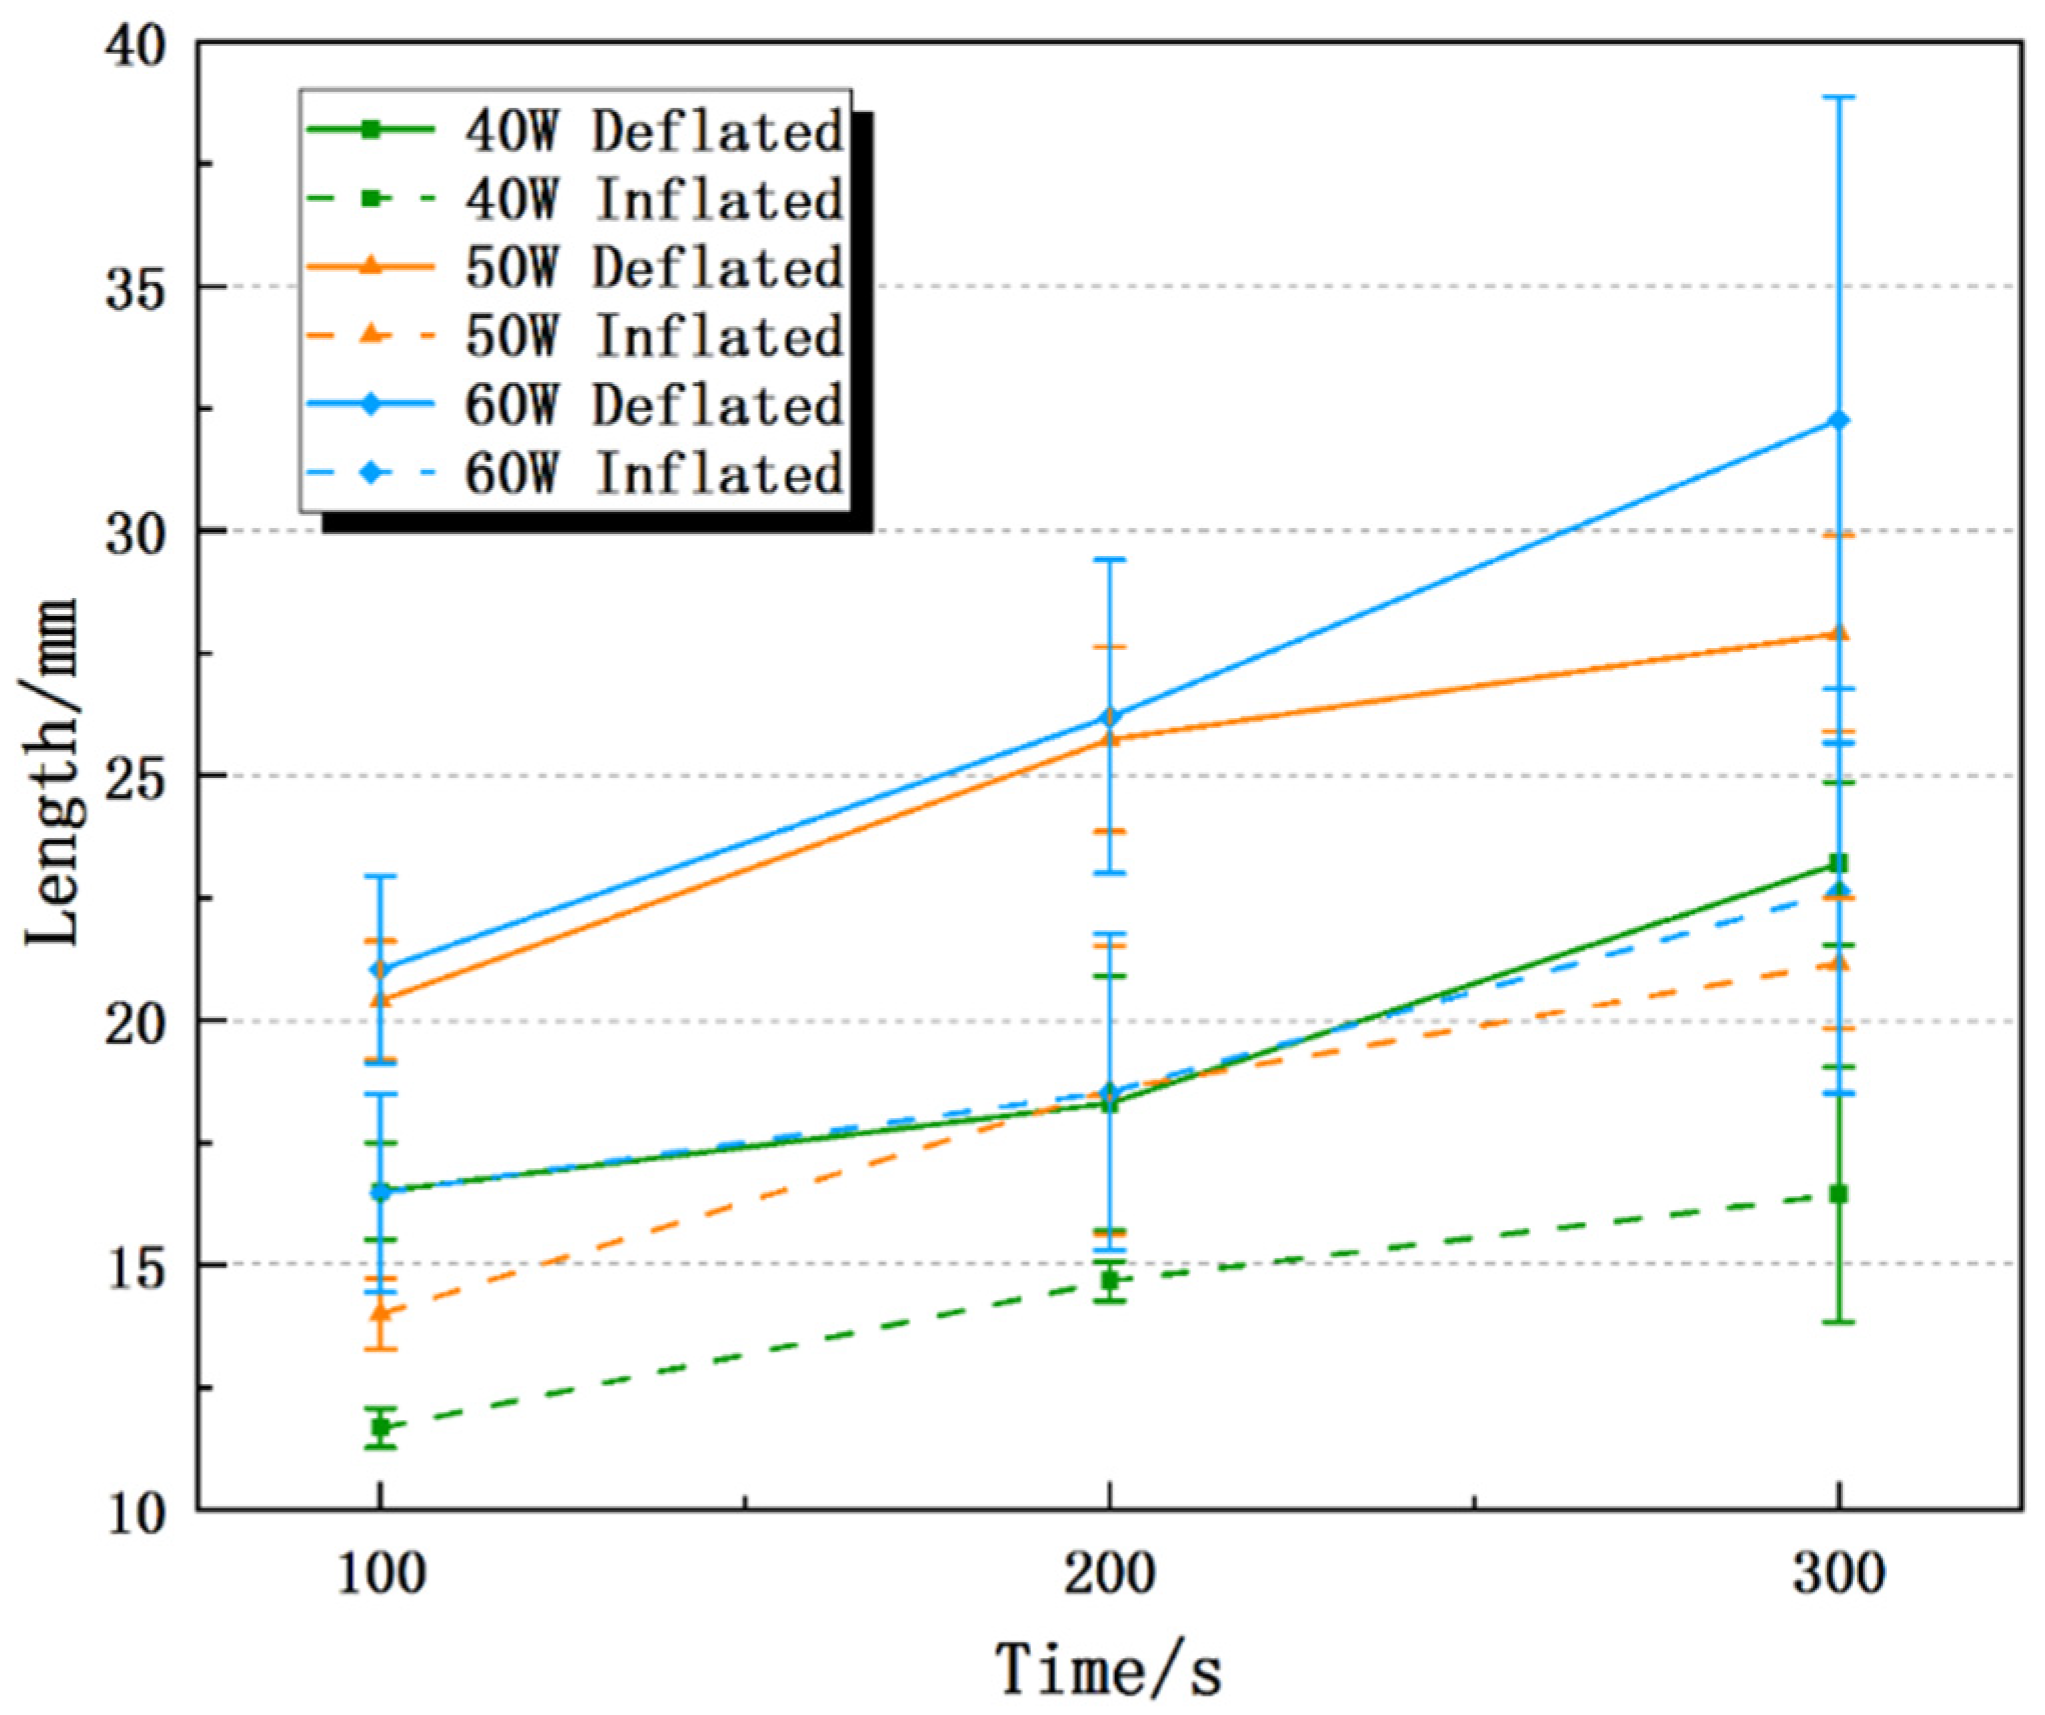
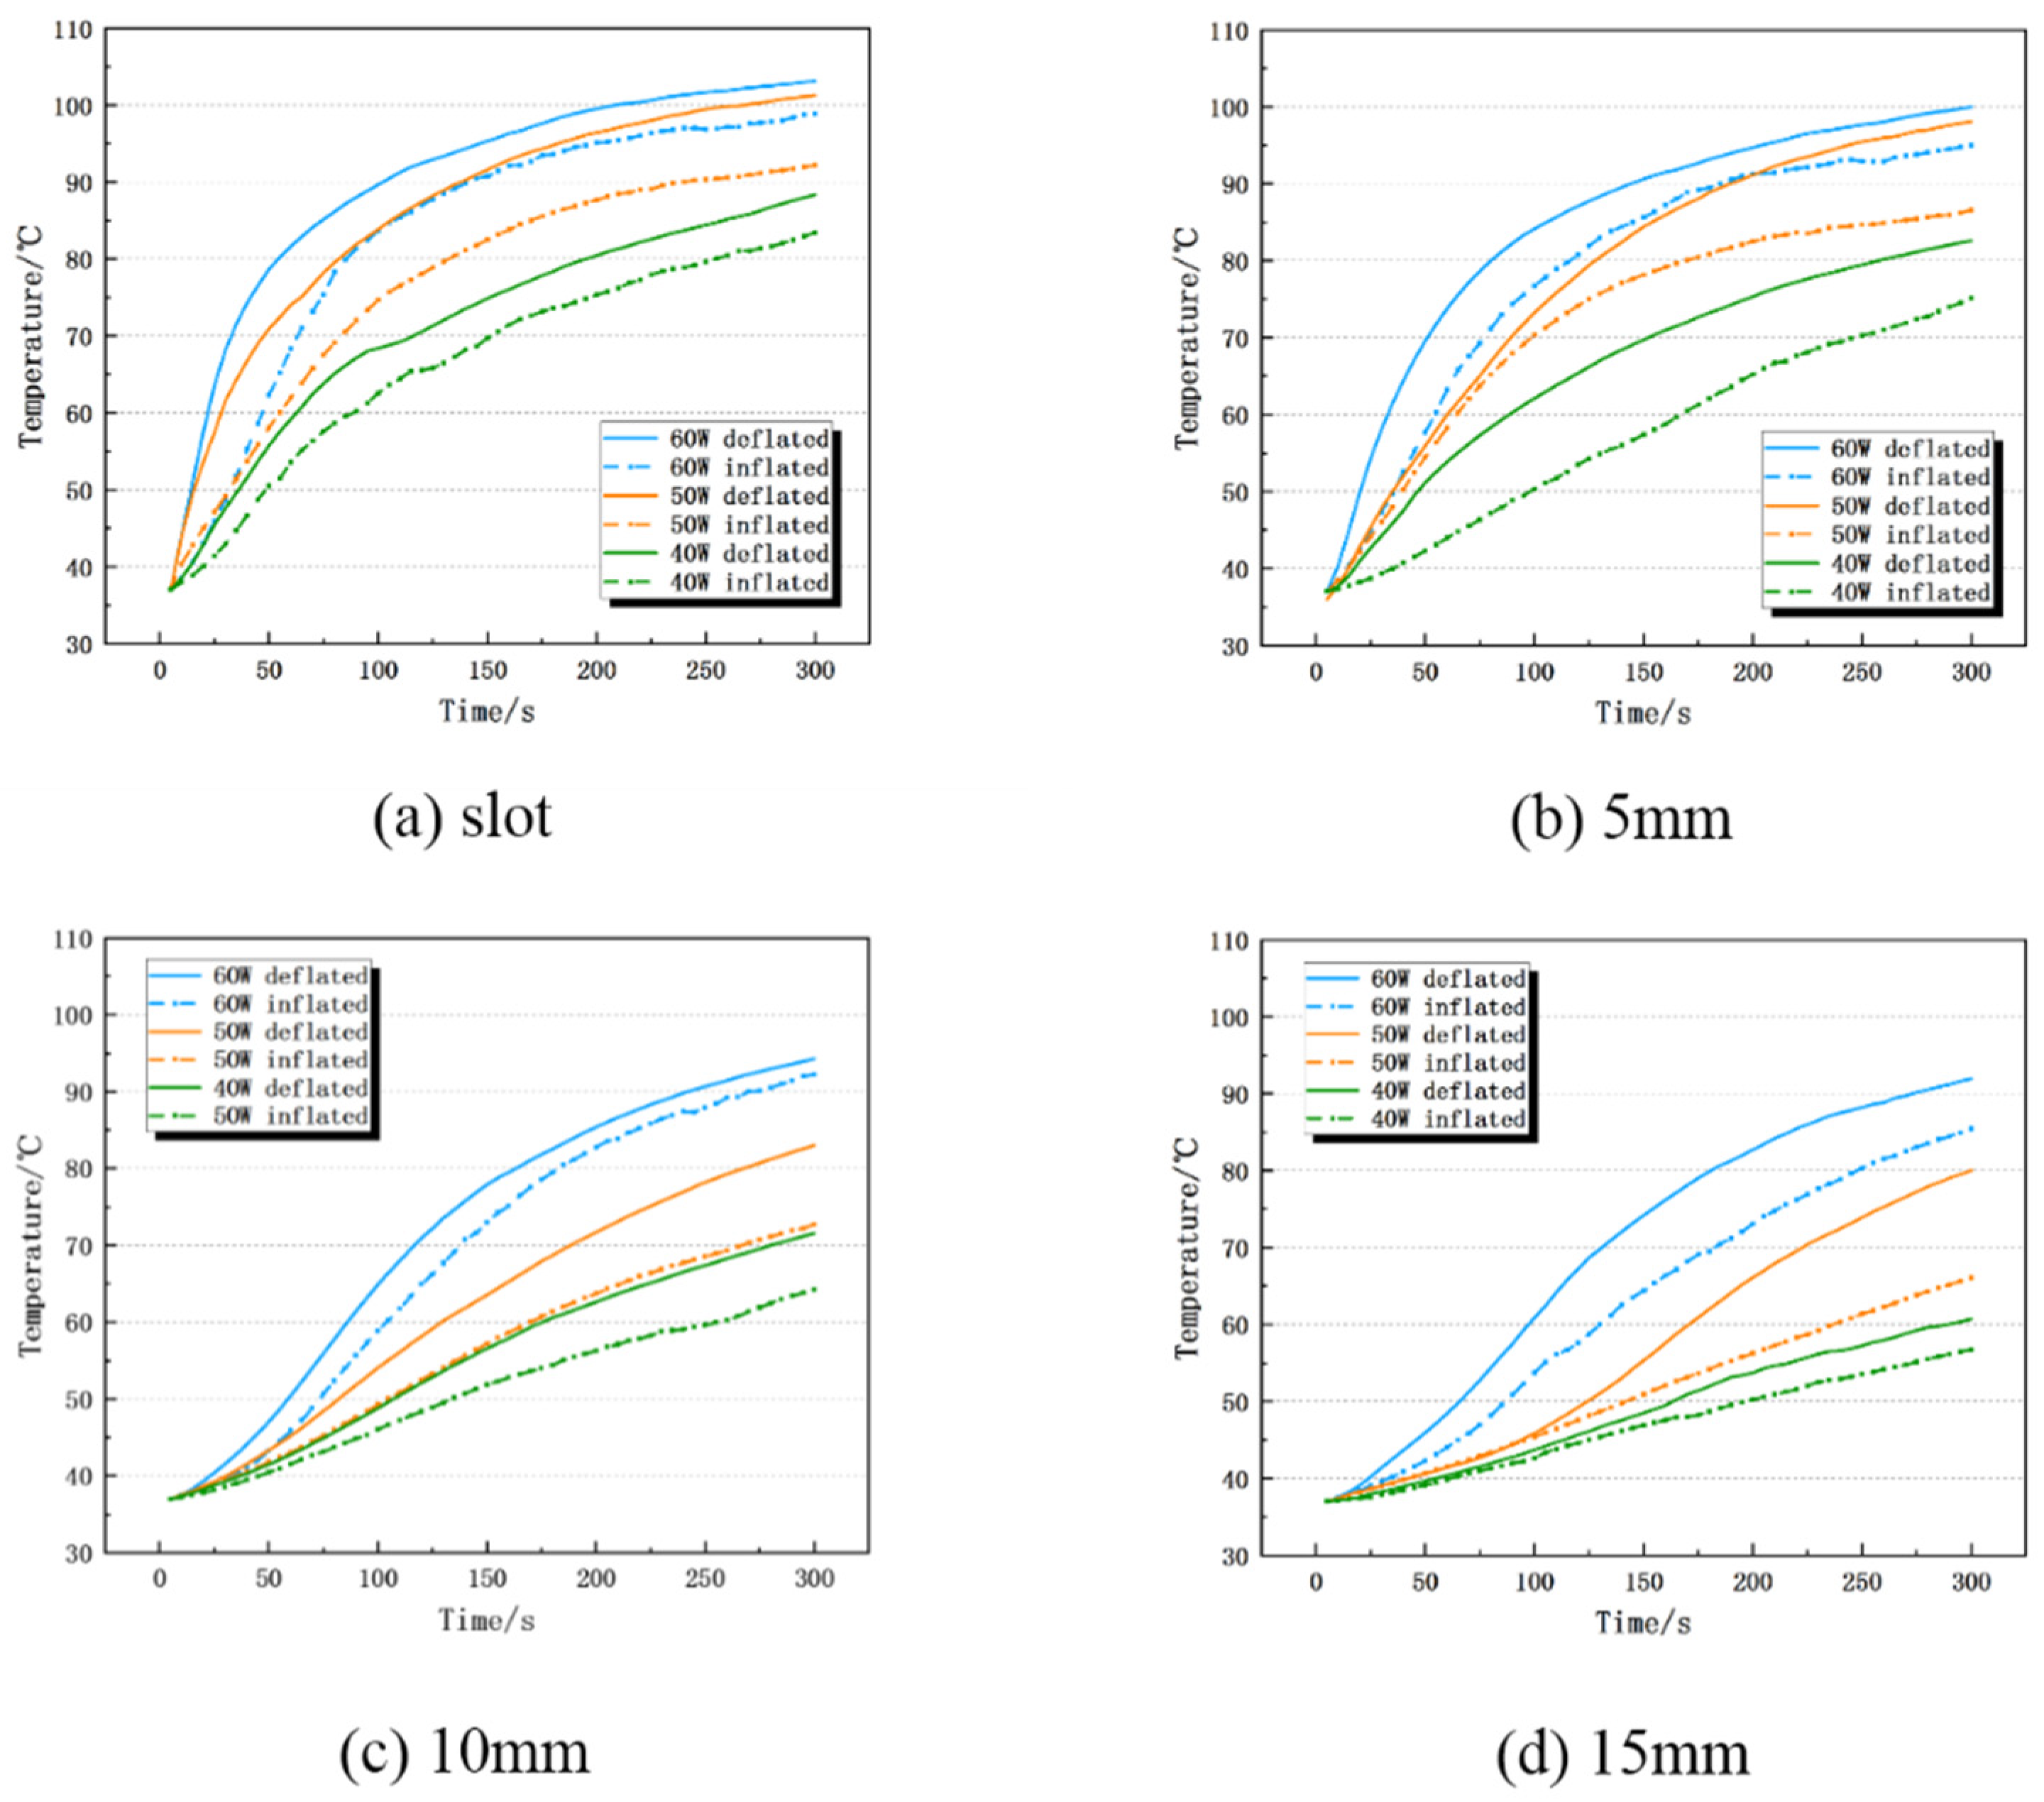
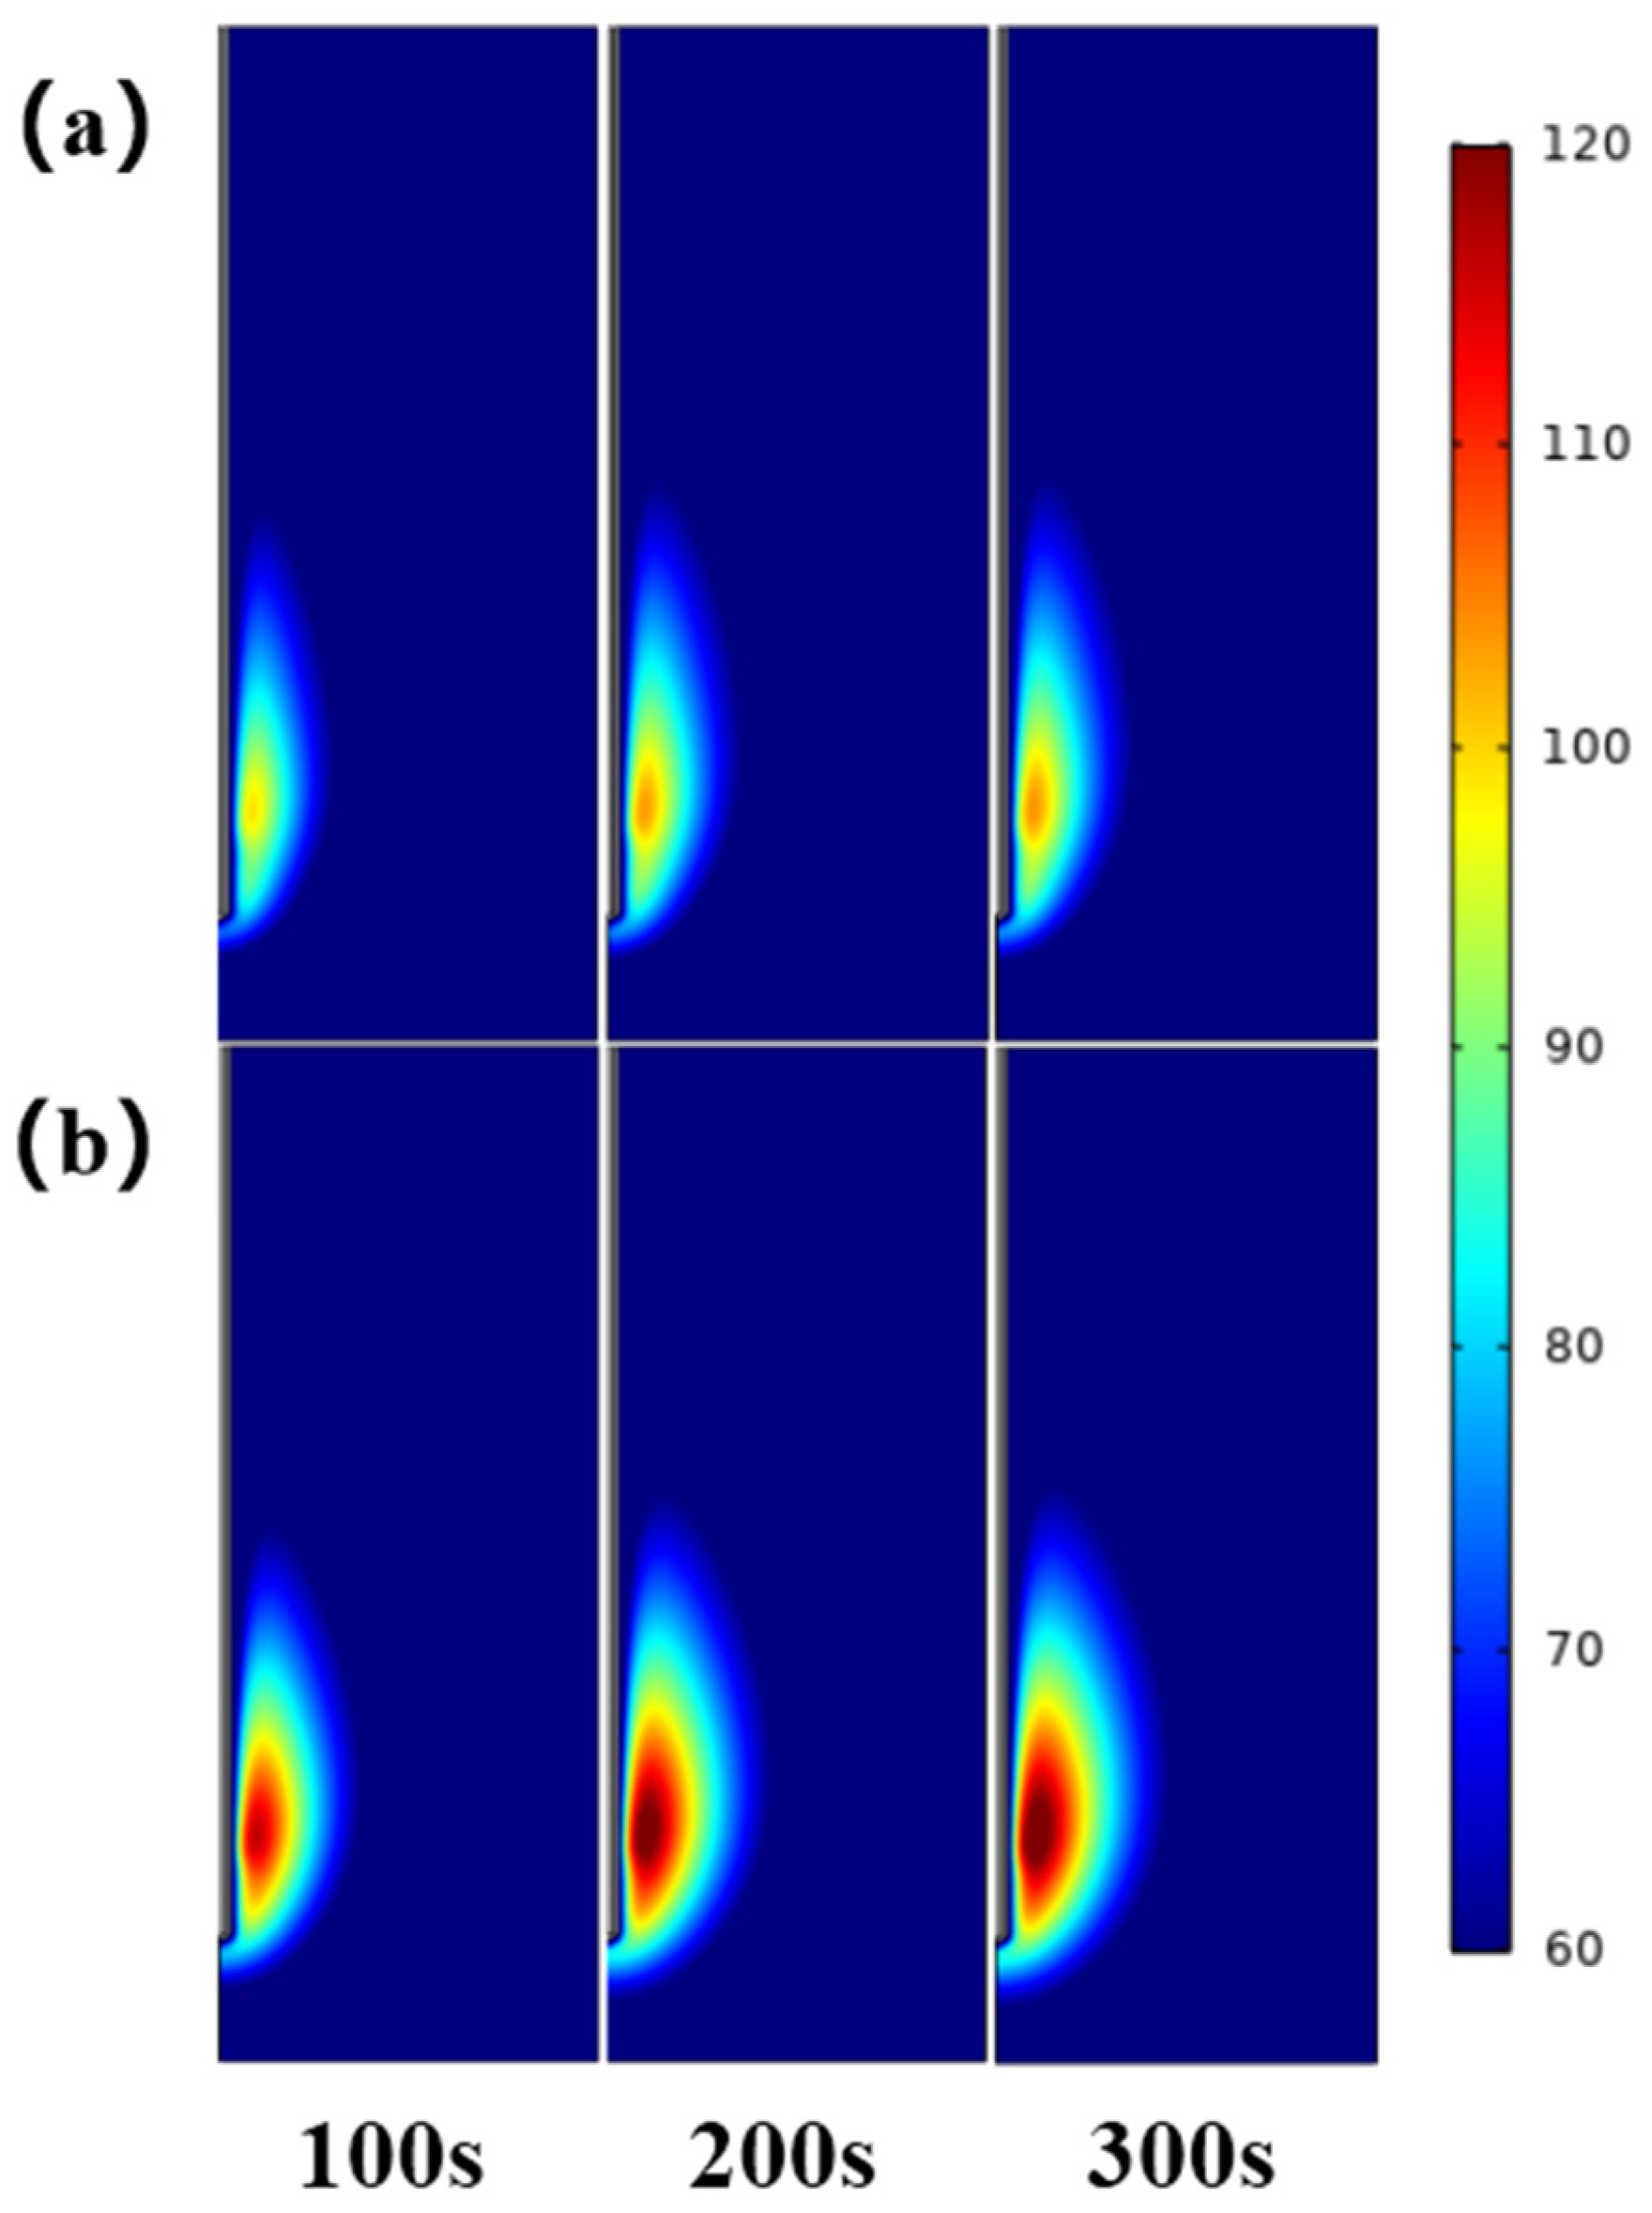
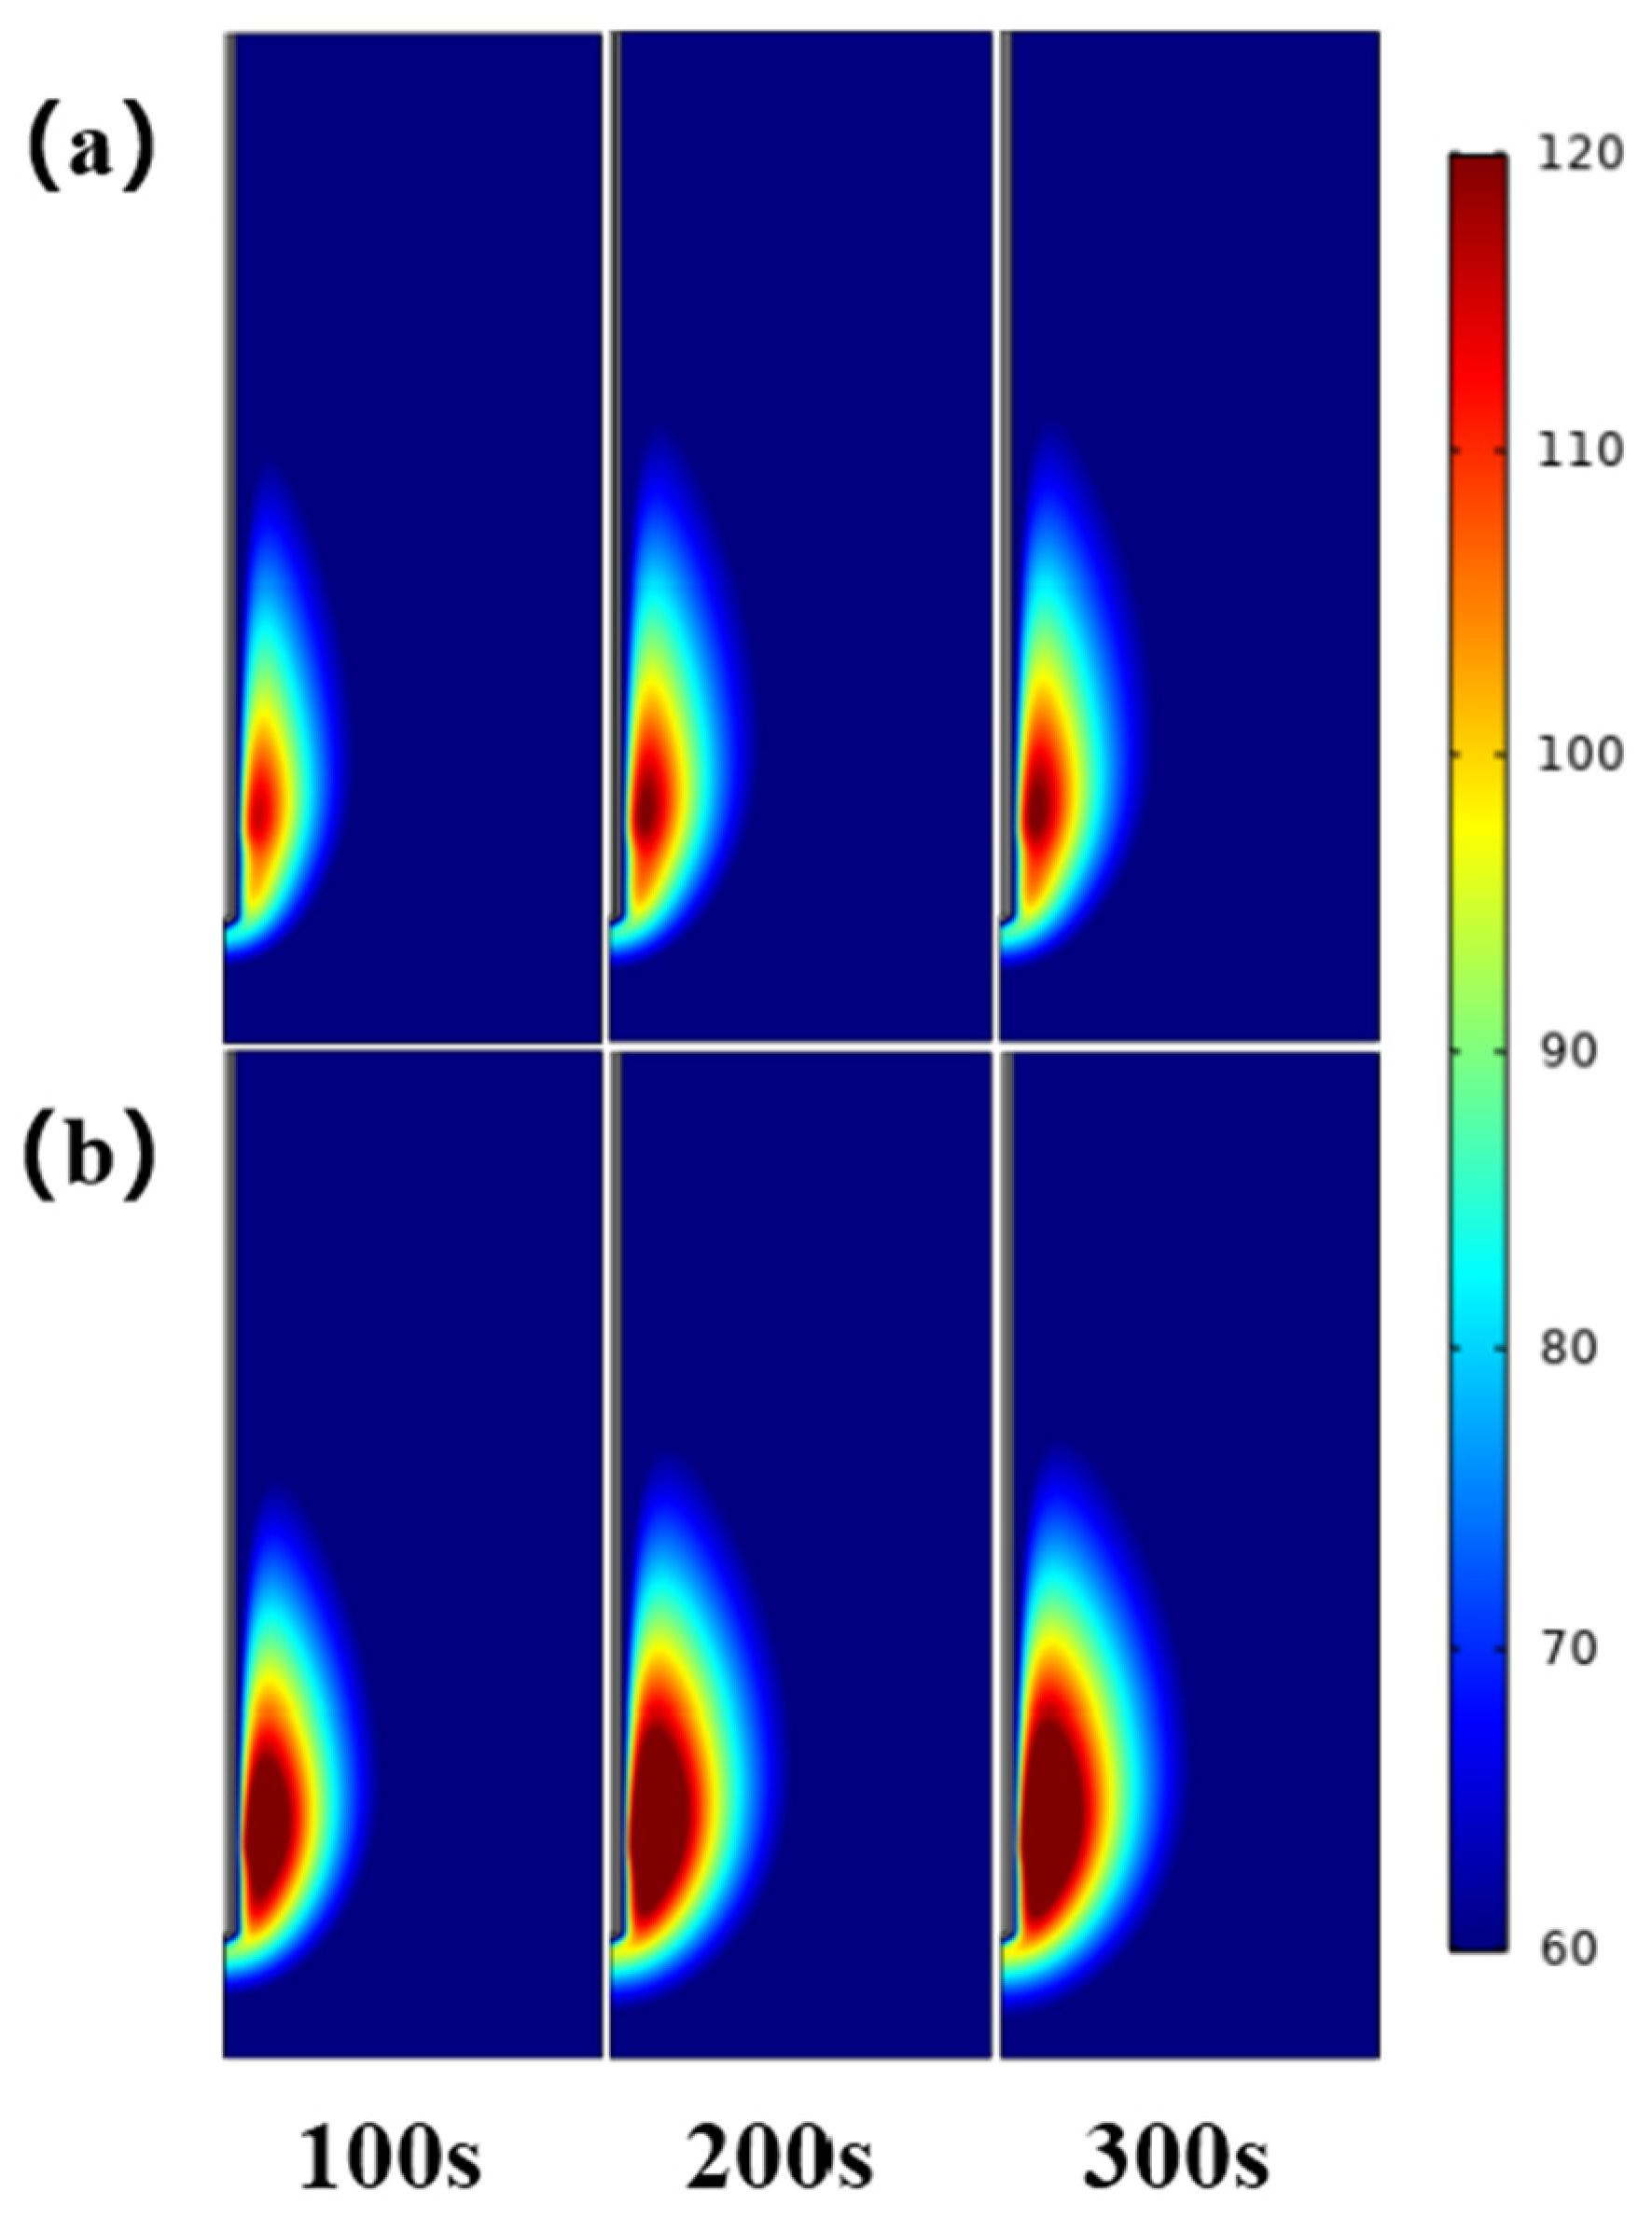
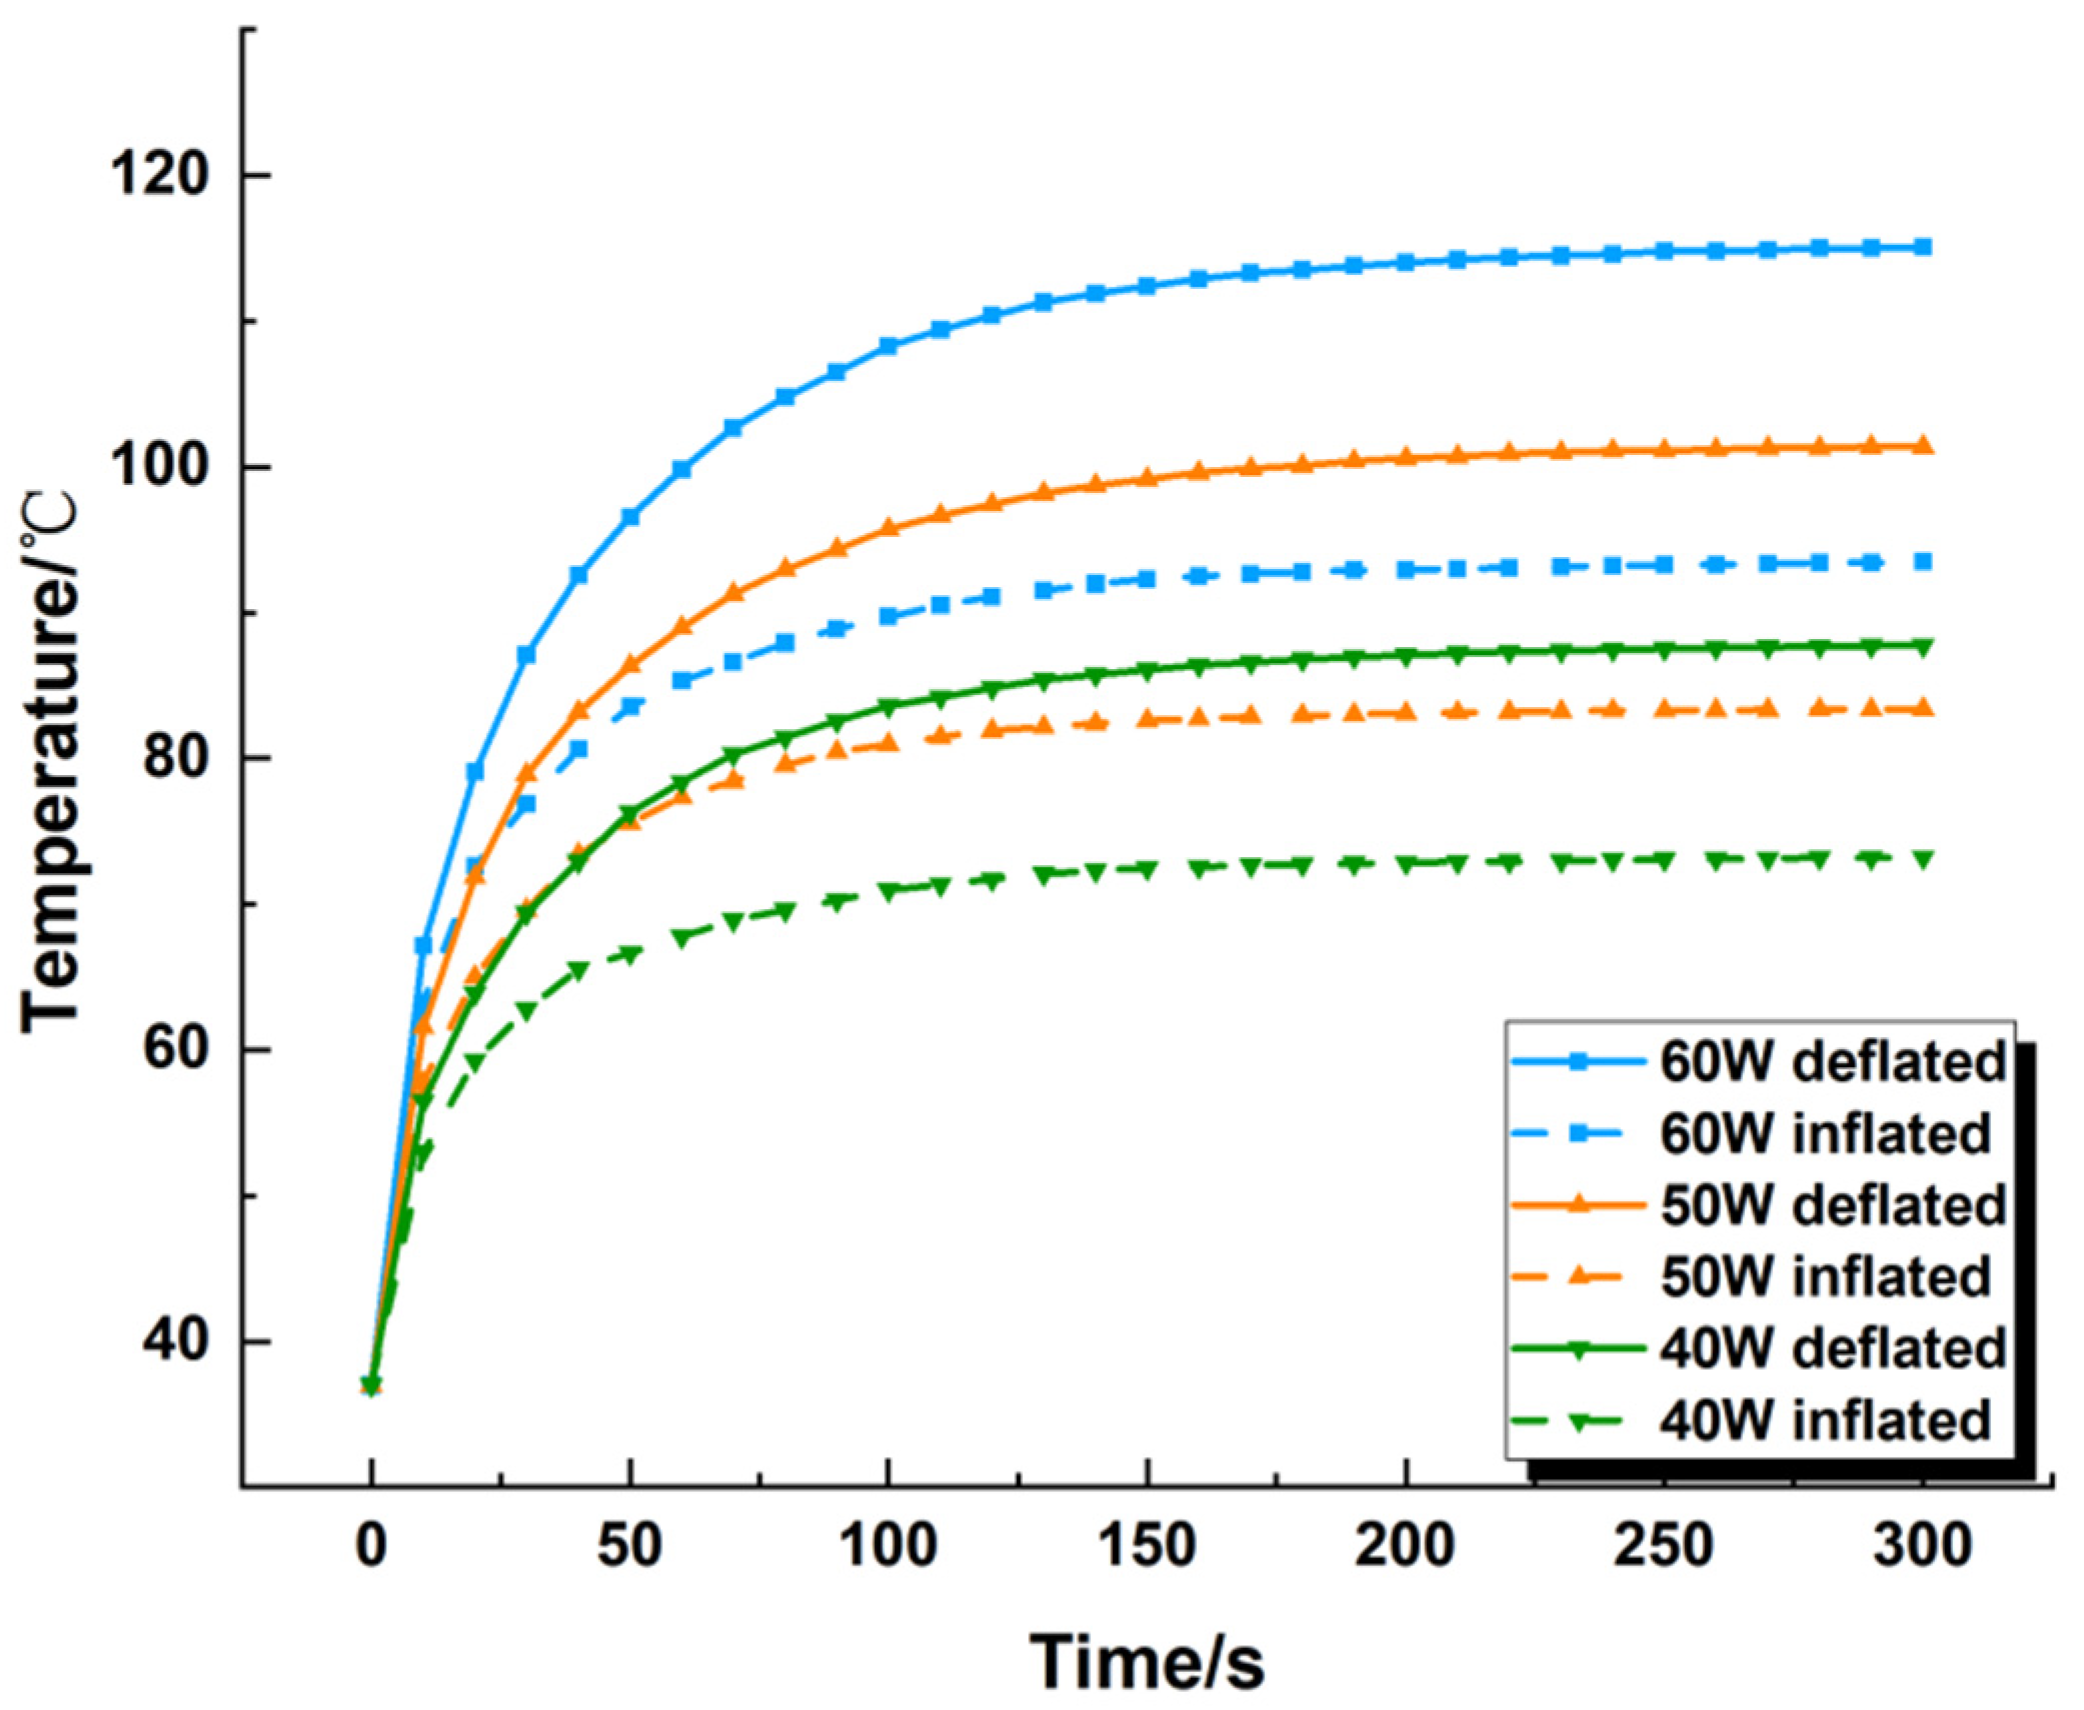
36]. Under the same ablation power and time, Dl and Ds of the inflated lung were 7.6–30.9% and 24.5–45.7% smaller than those of the deflated lung, respectively, and the isoperimetric ratio was 0.011–0.097 smaller than deflated group. The maximum temperature and heating rate at different positions of the ablation antenna were also lower than deflated group. In addition, we used the COMSOL Multiphysics software to simulate the microwave ablation of the inflated lung, and obtained similar results to the in vitro experiments, which verified the correctness of the in vitro experiments. Specifically, Dl, Ds and the isoperimetric ratio of the inflated lung are, respectively, 0–7.3%, 15.5–28.0% and 0.059–0.072 smaller than deflated group. This is consistent with the simulation experiment conclusion that inflated lung weakens the microwave ablation effect reported in the literature, which further verifies the correctness of the experiment in this paper [37,38,39].
Compared with RFA, MWA has the advantage of activating multiple microwave antennas, and the synergistic effect of multiple antennas in ablation can effectively expand the volume of the ablation area, solve the ablation deficiency in the treatment of large tumors, and reduce the recurrence rate after ablation [40]. Planché et al. [41] used multi-antenna to ablate pig lungs in vivo experiments. When the ablation power was 60 W, the ablation time was 10 min, and three antennas were used for ablation, the average longitudinal diameter was 43.0 mm ± 7.7 mm, and the transverse diameter was 54.8 mm ± 8.5 mm, and the isoperimetric ratio was 0.70 ± 0.10. Compared with single-antenna ablation under the same conditions, the average longitudinal diameter is increased by about 20%, the average transverse diameter is increased by about 67.5%, and the isoperimetric ratio is increased by about 9%. It can be seen that multi-antenna ablation can produce a larger volume of ablation and a higher isoperimetric ratio. However, when three-antenna ablation was used, and the power and ablation time were increased to 75 W and 15 min, two animals died of heart failure due to carbonization of lung tissue and myocardial burn, so the use of multi-antenna ablation in clinical treatment must comprehensively consider ablation power and time. Cazzato et al. [42] studied the shape and volume of the ablation area obtained by multi-antenna microwave ablation of liver tumors. For tumors larger than 3 cm in diameter, three-antenna ablation was used, and tumors with a diameter of 2–3 cm were ablated with dual antennas. 65 W, ablation time 10 min, antenna spacing 2 cm. The results showed that the average ablation volume after three-antenna ablation was 3 times that of the two-antenna ablation, and the three-antenna ablation had higher sphericity, it was more suitable for treating liver tumors larger than 3 cm in diameter. In conclusion, under the conditions of reasonable ablation power and ablation time, compared with single-antenna ablation, multi-antenna ablation can produce a larger ablation area, and the ablation area have higher sphericity, so it is more suitable for treating large tumor. However, there is currently less experience using multi-antenna ablation in clinical treatment, and further scientific research is still needed.
There are certain differences between in vivo and in vitro. Lung is a porous tissue consisting of millions of tiny alveoli and air sacs, and air inhalation and exhalation occur all the time. To obtain more accurate simulation results, it is necessary to consider the distribution of alveoli and capillaries and other factors, this will be a daunting challenge in finite element simulation experiments. The simulation model in this paper simply treats lung tissue as a homogeneous material, which has certain limitations. These questions need to be further investigated through complementary experiments and more theoretical studies.
In this study, microwave ablation in vitro experiments and simulation experiments were established to study the effect of lung tissue inflated on the ablation area, although there are some differences between the in vitro experiments and simulation results, the effect of inflated lung on the ablation area is still similar, which is expected to provide reference for future clinical medicine and simulation experiments.

Author Contributions

H.H. conceptualization, investigation, performed the experiments, data analysis, writing—original manuscript preparation, review and editing; Q.N. supervision, conceptualization, investigation, project administration, funding acquisition, visualization, validation, writing—review and editing; Z.T. conceptualization, review of the manuscript; X.G. conceptualization, review of the manuscript. All authors have read and agreed to the published version of the manuscript.

Funding

This research was funded by the National Natural Science Foundation of China (31771021, 11832003), Beijing Municipal Natural Science Foundation (3162006) and Jiangsu Science and Technology Department (Jiangsu Science and Technology Committee) (BE2017758).

Institutional Review Board Statement

Not applicable.

Informed Consent Statement

Not applicable.

Conflicts of Interest

The authors declare no conflict of interest.

References

  1. Bray, F.; Ferlay, J.; Soerjomataram, I.; Siegel, R.L.; Torre, L.A.; Jemal, A. Global cancer statistics 2018: GLOBOCAN estimates of incidence and mortality worldwide for 36 cancers in 185 countries. CA Cancer J. Clin. 2018, 68, 394–424. [Google Scholar] [CrossRef] [PubMed] [Green Version]
  2. Alexander, E.; Dupuy, D. Lung Cancer Ablation: Technologies and Techniques. Semin. Intervent. Radiol. 2013, 30, 141–150. [Google Scholar] [CrossRef] [PubMed] [Green Version]
  3. Gao, X.; Chen, S.L.; Cheng, Y.Y.; Tian, Z.; Geng, B.H.; Nan, Q. Temperature field of microwave ablation of rabit lung tumors based on CT. Beijing Biomed. Eng. 2020, 39, 372–379. (In Chinese) [Google Scholar]
  4. Hu, H.; Tian, Z.; Nan, Q. Research status of influence factors in therapeutic effect of microwave ablation for lung tumors. Beijing Biomed. Eng. 2020, 39, 643–649. (In Chinese) [Google Scholar]
  5. Gao, X.; Tian, Z.; Cheng, Y.; Geng, B.; Chen, S.; Nan, Q. Experimental and numerical study of microwave ablation on ex-vivo porcine lung. Electromagn. Biol. Med. 2019, 38, 249–261. [Google Scholar] [CrossRef]
  6. Nour-Eldin, N.-E.A.; Exner, S.; Al-Subhi, M.; Naguib, N.N.N.; Kaltenbach, B.; Roman, A.; Vogl, T.J. Ablation therapy of non-colorectal cancer lung metastases: Retrospective analysis of tumour response post-laser-induced interstitial thermotherapy (LITT), radiofrequency ablation (RFA) and microwave ablation (MWA). Int. J. Hyperth. 2017, 33, 820–829. [Google Scholar] [CrossRef]
  7. Chen, K.; Fang, Z.T. Application and prospect of thermal ablation in treatment of lung cancer. Dep. Interv. Radiol. 2019, 7, 126–129. (In Chinese) [Google Scholar]
  8. Ye, X.; Fan, W.; Wang, H.; Wang, J.; Wang, Z.; Gu, S.; Feng, W.; Zhuang, Y.; Liu, B.; Li, X.; et al. Expert consensus workshop report: Guidelines for thermal ablation of primary and metastatic lung tumors (2018 edition). J. Cancer Res. Ther. 2018, 14, 730–744. [Google Scholar] [CrossRef] [PubMed]
  9. Fu, T.Y.; Li, Q.; Liu, D.; Ai, D.; Song, H.; Liang, P.; Wang, Y.; Yang, J. Local incompressible registration for liver ablation surgery assessment. Med. Phys. 2017, 44, 5873–5888. [Google Scholar] [CrossRef] [PubMed]
  10. Dupuy, D.E.; Zagoria, R.J.; Akerley, W.; Mayo-Smith, W.W.; Kavanagh, P.V.; Safran, H. Percutaneous radiofrequency ablation of malignancies in the lung. Am. J. Roentgenol. 2000, 174, 57–59. [Google Scholar] [CrossRef] [PubMed]
  11. Aufranc, V.; Farouil, G.; Abdel-Rehim, M.; Smadja, P.; Tardieu, M.; Aptel, S.; Guibal, A. Percutaneous thermal ablation of primary and secondary lung tumors: Comparison between microwave and radiofrequency ablation. Diagn. Interv. Imaging 2019, 100, 781–791. [Google Scholar] [CrossRef] [PubMed]
  12. Yamazaki, N.; Watanabe, H.; Seki, M.; Hoshi, T.; Kobayashi, Y.; Miyashita, T.; Fujie, M.G. Modeling the internal pressure dependence of thermal conductivity and in vitro temperature measurement for lung RFA. In Proceedings of the 2011 Annual International Conference of the IEEE Engineering in Medicine and Biology Society, Boston, MA, USA, 30 August–3 September 2011. [Google Scholar]
  13. Yu, J.; Liang, P. Status and advancement of microwave ablation in China. Int. J. Hyperth. 2017, 33, 278–287. [Google Scholar] [CrossRef]
  14. Sidoff, L.; Dupuy, D.E. Clinical experiences with microwave thermal ablation of lung malignancies. Int. J. Hyperth. 2017, 33, 25–33. [Google Scholar] [CrossRef] [PubMed]
  15. Sharma, A.; Abtin, F.; Shepard, J.A. Image-guided ablative therapies for lung cancer. Radiol. Clin. North Am. 2012, 50, 975–999. [Google Scholar] [CrossRef] [PubMed]
  16. Ryu, S.W.; Pua, U. Update in Percutaneous Lung Ablation. Curr. Radiol. Rep. 2019, 7, 30. [Google Scholar] [CrossRef]
  17. Huang, W.; Ma, Q.S. Application of Microwave Ablation for Lung Cancer. Chin. J. Clin. Thorac. Cardiovasc. Surg. 2015, 22, 265–268. (In Chinese) [Google Scholar]
  18. Vogl, T.J.; Nour-Eldin, N.A.; Albrecht, M.; Kaltenbach, B.; Hohenforst-Schmidt, W.; Lin, H.; Panahi, B.; Eichler, K.; Gruber-Rouh, T.; Roman, A. Thermal ablation of lung tumors: Focus on microwave ablation. RoFo-Fortschr. Geb. Rontgenstrahlen Bildgeb. Verfahr. 2017, 189, 828–843. [Google Scholar] [CrossRef] [Green Version]
  19. Carberry, G.A.; Nocerino, E.; Cristescu, M.M. Microwave ablation of the lung in a porcine model vessel diameter predicts pulmonary artery occlusion. Cardiovasc. Interv. Radiol. 2017, 40, 1609–1616. [Google Scholar] [CrossRef]
  20. Kanehiko, S.; Toshihito, S.; Rinako, T.; Yamashina, M.; Murata, M.; Yamaguchi, T.; Nishio, A.; Okazaki, K. Short term treatment results of local ablation with water-cooled microwave antenna for liver cancer: Comparison with radiofrequency ablation. Mol. Clin. Oncol. 2020, 12, 230–236. [Google Scholar]
  21. Curto, S.; Taj-Eldin, M.; Fairchild, D.; Prakash, P. Microwave ablation at 915 MHz vs. 2.45 GHz: A theoretical and experimental investigation. Med. Phys. 2015, 42, 6152–6161. [Google Scholar] [CrossRef]
  22. Yamazaki, N.; Watanabe, H.; Lu, X.W.; Isobe, Y.; Kobayashi, Y.; Miyashita, T.; Fujie, M.G.; Watanabe, H.; Isobe, Y.; Kobayashi, Y.; et al. The relation between temperature distribution for lung RFA and electromagnetic wave frequency dependence of electrical conductivity with changing a lung’s internal air volumes. In Proceedings of the 35th Annual International Conference of the IEEE Engineering in Medicine and Biology Society (EMBC), Osaka, Japan, 3–7 July 2013; pp. 386–391. [Google Scholar]
  23. Zhao, J.Z.; Wang, J.; Mu, Y.J.; Jin, X.F.; Qian, Z.Y.; Li, W.T.; Liu, J. Analysis of thermal damage parameters in microwave ablation of liver cancer. Beijing Biomed. Eng. 2019, 38, 392–399, 423. (In Chinese) [Google Scholar]
  24. Rubio, M.F.J.C.; López, G.D.G.; Perezgasga, F.V.; García, F.F.; Hernández, A.V.; Salas, L.L. Computer Modeling for Microwave Ablation in Breast Cancer Using a Coaxial Slot Antenna. Int. J. Thermophys. 2015, 36, 2687–2704. [Google Scholar] [CrossRef]
  25. Saito, K.; Taniguchi, T.; Yoshimura, H. Estimaiton of SAR Distribution of a Tip-Split Array Applicator for Microwave Coagulation Therapy Using the Finite Element Method. IEICE Trans. Electron. 2001, E84-C, 948–954. [Google Scholar]
  26. Ma, L.; Paul, D.L. Experimental validation of a combined electromagnetic and thermal FDTD model of a microwave heating process. IEEE Trans. Microw. Theory Tech. 2002, 43, 2565–2572. [Google Scholar]
  27. Saito, K.; Nakayama, O.; Hamada, L.; Ito, K. Analysis of temperature distributions generated by square array applicator composed of coaxial-slot antennas for hyperthermia. Electron. Commun. Jpn. 2010, 84, 20–29. [Google Scholar] [CrossRef]
  28. Pennes, H.H. Analysis of tissue and arterial blood temperatures in the resting human forearm. J. Appl. Physiol. 1998, 85, 5–34. [Google Scholar] [CrossRef]
  29. Vogl, T.J.; Nour-Eldin, N.E.A.; Hammerstingl, R.M.; Panahi, B.; Naguib, N.N.N. Microwave Ablation (MWA): Basics, Technique and Results in Primary and Metastatic Liver Neoplasms—Review Article. RoFo-Fortschr. Geb. Rontgenstrahlen Bildgeb. Verfahr. 2017, 189, 1055–1066. [Google Scholar] [CrossRef] [Green Version]
  30. Santos, R.S.; Gan, J.; Ohara, C.J.; Daly, B.; Ebright, M.; Desimone, M.; Fernando, H.C. Microwave Ablation of Lung Tissue: Impact of Single-Lung Ventilation on Ablation Size. Ann. Thorac. Surg. 2010, 90, 1116–1119. [Google Scholar] [CrossRef]
  31. Meram, E.; Longhurst, C.; Brace, C.L.; Laeseke, P.F. Comparison of Conventional and Cone-Beam CT for Monitoring and Assessing Pulmonary Microwave Ablation in a Porcine Model. J. Vasc. Interv. Radiol. 2018, 29, 1447–1454. [Google Scholar] [CrossRef]
  32. Yang, D.; Cao, M. Effect of changes in lung physical properties on microwave ablation zone during respiration. Biomed. Eng. Lett. 2020, 10, 285–298. [Google Scholar] [CrossRef]
  33. Nan, Q.; Guo, X.M.; Zhai, F.; Wang, S.N. Effect of the Blood Vessel on the Microwave Ablation Temperature Field of Liver. J. Beijing Univ. Technol. 2014, 40, 1917–1922. (In Chinese) [Google Scholar]
  34. Deshazer, G.; Merck, D.; Hagmann, M.; Dupuy, D.E.; Prakash, P. Physical modeling of microwave ablation zone clinical margin variance. Med. Phys. 2016, 43, 1764. [Google Scholar] [CrossRef] [PubMed]
  35. Katsuyama, Y.; Yamazaki, N.; Kobayashi, Y.; Hoshi, T.; Miyashita, T. A study on estimation of the deformation behavior in the collapse process of lung. In Proceedings of the Annual International Conference of the IEEE Engineering in Medicine and Biology Society, San Diego, CA, USA, 28 August–1 September 2012. [Google Scholar]
  36. Yang, D. Research on Microwave Hyperthermia Planning System; Changchun University of Science and Technology: Changchun, China, 2020. [Google Scholar]
  37. Singh, S.; Melnik, R. Thermal ablation of biological tissues in disease treatment: A review of computational models and future directions. Electromagn. Biol. Med. 2020, 39, 49–88. [Google Scholar] [CrossRef] [PubMed]
  38. Radmilović, R.M.; Sabo, M.; Prnova, M.; Šoltes, L.; Radjenović, B. Finite Element Analysis of the Microwave Ablation Method for Enhanced Lung Cancer Treatment. Cancers 2021, 13, 3500. [Google Scholar] [CrossRef] [PubMed]
  39. Marwa, S.; Abdul, A.B.D.; Hafedh, B. Numerical Analysis of Human Cancer Therapy Using Microwave Ablation. Appl. Sci. 2019, 10, 211. [Google Scholar]
  40. Wright, A.S.; Lee, F.T.; Mahvi, D.M. Hepatic microwave ablation with multiple antennae results in synergistically larger zones of coagulation necrosis. Ann. Surg. Oncol. 2003, 10, 275–283. [Google Scholar] [CrossRef]
  41. Planché, O.; Teriitehau, C.; Boudabous, S.; Robinson, J.M.; Rao, P.; Deschamps, F.; Farouil, G.; De Baere, T. In vivo evaluation of lung microwave ablation in a porcine tumor mimic model. Cardiovasc. Interv. Radiol. 2013, 36, 221–228. [Google Scholar] [CrossRef]
  42. Cazzato, R.L.; DeMarini, P.; Leclerc, L.; Dalili, D.; Koch, G.; Rao, P.; Auloge, P.; Garnon, J.; Gangi, A. Large nearly spherical ablation zones are achieved with simultaneous multi-antenna microwave ablation applied to treat liver tumours. Eur. Radiol. 2020, 30, 971–975. [Google Scholar] [CrossRef]
Figure 1. Distribution map of microwave antennas and temperature measurement points.
Applsci 12 05916 g001
Figure 2. Distribution map of microwave antennas and temperature measurement points 3D diagram.
Applsci 12 05916 g002
Figure 3. Microwave antenna model.
Applsci 12 05916 g003
Figure 4. Two-dimensional lung tissue model.
Applsci 12 05916 g004
Figure 5. Average long diameter.
Applsci 12 05916 g005
Figure 6. Average short diameter.
Applsci 12 05916 g006
Figure 7. Temperature curve of lung tissue at different locations of slot. (a) antenna slot (b) 5 mm away from the slot (c) 10 mm away from the slot (d) 15 mm away from the slot).
Applsci 12 05916 g007
Figure 8. Thermal field distribution of microwave ablation Power = 40 W, (a) inflated group; (b) deflated group.
Applsci 12 05916 g008
Figure 9. Thermal field distribution of microwave ablation (Power = 50 W, (a) inflated group; (b) deflated group).
Applsci 12 05916 g009
Figure 10. Thermal field distribution of microwave ablation (Power = 60 W, (a) inflated group; (b) deflated group).
Applsci 12 05916 g010
Figure 11. Temperature curve at the slot of microwave antenna.
Applsci 12 05916 g011
Table 1. Performance parameters of microwave ablation system.
Performance ParametersValue
Ambient temperature/°C5~40
ambient humidity/%≤80
supply voltage/V220 ± 22
Microwave operating frequency/MHz2450 ± 50
Microwave ablation power/W0~120
Microwave output working time/min0~30
Table 2. Size of microwave antenna.
PropertyValue
Diameter of the central conductor0.29 mm
Inner diameter of the outer conductor0.94 mm
Outer diameter of the outer conductor1.19 mm
Diameter of catheter1.79 mm
Table 3. Physical parameters of lung tissue in deflated group.
Physical ParametersValue
Density kg/m3480
thermal conductivity W/(m·K)0.39
Specific heat capacity J/(kg·K)3886
Relative permittivity33
electrical conductivity S/m0.804
Table 4. Physical parameters of lung tissue in inflated group.
Physical ParametersValue
Density kg/m3394
thermal conductivity W/(m·K)0.16
Specific heat capacity J/(kg·K)2500
Relative permittivity20.47
electrical conductivity S/m0.306
Table 5. Experimental data (ablation power 40 W).
Time/sDl/mmDs/mm
DeflatedInflatedDeflatedInflated
10022.0 ± 0.516.8 ± 0.516.5 ± 0.811.7 ± 0.5
20025.6 ± 0.921.2 ± 0.618.3 ± 2.114.7 ± 0.5
30028.4 ± 1.323.5 ± 1.523.2 ± 1.416.4 ± 2.1
Table 6. Experimental data (ablation power 50 W).
Time/sDl/mmDs/mm
DeflatedInflatedDeflatedInflated
10026.8 ± 2.722.5 ± 1.620.4 ± 1.014.0 ± 0.6
20031.1 ± 1.328.9 ± 1.625.7 ± 1.518.4 ± 2.4
30035.8 ± 3.129.2 ± 2.427.9 ± 1.621.2 ± 1.1
Table 7. Experimental data (ablation power 60 W).
Time/sDl/mmDs/mm
DeflatedInflatedDeflatedInflated
10029.4 ± 3.226.5 ± 1.421.0 ± 1.616.5 ± 1.7
20034.9 ± 2.631.6 ± 2.126.2 ± 2.618.5 ± 2.6
30039.4 ± 2.532.9 ± 3.232.3 ± 5.422.6 ± 3.4
Table 8. Isoperimetric ratio of ablation area in each group.
Time/s40 W50 W60 W
DeflatedInflatedDeflatedInflatedDeflatedInflated
1000.9080.8790.9120.8370.8890.836
2000.8890.8780.9410.8490.9080.811
3000.9370.8800.9210.8950.9390.874
Table 9. Simulation data (ablation power 40 W).
Time/sDl/mmDs/mm
DeflatedInflatedDeflatedInflated
10036.135.022.518.3
20039.937.826.120.9
30041.138.327.421.4
Table 10. Simulation data (ablation power 50 W).
Time/sDl/mmDs/mm
DeflatedInflatedDeflatedInflated
10041.240.725.120.9
20045.143.429.023.7
30045.944.230.324.4
Table 11. Simulation data (ablation power 60 W).
Time/sDl/mmDs/mm
DeflatedInflatedDeflatedInflated
10044.944.926.823.2
20048.948.131.326.4
30050.948.732.927.2
Table 12. Isoperimetric ratio of ablation area.
Time/s40 W50 W60 W
DeflatedInflatedDeflatedInflatedDeflatedInflated
1000.8360.7650.8270.7570.8190.760
2000.8550.7880.8490.7830.8470.785
3000.8630.7920.8590.7870.8510.792
Publisher’s Note: MDPI stays neutral with regard to jurisdictional claims in published maps and institutional affiliations.

