Article

Energy Efficiency Improvement of Diesel–Electric Trains Using Solar Energy: A Feasibility Study

1
Technological Institute for Industrial Maintenance, Cegep of Sept-Îles, Sept-Îles, QC G4R 5B7, Canada
2
Energy Intelligence Research and Innovation Center, Cegep of Sept-Îles, Sept-Îles, QC G4R 5B7, Canada
3
Wind Energy Laboratory, University of Quebec in Rimouski, Rimouski, QC G5L 3A1, Canada
4
Quebec Maritime Institute, Rimouski, QC G5L 4B4, Canada
*
Author to whom correspondence should be addressed.
Appl. Sci. 2022, 12(12), 5869; https://doi.org/10.3390/app12125869
Submission received: 24 May 2022 / Revised: 3 June 2022 / Accepted: 6 June 2022 / Published: 9 June 2022
(This article belongs to the Special Issue Electric Power Applications)

Abstract

:
Nowadays, productivity challenges in modern manufacturing systems have been the driving force in generating energy-efficient technologies in every industry, including diesel–electric locomotives. The diesel–electric locomotive is one of the most widely used methods in rail transportation, especially in North America. More precisely, the evolution of the electric transmission has allowed the locomotive’s effective tractive effort to increase its diesel engine horsepower. In this paper, we study a new way to improve the energy efficiency of diesel–electric trains using photovoltaic solar panels. This solution is suitable for reducing greenhouse gas emissions of the diesel–electric locomotive system, particularly in cold climates. We explore the amount of energy produced by the PV solar panels and compare it with that produced by the auxiliary diesel-generator during a train’s journey. This comparison clarifies the actual percentage of energy that solar panels can cover. Thus, this paper presents a validation of feasibility and profitability as a function of the train’s specific operating conditions and the meteorological data associated with their routes. Based on the results, the minimum annual fuel reduction of auxiliary generators allowed using PV solar panels is above 50% in all cases and wagon classes, proving this solution’s feasibility. Regarding the comparison, case 3 (Sept-Îles to Schefferville) and case 4 (Luxor to Aswan) are the best, with over 100% of the energy provided by PV solar panels in all the wagons’ classes. The payback period ranges from 2.5 years to 9.1 years, while the CO2 emission reduction’s revenues range from $460 to $998 per year/wagon.

1. Introduction

Worldwide, energy consumption is a central issue of economic activity. Over the past few months, the COVID-19 pandemic has caused an unprecedented global economic and social crisis. The pandemic has significantly affected all aspects of life, including the energy sector [1]. Due to the pandemic, many governmental decisions were made, such as the imposition of lockdowns worldwide which decimated transport-related demand. Associated events led to an unprecedented collapse in oil demand and, therefore, a drop in the global energy demand, with a rate of 4.5–6% in 2020 relative to 2019 [2,3]. Indeed, recently, the statistical review of world energy in 2021 affirms that the carbon emissions from energy use were falling by over 6% in 2020. However, there are worrying signs that the COVID-induced dip in carbon emissions and the energy demand will be short-lived as the world economy recovers and lockdowns are lifted [3].
Regardless of the lower energy demand in 2020, renewable energy, led by wind and solar, continued to grow. In 2020, renewable energy posted a record increase in production, by 358 TWh compared to 2019 [3]. Moreover, this increase is comparable to those seen in 2017, 2018, and 2019. Thus, we noticed a relative immunity of renewable energy growth to the world political and health issue events in the last years. Remarkably, PV solar capacity in both ‘OnGrid’ and ‘OffGrid’ increased over time and reached around 710 GW and 4 GW, respectively, in 2020 as we can see in Table 1. Furthermore, there was a 125.8 GW and 0.234 GW increase in installed capacity from 2019 to 2020. Therefore, renewable energy has formed a crucial part of any viable solution to reduce primary energy consumption over the last years [4,5,6].
In general, renewable energy share, the energy intensity of gross domestic product, and the electrification of final uses of energy have all shown improvements in recent years. Yet, the pace is insufficient to put the world on track to meet the Paris agreement (COP21) goals. This international climate conference marks a turning point in the fight against global warming. It commits all countries to reducing greenhouse gas emissions and keep warming below 2 °C and, preferably, below 1.5 °C by 2100 [7].
Considering ample resource availability, significant market potential, and cost competitiveness, PV solar panels are expected to continue driving overall renewables’ growth in several regions over the next decade. From today’s levels, IRENA’s analysis shows that solar PV power installations could grow almost four-fold over the next ten years, reaching a cumulative capacity of 2840 GW globally by 2030 and rising to 8519 GW by 2050. This growth implies that the total installed capacity in 2050 will be almost twelve times higher than 2020. Around 60% of total solar PV capacity in 2050 would be utility-scale globally, with the remaining 40% distributed (rooftop) [8]. Thus, to achieve the goal by 2050, the use of PV solar panels must increase enormously in all end-use sectors.
One of these sectors is the transport sector, the second-largest energy consumer after the industrial sector, with a rating factor of 14% of global energy consumption [9,10]. The transport sector is divided into six principal modes: road, maritime, air, rail, intermodal, and pipeline [11]. Our study in this paper focuses on using PV solar panels in the rail mode, mainly in diesel–electric trains.
Rail is responsible for 9% of global motorized passenger movement and 7% of freight [12]. Since 2017, rail-based transport on an electric network has been a relatively low carbon dioxide emission and so-called ‘green transport’ mode, compared with other means of transport (such as planes and cars/trucks) [13]. On the other hand, rail-based primary fuel constitutes an essential reason for the growth of CO2 emissions globally [14]. Therefore, typically, installing PV solar panels in the rail sector improves energy-savings and emissions reduction in the rail sector, especially those based on primary fuel, and is a step forward to achieving the goal in 2050, mentioned previously.
It is essential to note that railway transport has improved in energy efficiency from 1990 to 2014: 13% less energy is required to move a passenger 1 km and 19% less energy to move a ton load 1 km. As a result, from 1990 to 2009, total CO2 emissions from the European railways were reduced by 32%. The passenger-specific emissions (per passenger-km) were reduced by 20% and freight-specific emissions (per ton-km) by 38% [15]. However, this is not yet enough, because the International Union of Railways (UIC) and Canadian Electrical Raceways (CER) have already established a new target for 2030. The UIC studied and documented the feasibility of the 2030 targets in the technical report “Moving towards Sustainable Mobility: European Rail Sector Strategy 2030 and beyond”. The targets were set in December 2010 by the UIC and CER. Since 2011, the progress toward the 2030 targets has been monitored and reported on yearly by the UIC (technical document: “Monitoring report to 2020–2030 UIC/CER strategy targets”) [16].
The new recommendations were as follows:
  • Reduce the specific final energy consumption from train operations by 30% compared to 1990.
  • Reduce the specific average CO2 emissions from train operations by 50% compared to 1990.
The railway sector includes diesel (shown in Figure 1) and electric trains. Although electrified vehicles have been in use in railway applications for over 100 years, trains with energy-independent, diesel-based drives are still primarily used in the world’s railway networks. For example, until 2020, only 38% of the heavy mainline railways in Bretagne were electrified [17]. Therefore, the work to improve the energy efficiency of diesel–electric presents a fundamental challenge in the world, especially in reducing fuel consumption and GHG emissions.
Installation of photovoltaic solar panels on the roof of diesel trains had already begun in 2011. Previously, the profitability calculation was based on the estimation of weather conditions and the theoretical efficiency of solar panels, which led to unsatisfactory results and difficulty in accessing data. The originality of this work is to propose a simple energy approach to calculate the feasibility and profitability of using PV solar panels in diesel–electric trains based on the use of RetScreen software. RetScreen provides easy access to weather conditions associated with the geographical position of the train. In addition, it provides the possibility to the user to select any photovoltaic solar panels and find the actual solar energy produced by the panels.
Moreover, this software can complete feasibility studies by providing technical, financial, and risk analyses related to electricity produced using renewable sources. Nevertheless, in our case studies, the energy produced by PV solar panels will be used to replace the energy produced by the auxiliary generator used to operate the auxiliary equipment. Therefore, the profitability was measured as the percentage of solar energy from the total energy produced by the auxiliary generator of the train, either 0% (the energy produced does not cover anything) or 100% (fully covered). As a result, the RetScreen results are adjusted to the type of application in this study.
This study is divided into six sections. Section 2 presents a brief literature review on using PV solar panels in diesel–electric trains. Section 3 presents the six studied cases of the train’s journey worldwide in different climates. Section 4 describes the methodology to evaluate the feasibility of using a PV solar system on the roof of the trains. Furthermore, it determines the power required to operate the auxiliary electric equipment for each of the wagons’ classes. Section 5 presents the results extracted from RetScreen and the percentage of each wagon’s consumption provided by solar energy, then compares and analyzes the studied cases’ results. Finally, the conclusions are in Section 6.

2. Literature Review on the Use of PV Solar Panels in Diesel-Electric Trains

The Indian train UNESCO became, in 2011, the first diesel–electric train that installed solar photovoltaic (PV) panels on the roofs of its coaches. A 3 kW auxiliary generator and its accessories were removed from the train with this PV system. The generated energy from the solar PV panels is stored in batteries and is used to power seven 6 W LED lights in each of the coaches as well as charging mobile phones during a five-hour journey.
In Australia, solar farms were installed along or near the railway in addition to rooftop solar panels. All generated energy is stored in batteries mounted on the diesel–electric train. The required 0.015 GW power needed to operate the train is generated by 8% from the train’s rooftops, 58% from the solar farm, and 34% from the solar railway panels [19]. Figure 2 shows the UNESCO train [20]. While Figure 3 shows Australia’s train with PV solar panels [21].
After the success of the experimental tests in India and Australia, the train companies started to build solar panels on the tunnels above trains, such as the Belgian tunnel. This solar tunnel connecting Schoten and Brasschaat was the first European tunnel. It comprises 16,000 PV panels, produces about 3.6 GWh, and reduces the annual CO2 emissions by approximately 2500 tons [22]. Figure 4 shows the Belgian solar tunnel [23].
Recently, Kapetanović et al. [24] developed and optimized Lithium-ion battery sizing for a hybrid diesel–electric train to decrease fuel consumption and related emissions. Furthermore, Cipek et al. [25] studied a comparative assessment of traditional diesel–electric and hypothetical battery–electric heavy haul locomotive operations regarding emissions reduction and fuel savings potential. In addition, various tandem locomotive configurations have been proposed and validated. Based on the results, fuel cost savings between 22% and 30% may be achieved. Moreover, according to Alfonso et al., Normanyo et al., and de Almeida et al., PV solar panels, as a well-known asset in renewable structure, have been developed. Solar-powered trains are usually put in motion by placing photovoltaic panels close to or on rail lines. This method could provide several financial advantages by improving the energy efficiency of diesel–electric trains [26,27,28].
With a growing lack of funds and the fact that it is harder to generate sufficient electricity from renewable sources to power the traction system of the trains during the journey, especially in a cold climate, this method remains limited in use. In this paper, and to be more realistic for practical applications, we focus on generating energy for the equipment on board, such as heating and lighting. As such, we are displacing energy otherwise produced using auxiliary diesel generators. The feasibility will, therefore, be assessed as a function of the percentage of displaced energy by the PV solar panels installed on the roof of the trains with different climate conditions. The following sections describe the methodology to evaluate the profitability of using PV solar systems on the roof of the trains and associated opportunities.

3. Case Studies

This section aims to apply the PV solar panels to the train’s roof for the six cases shown in Table 2. The first three cases are in cold climate zones, while the last three are in hot climate regions. The feasibility and electricity production by PV solar panels strongly depends on the amount of absorbed light and less on the ambient temperature. The main difference between the cases is, thus, the local solar resource, and its influence appears under the term “Capacity factor” in RetScreen. The other difference between the studied cases is the annual energy consumed by the auxiliary generator. That depends on the travel duration, the number of trips per year, and the type of train wagons. Table 2 shows the characteristics of each case.
As seen in Table 2, we consider three factors: the local solar and meteorological conditions, each travel duration, and the number of trips per week. Unfortunately, detailed data on the wagons’ types for each case are unavailable. Therefore, we consider three wagon categories depending on the service quality offered to passengers, which affects the energy consumed by the auxiliary equipment in the train.
The type of wagon depends on each car’s electrical equipment, and is different for every class. The electrical equipment’s electricity consumption for each class is shown in Table 3 [31].
Table 3 shows the power consumption consumed for each class of wagons. The total values are equal to 4815 W, 3605 W, and 2395 W for the first class, second class, and third class, respectively. Next, we calculate each case’s annual energy consumed per wagon based on each travel duration and the number of trips per week (Table 4).
As seen in Table 4, the annual energy consumed increases significantly when we pass from the third class to the first class. On the other hand, case 2 has the highest energy consumed per year, while case 3 has the lowest energy consumed per year. This result is related to the multiplication of each travel’s duration by the number of trips per week.

4. Methodology

This study evaluates six train journeys worldwide and under various climate conditions. The goal is to analyze the energy and financial profitability of installing PV solar panels on the roof of each the train’s wagons for each of its trips. The PV solar panels are a supplementary source for the auxiliary diesel engine. These provide the train’s auxiliary energy demand, such as the train lighting and operating electric tools such as TV, AC, refrigerators, and charging phones. Consequently, the study will concentrate on how much of the percentage of each wagon’s consumption is provided by solar energy, which depends strongly on the train’s location. The results of this study used RetScreen Expert software. This software is a comprehensive platform that intelligently enables professionals and decision-makers to rapidly identify and assess the viability of potential energy efficiency, renewable energy, and cogeneration projects. Therefore, upon using this program, users will be able to:
  • Quickly gauge a facility’s energy performance using benchmarking and evaluate energy costs and savings, GHG reductions, and financing viability.
  • Determine the energy production and savings potential for any location in the world employing Archetypes.
  • Verify the performance of implemented projects and find opportunities for further energy improvements.
Several parameters were considered for this study in RetScreen, as follows:
  • The type of solar panels (PV) used: Most solar panels on the market today fit into three categories: monocrystalline solar panels, polycrystalline solar panels, and thin-film solar panels. Each of these types has different characteristics. However, according to Sandy [32], the polycrystalline technology panel presents the balance between costs and performance. As a result, their efficiency increased to 18–20% in the last several years.
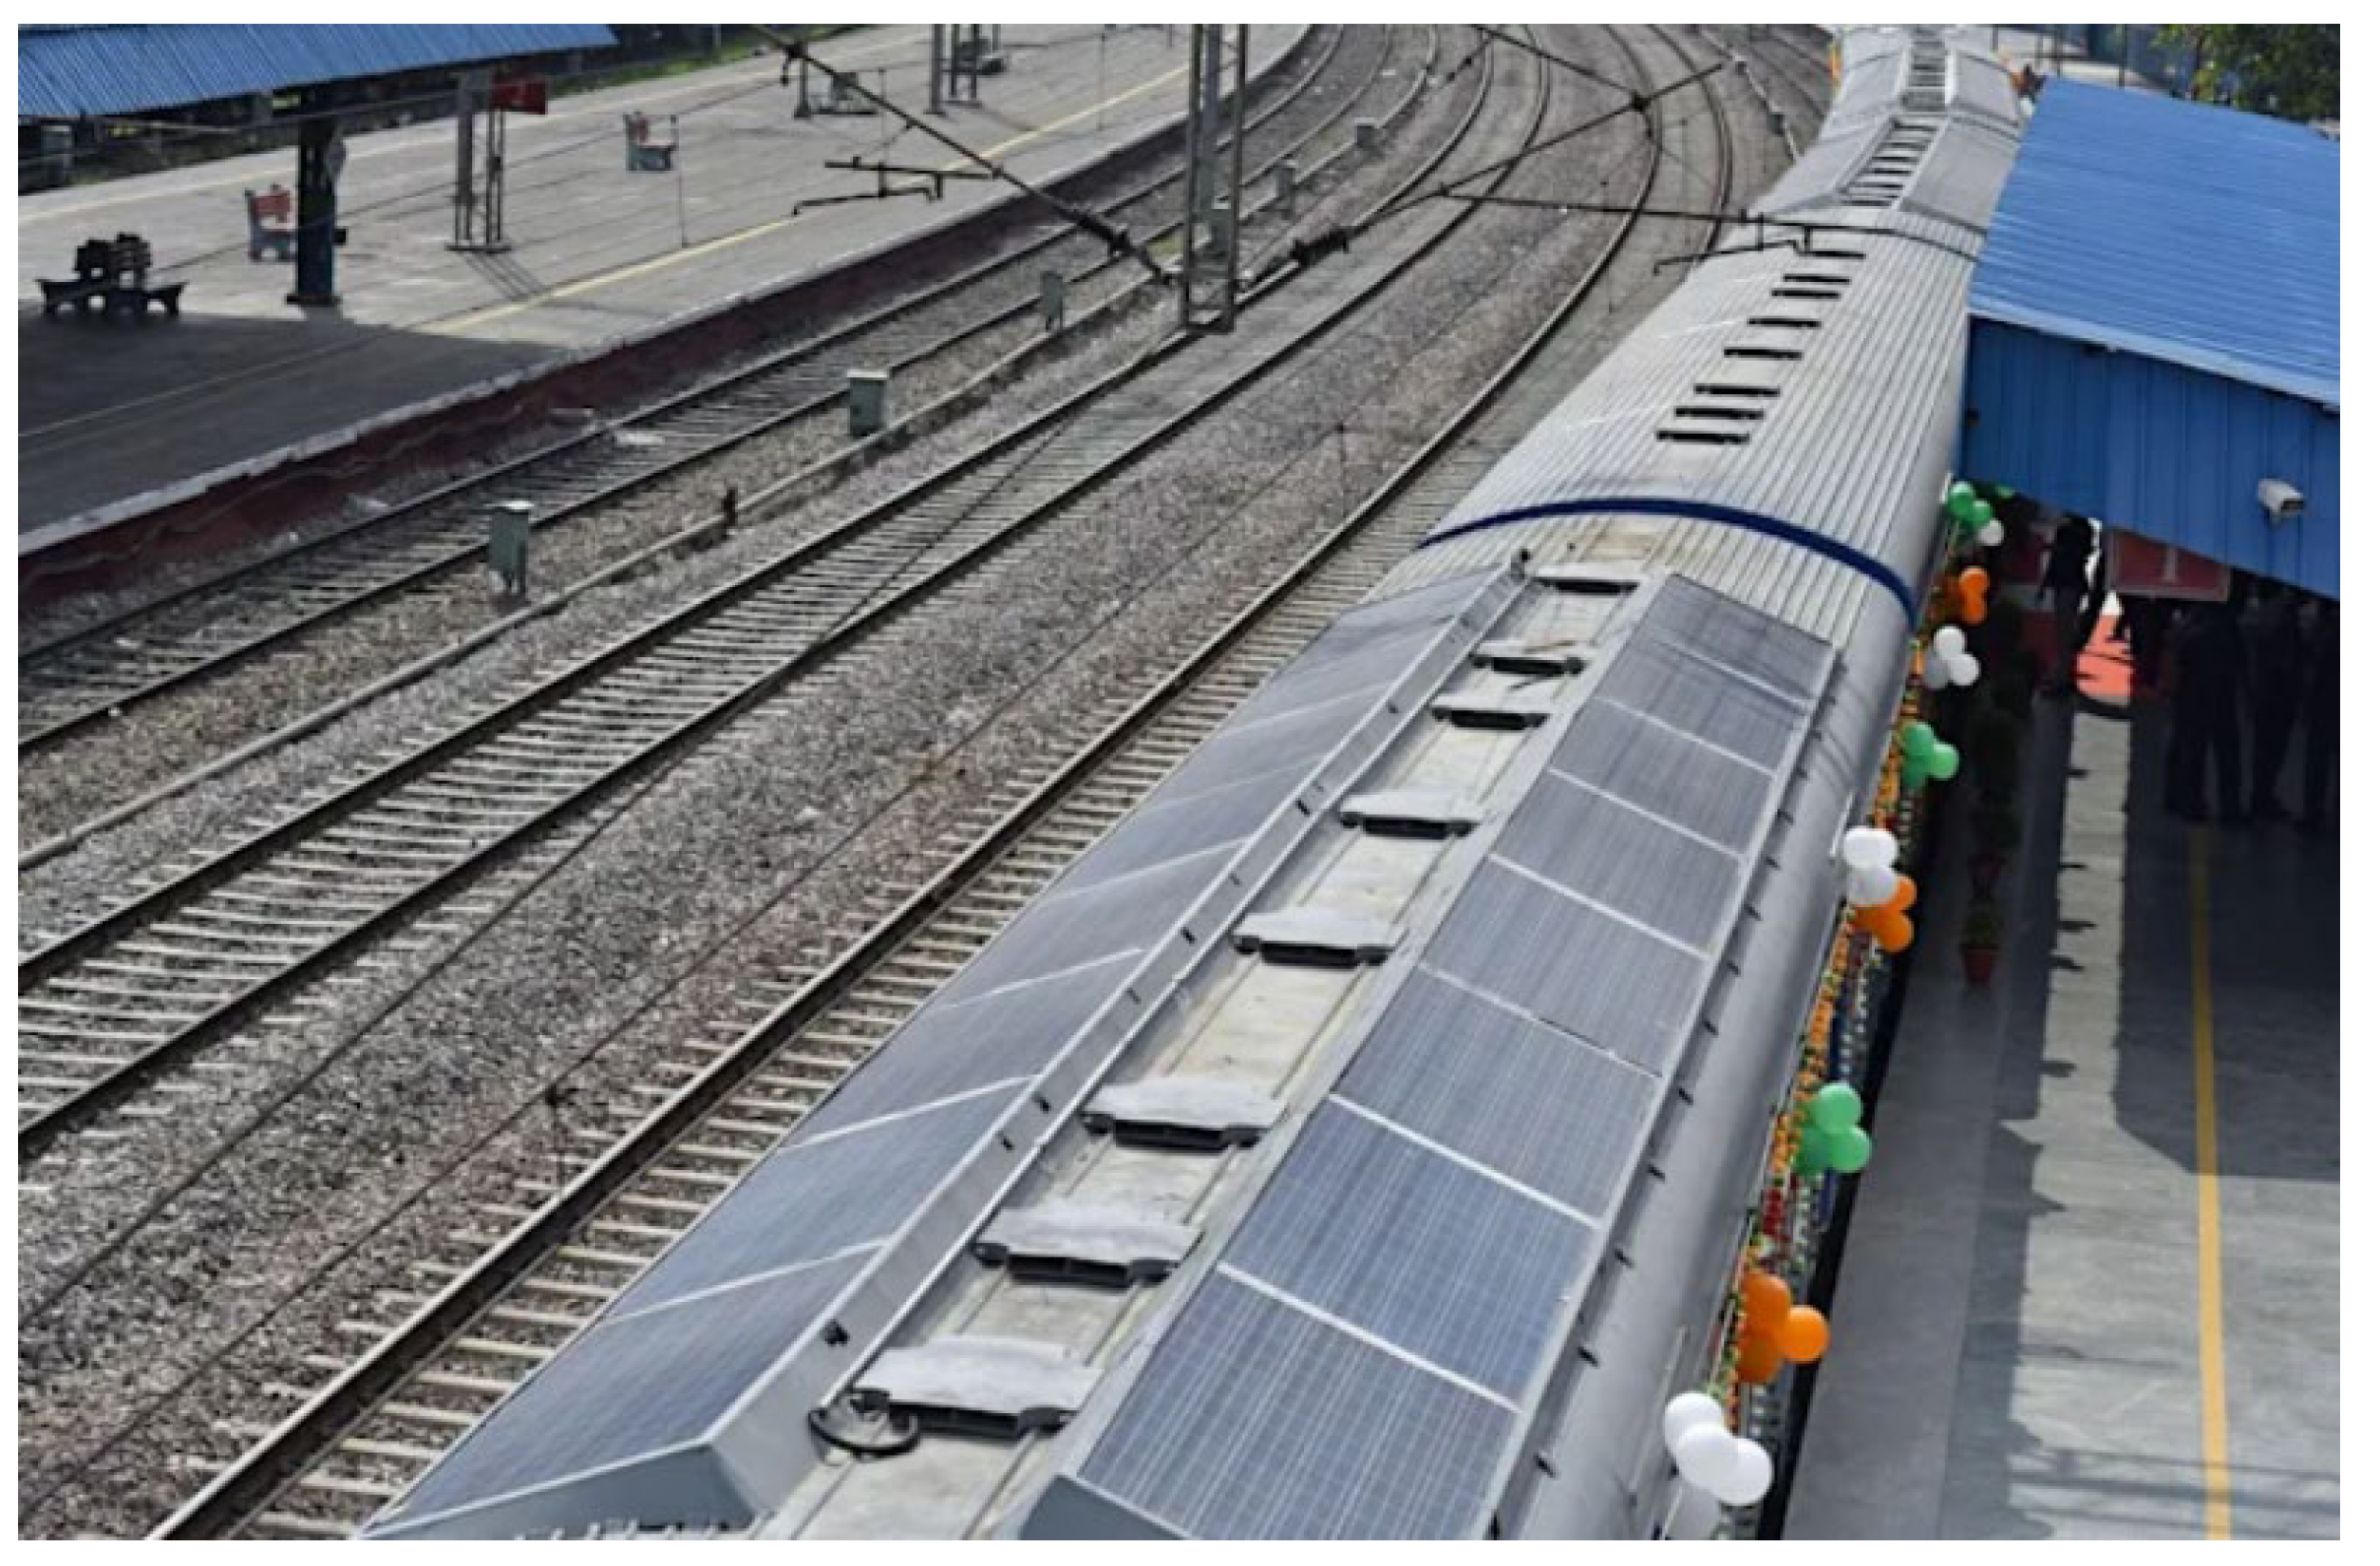
  • The number of PV solar panels used: The solar panels are collections of solar cells. Multiple small solar cells spread over a large area can work together to provide enough power to be helpful. In the case of trains, the amount of energy produced depends on each PV solar panel’s dimension and the available surface atop each wagon. For this study, one type of wagon was used: the 50-feet standard, which means that 54.49 m2 are available on the roof of each train’s wagon [33].
  • The considered losses: Solar energy is subject to multiple losses in the conversion system. The solar panels’ energy reaches the load and the batteries through the charge controller and the inverter. It suffers attenuation in each process whenever it passes through each component. First, solar panels (PV) can convert a small percentage, approximately 18%, of incoming solar energy into electricity. Second, the energy is stored in the solar batteries in the form of chemical energy, which can be used later to run the appliances, when there is no sunlight or during the night. Third, the battery provides energy by converting the stored chemical energy into DC electrical energy, with additional losses in the conversion process. Finally, the DC electrical energy passes through the inverter. The inverter’s essential function converts DC electrical energy into AC electrical energy. Today’s inverters have approximately 99% efficiency in converting DC into AC [34].
  • The investment and O&M costs: The initial cost should include all capitalized preoperative and setup costs, as well as the cost of equipment, land, installation expenses, and EPC charges. At the same time, the O&M costs encompass routine maintenance of the equipment and minor part replacement to ensure maximum electricity generation [35].
  • The financial parameters: Investing in a project requires understanding different economic variables to make an informed decision. Here are a few such variables:
    • Inflation rate (%): The projected annual average inflation rate over the project’s life.
    • Project life (year): The duration over which the project’s financial viability is evaluated.
    • Debt ratio (%): The debt ratio reflects the financial leverage created for a project; the higher the debt ratio, the more significant the financial leverage.
    • Debt interest rate (%): The annual rate of interest paid to the debt holder at the end of each year of the debt term.
    • Debt term (years): The number of years over which the debt is repaid. The debt term is equal to or shorter than the project life [35].
  • The solar electricity price: In general applications, RetScreen uses market electricity price (approximately 0.1 $/kWh) to determine the revenues associated with solar energy production. In this study, the energy produced by the PV solar panels replaces the energy produced by the auxiliary generator. The electricity price is thus considered to be the one produced by a diesel generator at 0.3 $/kWh [36].
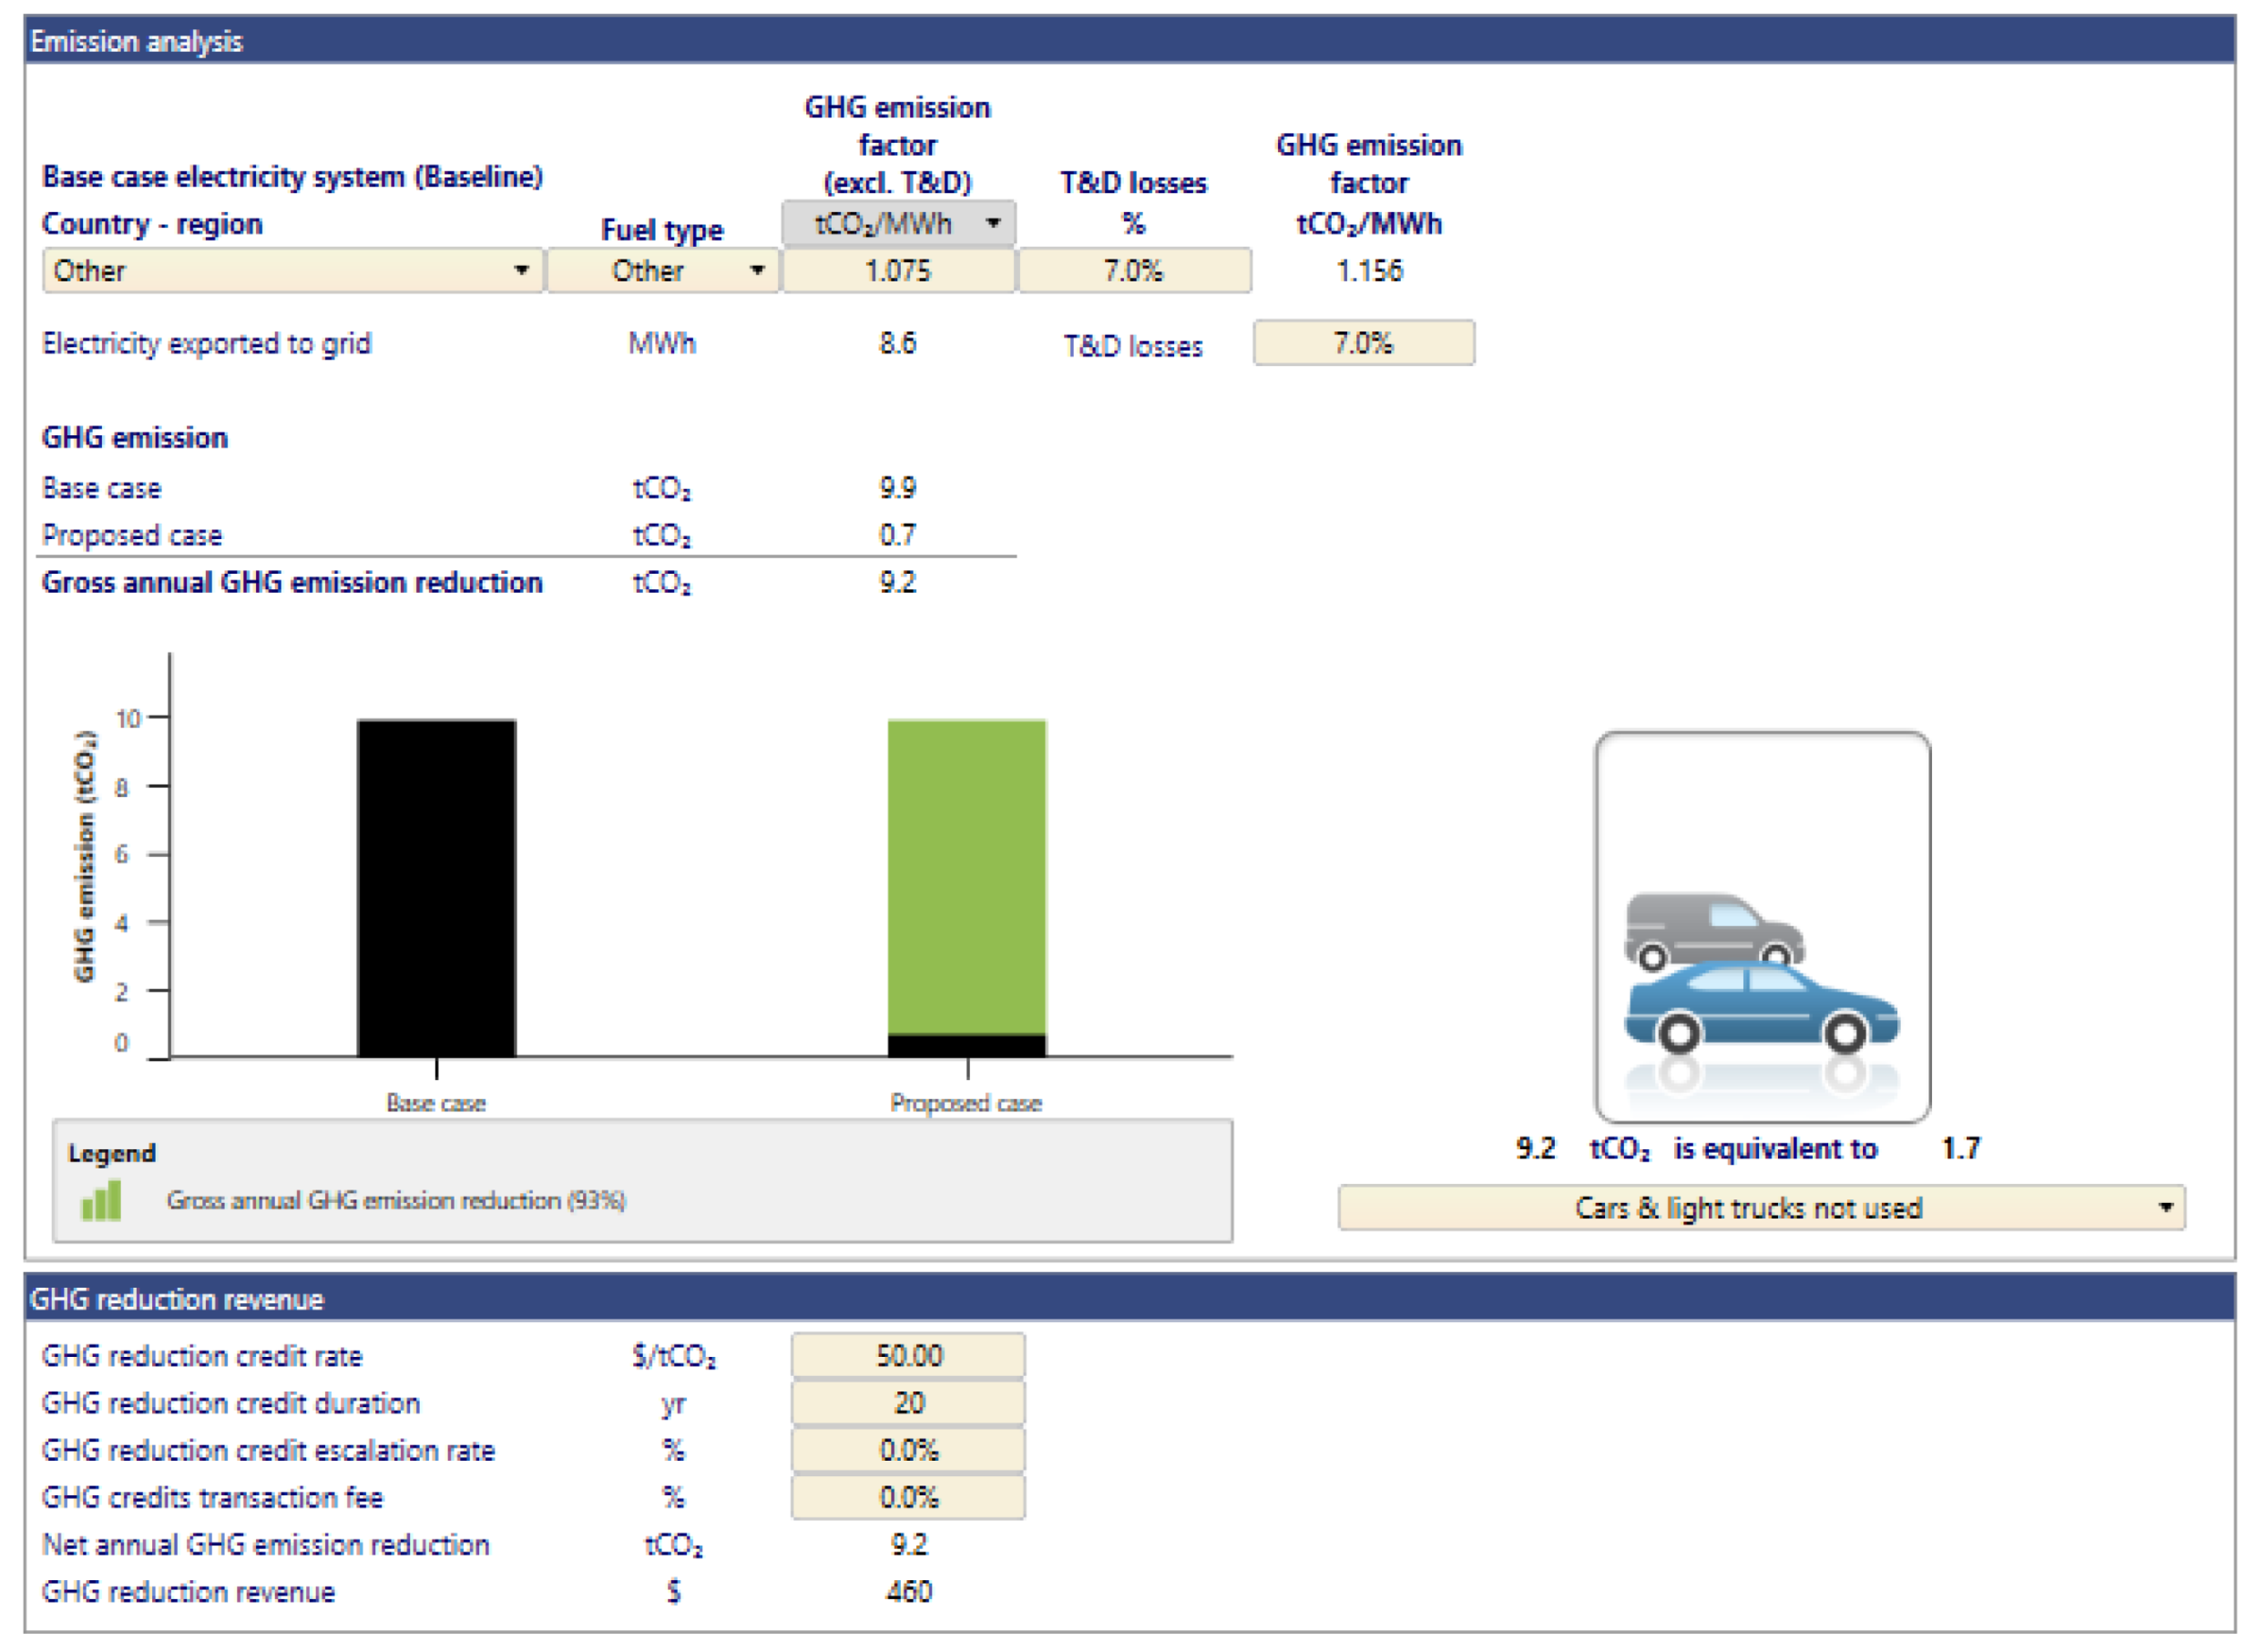
  • The GHG emission parameters: The RetScreen software requires the GHG emission factor (excluding transmission and distribution (T&D) losses) for the alternative electricity source. The units are tons of CO2 per megawatt-hour of end-use electricity delivered (t CO2/MWh). If any, the user enters an optional GHG reduction credit per equivalent ton of CO2 (t CO2). It is used in conjunction with the net GHG reduction to calculate the annual GHG reduction revenue. However, GHG reduction credits’ prices per equivalent ton of CO2 (t CO2) vary widely depending on how the credit is generated and how it will be delivered [37].
The main results from RetScreen used for analysis are: (1) the ROI of the project (equity payback), which represents the length of time that it takes for the owner to recoup its initial investment (equity) out of the project cash flows generated, and (2) GHG emission reduction revenues per year ($). Then, by using a different software tool (Excel), we determine the profitability of using this method for each wagon in terms of annual energy consumption and the percentage of each wagon’s consumption provided by PV solar panels for each studied case. The method and the steps of profitability calculation will be presented in Section 5.1.

5. Results and Discussion

The results of installing PV solar panels on a train’s roof, applied on six train trips, will be presented in this section. This section is divided into two parts:
  • Base case: We use this case for data calibration and validation. This section identifies the user inputs in RetScreen and presents the steps to extract profitability results for each studied case.
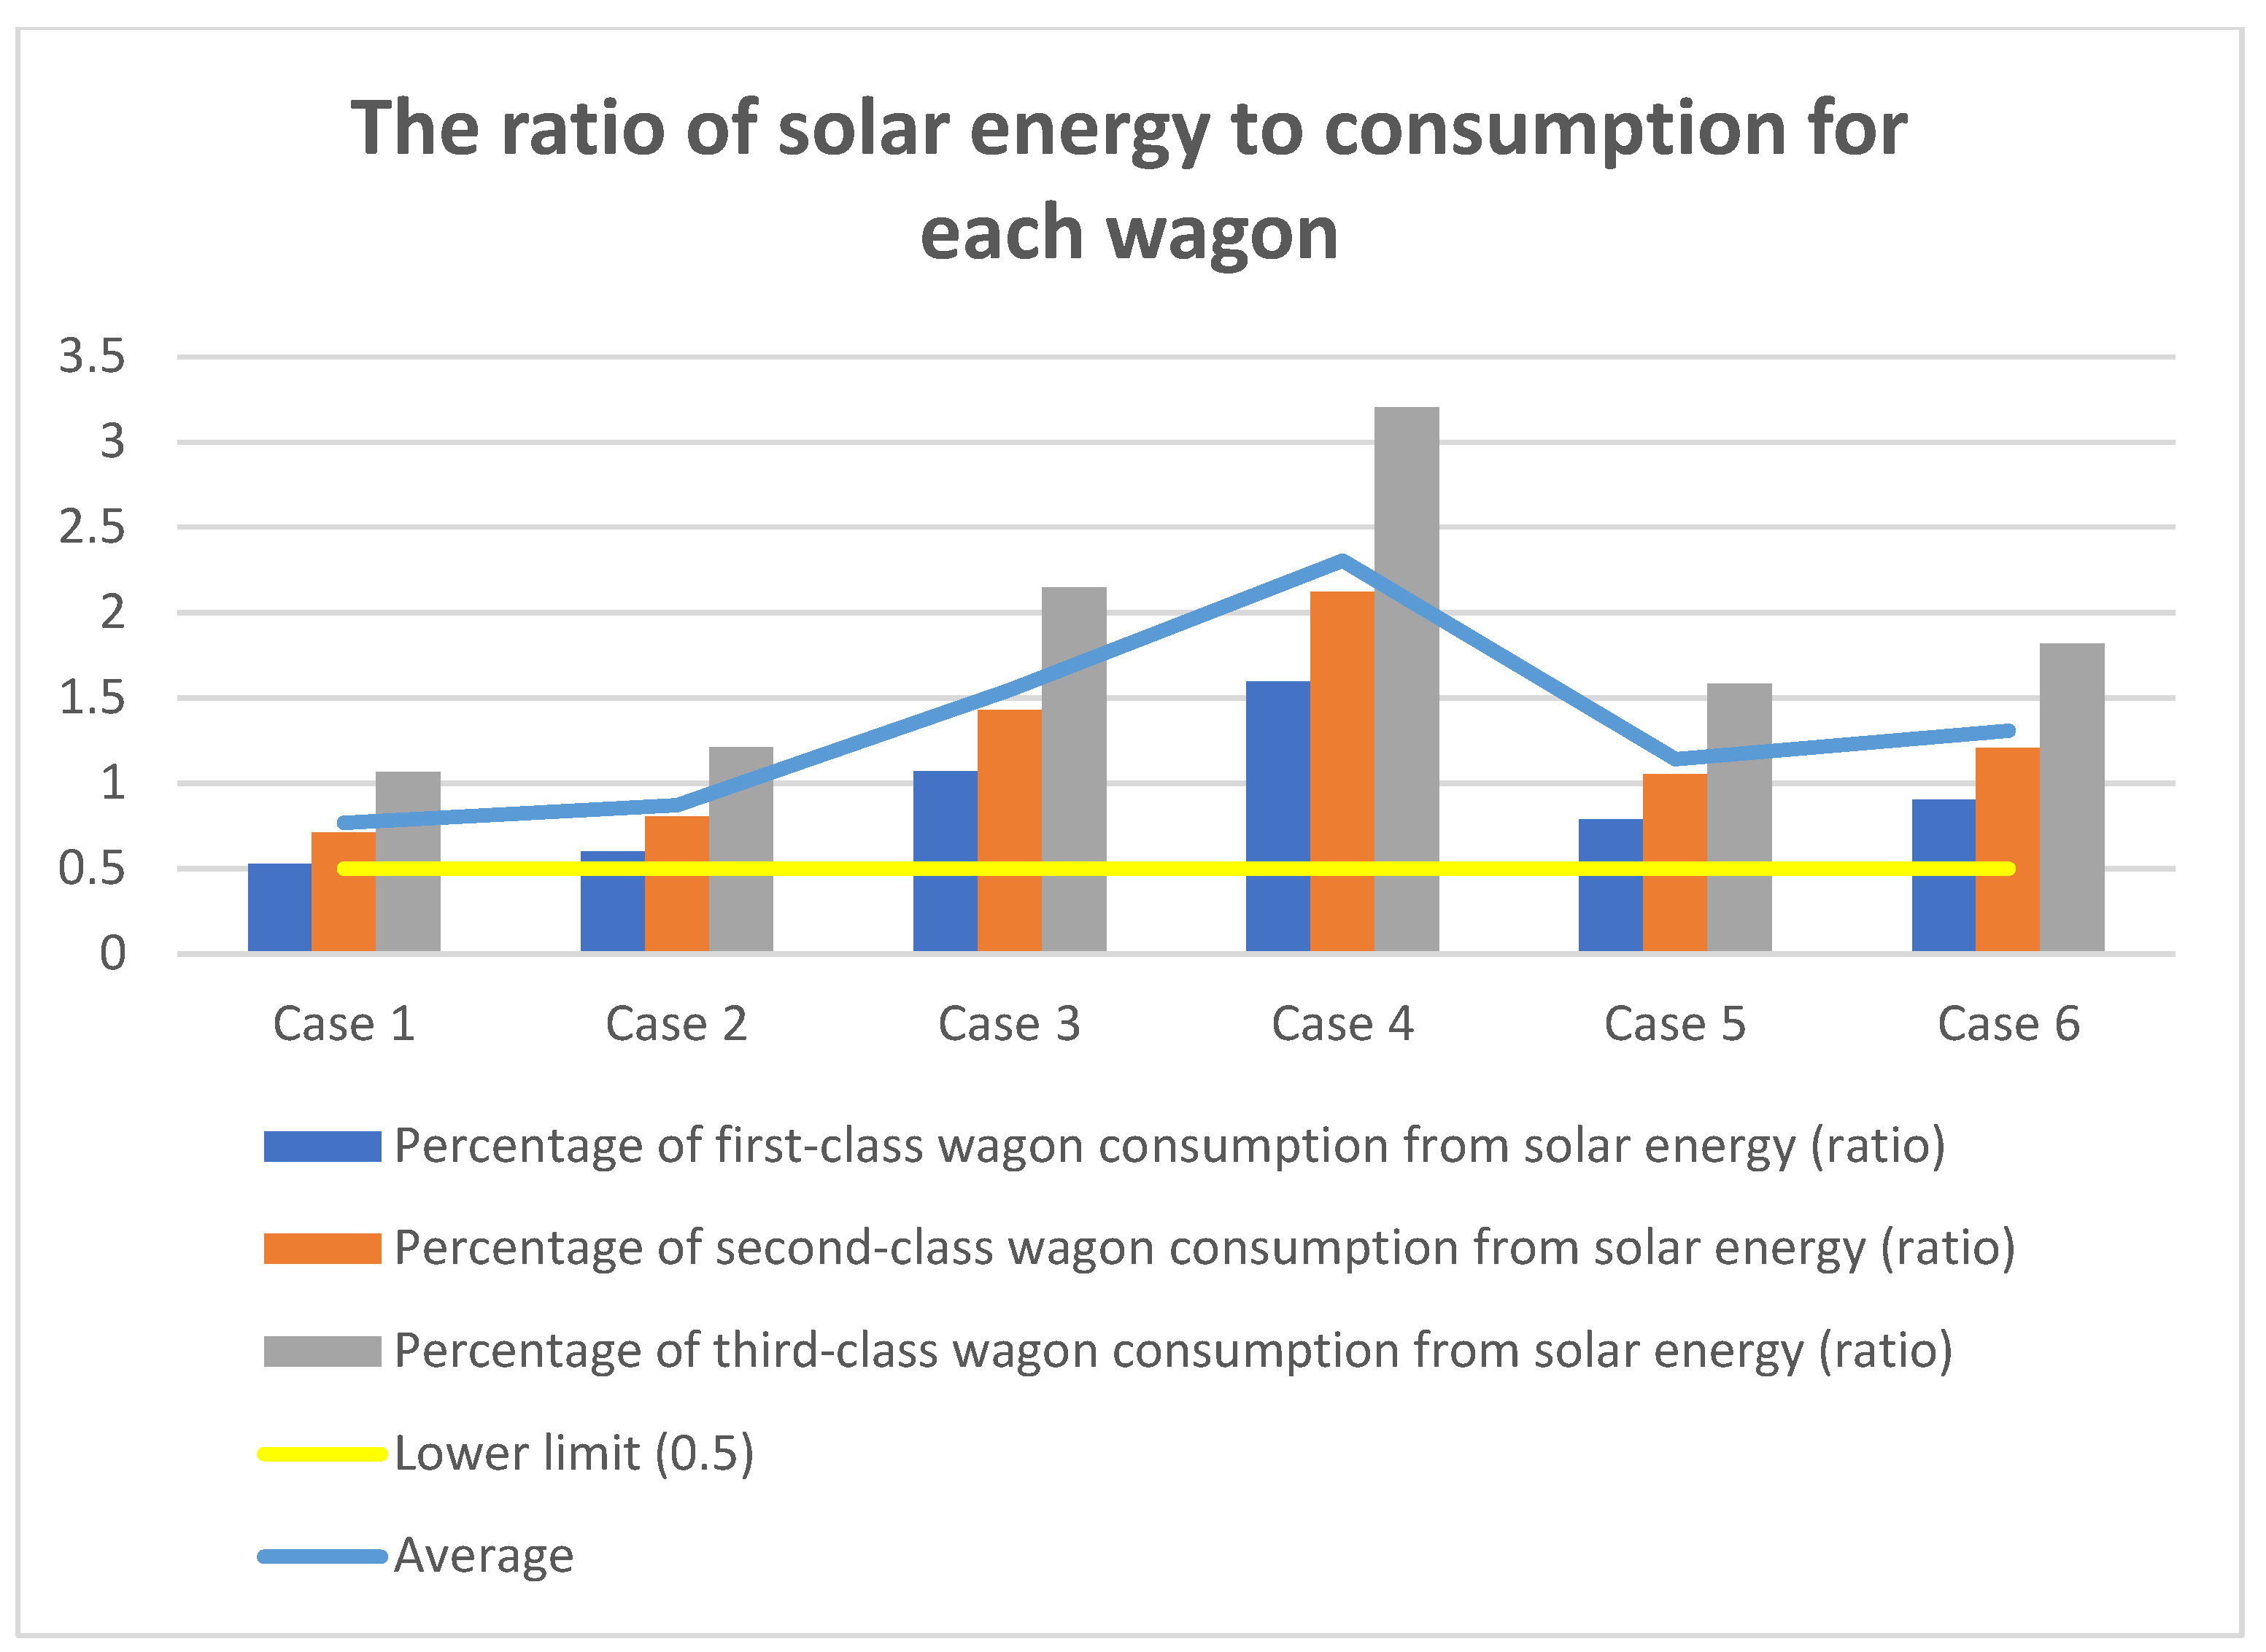
  • Comparison and analysis: we compare and analyze the profitability for the six cases in terms of ROI (year), capacity factor (%), i.e., the actual percentage of the solar irradiation transformed into electricity, annual solar production (MWh), annual CO2 reduction revenue ($), and the percentage of each wagon’s consumption provided by solar energy. This value equals the ratio of yearly energy produced by PV solar panels over the wagon’s annual energy.

5.1. Base Case

We chose London as the base case of study. Figure 5 and Figure 6 show London’s location and some meteorological data from the RET Screen database [32].
Figure 5 shows that the climate data’s location is Leeds Weather Center. Figure 6 shows that the average annual air temperature is 10.3 °C, and the daily solar radiation (horizontal) is 2.54 kWh/m2 per day. Moving to the energy section, and as shown in Figure 7, we consider the following inputs:
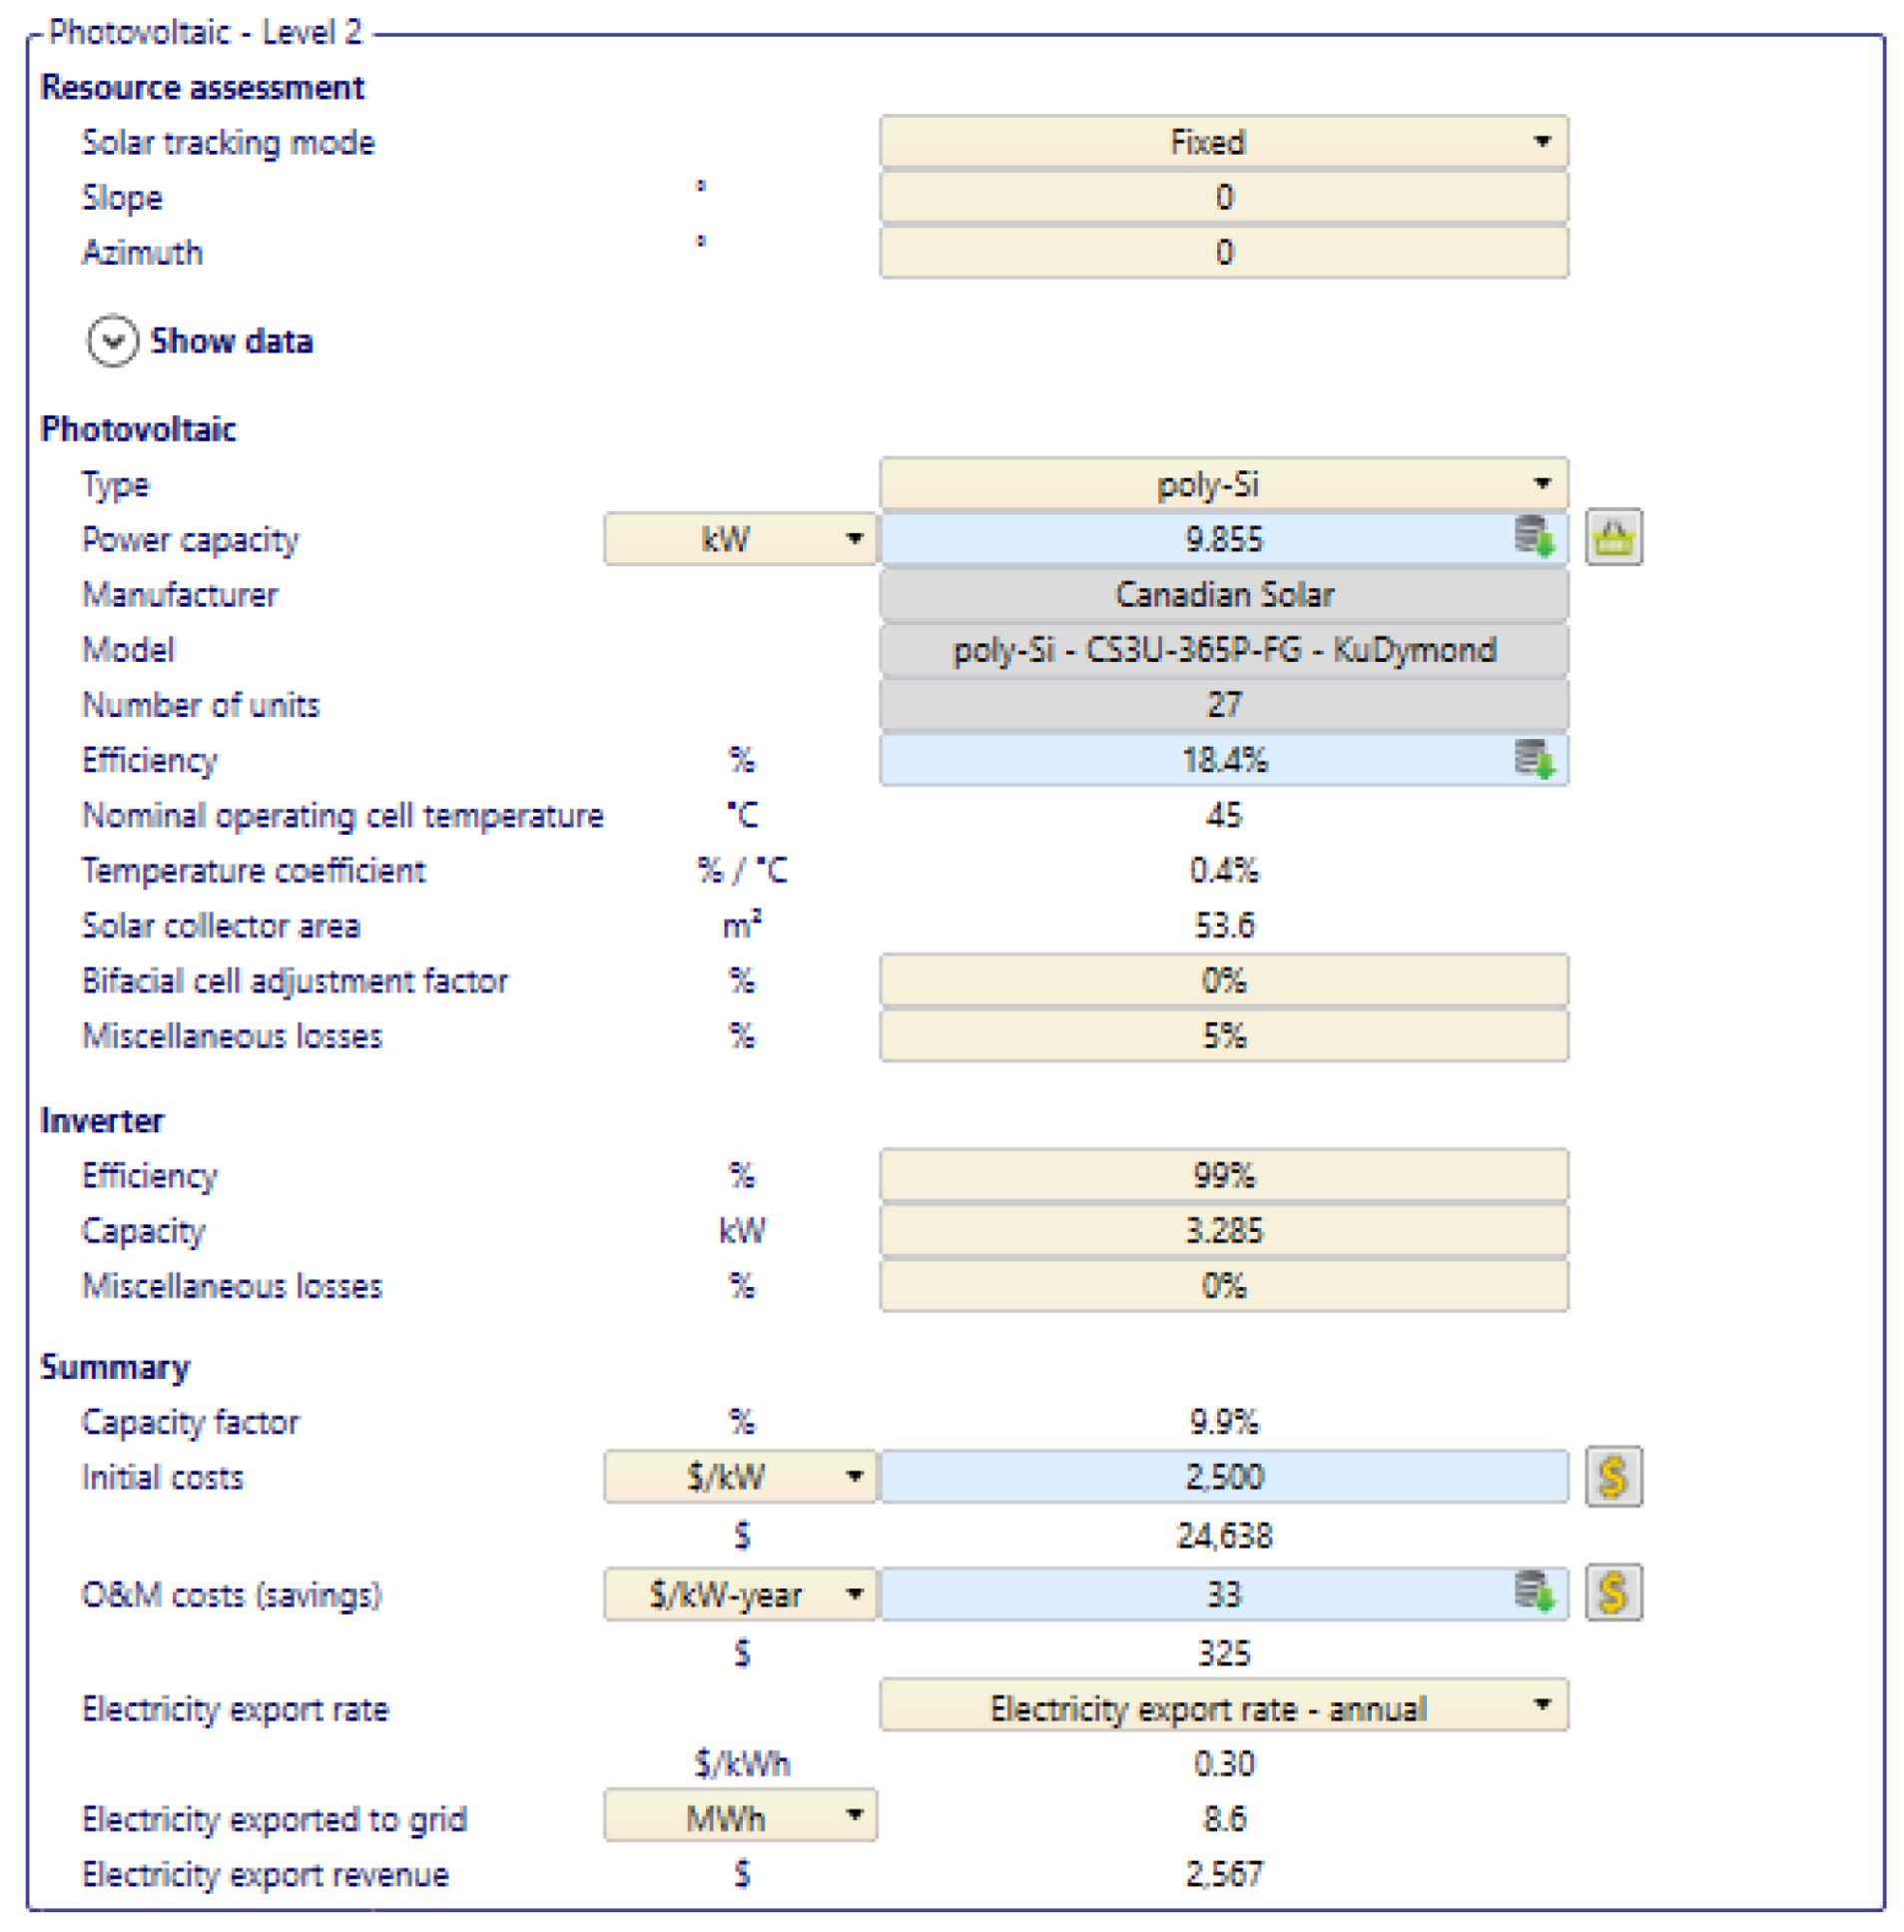
  • Fixed panels for the “solar tracking mode”, the most straightforward model installed on the train’s roof.
  • Canadian Solar Poly-Si—CS34-365P-FG-KuDymond for the type of panels, with a total rated power of 365 W and total efficiency of 18.4%. At the same time, its high relative efficiency makes it a good choice.
  • 27 PV solar panels are installed on the available area of each wagon’s roof. The panels’ total area is 53.6 m2, which is slightly less than the available area of the roof (54.49 m2).
  • 5% and 1% are the losses for the solar panels and inverters. The choice of these values is recommended in the RET Screen guide.
  • 2500 $/kW and 33 $/kW-year for the initial costs and O&M costs, respectively. An experienced worker has validated the choice of these values in the field of PV solar panels.
  • 0.3 $/kWh for the annual electricity export rate, as explained in the methodology section. This is the cost of diesel generated electricity production, which is avoided.
After the energy section, the GHG emissions reduction and main finance parameters should be inserted. We considered them as follows:
  • 1.075 t CO2/MWh and 50 $/t CO2 for the GHG emission factor (excluding T&D) and GHG reduction credit card, respectively, as shown in Figure 8. The emissions correspond to diesel generator electricity production, while the carbon credit corresponds to the market’s actual values.
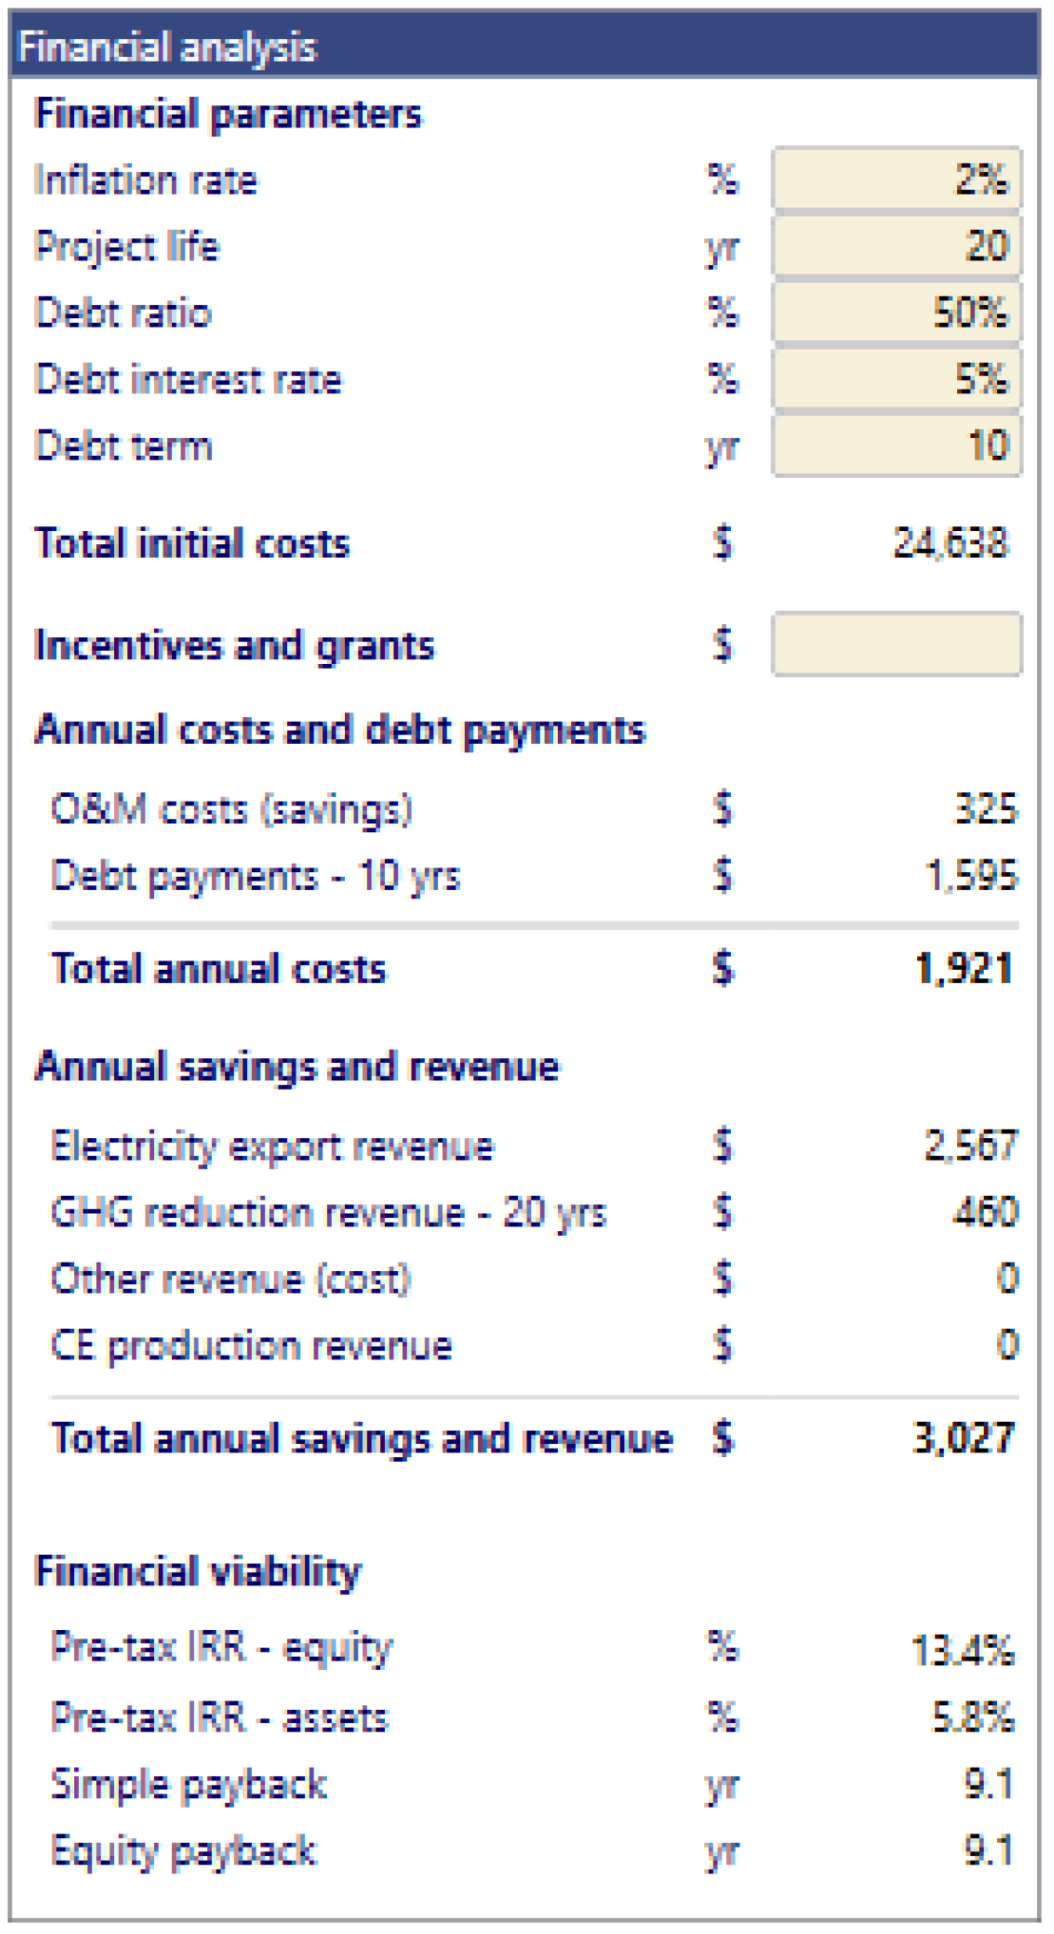
  • 2%, 20 years, 50%, 5%, and 10 years are the values used for the inflation rate, project life, debt ratio, debt interest rate, and debt term, respectively, as shown in Figure 9. These values’ choice corresponds to actual market conditions and similar PV solar panel projects.
The main results from RetScreen are: (1) the annual solar energy production (MWh), which is the same as the “electricity exported to grid”, shown in Figure 6. For London, it is 8.6 MWh, with a 9.9% capacity factor, which is directly affected by the local meteorological conditions; (2) the ROI (payback), which appears at the bottom of Figure 8 and is equal to 9.1 years; (3) and, finally, the GHG (CO2) reduction value and associated revenues (Figure 8).
On the other hand, considering the duration of travel per day (9.33 h) and the number of trips per year (seven trips/week) for the case of London (shown in Table 2), the required energy is 16.21 MWh, 12.14 MWh, and 8.06 MWh for the first class, second class, and third class wagons, respectively. Therefore, we determined the percentage of each wagon’s supply with solar energy as 53.05%, 70.85%, and 106.65% for the first class, second class, and third class wagons, respectively.
Thus, the PV solar panels provide around 50% of the total energy consumed per year for the first class wagon. Therefore, the annual fuel bill of the auxiliary generator is reduced by 50%. In the same context, the PV solar panels provide 100% of the total energy consumed for the third class wagon. An additional 6% can be stored in batteries. This stored energy can be a supplementary source for other train charges.
In the following sections, we use the same inputs as the base case for all other trains’ cases. The results will be affected by the local solar resource and the train operation schedule, i.e., journey duration and frequency.

5.2. Comparison and Analysis

The profitability results for the six cases shown in Table 5 are in terms of ROI (years), capacity factor (%), annual solar production (MWh), and CO2 emission reduction revenues ($).
Case 4 has the highest capacity factor and annual solar production (MWh). The location of case 4, in North Africa (Egypt), benefits from a very high solar resource. On the other hand, case 1 has the lowest annual solar production (MWh) in the UK, resulting from the lowest solar energy availability. Additionally, the cases located in cold climates produce slightly less energy than the others, such as cases 2 and 3.
The ROI (years) is inversely proportional to the annual solar production (MWh) as well as CO2 emission reduction revenues ($). In detail, the ROI values range from 2.5 years (case 4) to 9.1 years (case 1), while the CO2 emission reduction revenues range from $460 to $998 per year. Therefore, the ROI values are appropriate for such a project, except for the first case, where the ROI is considered very high. Table 5 shows the annual solar energy production for each case study.
As mentioned in the introduction, installing PV solar panels on the train roof reduces fuel consumption associated with auxiliary diesel generators. Figure 10 shows the profitability of using this technique regarding the percentage of each wagon’s consumption, as provided by solar energy/journey (ratio). The minimum fuel reduction of auxiliary generators per year is above 0.5, proving this solution’s feasibility and reliability.
According to Figure 10, cases 3 and 4 are the best, with over 100% of the energy provided by PV solar panels in all the wagon’s classes. This performance is due to the lower energy consumed in these two cases, which depends on the number of trips per week. However, the energy production in case 4 is considerably higher than in case 3 because the available solar resource in Egypt (case 4) is significantly higher than in Quebec (case 3). Inversely, cases 1 and 2 are the worse. Only the third class wagon’s energy can be covered at 100 % from PV production due to the higher annual energy consumed in these two cases. Energy production for case 2 is better than for case 1 as solar irradiation is higher in southern Canada (case 2) than in the United Kingdom (case 1). Moreover, case 5 is characterized by high annual energy consumption and significant PV energy production.

6. Conclusions

This paper presents a straightforward approach to evaluating the profitability and the impact of installing PV panels on the wagon’s roof on the train’s energy efficiency. The solution has been considered for six different journeys worldwide, with various solar resource potentials and meteorological weather conditions. The solar resource and the wagon’s usage determine the level of solar energy percentage and economic feasibility. The minimum annual fuel reduction of auxiliary generators allowed using PV solar panels is above 50% in all cases and wagon classes, proving this solution’s feasibility.
Moreover, the payback period (ROI, years) is inversely proportional to the annual solar production (MWh) as well as to the CO2 emission reduction revenues ($). The payback period ranges from 2.5 years to 9.1 years, while the CO2 emission reduction’s revenue values range from $460 to $998 per year/wagon. These results are acceptable and appropriate for such projects.
On the other hand, the effect of the low temperature on the profitability of this technique is insignificant. The profitability is strongly related to the solar resource (light) and travel duration, and the results for the London and Sydney cases prove that. Future research can perform tests on a batch of data using artificial intelligence or statistical analysis to pave the way toward intelligent management of energy systems in the Industry 4.0 era.

Author Contributions

Conceptualization, A.I. and H.I.; methodology, A.F., H.I. and A.I.; validation, H.I., A.I., S.S.K. and M.I.; formal analysis, A.F., H.I., A.I., S.S.K. and M.I.; writing—original draft preparation, A.F., S.S.K. and M.I.; writing—review and editing, A.F., H.I., A.I., S.S.K. and M.I.; visualization, A.F., S.S.K. and M.I.; supervision, H.I. and A.I.; project administration, H.I., A.I. and S.S.K. All authors have read and agreed to the published version of the manuscript.

Funding

This research was funded by the Government of Canada through Transport Canada “Clean Transportation Program—Research and Development”.

Institutional Review Board Statement

Not applicable.

Informed Consent Statement

Not applicable.

Data Availability Statement

Not applicable.

Conflicts of Interest

The authors declare no conflict of interest.

Nomenclature and Symbols

PVPhotovoltaic
COP2121st Conference of Paris
IRENAInternational Renewable Energy Agency
CERCanadian Electrical Railways
O&MOperation and Maintenance
T&DTransmission and Distribution
GHGGreenhouse gas
ROIPayback period
UICInternational Union of Railways

References

  1. Mylenka, T. Impact of COVID-19 on the Global Energy Sector. PV Magazine. Available online: https://www.pv-magazine.com/2020/04/24/impact-of-covid-19-on-the-global-energy-sector/ (accessed on 24 April 2020).
  2. Iea. COVID-19 and Energy: Setting the Scene. Sustainable Recovery. 2020. Available online: https://www.iea.org/reports/sustainable-recovery/covid-19-and-energy-setting-the-scene (accessed on 1 June 2020).
  3. Bp. Statistical Review of World Energy. 70th Edition. 2021. Available online: https://www.bp.com/content/dam/bp/business-sites/en/global/corporate/pdfs/energy-economics/statistical-review/bp-stats-review-2021-full-report.pdf (accessed on 1 July 2021).
  4. IRENA (International Renewable Energy Agency). Global Renewables Outlook: Energy Transformation 2050. 2020. Available online: https://irena.org/-/media/Files/IRENA/Agency/Publication/2020/Apr/IRENA_GRO_Summary_2020.pdf?la=en&hash=1F18E445B56228AF8C4893CAEF147ED0163A0E47 (accessed on 1 June 2020).
  5. IRENA (International Renewable Energy Agency). Renewable Energy Statistics 2021. Available online: https://IRENA_Renewable_Energy_Statistics_2021.pdf (accessed on 1 June 2020).
  6. IRENA (International Renewable Energy Agency). Renewable Energy Employment by Country. 2020. Available online: https://www.irena.org/Statistics/View-Data-by-Topic/Benefits/Renewable-Energy-Employment-by-Country (accessed on 1 June 2020).
  7. Agence Parisienne du Climat. Qu’est-ce que le COP 21? [French Edition]. Available online: https://www.apc-paris.com/COP-21 (accessed on 4 December 2018).
  8. IRENA (International Renewable Energy Agency). FUTURE OF SOLAR PHOTOVOLTAIC: Deployment, Investment, Technology, Grid Integration and Socio-Economic Aspects. A Global Energy Transformation Paper. November 2019. Available online: https://irena.org/-/media/Files/IRENA/Agency/Publication/2019/Nov/IRENA_Future_of_Solar_PV_2019.pdf (accessed on 1 November 2019).
  9. Eia. Energy Consumption by Sector. 2020. Available online: https://www.eia.gov/totalenergy/data/monthly/pdf/sec2.pdf (accessed on 1 June 2020).
  10. UNEP, UNEP DTU Partnership. UN Environment Program: Emissions Gap Report 2020. Available online: https://www.unep.org/emissions-gap-report-2020 (accessed on 9 December 2020).
  11. Mihlfeld & Associates. The 6 Modes of Transportation. Available online: https://blog.mihlfeld.com/the-6-modes-of-transportation (accessed on 6 October 2018).
  12. Iea. Rail. Tracking Transport 2020. 2020. Available online: https://www.iea.org/reports/tracking-transport-2020/rail (accessed on 1 June 2020).
  13. ORR Office of Rail and Road, Rail Emission 2019–2020. Available online: https://dataportal.orr.gov.uk/media/1843/rail-emissions-2019-20.pdf (accessed on 5 November 2020).
  14. Adele, B. Solar-Powered Trains: The Future of Rail? Railway Technology. Available online: https://www.railway-technology.com/features/solar-powered-trains/ (accessed on 12 September 2019).
  15. Moriarty, P.; Honnery, D. Global transport energy consumption. In Alternative Energy and Shale Gas Encyclopedia; Wiley Series on Energy; Jay, H.L., Jack, K., Thomas, B.K., Eds.; John Wiley & Sons: Hoboken, NJ, USA, 2016; pp. 651–656. [Google Scholar]
  16. De Blas, I.; Mediavilla, M.; Capellan-Perez, I.; Duce, C. The Limits of Transport Decarbonization under the Current Growth Paradigm, Energy Strategy Reviews 32, Elsevier. 2020. Available online: https://www.researchgate.net/publication/344255972_The_limits_of_transport_decarbonization_under_the_current_growth_paradigm (accessed on 1 September 2020).
  17. ORR Office of Rail and Road, Rail Infrastructure and Assets 2019–2020. Available online: https://dataportal.orr.gov.uk/media/1842/rail-infrastructure-assets-2019-20.pdf (accessed on 5 November 2020).
  18. Available online: https://www.reddit.com/r/trains/comments/agayt3/i_found_this_photo_on_americanrailscom_also_i (accessed on 12 September 2019).
  19. Vajihi, M. Solar-Powered Light Rail Vehicle and Tram Systems. Master’s Thesis, University of Roma, Roma, Italy, 2018. [Google Scholar]
  20. Available online: https://www.engadget.com/2017-07-18-india-first-solar-powered-train.html (accessed on 18 July 2017).
  21. Available online: https://createdigital.org.au/worlds-first-solar-train-byron-bay (accessed on 15 February 2018).
  22. High-Speed Euro Train Gets Green Boost from Two Miles of Solar Panels. Available online: https://www.theguardian.com/environment/2011/jun/06/tunnel-solar-rail (accessed on 6 June 2011).
  23. Available online: https://siteselection.com/issues/2012/mar/belgium.cfm (accessed on 1 March 2012).
  24. Kapetanović, M.; Núñez, A.; van Oort, N.; Goverde, R.M.P. Reducing Fuel Consumption and Related Emissions through Optimal Sizing of Energy Storage Systems for Diesel-Electric Trains. Appl. Energy 2021, 294, 117018. [Google Scholar] [CrossRef]
  25. Cipek, M.; Pavković, D.; Krznar, M.; Kljaić, Z.; Mlinarić, T.J. Comparative analysis of conventional diesel-electric and hypothetical battery-electric heavy haul locomotive operation in terms of fuel savings and emissions reduction potentials. Energy 2021, 232, 121097. [Google Scholar] [CrossRef]
  26. Afonso, J.L.; Lisboa Cardoso, L.A.; Pedrosa, D.; Sousa, T.J.C.; Machado, L.; Tanta, M.; Monteiro, V. A review on power electronics technologies for electric mobility. Energies 2020, 13, 6343. [Google Scholar] [CrossRef]
  27. Normanyo, E.; Sulemana, A.R. Using solar-powered 3-phase squirrel cage induction motors as prime movers for synchronous electric generators. Ghana J. Technol. 2021, 5, 11–20. [Google Scholar]
  28. De Almeida Carneiro, M.; da Fonseca Soares, D. Solar photovoltaic assistance system study for a Brazilian light rail vehicle. U. Porto J. Eng. 2020, 6, 35–45. [Google Scholar] [CrossRef]
  29. Discover How to Get Anywhere. Available online: https://www.rome2rio.com/fr/ (accessed on 5 June 2022).
  30. Tshiuetin Enterprise. Available online: https://www.tshiuetin.net/calendrier-septembre-2020.pdf (accessed on 1 June 2020).
  31. Available online: https://generatorist.com/list-of-electric-appliances-their-wattage-usage (accessed on 3 May 2021).
  32. Sendy, A. Types of Solar Panels: Which One Is the Best Choice? Available online: https://www.solarreviews.com/blog/pros-and-cons-of-monocrystalline-vs-polycrystalline-so (accessed on 5 May 2021).
  33. Railroad Equipment. February 2020. Available online: https://www.csx.com/index.cfm/customers/resources/equipment/railroad-equipment (accessed on 1 June 2020).
  34. What Are the Significant Losses in the Solar Power System? 2020. Available online: http://www.adityagreens.com/%20Losses%20in%20the%20solar%20system (accessed on 1 June 2020).
  35. RET Screen-NRCan. Available online: http://www.RETScreenExpert.rtx (accessed on 1 June 2020).
  36. Chauhan, A.; Saini, R.P. A review on Integrated Renewable Energy System based power generation for stand-alone applications: Configurations, storage options, sizing methodologies and control. Renew. Sustain. Energy Rev. 2014, 38, 99–120. [Google Scholar]
  37. RET Screen User Manual. Available online: http://www.unfccc.int/%20RET%20Screen%20Software%20Online%20User%20Manual (accessed on 1 June 2020).
Figure 1. An example of a diesel–electric train (F7A) [18].
Applsci 12 05869 g001
Figure 2. The UNESCO train with PV solar panels [20].
Applsci 12 05869 g002
Figure 3. Australia’s train with PV solar panels [21].
Applsci 12 05869 g003
Figure 4. The Belgian solar tunnel [23].
Applsci 12 05869 g004
Figure 5. London’s location, United Kingdom.
Applsci 12 05869 g005
Figure 6. Meteorological data for London, United Kingdom.
Applsci 12 05869 g006
Figure 7. Energy data input for the case of London, United Kingdom.
Applsci 12 05869 g007
Figure 8. GHG emission reduction’s inputs in the case of the London, United Kingdom.
Applsci 12 05869 g008
Figure 9. Financial inputs in the case of London, United Kingdom.
Applsci 12 05869 g009
Figure 10. The ratio of solar energy to each wagon’s consumption.
Applsci 12 05869 g010
Table 1. Global installed PV power (GW) [5].
Global Installed PV Power (GW)20162017201820192020
OnGrid294.8389.579482.912583.872709.674
OffGrid2.2782.9083.614.0594.293
Table 2. The case studies and their characteristics [29,30].
Case StudyLocationDuration of Each Travel (h)Number of Travels per Week
Case 1London to EdinburghSoutheast of Great Britain9.2 h7
Case 2Toronto to MontrealSouthwest of the province of Quebec—Ontario, Canada5.38 h14
Case 3Sept-Îles to ScheffervilleNorthern of the province of Quebec, Canada10 h4
Case 4Luxor to AswanSouth of the capital Cairo, Egypt3.33 h14
Case 5Sydney to HentyThe southeastern coast of Australia5.33 h14
Case 6Champaign to ChicagoSouthwestern tip of Lake Michigan-USA8.33 h7
Table 3. Electrical appliance’s power consumption according to the ticket class.
Train’s Car Consumption (W)3rd Class2nd Class1st Class
Lights400600800
Heating System50010001500
Laptops200450600
Internet Router102020
Phones125375500
Sound System959595
Coffee machine800800800
Refrigerator265265500
Total239536054815
Table 4. The annual energy consumed per each class of wagons for the case studies.
Case Study3rd Class (MWh)2nd Class (MWh)1st Class (MWh)
Case 1London to Edinburgh8.0612.1416.21
Case 2Toronto to Montreal9.5914.4319.28
Case 3Sept-Îles to Schefferville4.987.5010.02
Case 4Luxor to Aswan5.818.7411.67
Case 5Sydney to Henty9.2913.9918.68
Case 6Champaign to Chicago7.2610.9314.60
Table 5. The main results from RETScreen for installing PV solar panels on the wagon’s roof (per wagon).
Case NumberJourneyCapacity Factor (%)Annual Solar Production (MWh)ROI (Years)CO2 Yearly Emission Reduction Revenues ($)
1From London to Edinburgh9.98.69.1460
2From Toronto to Montreal13.911.64.9644
3From
Sept-Îles to Schefferville
12.410.76.0574
4From Luxor to Aswan21.518.62.5998
5From
Sydney to Henty
17.014.73.5790
6From
Champaign to Chicago
15.313.24.2710
Publisher’s Note: MDPI stays neutral with regard to jurisdictional claims in published maps and institutional affiliations.

