Article

Cavitation Erosion Characteristics for Different Metal Surface and Influencing Factors in Water Flowing System

1
School of Electrical and Control Engineering, Xuzhou University of Technology, Xuzhou 221018, China
2
School of Mechatronic Engineering, China University of Mining and Technology, Xuzhou 221116, China
*
Author to whom correspondence should be addressed.
Appl. Sci. 2022, 12(12), 5840; https://doi.org/10.3390/app12125840
Submission received: 26 April 2022 / Revised: 31 May 2022 / Accepted: 7 June 2022 / Published: 8 June 2022
(This article belongs to the Special Issue AI Applications in the Industrial Technologies)

Abstract

:
The impact of cavitation erosion behavior on different metals in a water flowing system was investigated experimentally. A flowing system of water was built and a transparent observation window is designed to capture the cavitation flow. Erosion tests were carried out on red copper, brass, pure aluminum, and an aluminum alloy. The cavitation behaviors are presented by the weight loss and cavitation erosion rate, and related changes in the topography of the metal surface are also discussed. The variation in the cavitation erosion on metallic specimens with increasing time could be divided into three stages: rising stage, stable stage, and attenuation stage. The pure aluminum material had the lowest yield strength, and suffered the most severe cavitation erosion while brass had the highest yield strength and good mechanical properties, which suffered the least cavitation erosion. Furthermore, the roughness of the material surface was also one of the important factors affecting the cavitation erosion rate. The weight loss of milling specimens with higher surface roughness was slightly lower than that of grinding. The high roughness of the metallic surface increased the pressure loss along the flow path and the suppressed cavitation strength. This work provides an experimental reference for the anti-cavitation ability improvement in metal materials and promotes an understanding of the related mechanism.

1. Introduction

Turbine and auxiliary machinery are key equipment in the hydropower industry, which is important to reduce environmental pollution by improving the efficiency of energy conservation and emissions reduction [1]. The reliability and advancement of hydraulic machinery such as propellers, turbines, pump, and valves as well as hydraulic discharge structures are largely dependent on the quality and performance of machinable metal materials [2]. Cavitation erosion is one of the main failure modes in hydraulic machinery, which is often caused by the action of stress pulses on the surface of metallic materials [3]. The main mechanisms of cavitation erosion on metal materials are shock wave and micro jet. Hammitt [4] believed that the microjet penetrates the inside of the bubble and hits the solid wall, causing damage to the solid surface. William [5] proposed that when the cavitation bubble collapses, the energy accumulated inside the bubble is released and a shock wave is formed, which erodes the solid surface. The pressure wave or high-speed jet is generated in the process of bubble collapse, which varies from several hundred MPa to one thousand MPa [6,7]. Such high stress pulses could easily lead to deformation and the loss of metal materials in industry. Cavitation erosion is a microscopic, instantaneous and random complex phenomenon. A relatively complete theoretical analysis of cavitation erosion has not been established recently. The surface of hydraulic machinery is often affected by cavitation erosion, which will induce strong vibration, decreasing performance, and a reduced life and production efficiency. The loss caused by cavitation erosion is inestimable. Therefore, the research on the anti-cavitation erosion ability of metallic materials used for hydraulic machinery is not only of profound theoretical significance, but also of great practical engineering significance.
Recently, while researchers have conducted much work on cavitation erosion, the technology of the anti-cavitation ability improvement of metallic materials needs more effort. Soyama [8] pointed out that only cavitation impacts with an energy larger than a certain threshold level affect the cavitation erosion of materials, and this fundamental threshold was obtained from the relationship between the erosion rate and the energy of the cavitation impacts. Dockar [9] found that the pitting damage on the surface of the material is mainly caused by the micro jet generated by the collapse of bubbles. The cavitation erosion phenomenon of a single hydrofoil was studied experimentally in the work of Dular [10], and it was found that the degree of cavitation erosion was related to the cavitation structure. Lv [11] studied the cavitation erosion in fluid jet machining, and pointed out that the cavitation intensity is related to the ultrasonic frequency. The lower the frequency, the more severe the cavitation erosion. Hutli [12] showed that the jet width and jet diffusion angle had a great influence on the strength of the cavitation. A larger jet velocity will lead to the larger area of erosion and deeper erosion depth. Li [13] investigated the erosion strength and efficiency of the cavitation jet. When the inlet pressure was 10 MPa and 15 MPa, the nozzle inner surface roughness value was 12.5 μm, and the erosion efficiency was the best. When the inlet pressure was 20 MPa and 25 MPa, the surface roughness value of the nozzle was reduced to 6.3 μm. Paolantonio [14] revealed that there were deep and rough spongy structural damages on the surface of the 316 LVM during the cavitation erosion stage. With the increase in time, small-sized cavitation pits first appeared on the surface of the material and then the surface plastic deformation increased. Four very similar Venturi shapes were used to observe the cavitation erosion test, and Sarc [15] pointed that despite the same convergence angle cavitation size, the appearance varied significantly when the divergence angle was changed. Wang [16] show that the greater flow velocity will cause more serious cavitation erosion. When the erosion forms a series of erosion points, it may act as a guided wave, so the mechanical impact of the cavitation bubbles becomes concentrated, and then the damage is accelerated [8,17].
In this paper, the failure mechanism of metallic materials under the cavitation flow was studied experimentally, and the impact of the cavitation erosion on different metallic materials and the change in the surface morphology were also discussed. A flowing system of water was built and a transparent observation window was designed to observe the cavitation flow. A comparative analysis of the advantages and disadvantages of the anti-cavitation erosion ability of the selected four metallic materials, red copper, brass, pure aluminum, and aluminum alloy, was presented. The cavitation damage of the samples was quantitatively analyzed by the weight loss method and cavitation erosion rate, and the failure mechanism of the metal materials was proposed. Recently, hydraulic machinery is gradually developing toward the direction of large, high speed, high power, and high performance, so there is an urgent need to find suitable materials and understand its anti-cavitation erosion ability for hydraulic machinery.

2. Materials and Methods

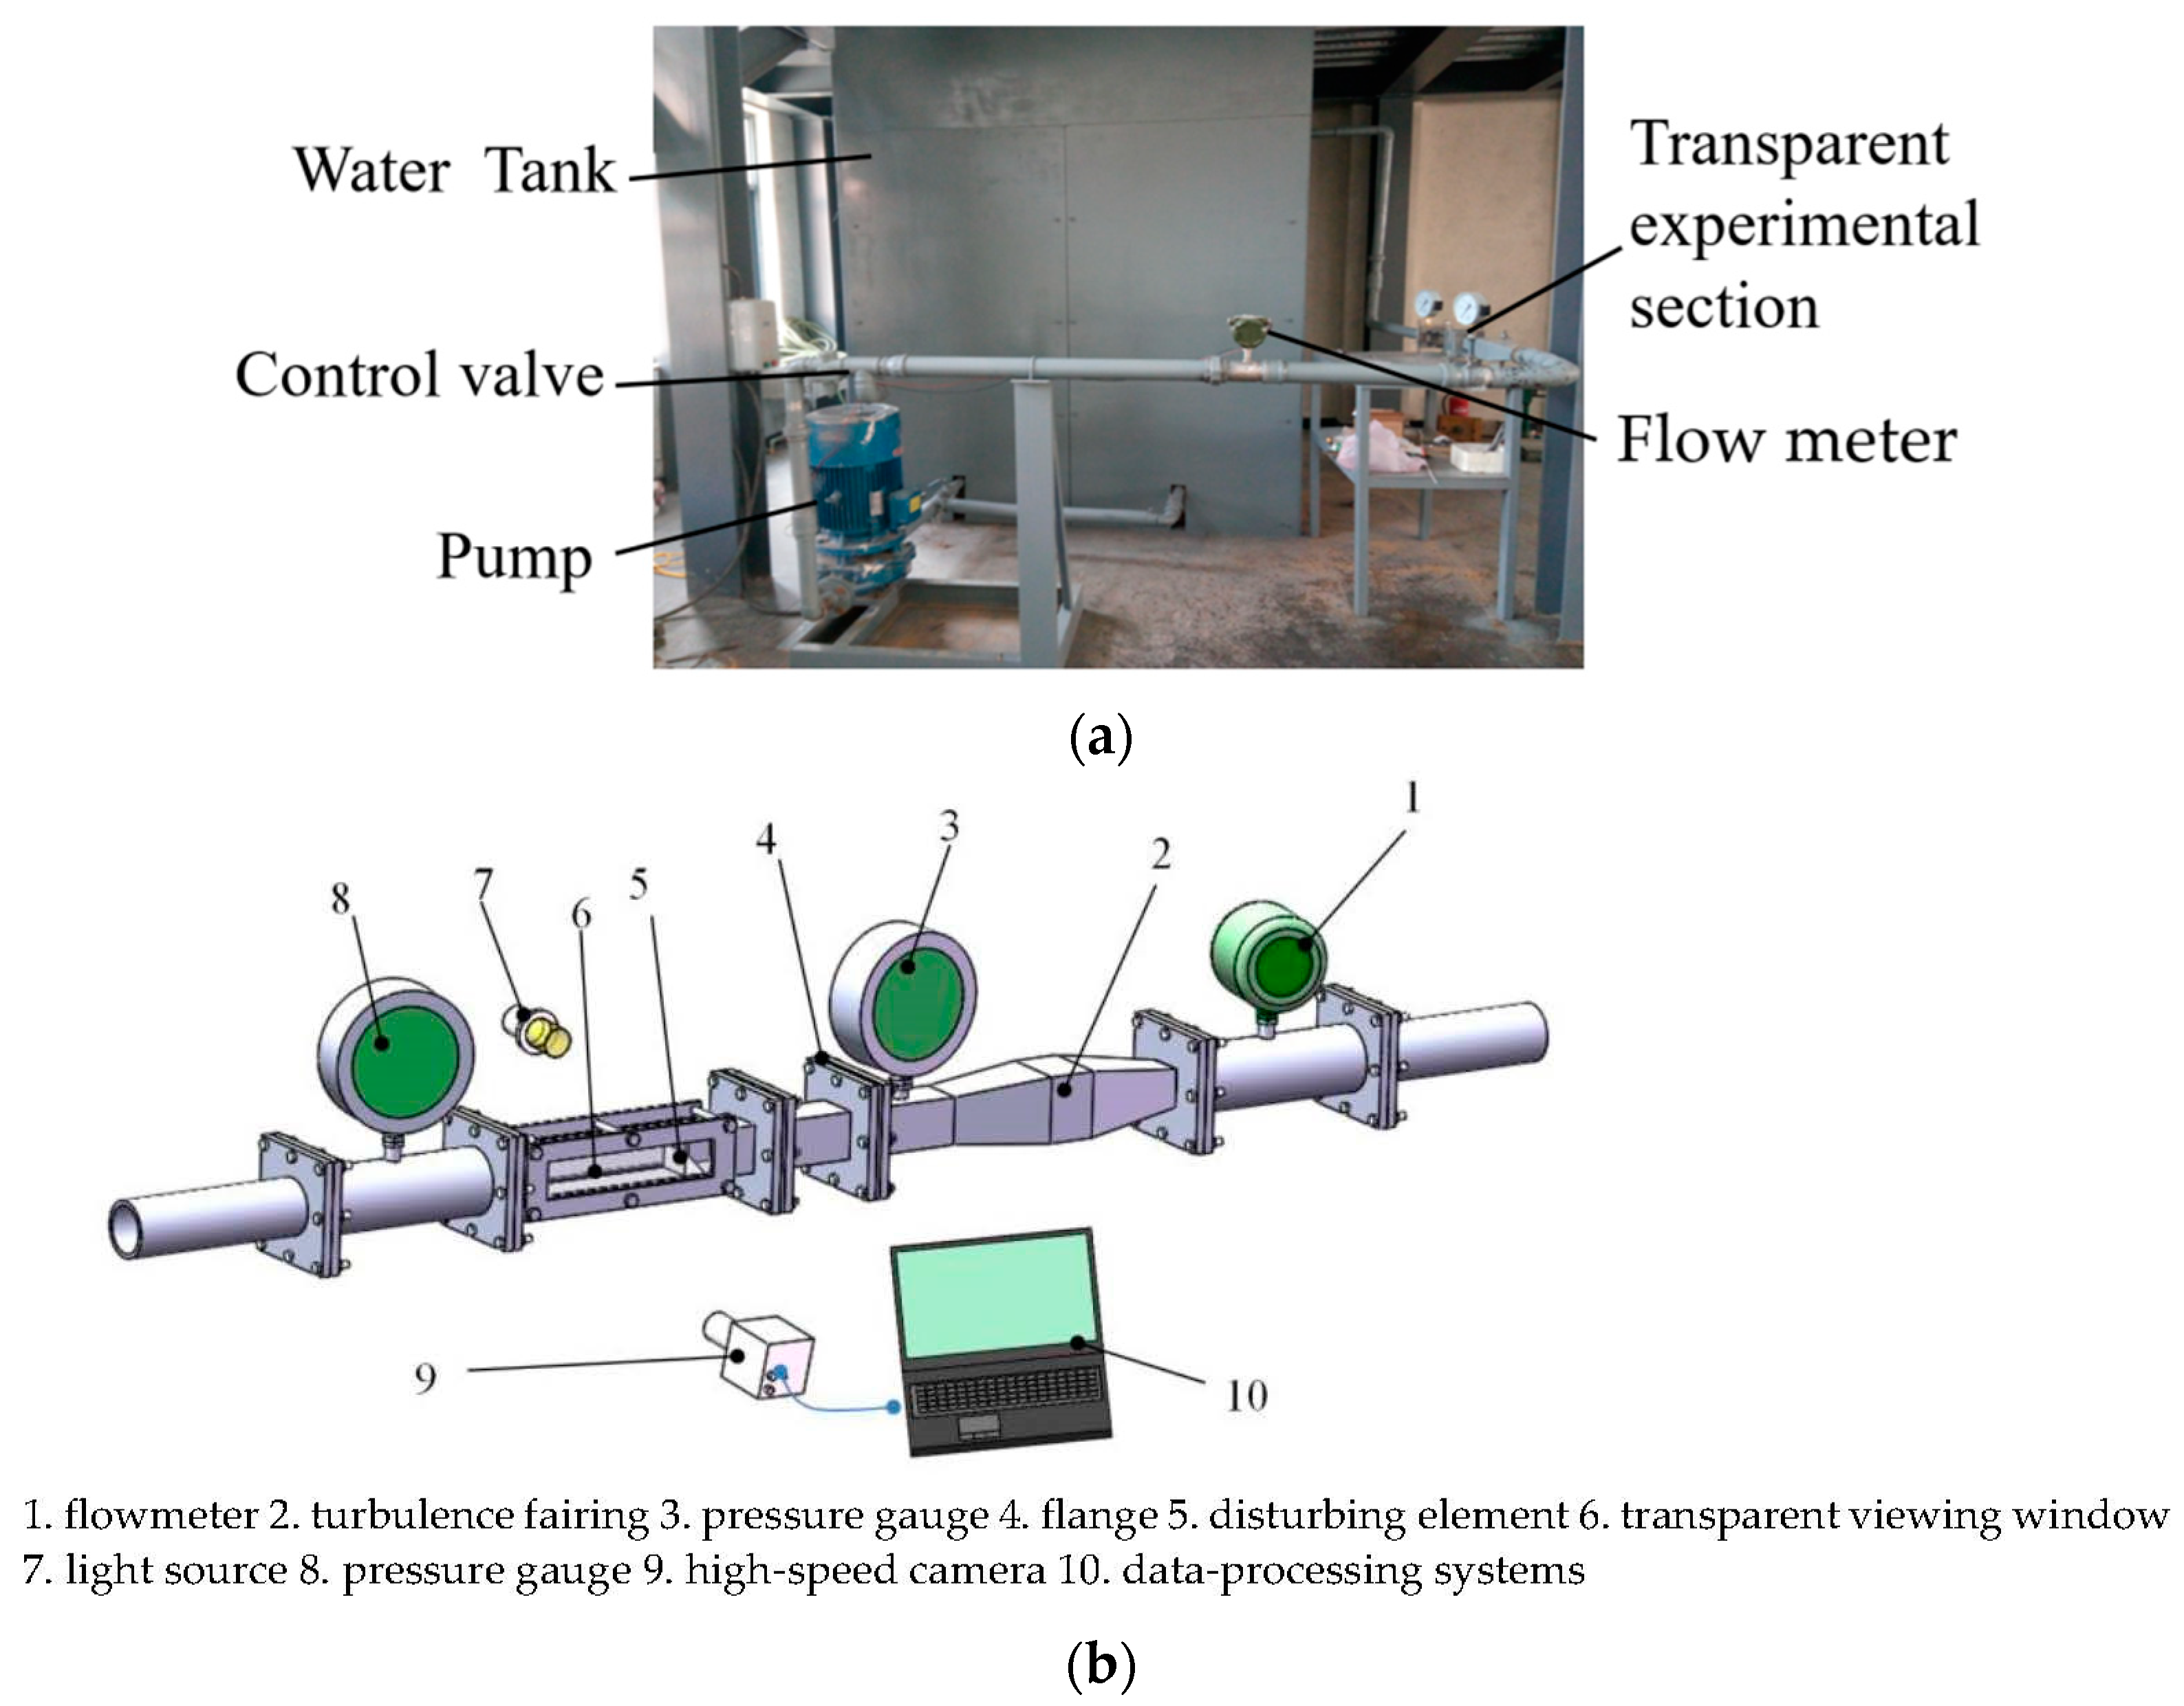
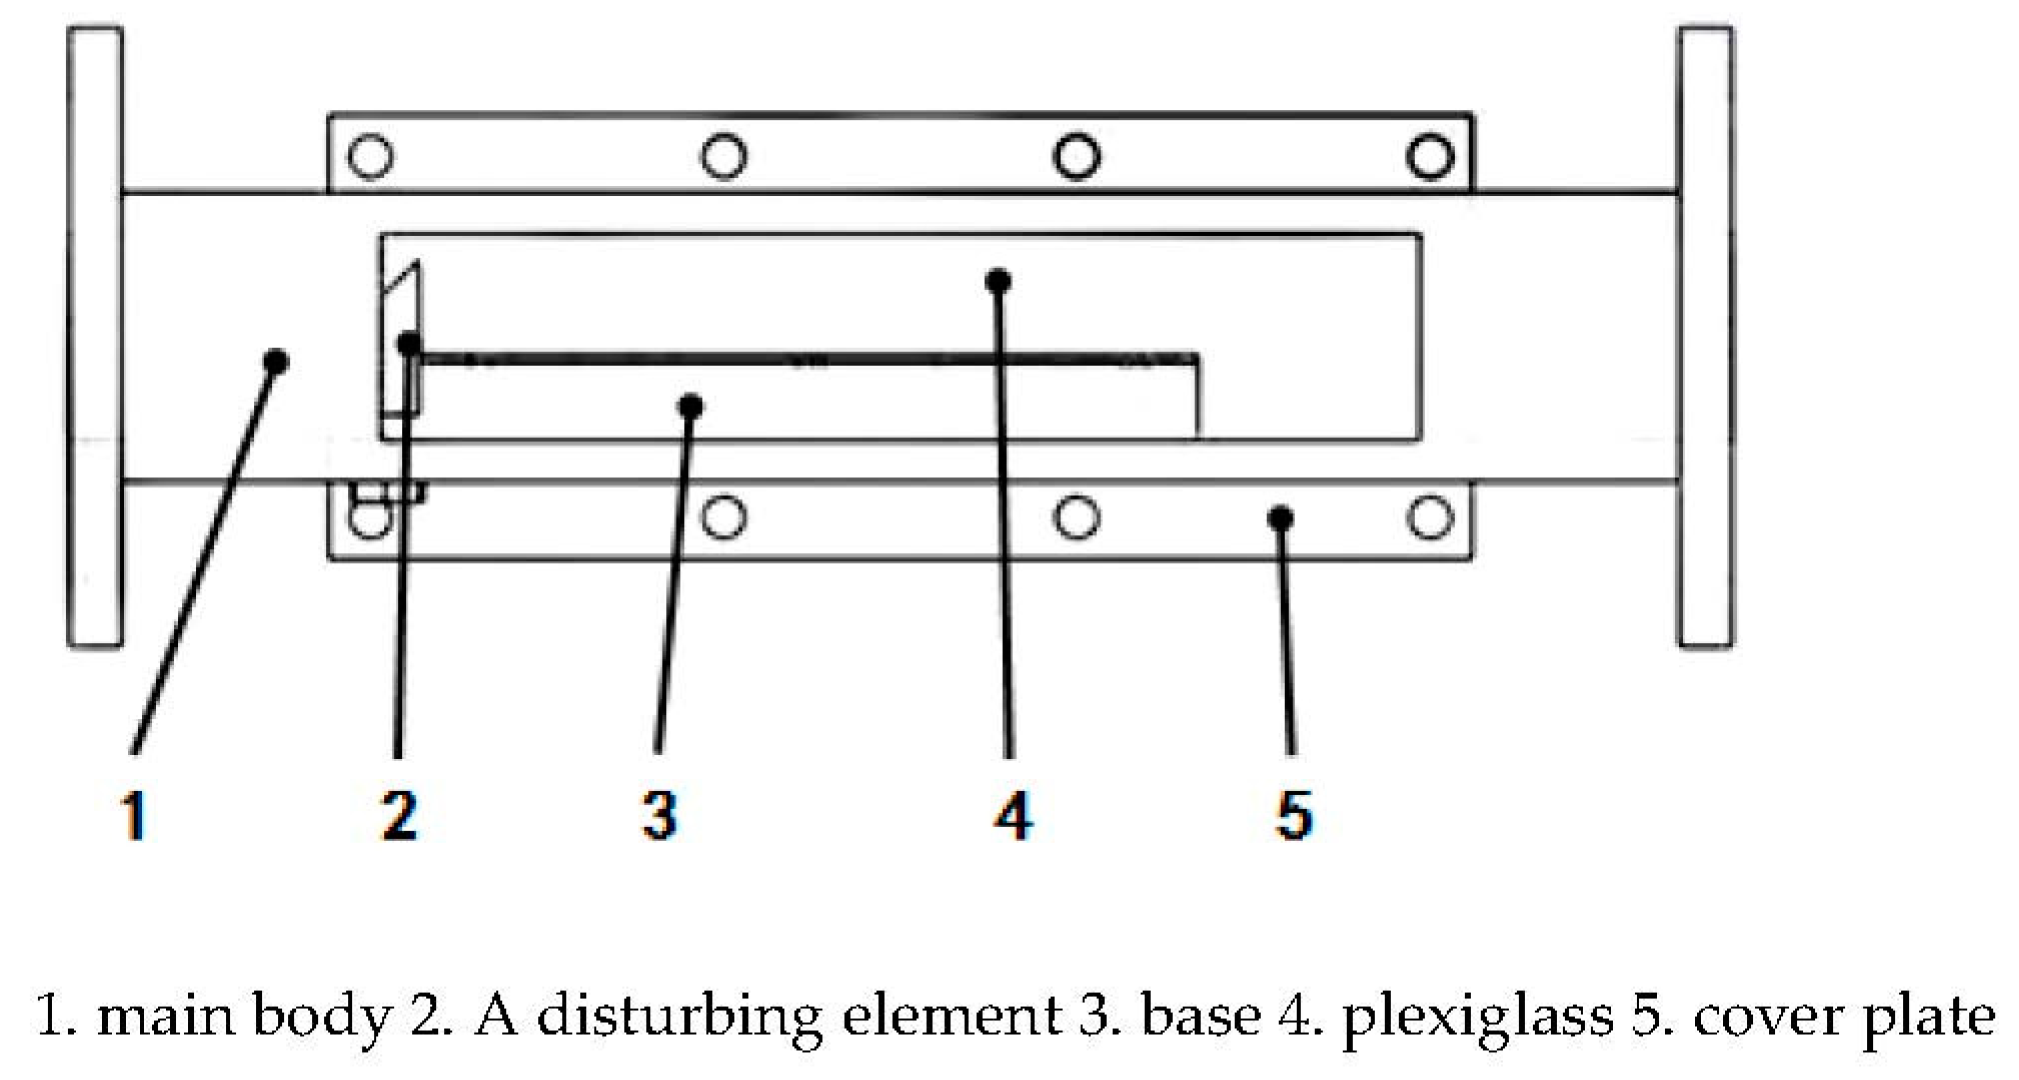
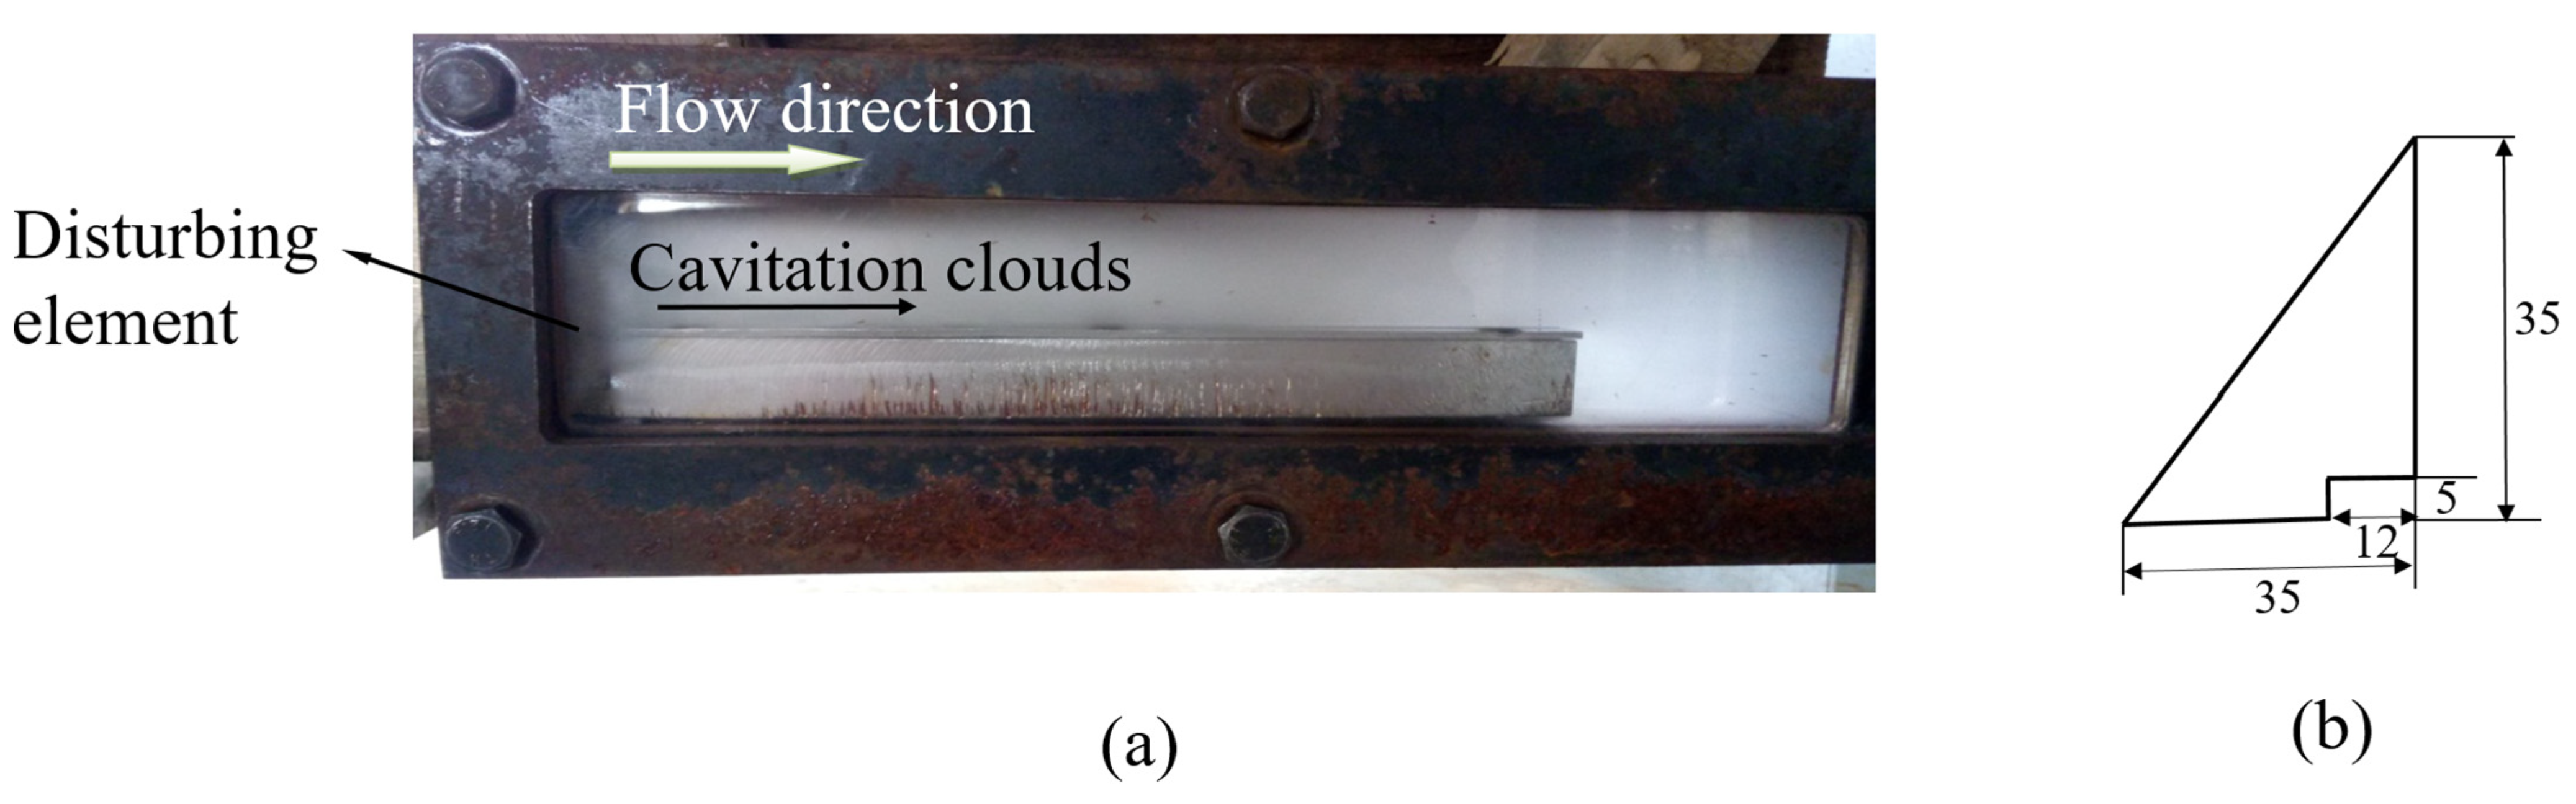
2.1. Experimental Device

The experimental system was mainly composed of six parts: a pump, water tank, pressure control valve, flow meter, transparent experimental section, and pressure gauge, as shown in Figure 1a. The water tank was composed of a water storage tank and buffer tank in series. The buffer tank can be used for water cooling, and prevent the change in temperature during this experiment. Figure 1b shows the main part of this experimental system. The pressure regulating valve was used to adjust the inlet and outlet pressure in the experimental section and the flowmeter was used to measure the water flow in the pipeline. The turbulence fairing mainly included a buffered device and a rectifier. The buffered device was a variable-diameter square pipe, and the water was fully developed in it because of the increasing pipe diameter. The rectifier was used to reduce the turbulent energy gradient. In order to capture the transient cavitation evolution process in the flow channel, a high-speed camera was used and the impact of cavitation flow on the metallic surfaces is presented.
Figure 2 is the schematic of the transparent test section, which was made of PMMA (polymethyl methacrylate), and was the place where cavitation occurred. There was a 40 mm × 40 mm square channel used to observe the cavitation flow. A disturbing element was installed at the inlet port; when the water flows through this disturbing element, the flow channel becomes smaller and the corresponding flow velocity increases, so the pressure will be reduced. If the partial pressure is lower than the saturated vapor pressure of water, the cavitation occurs near the disturbing element, and it will grow and collapse downstream. A trapezoidal incision was provided to install the experimental base, which was fixed at the bottom of the transparent test section by bolts. The metallic material was pressed firmly against the experimental base, whose surface was exposed to the cavitation flow. In the process of cavitation collapse, the surface of the metallic sample will be damaged, so the topography of the damaged metallic surface was analyzed.

2.2. Test Material Preparation

Red copper, brass, industry pure aluminum, and aluminum alloy copper were used in this experimentally, respectively. H62 brass is composed of a copper and zinc alloy, which is often used in the manufacture of valves, water pipes, and air conditioning connecting pipes. It has a high hardness, high strength, good machinability and mechanical properties as well as strong chemical and wear corrosion resistance. The characteristics of the 1060 industry pure aluminum is high plasticity, good corrosion resistance, good electrical conductivity and thermal conductivity, but low strength and hardness. The 1060 industry pure aluminum is widely used for chemical equipment such as capacitors, wires, cable protective sleeves, nets, wire cores, and aircraft ventilation systems. T2 copper has good thermal conductivity, electrical conductivity, machining performance, and corrosion resistance. The 6061 aluminum alloy has good machining performance, good corrosion resistance, and a good oxidation effect. In order to investigate the anti-erosion ability of these four metals, a 150 mm length, 27 mm width metallic sample was used as the experimental sample, which was stuck up to the base. The inlet pressure of the experimental section was adjusted to 0.5 MPa and the flow rate was 20.7 L/min. The surface of these samples were well prepared by #800, #1000, #1500, and #2000 metallographic sandpaper in turn, and then polished until no obvious scratches could be observed under the microscope. These samples were then cleaned in an ultrasonic bath containing anhydrous ethanol for 5 min followed by air drying. An analytical weighing balance with a measurement accuracy of 0.00001 g was used to weigh these samples, which were finally stored in a dish-drying device. Table 1 shows the yield strength of the metallic materials in this experiment.
The weight loss of the above four metallic materials were measured using the weightlessness method. At the same time, the change in the sample surface topography was observed. The origin of the smooth surface morphology was marked before the start of the pump. Then, the pump was opened, and the cavitation flow maintained for 2 h. Then, the sample was taken out and cleaned in an ultrasonic bath for 5 min followed by air drying. The dried sample was weighed five times and the average value was taken as the weight loss of the metallic materials. The surface topography of the marked point was also photographed. Afterward, the sample was returned to the experimental section for later experiments.

3. Results

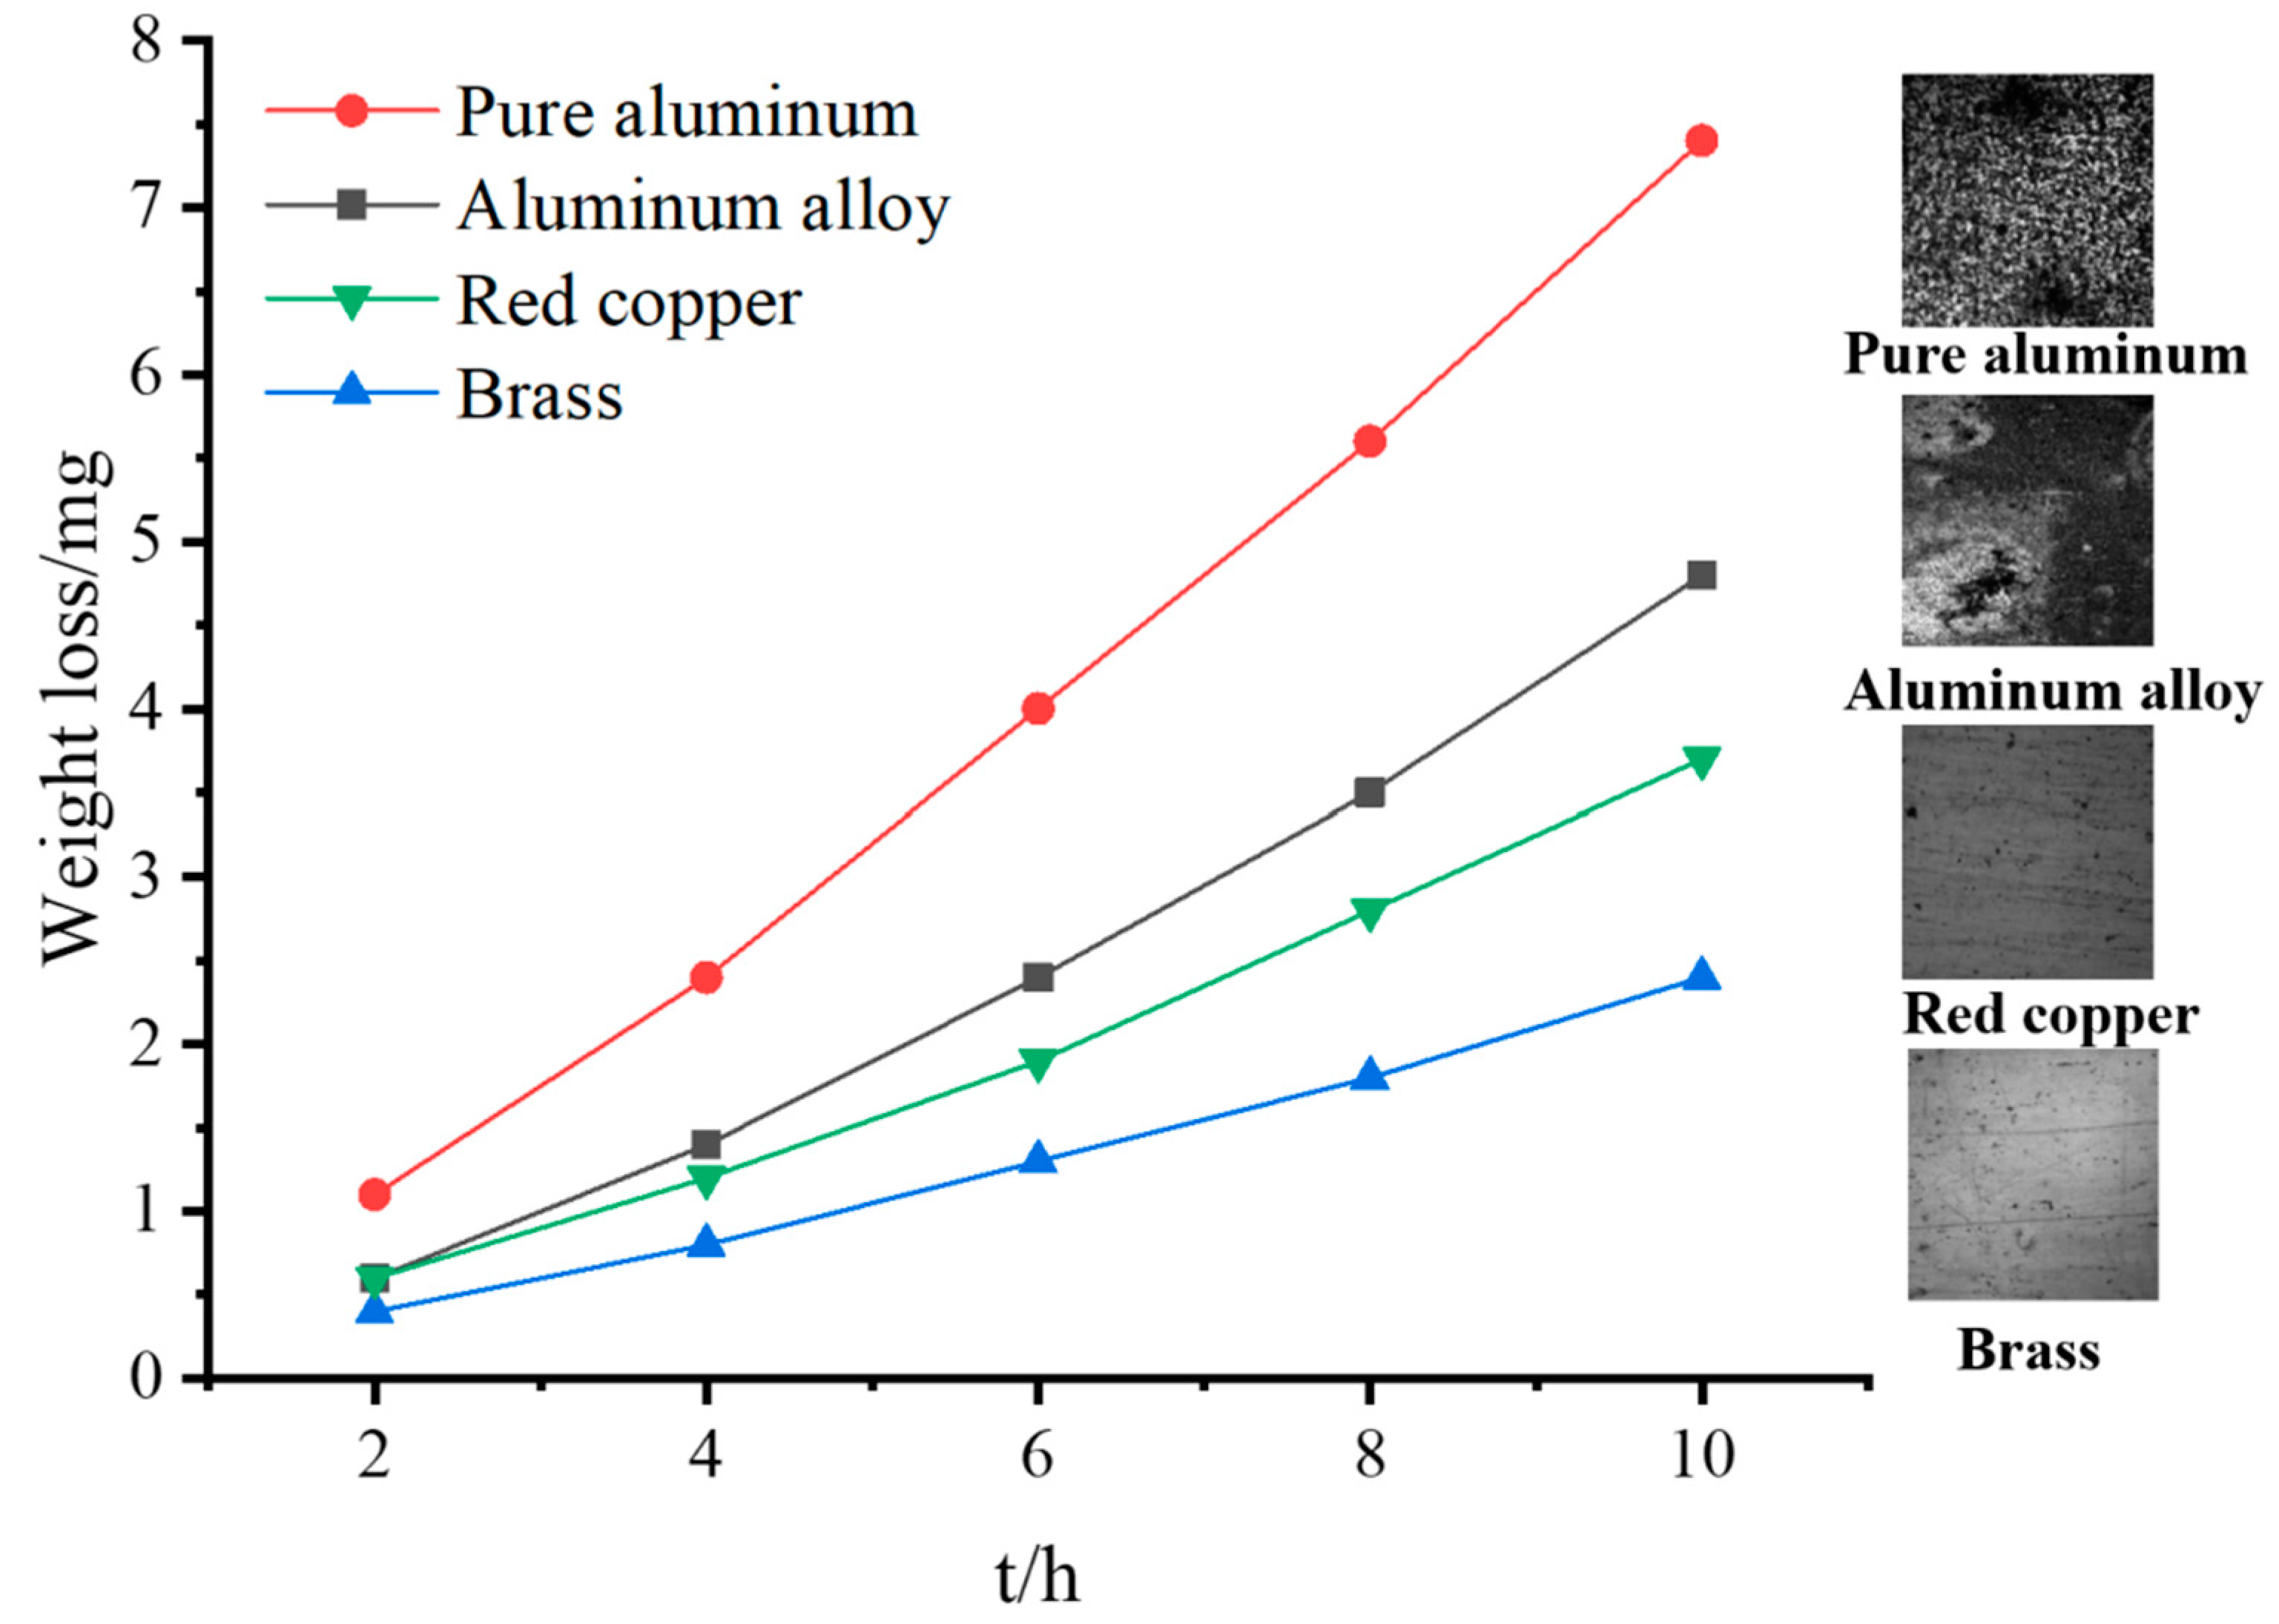
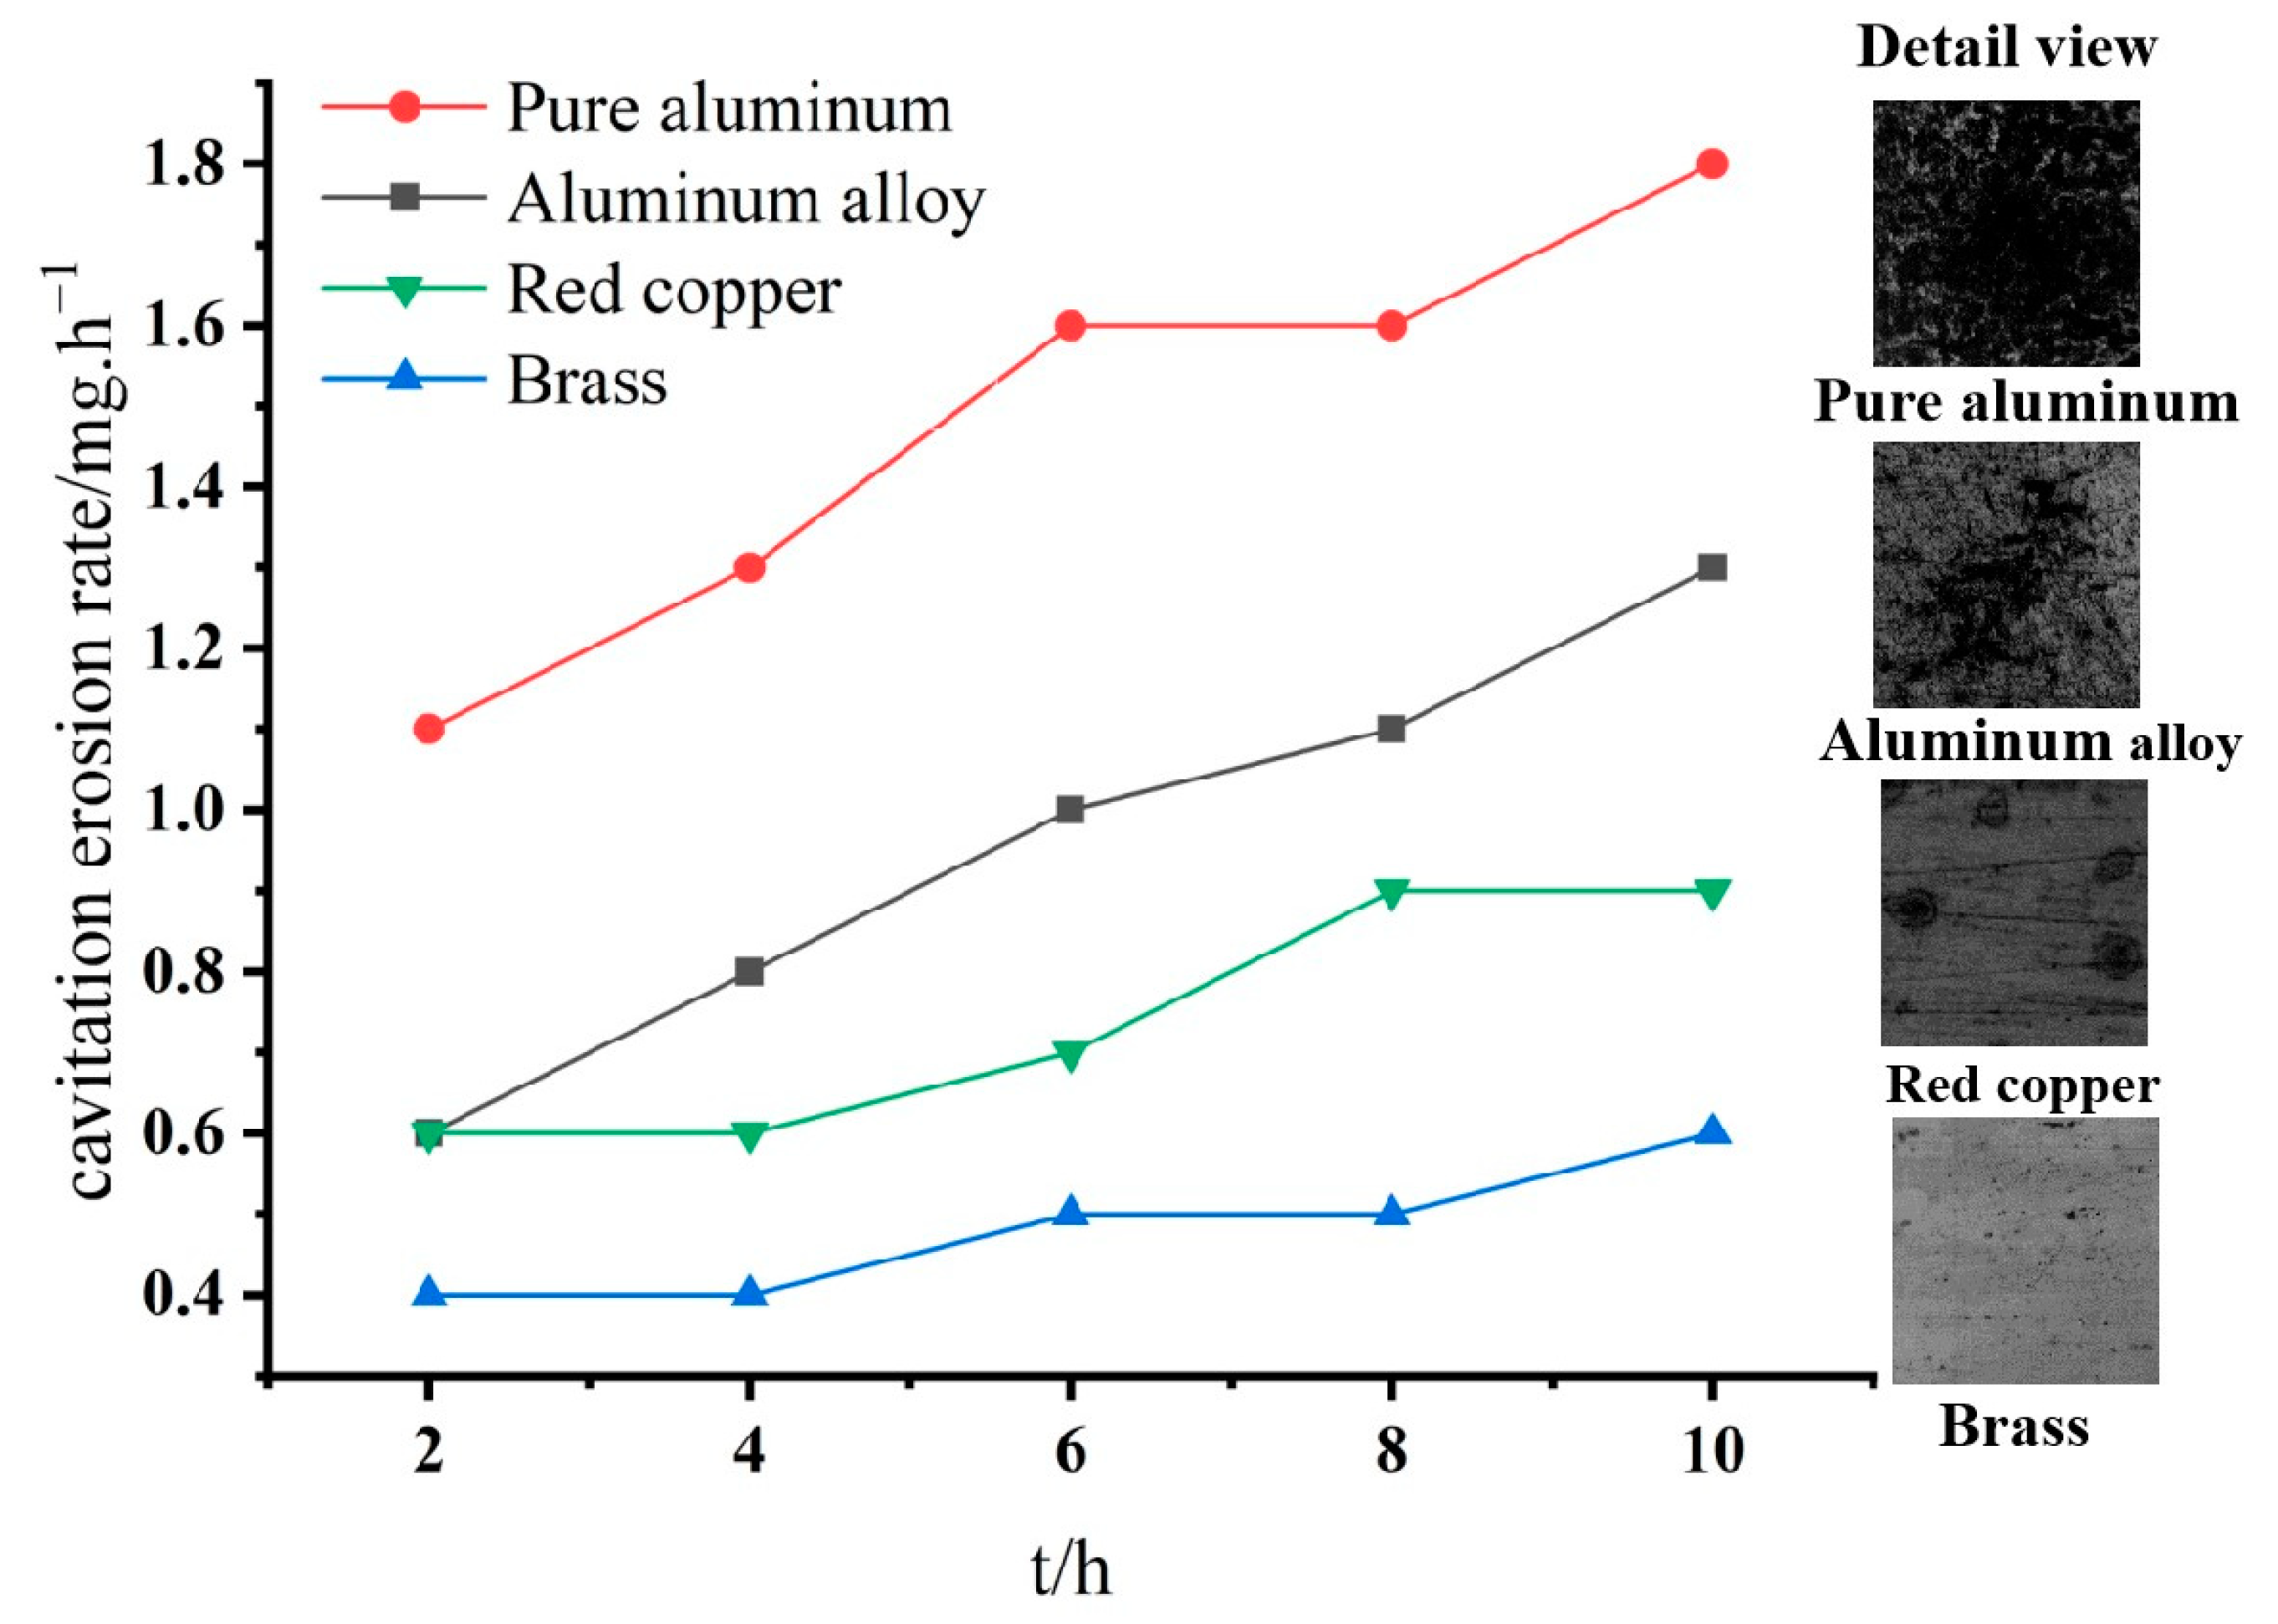
3.1. Cavitation Erosion Behavior on Different Metallic Metals

Figure 3a shows the cavitation flow during the experiment, and Figure 3b shows the shape and size of the disturbing element. The length of the disturbing element was 35 mm, its width was 40 mm, the height was 35 mm, and the angle was 45 degrees. Two grooves were machined at its bottom, and were fixed by bolts. It could be seen that the cavitation clouds originated in the back of the disturbing element, which flowed downstream and collapsed later. The intensity of the cavitation clouds decreased gradually far away from the disturbing element.
In order to calculate the cavitation damage of the metallic metals under the condition of cavitation flow quantitatively, the weight loss of the four different metallic samples under the action of cavitation flow from 2 h to 20 h was calculated. The weight loss was calculated as follows:
Δ W = W 0 W i
The cavitation erosion rate was calculated as follows:
Δ W = ( W i 1 W i ) / Δ t
where Δ W is the weight loss of metallic sample; W 0 is the original weight before testing; W i is the actual weight after testing; Δ W is the cavitation erosion rate; Δ t is the cavitation acting time.
Figure 4 is the weight loss of the metallic sample with increasing acting time. The right column is the surface morphology of the four different metallic materials after a 10 h cavitation acting time. It could be seen that the weight loss of the four selected metallic material samples increased gradually with the increasing acting time, and there were obvious differences among the surface morphologies of the four metals after cavitation erosion. As mentioned in Table 1, the yield strength of the four metallic material samples was: H62 brass > 6061 aluminum alloy > T2 red copper > 1060 industry pure aluminum. The 1060 industry pure aluminum material had the lowest yield strength, so the industry pure aluminum sample suffered the most severe cavitation damage during the experiment. This is the reason why the weight loss of the 1060 industry pure aluminum sample was much higher than other metallic materials. Large corrosion pits could be found on the surface of the industry pure aluminum specimen. H62 brass had the highest yield strength and good mechanical properties, so the cavitation damage in the experiment was the least. A small number of erosion pits appeared on the surface of the H62 brass, and most areas did not change significantly. Although the yield strength of the 6061 aluminum alloy was slightly higher than of the T2 red copper, the weight loss was obviously higher than red copper. A large number of corrosion pits appeared on the surface of the red copper samples because of the reciprocal action by the microjet and shock wave generated during the collapse of cavitation flow, which may be caused by the plastic deformation of the material surface. The relatively serious cavitation damage on the surface of the aluminum alloy was mainly because aluminum alloy materials often have coarse-grain defects, which will reduce the mechanical properties and fatigue resistance of the material.
Figure 5 shows the change in the cavitation erosion rate of the metallic sample with increasing acting time. The right column is the partially enlarged drawing of the damage morphology subjected to 10 h cavitation flow. The cavitation erosion rate of pure aluminum was the highest, the second was aluminum alloy, then red copper, and the lowest cavitation erosion rate was brass. It was found that there were deep erosion pits on the surface of the pure aluminum, which was a honeycomb morphology. That is to say, the pure aluminum sample was most seriously damaged. There were spongy pits on the surface of the aluminum alloy, while there were only pitted pits on the surface of the red copper. Only pinhole-like pits were found on the surface of the brass, which indicated that the material suffered the smallest cavitation damage.

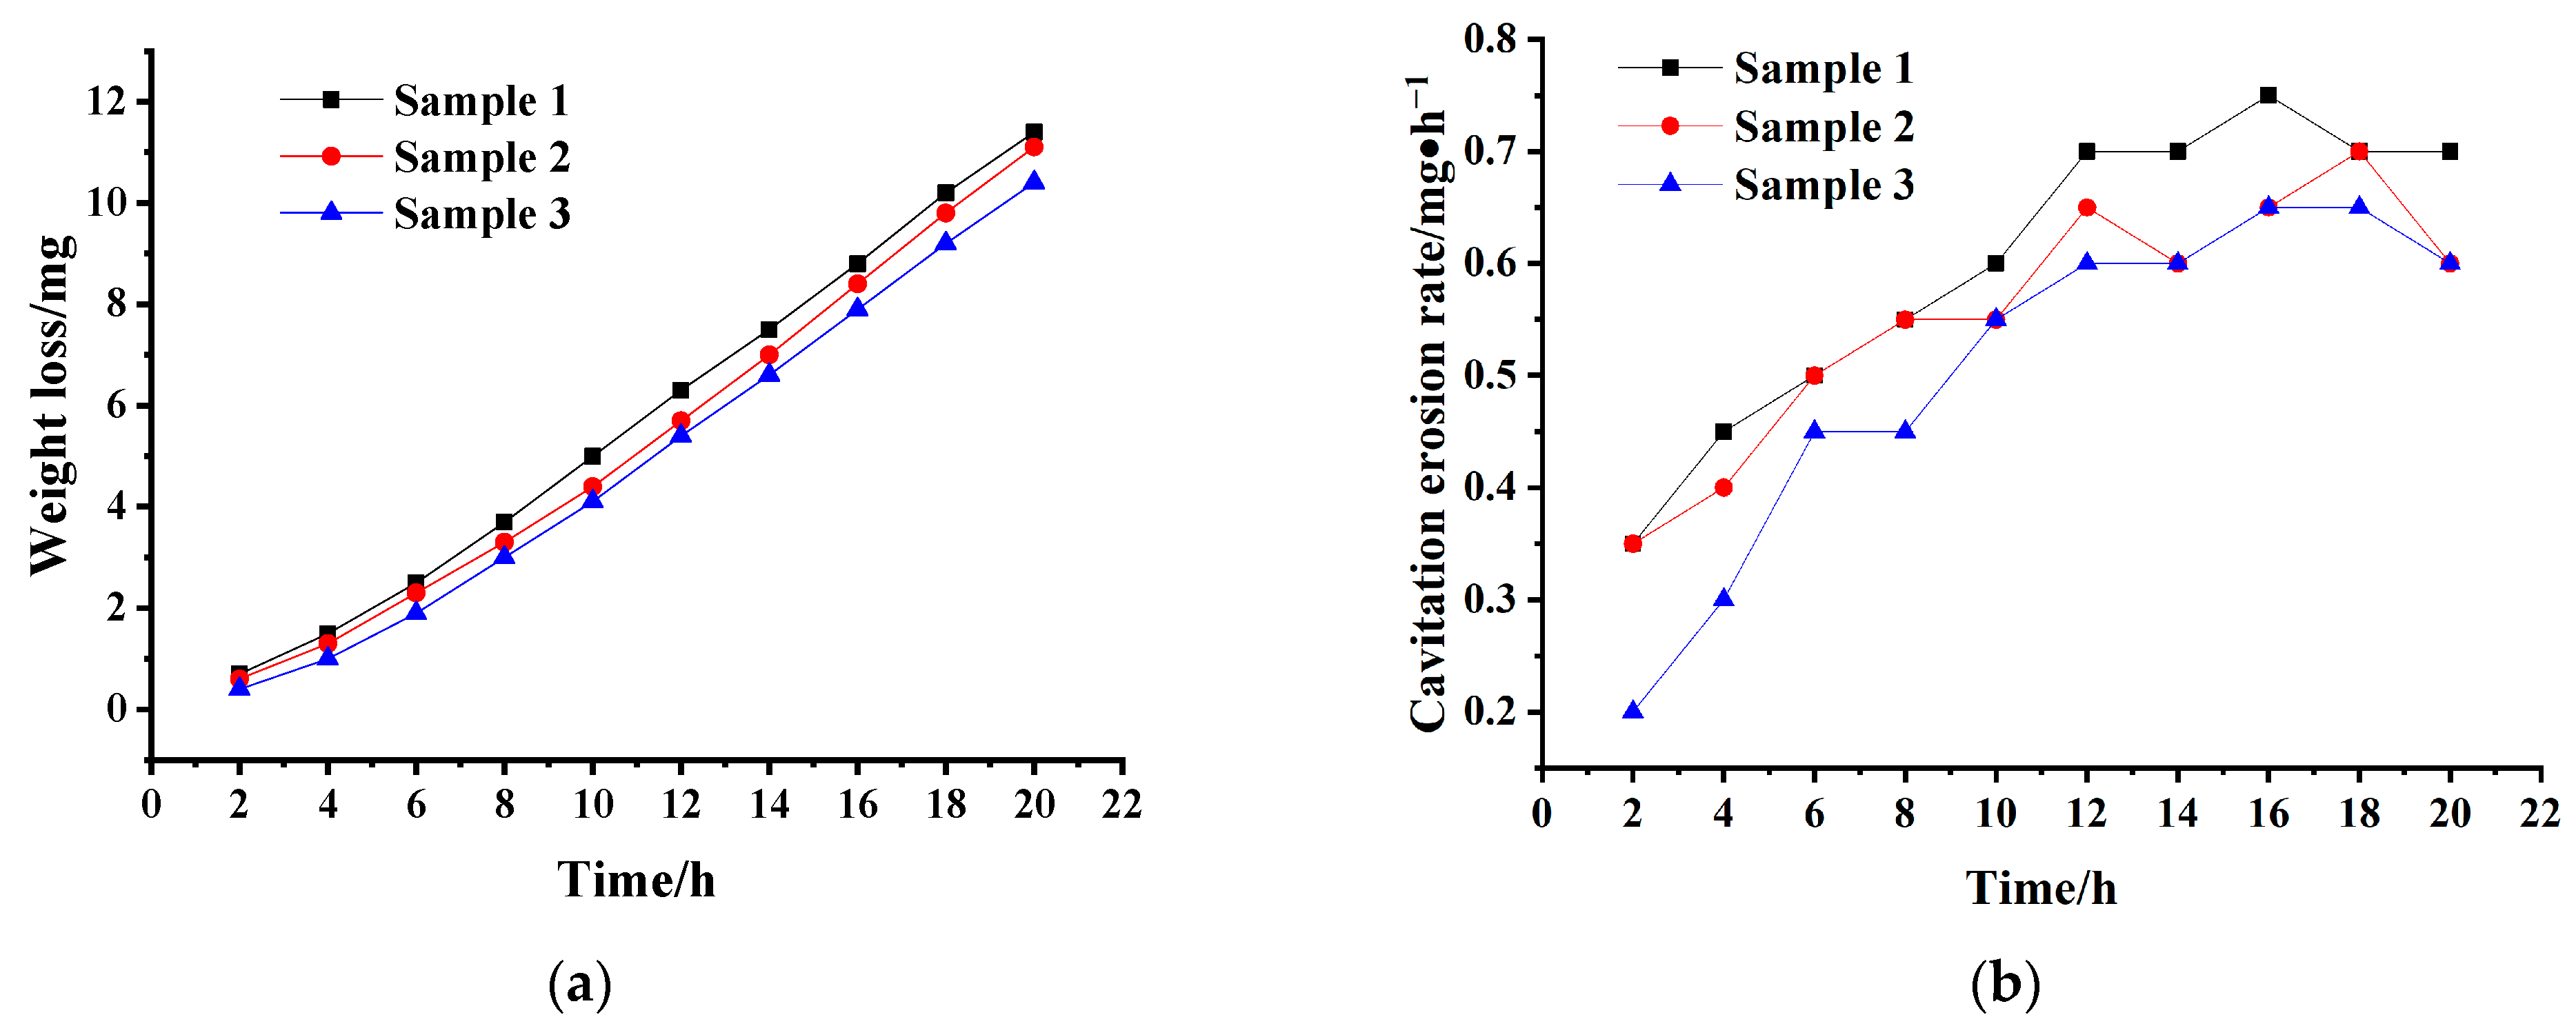
3.2. Cavitation Erosion Behavior of Brass at Different Position

As we discussed above, the brass had the best anti-cavitation erosion ability and the least weight loss, so the cavitation erosion behavior of brass was focused on in the following part. In the process of cavitation flow downstream, the water flow is accompanied by cavitation initiation, development, and collapse [18]. The degree of cavitation erosion on the metallic surface is not the same at different positions. In order to investigate the effect of the cavitation erosion of metallic materials at different flow positions of hydraulic machinery, three brass samples were selected and machined by grinding methods in order to ensure the same surface roughness. Next, these three specimens were placed on the baseplate as shown in Figure 6. Before the experiment, these three brass specimens were cleaned in an ultrasonic bath for 5 min followed by air drying. An electronic analytical balance with an accuracy of 0.1 mg was used for weighing. The inlet pressure of the experimental section was 0.5 MPa and the flow rate was 20.7 L/min. Under the action of cavitation flow for two hours, the specimens were taken out, cleaned, dried, and weighed, and their weight loss was recorded, respectively. Then, the experiment was repeated again for two hours.
Figure 7a shows the accumulated weight loss of the three brass spaces at three different test positions with an increasing action time. After the action of the cavitation flow for 20 h, the accumulated weight loss of specimen 1 was 11.4 mg, the second was specimen 2 at 11.1 mg, and the smallest one was specimen 3 at 10.4 mg. Furthermore, according to Equation (2), the cavitation erosion rate of brass specimens is presented in Figure 7b. It could be seen that the trends in the cavitation erosion rate of the brass specimens at different test positions were almost the same. The cavitation erosion rate of sample 1 rose rapidly with increasing acting time first, reached its maximum, then keep almost unchanged. The maximum cavitation erosion of sample 1 was the highest, while that of sample 3 was the lowest. That is to say, the cavitation damage of specimen 1 was the most serious, and the cavitation damage of specimen 3 was the least. Because sample 1 was close to the disturbing element, and this distribution and the position of unsteady cloud cavitation near sample 1 were similar as reported in [19]. Here, the strength of the cavitation flow was the highest, and the collapse of the cavitation clouds was stronger. The microjet induced by cavitation collapse will damage the surface of the brass or produce plastic deformation, so the damage of sample 1 was the most serious. As sample 3 was far from the disturbing element, the cavitation strength was weak and the cavitation damage of sample 3 was the weakest. Different positions from the disturbing element in the water cycling system will induce different strengths of the cavitation flow, which will also result in different degrees of cavitation damage.
As discussed above, sample 1 was more susceptible to damage by cavitation flow. Figure 8 shows the cavitation erosion rate of brass sample 1 with increasing acting time. The cavitation erosion curve of the brass specimen could be divided into three stages: the rising stage, stable stage, and attenuation stage. The acting time of 0–12 h was the rising stage and the cavitation erosion rate of the specimens increased rapidly with the increase in time. The period from 13 h to 22 h was the stable stage, where the cavitation erosion rate of the specimen showed a small fluctuation, and the overall trend was relatively stable. When the acting time was longer than 22 h, the attenuation stage is approached, and the cavitation erosion rate of the space showed a trend of decrease.

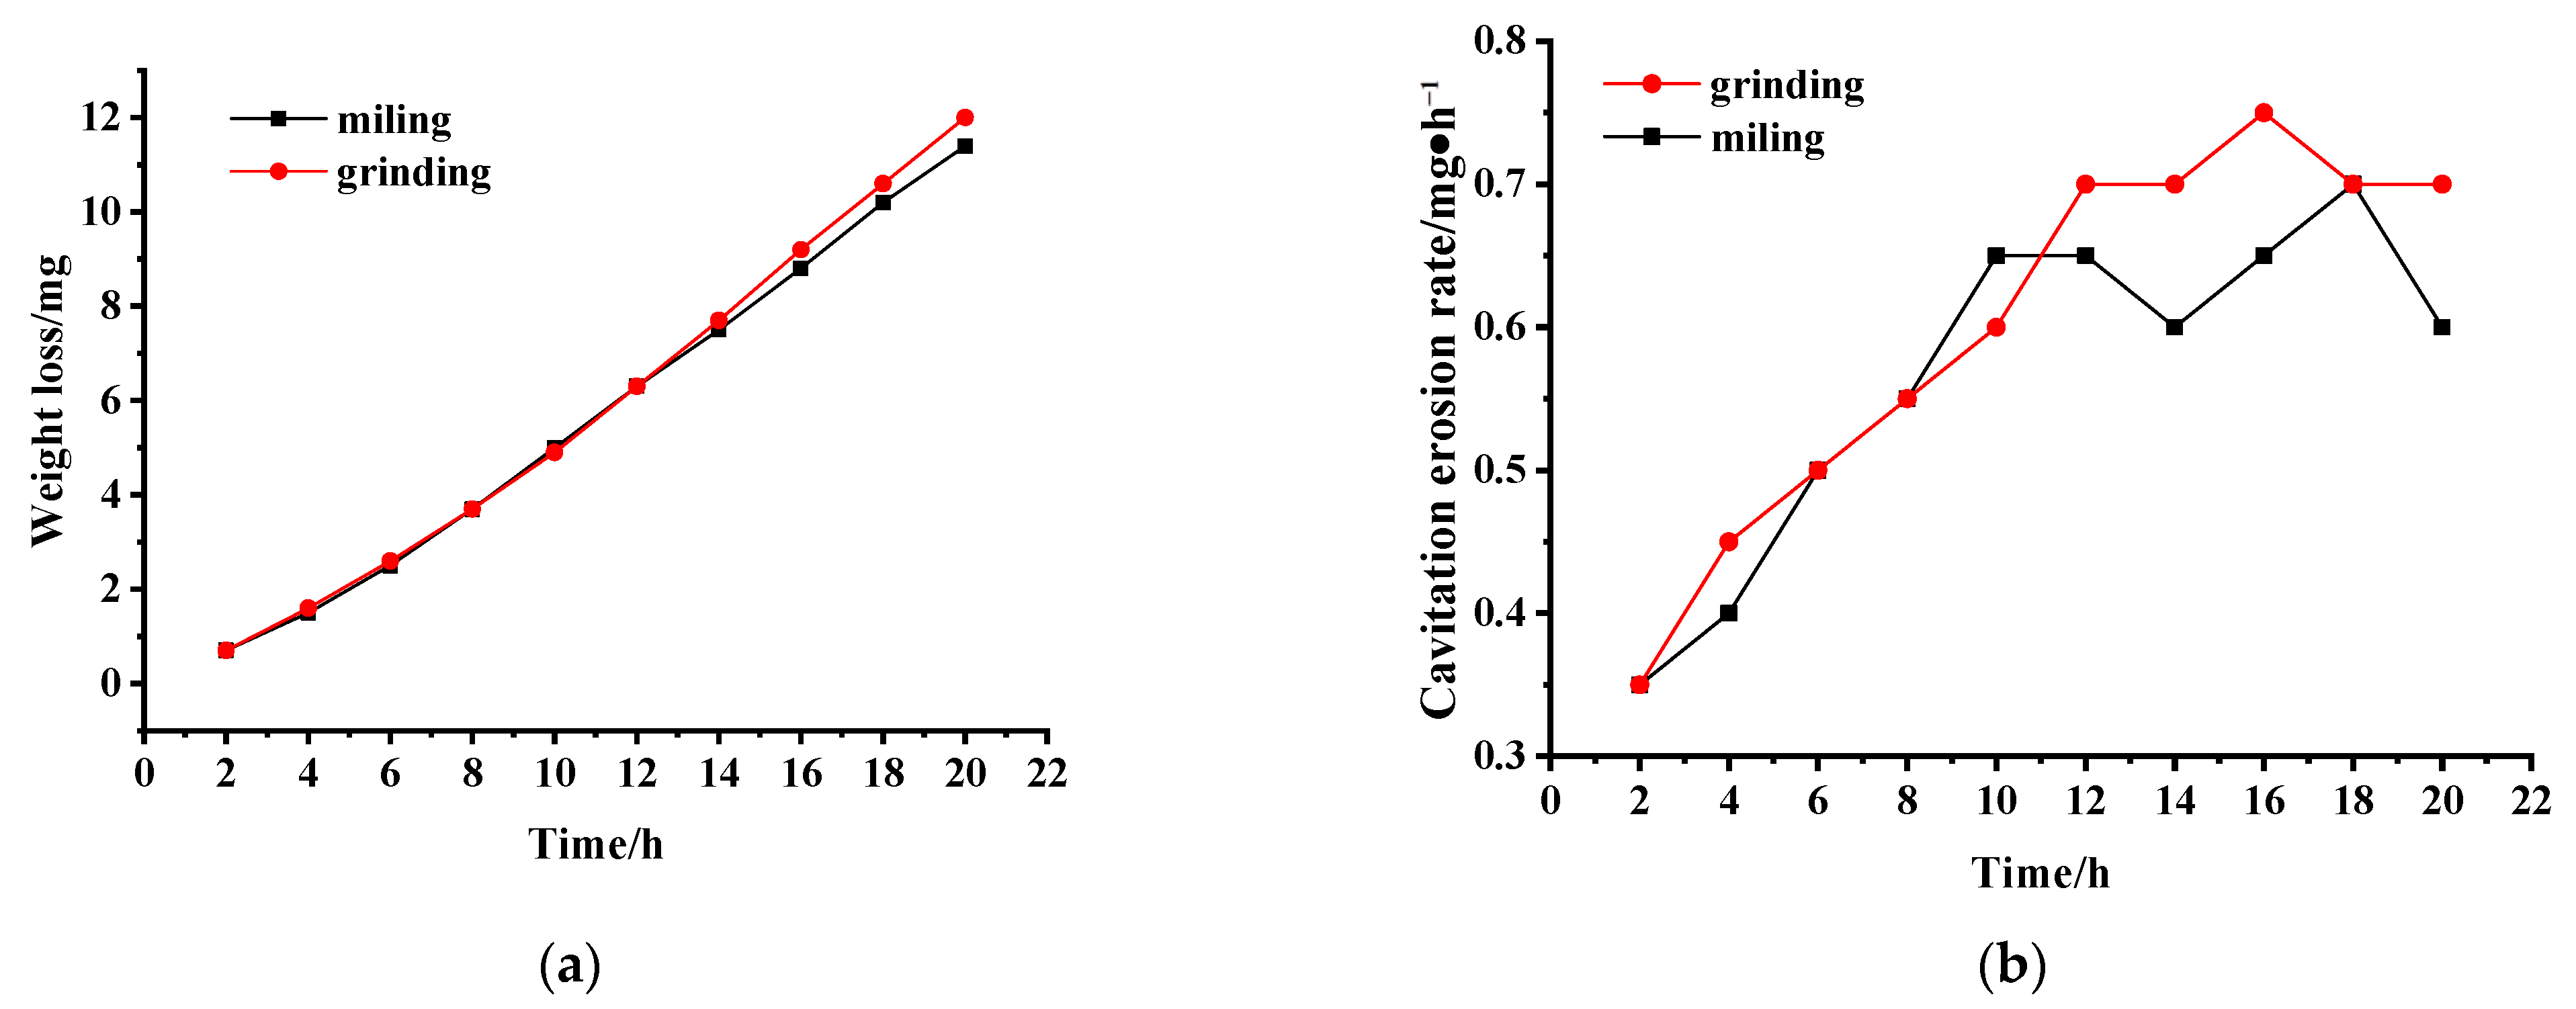
3.3. Influence of Surface Roughness on Cavitation Erosion

The roughness of the material surface has attracted the interest of many researchers [20], which is also one of the important factors affecting the cavitation erosion rate. The high roughness of the metallic surface increases the pressure loss along the flow path, which will suppress the strength of the cavitation flow. As discussed above, the brass has good anti-cavitation ability, and different machining methods of the brass will induce different surface topographies. The brass sample was machined by milling and grinding, respectively, ensuring that the surface roughness range from 0.2 to 6.3 μm. Then, the brass sample was fixed in the experimental section, and two hours later, the brass sample was cleaned in an ultrasonic bath for 5 min followed by air drying. The dried sample was weighed five times with an electronic analytical balance and the average value was taken as the weight loss of metallic materials. The surface roughness of the brass sample machined by milling was greater than the grinding method. Figure 9a shows the change in the weight loss of the brass with increasing acting time, which was machined by milling and grinding. It was found that with the increasing action time, both the weight loss of the brass sample machined by milling and grinding increased, and the weight loss of the milling specimens was slightly lower than that of grinding. Figure 9b presents the variation in the cavitation erosion rate of the milling and grinding specimens with increasing acting time. In the stable period of cavitation erosion, the cavitation erosion rate of the milling specimen was lower than that of the grinding specimen, because the roughness of the brass machined by milling was greater than that by grinding. The rough surface could reduce the average velocity of fluid, increase the pressure loss along the flow path, and suppress the cavitation strength.

4. Conclusions

Cavitation bubbles seriously affect the performance and service life of hydraulic devices such as hydraulic valves, water pumps, and marine propellers. It is urgent to study the mechanism of cavitation erosion in order to prolong the service life of hydraulic machinery. A cavitation test system was built, and four kinds of metallic samples—brass, red copper, aluminum alloy, industry pure aluminum—were used to investigate the behaviors of cavitation erosion on the metal surface. The experimental results showed that these four different materials had different anti-cavitation erosion abilities because of their different yield strengths. The anti-cavitation ability of brass was obviously better than that of the red copper, pure aluminum, and aluminum alloy. The weight loss and cavitation erosion rate of the brass were the lowest while the pure aluminum had the largest. The surface of the brass only produced pinhole-like pits, while the pure aluminum sample had serious cavitation damage, which presented a honeycomb-shaped surface topography. Furthermore, the roughness of the surface topography plays an important role in cavitation erosion. Because the roughness of the brass machined by milling was greater than grinding, the milling brass sample could increase the pressure loss along the flow path and the suppressed cavitation strength. However, there is not a simple linear relationship between the roughness of the surface and the degree of the cavitation erosion and a reasonable surface morphology could inhibit the occurrence of cavitation.

Author Contributions

Conceptualization, J.H.; Methodology, X.L.; Software and validation, B.L.; Formal analysis and data curation, J.Z.; Writing—original draft preparation, J.S. All authors have read and agreed to the published version of the manuscript.

Funding

This research was funded by the National Natural Science Foundation of China (grant number 51875559).

Institutional Review Board Statement

Not applicable.

Informed Consent Statement

Not applicable.

Conflicts of Interest

The authors declare no conflict of interest.

References

  1. Wang, M.R.; Zhu, H.R.; Liu, C.L.; Guo, T.; Zhang, L.; Li, N. Numerical analysis and design optimization on full coverage film-cooling for turbine guided vane. Eng. Appl. Comp. Fluid Mech. 2022, 16, 904–936. [Google Scholar] [CrossRef]
  2. Xu, B.; Cheng, M. Motion control of multi-actuator hydraulic systems for mobile machineries: Recent advancements and future trends. Front. Mech. Eng. 2018, 13, 151–166. [Google Scholar] [CrossRef]
  3. Chahine, G.L.; Franc, J.P.; Karimi, A. Advanced Experimental and Numerical Techniques for Cavitation Erosion Prediction; Fluid Mechanics and Its Applications; Springer: Dordrecht, The Netherlands, 2014; Volume 106. [Google Scholar] [CrossRef]
  4. Hammitt, F.G. Temperature effects on single bubble collapse and induced impulsive pressure. J. Fluids Eng.-Trans. ASME 1988, 110, 344. [Google Scholar] [CrossRef]
  5. Ni, W.W.; Cass, M.; Bartholme, D. The Jet Fuel Hydrodynamic Cavitation Bubble Size with Cavitation Power and Energy from Rayleigh-Plesset Equation. SAE Int. J. Aerosp. 2015, 8, 195–202. [Google Scholar] [CrossRef]
  6. Nigmatulin, R.I.; Aganin, A.A.; Il’gamov, M.A.; Toporkov, D.Y. Extreme Focusing of Energy during Shock Compression of the Vapor Bubble in Hydrocarbon Liquids. High Temp. 2019, 57, 228–235. [Google Scholar] [CrossRef]
  7. Turangan, C.K.; Ball, G.J.; Jamaluddin, A.R.; Leighton, T.G. Numerical studies of cavitation erosion on an elastic-plastic material caused by shock-induced bubble collapse. Proc. R. Soc. A Math. Phys. Eng. Sci. 2017, 473, 20170315. [Google Scholar] [CrossRef]
  8. Soyama, H.; Kumano, H. The fundamental threshold level—A new parameter for predicting cavitation erosion resistance. J. Test. Eval. 2002, 30, 421–431. [Google Scholar]
  9. Dockar, D.; Gibelli, L.; Borg, M.K. Shock-induced collapse of surface nanobubbles. Soft Matter 2021, 17, 6884–6898. [Google Scholar] [CrossRef] [PubMed]
  10. Dular, M.; Bachert, B.; Stoffel, B.; Širok, B. Relationship between cavitation structures and cavitation damage. Wear 2004, 257, 1176–1184. [Google Scholar] [CrossRef]
  11. Lv, Z.; Hou, R.; Zhang, Z.; Fan, Z. Effect of ultrasonic vibration on cavitation erosion of aluminum oxide in fluid jet machining. Int. J. Adv. Manuf. Technol. 2020, 111, 2911–2918. [Google Scholar] [CrossRef]
  12. Hutli, E.; Nedeljkovic, M.S.; Radovic, N.A.; Bonyár, A. The relation between the high speed submerged cavitating jet behaviour and the cavitation erosion process. Int. J. Multiph. Flow 2016, 83, 27–38. [Google Scholar] [CrossRef] [Green Version]
  13. Li, D.; Kang, Y.; Wang, X.; Ding, X.; Fang, Z. Effects of nozzle inner surface roughness on the cavitation erosion characteristics of high speed submerged jets. Exp. Therm. Fluid Sci. 2016, 74, 444–452. [Google Scholar] [CrossRef]
  14. Paolantonio, M.; Hanke, S. Damage mechanisms in cavitation erosion of nitrogen-containing austenitic steels in 3.5% NaCl solution. Wear 2021, 464–465, 203526. [Google Scholar] [CrossRef]
  15. Sarc, A.; Stepisnik-Perdih, T.; Petkovsek, M.; Dular, M. The issue of cavitation number value in studies of water treatment by hydrodynamic cavitation. Ultrason. Sonochem. 2017, 34, 51–59. [Google Scholar] [CrossRef] [PubMed]
  16. Wang, Y.; Zhuang, S.; Liu, H.; Zhao, Z.; Dular, M.; Wang, J. Image post-processed approaches for cavitating flow in orifice plate. J. Mech. Sci. Technol. 2017, 31, 3305–3315. [Google Scholar] [CrossRef]
  17. Hattori, S.; Nakao, E. Cavitation erosion mechanisms and quantitative evaluation based on erosion particles. Wear 2001, 249, 839–845. [Google Scholar] [CrossRef]
  18. Nouri, J.M.; Vasilakos, I.; Yan, Y.Y.; Reyes-Aldasoro, C.C. Effect of Viscosity and Speed on Oil Cavitation Development in a Single Piston-Ring Lubricant Assembly. Lubricants 2019, 7, 88. [Google Scholar] [CrossRef] [Green Version]
  19. Dular, M.; Khlifa, I.; Fuzier, S.; Maiga, M.A.; Coutier-Delgosha, O. Scale effect on unsteady cloud cavitation. Exp. Fluids 2012, 53, 1233–1250. [Google Scholar] [CrossRef]
  20. Qian, P.F.; Pu, C.W.; Liu, L.; Li, X.; Zhang, B.; Gu, Z.Y.; Meng, D.Y. Development of a new high-precision friction test platform and experimental study of friction characteristics for pneumatic cylinders. Meas. Sci. Technol. 2022, 33, 065001. [Google Scholar] [CrossRef]
Figure 1. Experimental setup. (a) Water-cycling system. (b) Optical measurement part.
Applsci 12 05840 g001
Figure 2. The transparent test section.
Applsci 12 05840 g002
Figure 3. (a) Cavitation flows in the experimental section. (b) Shape of the disturbing element.
Applsci 12 05840 g003
Figure 4. The weight loss of different metallic materials samples vs. acting time.
Applsci 12 05840 g004
Figure 5. The cavitation erosion rate of different metallic materials samples vs. acting time.
Applsci 12 05840 g005
Figure 6. The metallic material samples at different positions.
Applsci 12 05840 g006
Figure 7. (a) The cumulative weight loss curves of brass samples with increasing acting time. (b) Curves of the cavitation erosion of brass samples with increasing action time.
Applsci 12 05840 g007
Figure 8. The developmental stage of the brass sample under increasing acting time.
Applsci 12 05840 g008
Figure 9. (a) The cumulative weight loss curves of the brass specimens with increasing acting time. (b) The cumulative weight loss curves of the brass specimens with increasing acting time.
Applsci 12 05840 g009
Table 1. The yield strength of the four selected metallic materials.
MaterialH62 BrassT2 Red Copper6061 Aluminum-Alloy1060 Industry Pure Aluminum
Yield strength (MPa)12070–9010335
Publisher’s Note: MDPI stays neutral with regard to jurisdictional claims in published maps and institutional affiliations.

