Article

Photoreactor-Initiated Acetaldehyde Conversion Rate of a TiO2-Surface-Treated Alumina Photocatalyst Prepared Using the Sol–Gel Method

1
Green Energy & Nano R&D Group, Seonam Division, Korea Institute of Industrial Technology (KITECH), 6 Cheomdangwagi-ro 208 beon-gil, Buk-gu, Gwangju 61012, Korea
2
School of Materials Science & Engineering, Chonnam National University, Yongbong-ro 77, Buk-gu, Gwangju 61186, Korea
3
Advanced Energy Materials and Components R&D Group, Dongnam Division, Korea Institute of Industrial Technology (KITECH), 42-7, Baegyang-daero 804 beon-gil, Sasang-gu, Busan 46938, Korea
4
Advanced Mechatronics R&D Group, Daegyeong Division, Korea Institute of Industrial Technology (KITECH), 320 Technosunhwan-ro, Yuga-eup, Dalseong-gun, Daegu 42994, Korea
*
Authors to whom correspondence should be addressed.
These authors contributed equally to this work.
Appl. Sci. 2022, 12(12), 5796; https://doi.org/10.3390/app12125796
Submission received: 18 May 2022 / Revised: 4 June 2022 / Accepted: 6 June 2022 / Published: 7 June 2022

Abstract

:
In this study, a TiO2–alumina photocatalyst was manufactured by coating a surface-treated alumina substrate with TiO2 sol using the sol–gel method, and the photolysis and conversion of acetaldehyde in the gas phase were evaluated. The effects of acetaldehyde flow rate (i.e., retention time), ultraviolet wavelength, moisture, and catalyst heat-treatment temperature on the conversion of acetaldehyde were investigated. The experiments confirmed that a decrease in flow rate (i.e., increase in retention time), increase in moisture level, and decrease in the ultraviolet wavelength of the light source increased the conversion rate of the gaseous acetaldehyde. Among the three heat-treatment temperatures (450, 650, and 850 °C) used in the catalyst manufacturing process, the catalyst treated at 650 °C had the highest acetaldehyde conversion rate. As a result of its increased acetaldehyde decomposition and photoefficiency, the newly manufactured TiO2–alumina photocatalyst is expected to be used alongside a photoreactor as an air-purifying filter. Furthermore, the photocatalyst surface treatment demonstrated herein can be adopted to fabricate various environmentally friendly materials in the future.

1. Introduction

Various studies have explored the incorporation of photocatalytic technology to reduce the amount of particulate matter in air. Among the diverse functions of photocatalysts, their indoor and outdoor “air purification” function has rapidly gained attention owing to the recent worldwide outbreak of a novel, contagious respiratory disease, COVID-19. Photocatalysts can reduce or decompose nitrogen oxides (NOx), sulfur oxides, and volatile organic compounds (VOCs), which are precursors that generate particulate matter through the absorption of light (ultraviolet and visible rays). Owing to their photodegradation of harmful organic substances and bacteria, reduction of air pollutants, and photooxidation capabilities, photocatalysts can be applied to preserve the environment and combat viruses that affect daily life [1,2]. Materials that can be used as photocatalysts include TiO2, SiO2, ZnO, WO3, CdS, and ZrO2, as well as perovskite-type composite metal oxides (e.g., SrTiO3 and BaTiO3), which are known to exhibit photocatalytic effects [3,4,5,6]. Among these, TiO2 is widely used as a photocatalyst because its physical and chemical stabilities do not change even when exposed to light. With its high oxidation and reduction power, it can decompose NOx (substances that are converted to fine dust) into nitric acid and VOCs into carbon dioxide (CO2) and water (H2O) [7,8]. Furthermore, TiO2 is considered a safe and environmentally friendly material [9,10].
When treating pollutants using a TiO2 photocatalyst, fine photocatalyst powder is difficult to separate from the suspension after reaction and suspended particles tend to agglomerate, so the fine particle suspension cannot be easily applied in a continuous flow process; rather, it can act as dust and TiO2 powder must be recovered after the reaction is completed [11]. Therefore, to overcome the problem, research on TiO2 thin-film manufacturing has been reported using thermal oxidation [12], sputtering [13,14,15], pyrolysis [16,17], chemical vapor deposition (CVD) [18,19,20,21], atomic layer deposition (ALD) [22,23], and sol–gel methods [24,25,26,27].
Among the aforementioned methods, sol–gel is one of the most important methods for the synthesis of various functional coating films and holds several advantages over other thin-film manufacturing techniques, such as low-temperature treatment, easy coating of large surfaces, and the possibility of forming porous thin films and homogeneous composite oxide thin films [28,29].
In addition, several studies emphasizing the immobilization of TiO2 particles or sols on a support are in progress, and the characteristics of ceramic materials as TiO2 supports for the photocatalytic decomposition of VOCs have been widely emphasized [30,31]. When TiO2 nanoparticles are dispersed on the surfaces of ceramic materials, photocatalytic activity is improved due to the high specific surface area of TiO2, high adsorption capacity, large pore volume, chemical stability, and excellent mechanical properties [32,33]. Among such materials, alumina has been extensively used as a substrate due to its high strength, durability, cost-effectiveness, and versatility [34]. A porous support facilitating such an appropriate photo-interaction can be extremely advantageous in preventing oxidation reduction [35].
TiO2 was coated on surface-treated porous alumina using a sol–gel method, heat-treated at a different firing temperature, and then a photocatalyst was inserted into the prepared functional photo reactor to perform a photo-oxidation test of acetaldehyde. The characteristics of the TiO2 photocatalyst were observed depending on the firing temperature, and the conversion rate of acetaldehyde was evaluated using the photocatalyst of surface-treated alumina by applying flow change, light source type, moisture presence, initial concentration change, and various variables. In addition, the applicability of a functional photoreactor to an environmentally friendly reactor was evaluated.

2. Materials and Methods

2.1. Materials and Reagents

For the experiments, titanium tetraisopropoxide (TTIP, 98%; Junsei Chemical Co., Tokyo, Japan) was used as a starting material for TiO2, whereas hydrochloric acid (HCl, 35%; Duksan) and acetaldehyde (Sigma-Aldrich Korea, Seoul, Korea) were used as the catalyst and target VOC, respectively. Ethanol (EtOH, 99.9%; Carlo Erba Co.) was used as a solvent and tertiary distilled water (DW; Milli-Q IQ 7000, Merck, Korea) was used for hydrolysis. Sodium hydroxide (NaOH, 50%; Duksan) and acetone (CH3COCH3, pure grade; Duksan) were used to clean the surface of the donut-shaped alumina substrate (Al2O3, diameter: 4.6 cm, inner diameter: 2.6 cm, width: 1 cm; Ju-Hyoung Ceramics Co., Gumi, Korea). All the reagents used in the experiment were reagent grade.

2.2. Alumina Substrate Preparation

Four holes with diameters of 2 mm were drilled into the alumina substrate to prevent any channeling phenomena (Figure 1a). To remove impurities on the surface of the substrate, the substrate was immersed in 0.1 N NaOH for 1 day and then washed five times with DW. The surface was rewashed with acetone before being washed with an ultrasonic cleaner (NXP1505P, KODO) at 60 °C for 30 min. After washing with water, it was sufficiently dried in an oven (ON-21E, JEIO TECH) and then used as the catalyst substrate.

2.3. Preparation of the TiO2 Photocatalyst Using the Sol–Gel Method

TiO2 sol was prepared by mixing TTIP (0.1 mol, 29 mL) and EtOH (100 mL) using a stirrer (10 min, room temperature, 800 rpm). Thereafter, a mixture of aqueous HCl (0.7 N, 2.7 mL) and EtOH (100 mL) was added, and the solution was stirred at room temperature at 800 rpm for 1 h (Figure 2). The resulting sol, which was yellowish and transparent, comprised TTIP, EtOH, and HCl (aq., 0.7 N) in a molar ratio of 1:37.2:1.5. The TiO2 sol was applied to the alumina substrate via dip coating [36].
After putting the alumina substrate in and out of the TiO2 sol, the process of drying it in an oven at 100 °C for 30 min was repeated three times, and after the final drying it was dried in an oven at 80 °C for 24 h to sufficiently dry the solvent remaining on the surface. The dried TiO2–alumina sample was heat-treated at 450, 650, and 850 °C for 3 h to compare properties according to the firing temperature; the temperature was increased at a rate of 28 °C/min for each condition.

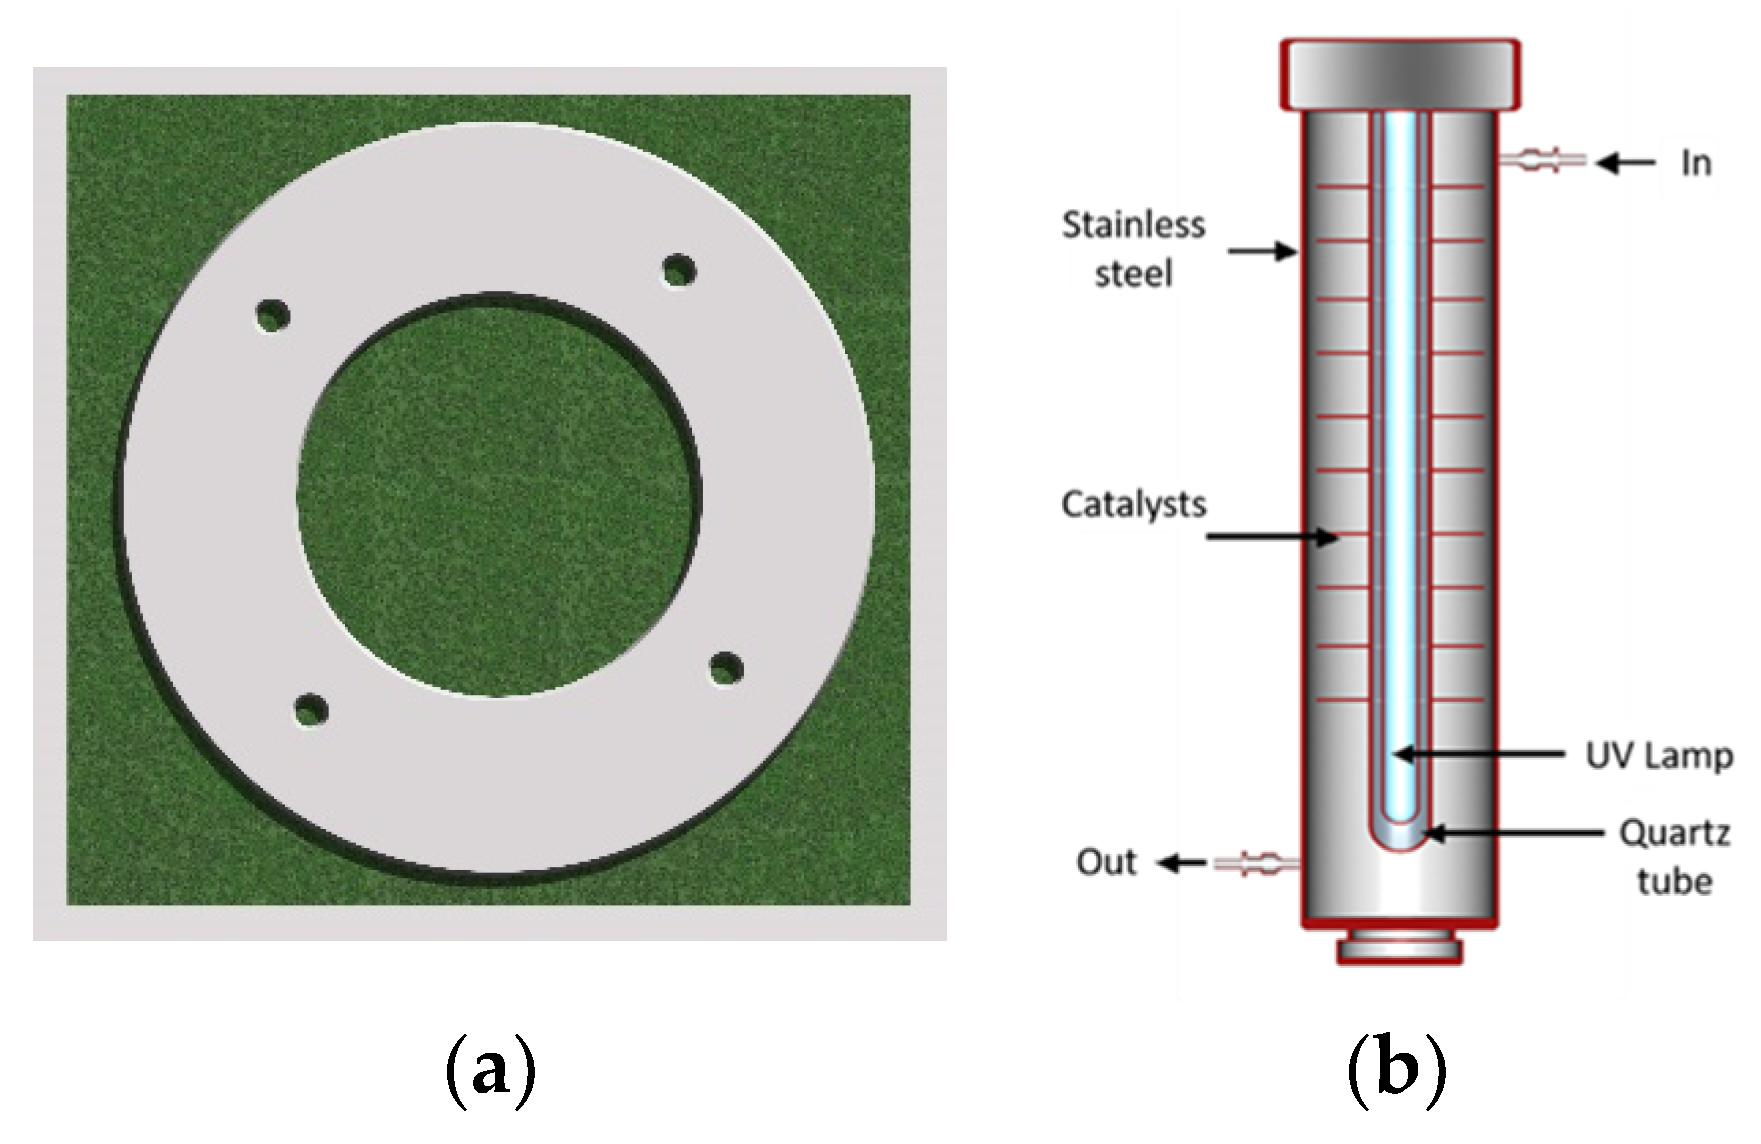
2.4. Photoreactor Manufacturing and the TiO2–Alumina Catalyst Immobilization

A stainless steel photoreactor with a diameter of 50 mm and length of 360 mm was used. UV lamps (254 nm UV-C (Easywork Co., Ansan, Korea) and 365 nm UV-A (Easywork Co., Ansan, Korea)) inside quartz tubes were used at 15 W. An injection-molded component was separately manufactured so that it could be inserted from the upper part of the reaction tube (Figure 1b). After the insertion of the injection-molded part connected to the quartz tube in the photoreactor, the screw connecting the O-ring was sufficiently tightened to prevent the leakage of internal gas. The catalyst-coated alumina substrates were placed in the center of the reaction tube by inserting 10 catalyst plates at regular intervals outside the quartz tube. An O-ring that fitted around the quartz tube was inserted under the samples to fix them at the center of the reaction tube.

2.5. Acetaldehyde Degradation Experiments

To measure the acetaldehyde degradation abilities of the catalysts, acetaldehyde was flowed through an evaporation tube installed in a low-temperature thermostat (ThermoFisher Scientific, Seoul, Korea) to a dilution tube by concomitant evaporation with air. The acetaldehyde in the dilution tube was diluted again with air to control its concentration. The concentration of acetaldehyde was adjusted by changing the temperature of the thermostat or by changing the air flow rate in the dilution tube. A water evaporator was connected, with a three-way valve in front of the dilution tube to monitor the change in moisture, and a needle valve was installed to control the flow rate entering the reaction tube (Figure 3).
A gas chromatograph and data analysis system (GC-14A, Shimadzu Scientific korea, Seoul, Korea) equipped with Porapak Q and T columns (50–80 mesh, Ø 3 mm × 3 m) was used to analyze the reactants and products.

2.6. Conversion(X) of Acetaldehyde

Before it was introduced into the photoreactor, acetaldehyde was sent only to the GC to calculate the concentration of the initial material. When the concentration of acetaldehyde became constant while continuously flowing through the GC, the light source (UV-A or UV-C) of the photoreactor was switched on, and acetaldehyde (in the gas phase) was allowed to flow into the reactor for the experiment.
The photocatalytic activity percentage of the TiO2-coated alumina substrate was calculated using the following Equation (1) [37,38]:
X % = A o A t A o × 100
where X indicates the percentage of conversion, Ao is the gas chromatography peak area of the initial acetaldehyde concentration before irradiation under UV light, and At is the acetaldehyde concentration expressed as the integrated area of gas chromatographic peak at a sampling time t (min).

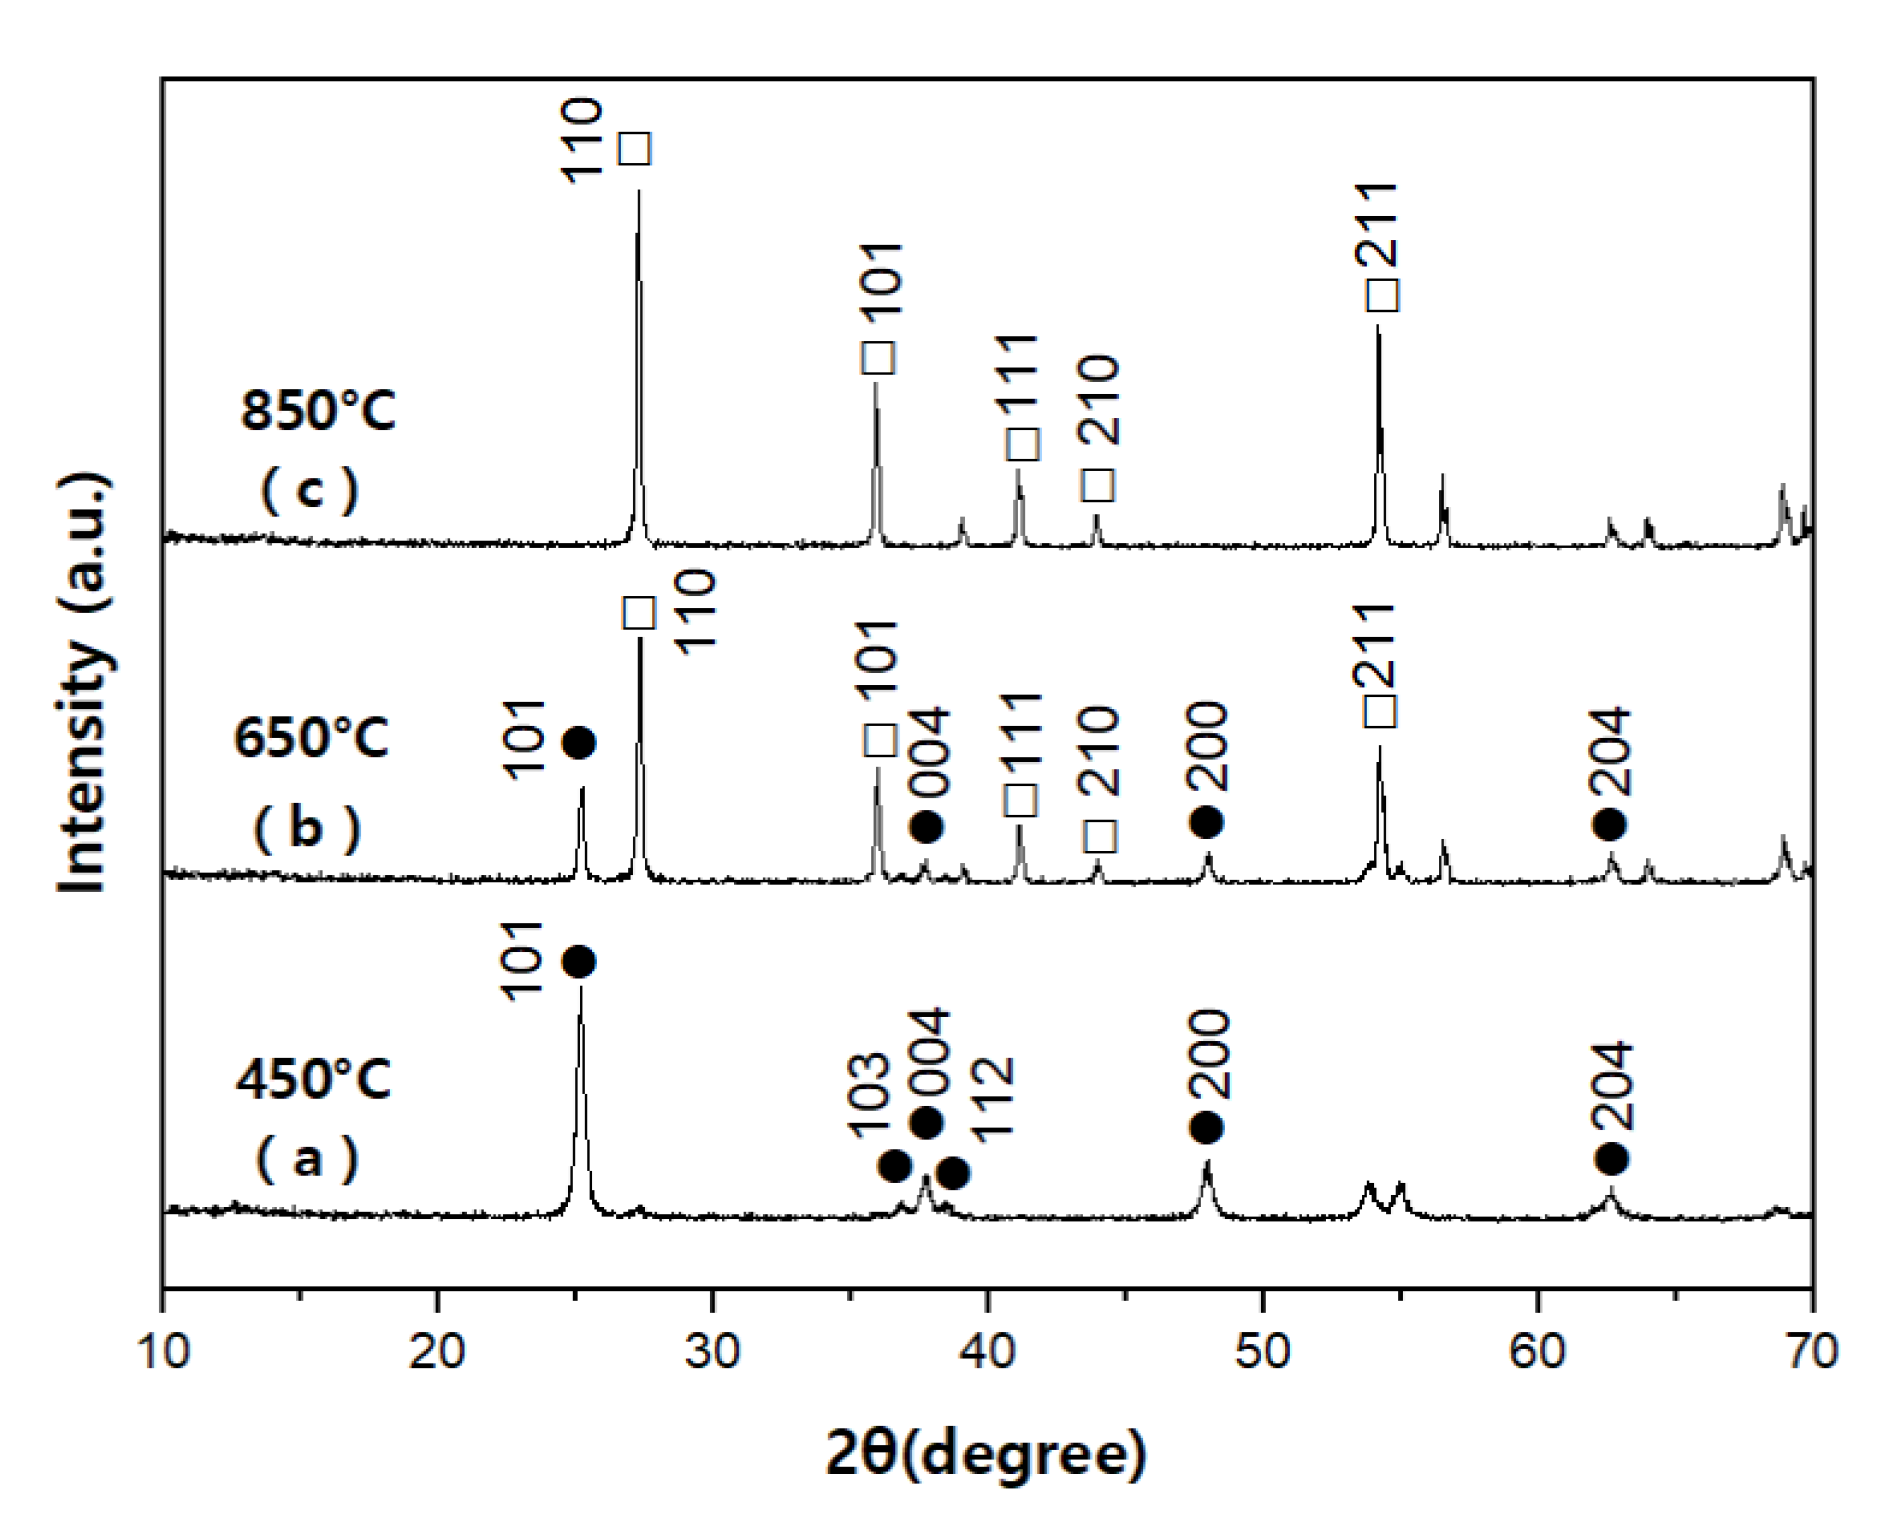
2.7. Characterization

X-ray diffraction (XRD; DMAX/1200, RIGAKU, Tokyo, Japan) was employed in continuous scan mode to identify the structural state of the catalyst (scan speed: 3°, scan step: 0.02°, scan range: 10–70°). The XRD analysis sample was measured only with TiO2 powder excluding alumina substrates. Field-emission scanning electron microscopy (FE-SEM; S-4700 microscope, HITACHI, Tokyo, Japan) was used to analyze the surfaces of the catalysts; platinum was coated on the sample surfaces prior to the FE-SEM analysis to prevent surface deformation (acceleration voltage: 15 kV, vacuum pressure: 10−6 Torr).

3. Results and Discussion

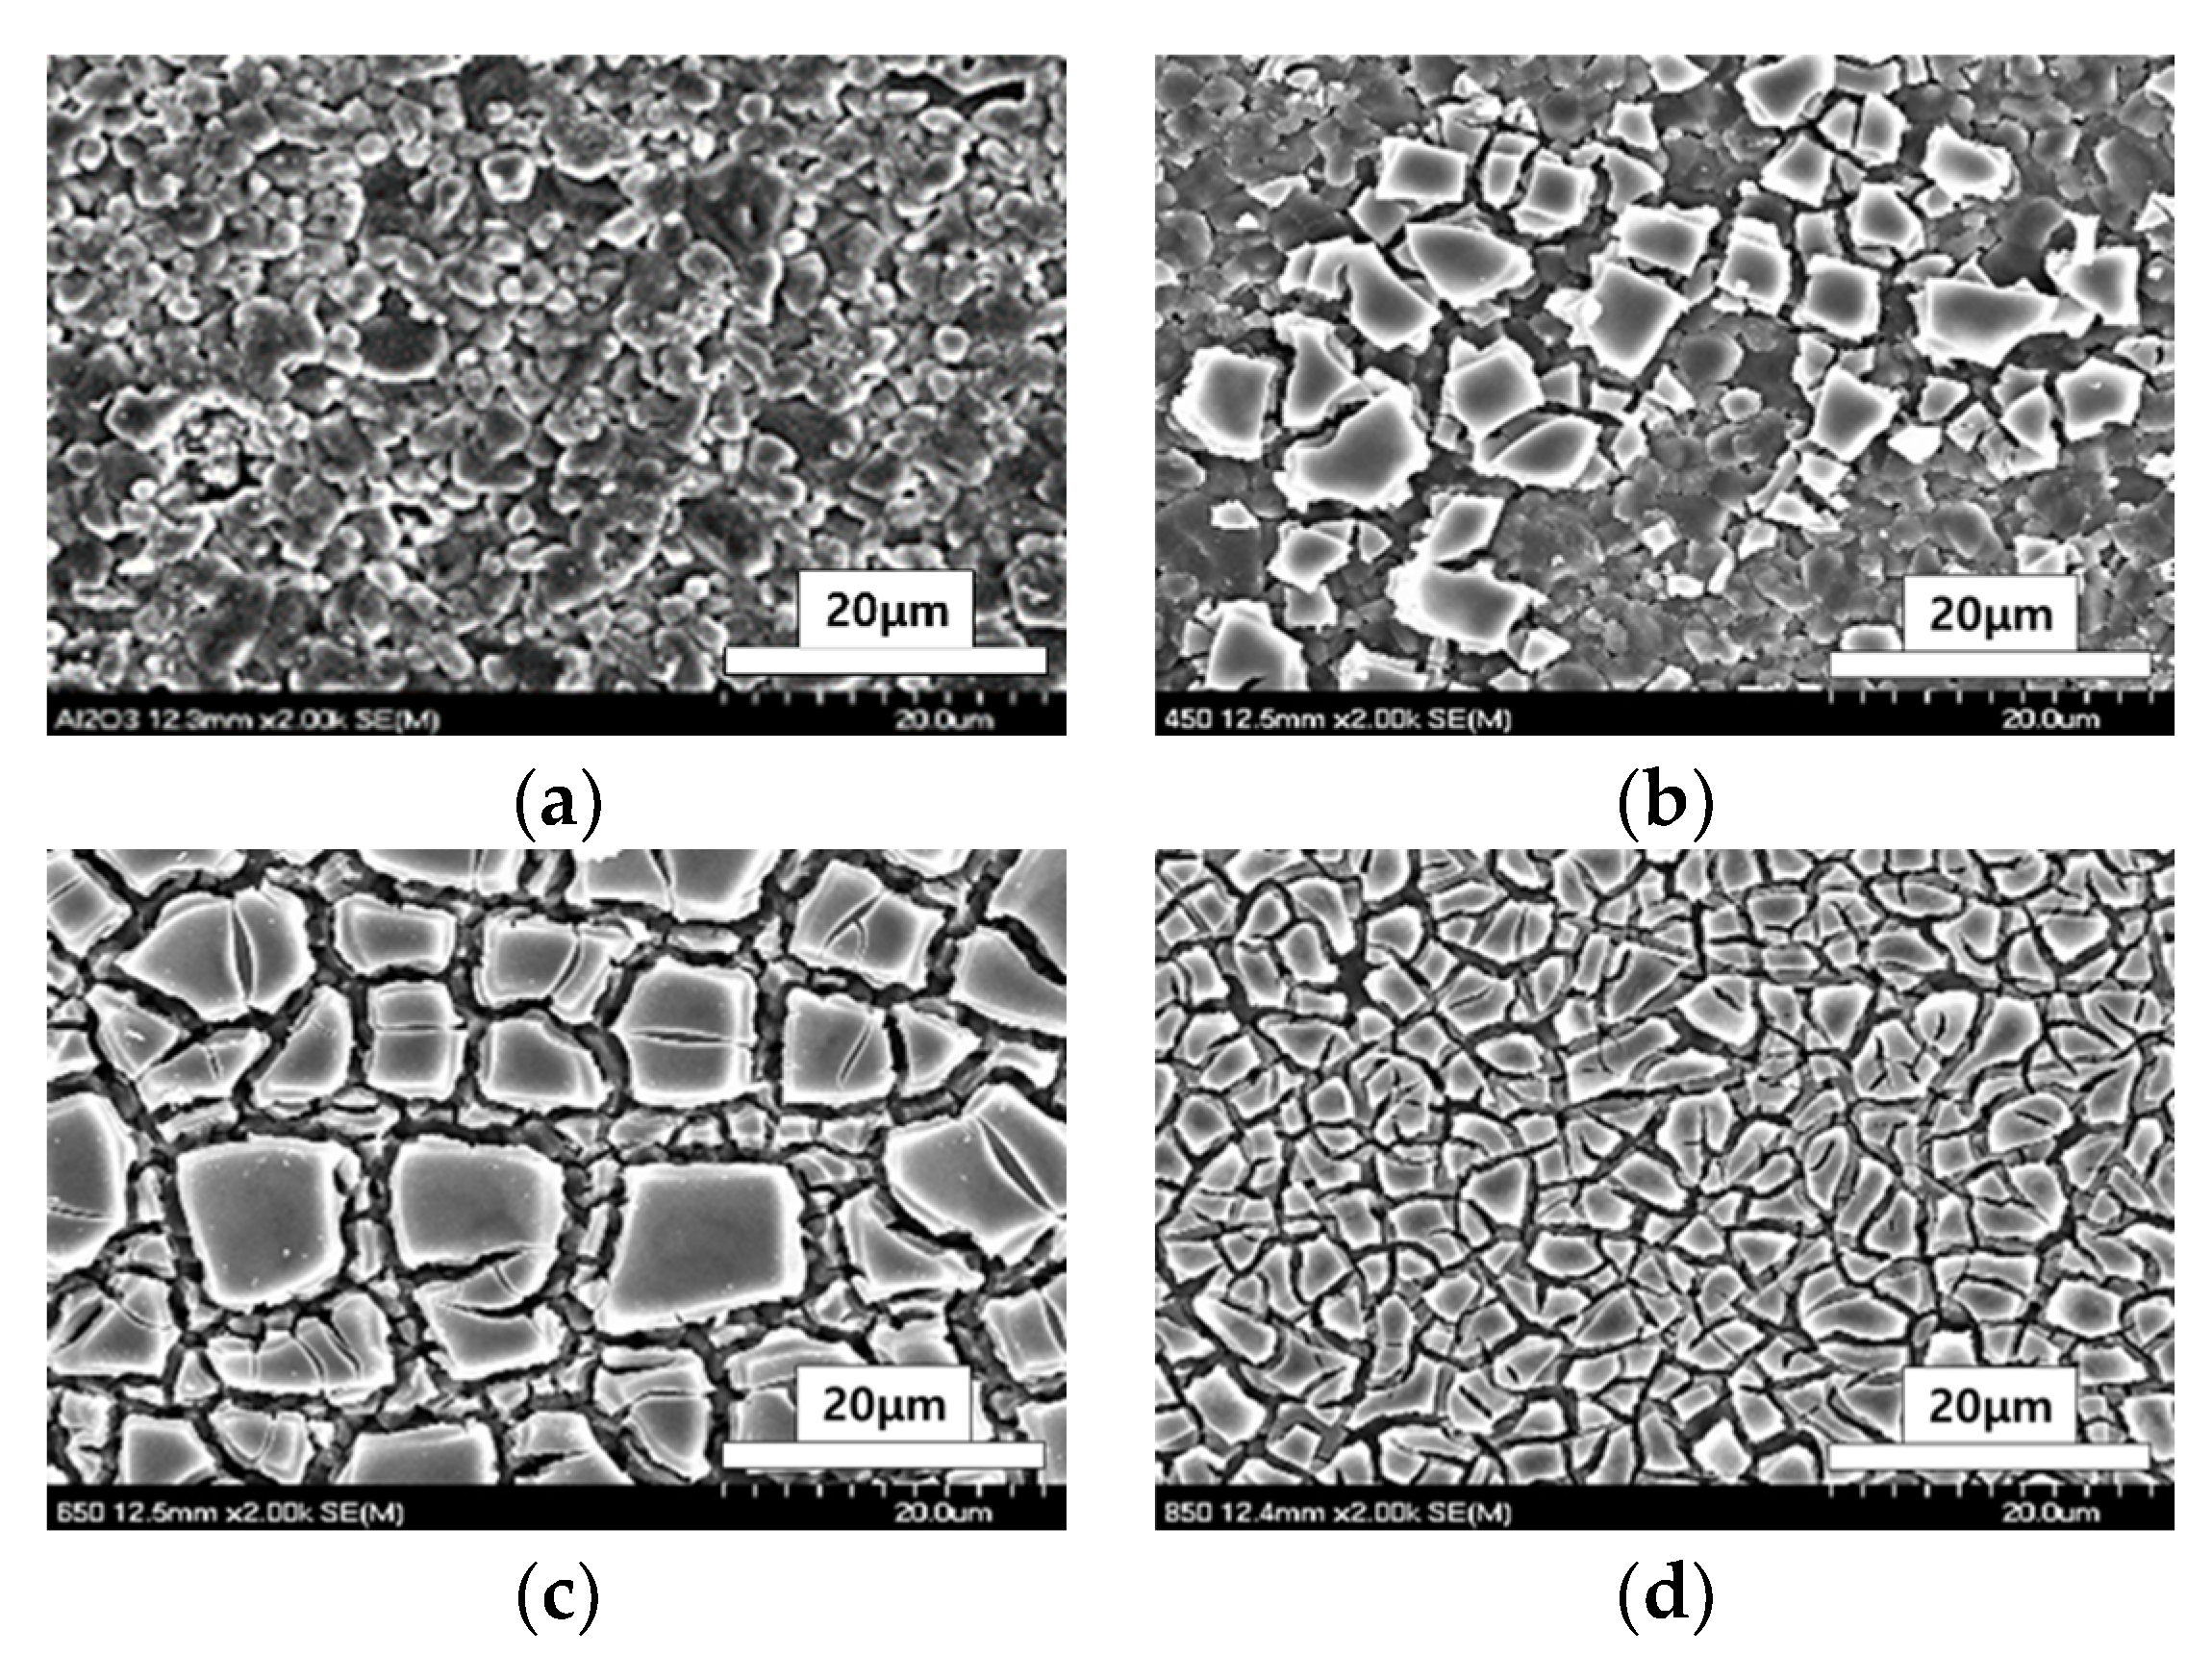
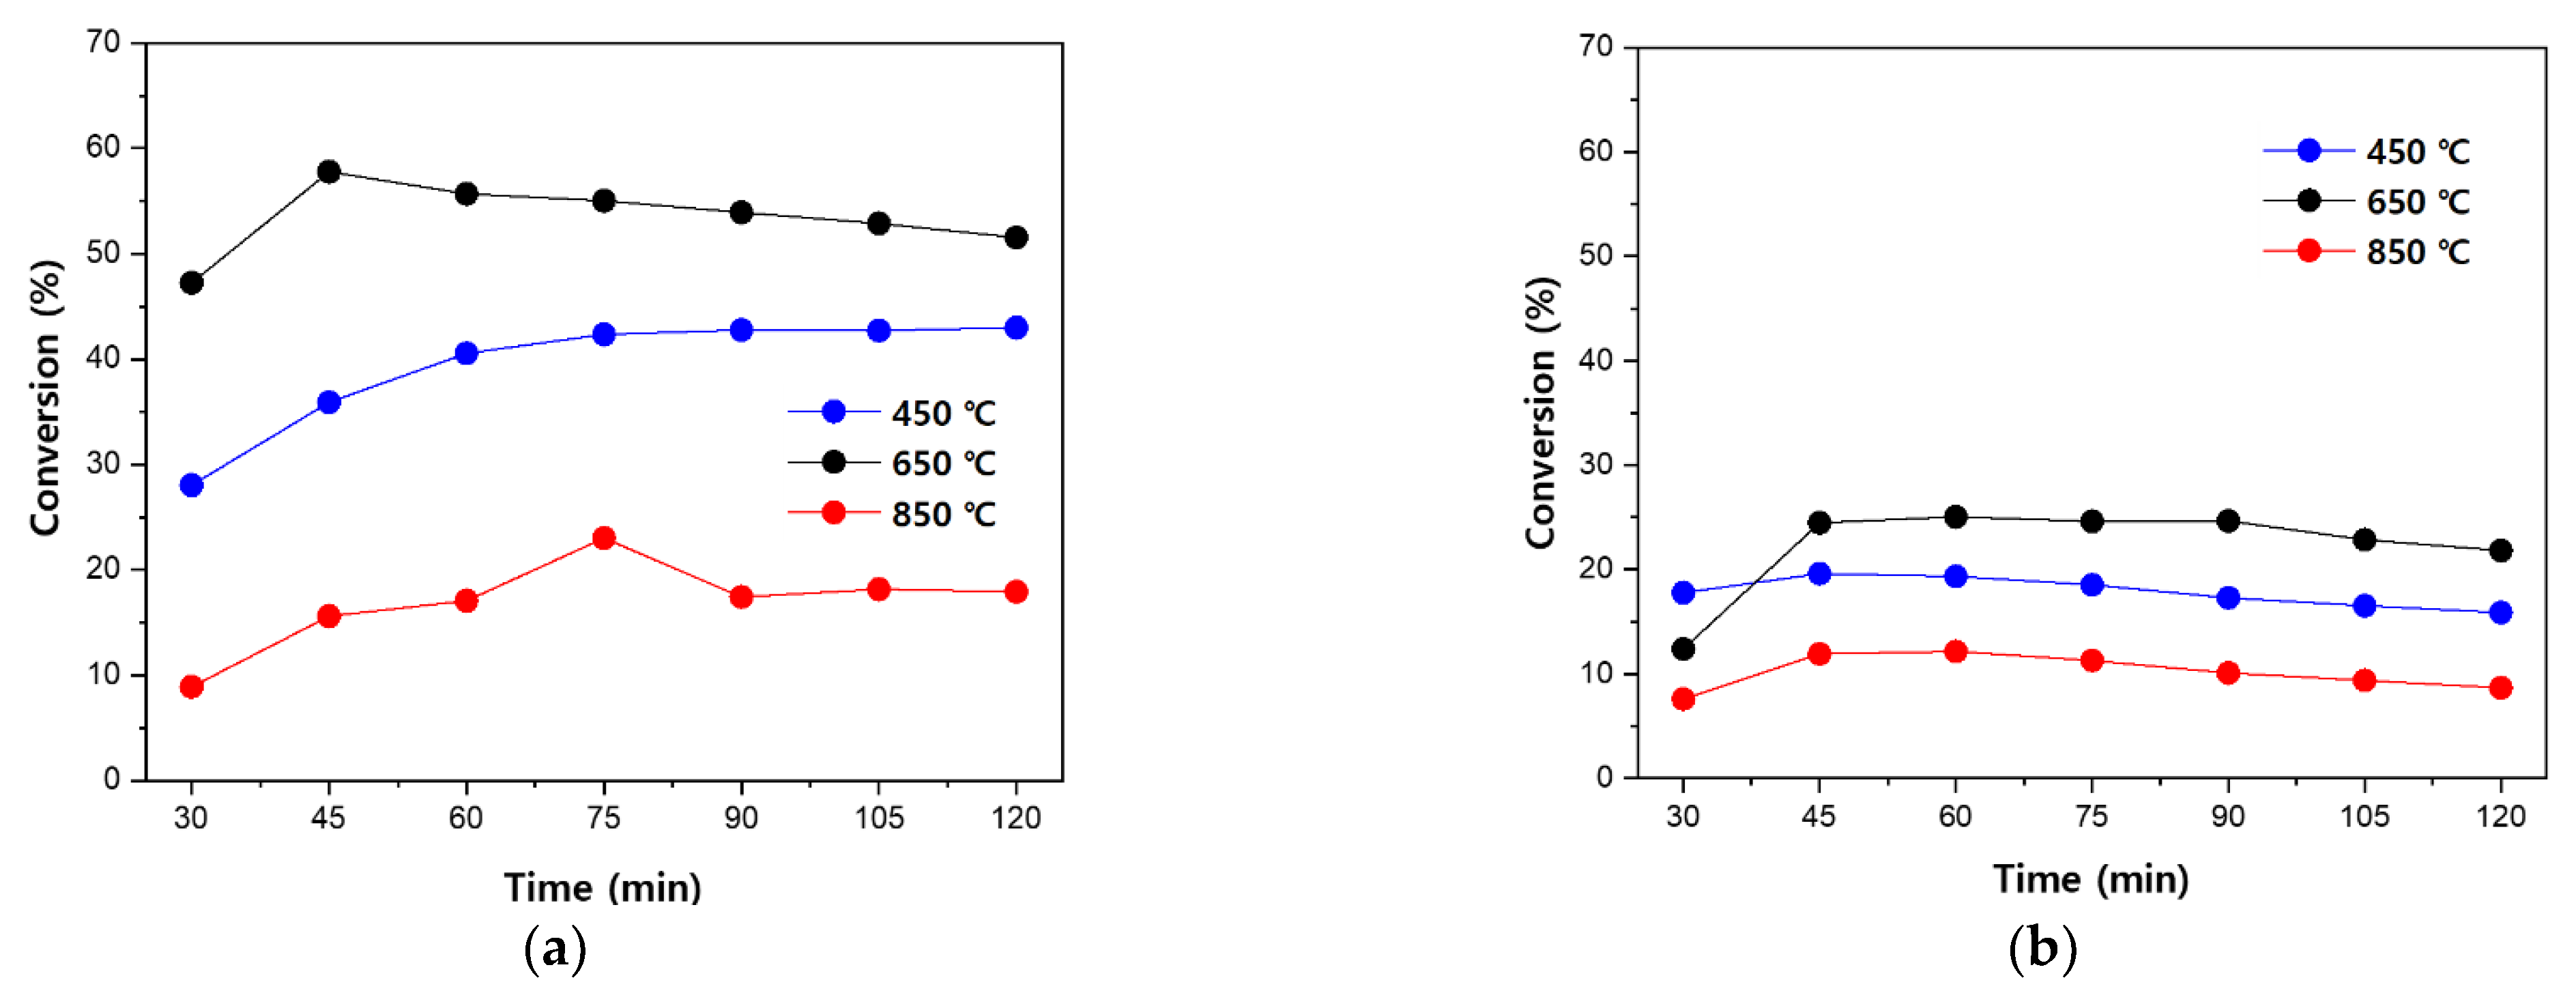
3.1. Photodegradation Characteristics of Acetaldehyde against Heat-Treatment Temperature during Catalyst Preparation

The optimum firing temperature was first determined among the three heat-treatment temperatures of 450, 650, and 850 °C. Acetaldehyde decomposition experiments were performed on three heat-treated catalysts, and the best conversion was obtained using the catalyst heat-treated at 650 °C. At an initial concentration of 1800 ppm, a maximum conversion rate of 57% was observed after 30 min of light source irradiation, which stabilized at 50% after 2 h of irradiation. The lowest conversion rate was achieved while testing catalysts heat-treated at 850 °C. The rate increased from 8% after the initial 30 min to 23% after 75 min, with a marginal conversion rate of 17–18%. The maximum conversion rate achieved using the catalyst treated at 450 °C was 43%, which was lower than that of the catalyst treated at 650 °C (Figure 4).
FE-SEM analysis was performed to observe the surface morphology of the three catalysts (Figure 5). Overall, the sol–gel thin film shrank on the surface of the alumina substrate, the pores disappeared, and the surface density increased as the heat treatment temperature increased. This was not observed for the alumina substrate without TiO2 surface treatment (control). However, surface cracks occurred in the heat-treated sample, and the density and number of cracks increased as the heat-treatment temperature increased. At 450 °C, the TiO2 thin film was not uniformly coated on the surface of the alumina substrate and cracks in the thin film appeared to coexist. Increasing the temperature from 450 °C to 650 °C and 850 °C increased the density and number of cracks, and most cracks were observed in the catalyst heat-treated at 850 °C.
The TiO2 thin film tended to shrink as the heat treatment progressed, causing the pores to disappear and densify. In addition, as the heat treatment temperature increased, tensile stress was generated. Moreover, because the thermal expansion coefficient of the alumina substrate was low, it seemed that cracks occurred on the surface when the thin film was accompanied by additional shrinkage. This can be noted in a previous study that stated the effect of annealing temperature on the crystallization stage of TiO2 thin films [39]. For cracks in such shrinkage, it seems necessary to consider the variables of the type of solvent in the initial synthesis or the firing temperature increment conditions.
Figure 6 shows the anatase phase, coexisting rutile phase, and anatase and rutile phases of the catalysts heat-treated at 450, 650, and 850 °C, respectively. In particular, the coexistence of the rutile and anatase phases occurred in the catalyst at 650 °C, which had the highest conversion rate in our experiment. As the firing temperature increased, the rutile phase was formed and showed low photocatalytic activity. The photocatalytic activity of the TiO2 thin film coated on alumina was highly dependent on the firing temperature, and the surface area of the rutile phase decreased due to the sintering and growth of the TiO2 crystal phase [40]. The crystal sizes of the treated catalysts at 450, 650, and 850 °C were calculated to be 14, 31, and 33 nm, respectively, using the Scherrer equation. Therefore, as the sintering temperature increased, the crystal size increased. This is because the sintering temperature can increase the grain size and TiO2 crystal growth can be induced as the sintering temperature rises. It can be seen that they correspond [41,42].
In this study, the highest conversion rate of the catalyst, in which the anatase and rutile phases coexisted, is consistent with the results of a previous study [43] which reported increased conversion rates for a catalyst with anatase and rutile phases mixed in a ratio of 8:2; therein lies a correlation. This is because a mixed-phase catalyst has more active sites than a catalyst having a pure crystalline phase of rutile or anatase, as the separation efficiency of electron–hole pairs is improved due to the multi-phase nature. In addition, the higher conversion rate of the catalyst treated at 450 °C (anatase phase) compared to the catalyst treated at 850 °C (rutile phase) indicates that the anatase phase is more effective in enhancing photocatalytic activity than the rutile phase. This was indirectly supported by other reports stating that the photocatalytic activity of anatase-like materials is superior to that of rutile-like materials because such materials show a higher Fermi level and surface hydroxylation on anatase than on rutile [44].

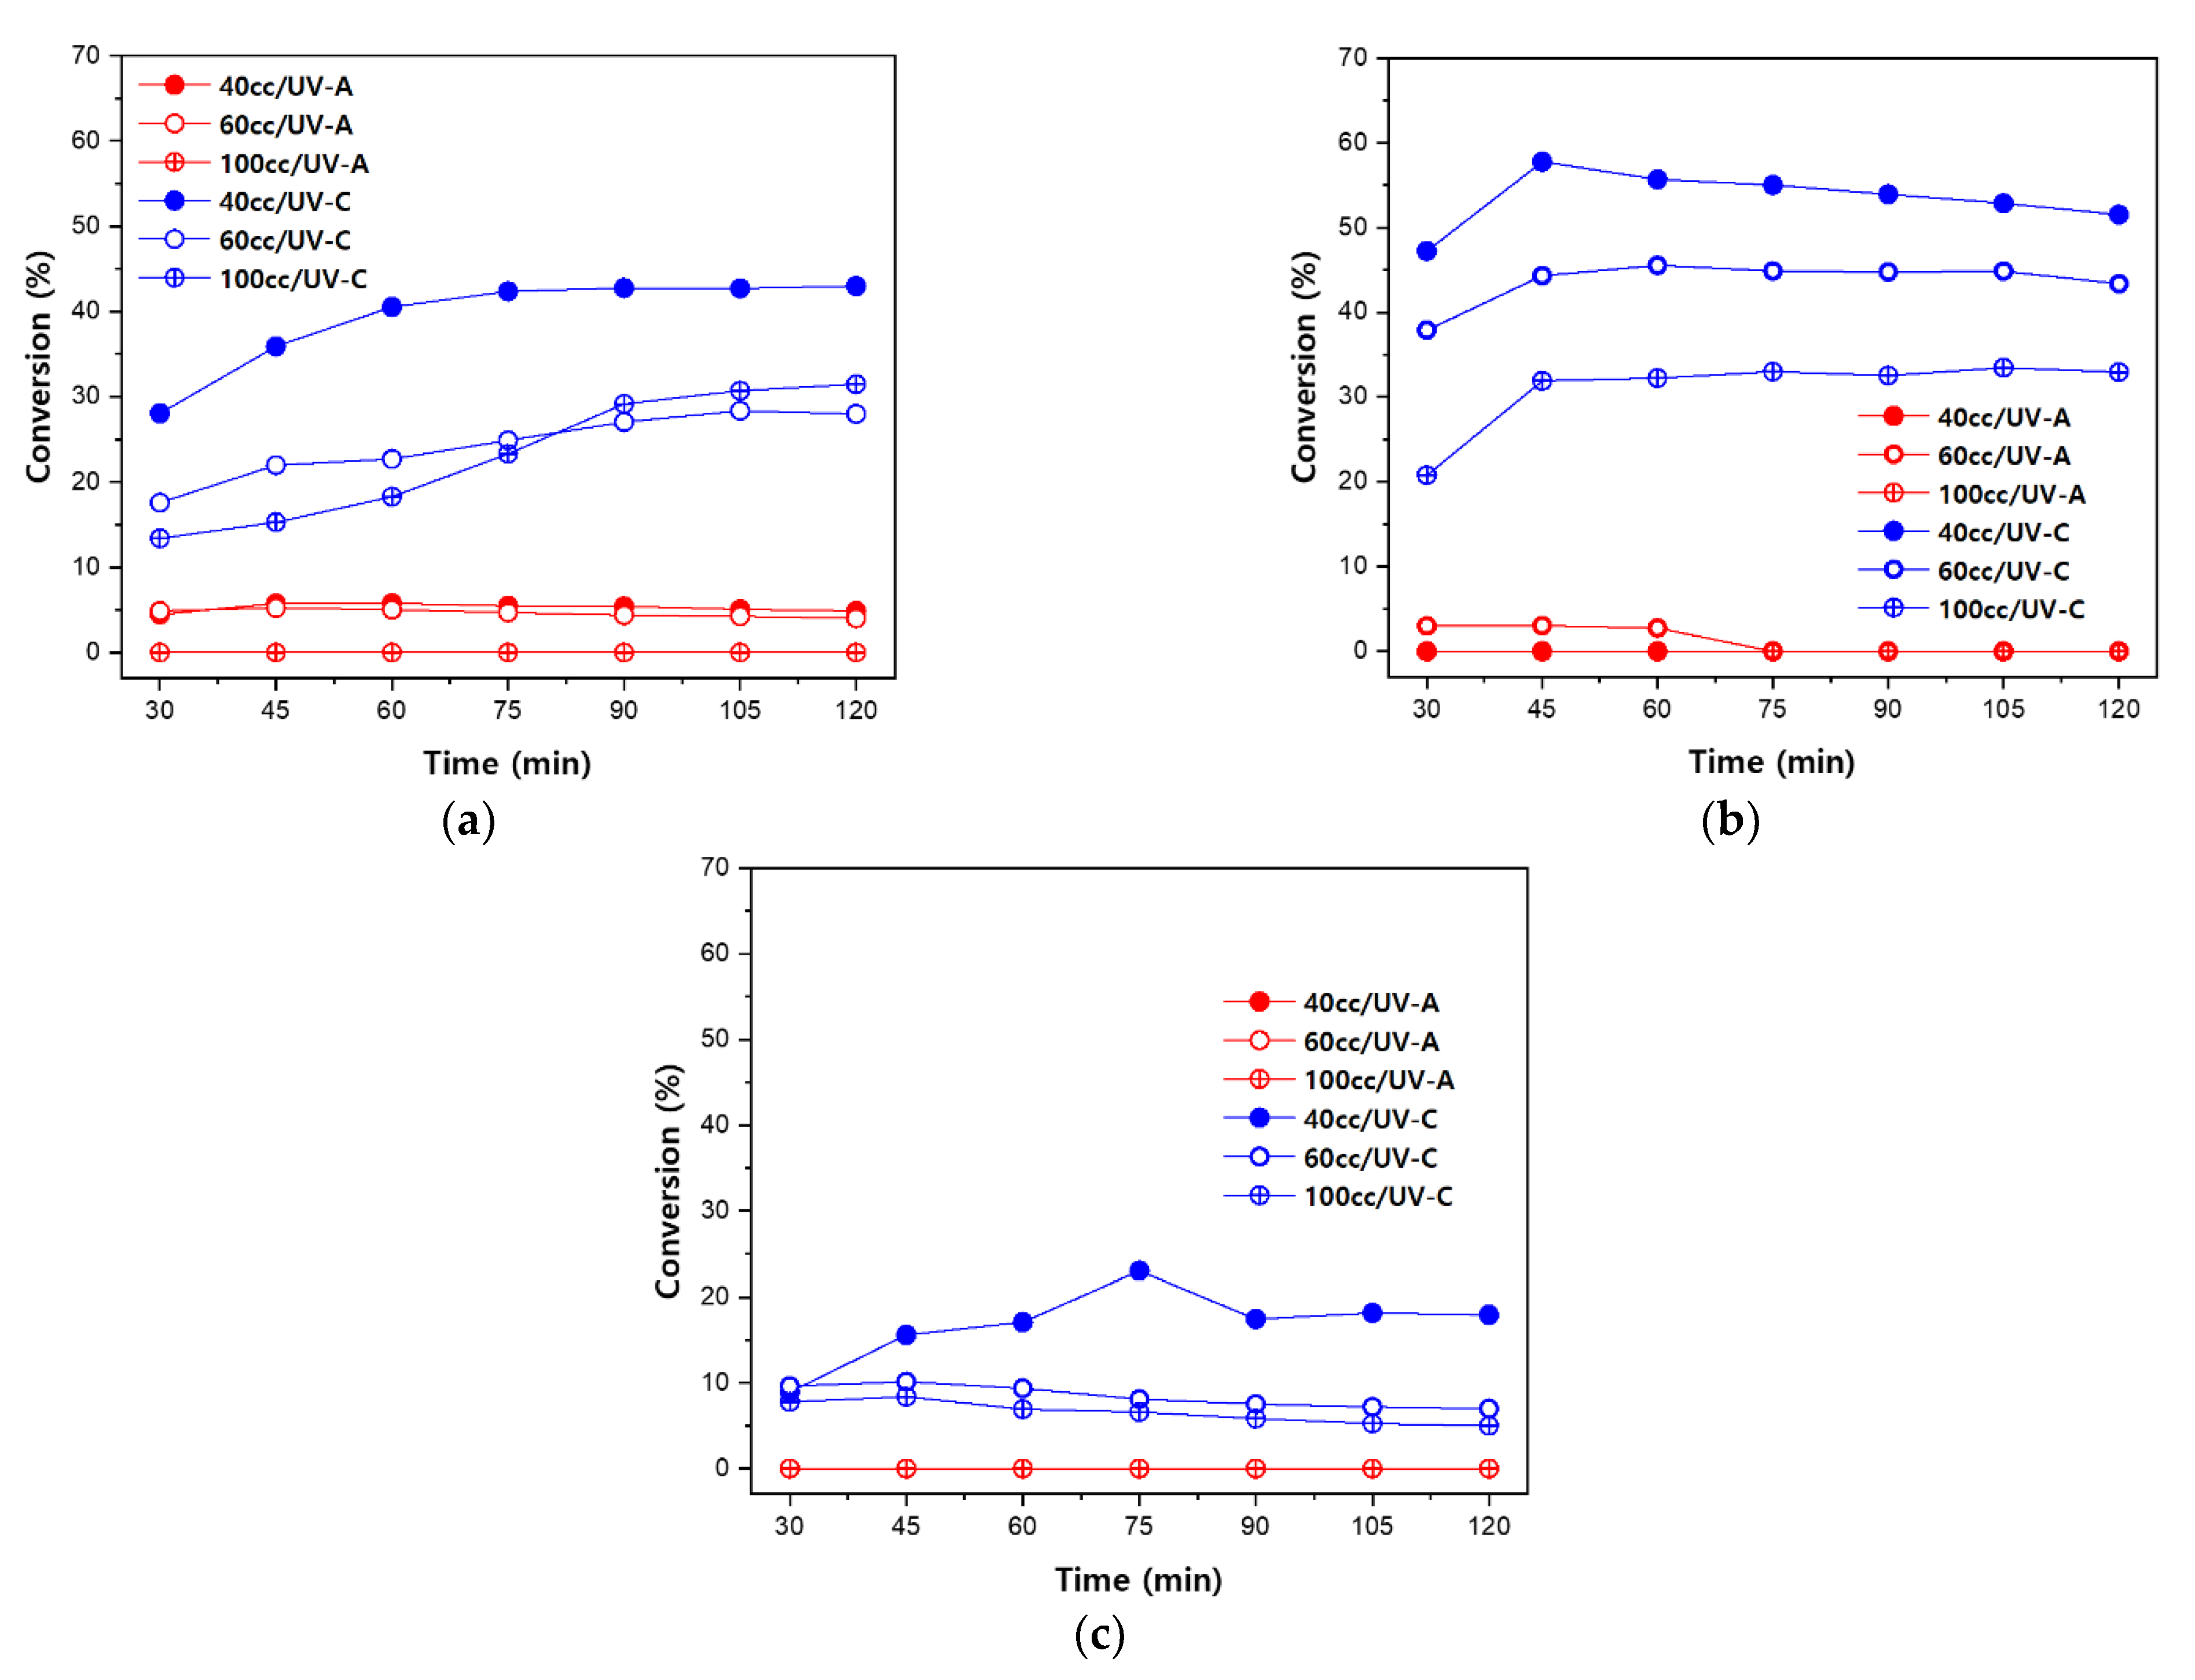
3.2. Acetaldehyde Degradation Characteristics according to Changes in Flow Rate

The effects of the flow rate at which acetaldehyde was introduced to the photoreactor were determined; flow rates of 40, 60, and 100 sccm were used. The conversion rate increased as the flow rate decreased, which seemed to affect the photo-oxidation of acetaldehyde on the surface of the photocatalyst according to the change in the flow rate of the reaction gas entering the photoreactor. When a UV light source was used, photons and various radicals were generated on the surface of the photocatalyst. Longer residence times of the reaction gas on the photocatalyst surface led to higher conversion rates; this was due to the photons and various radicals that allow sufficient oxidation [45].

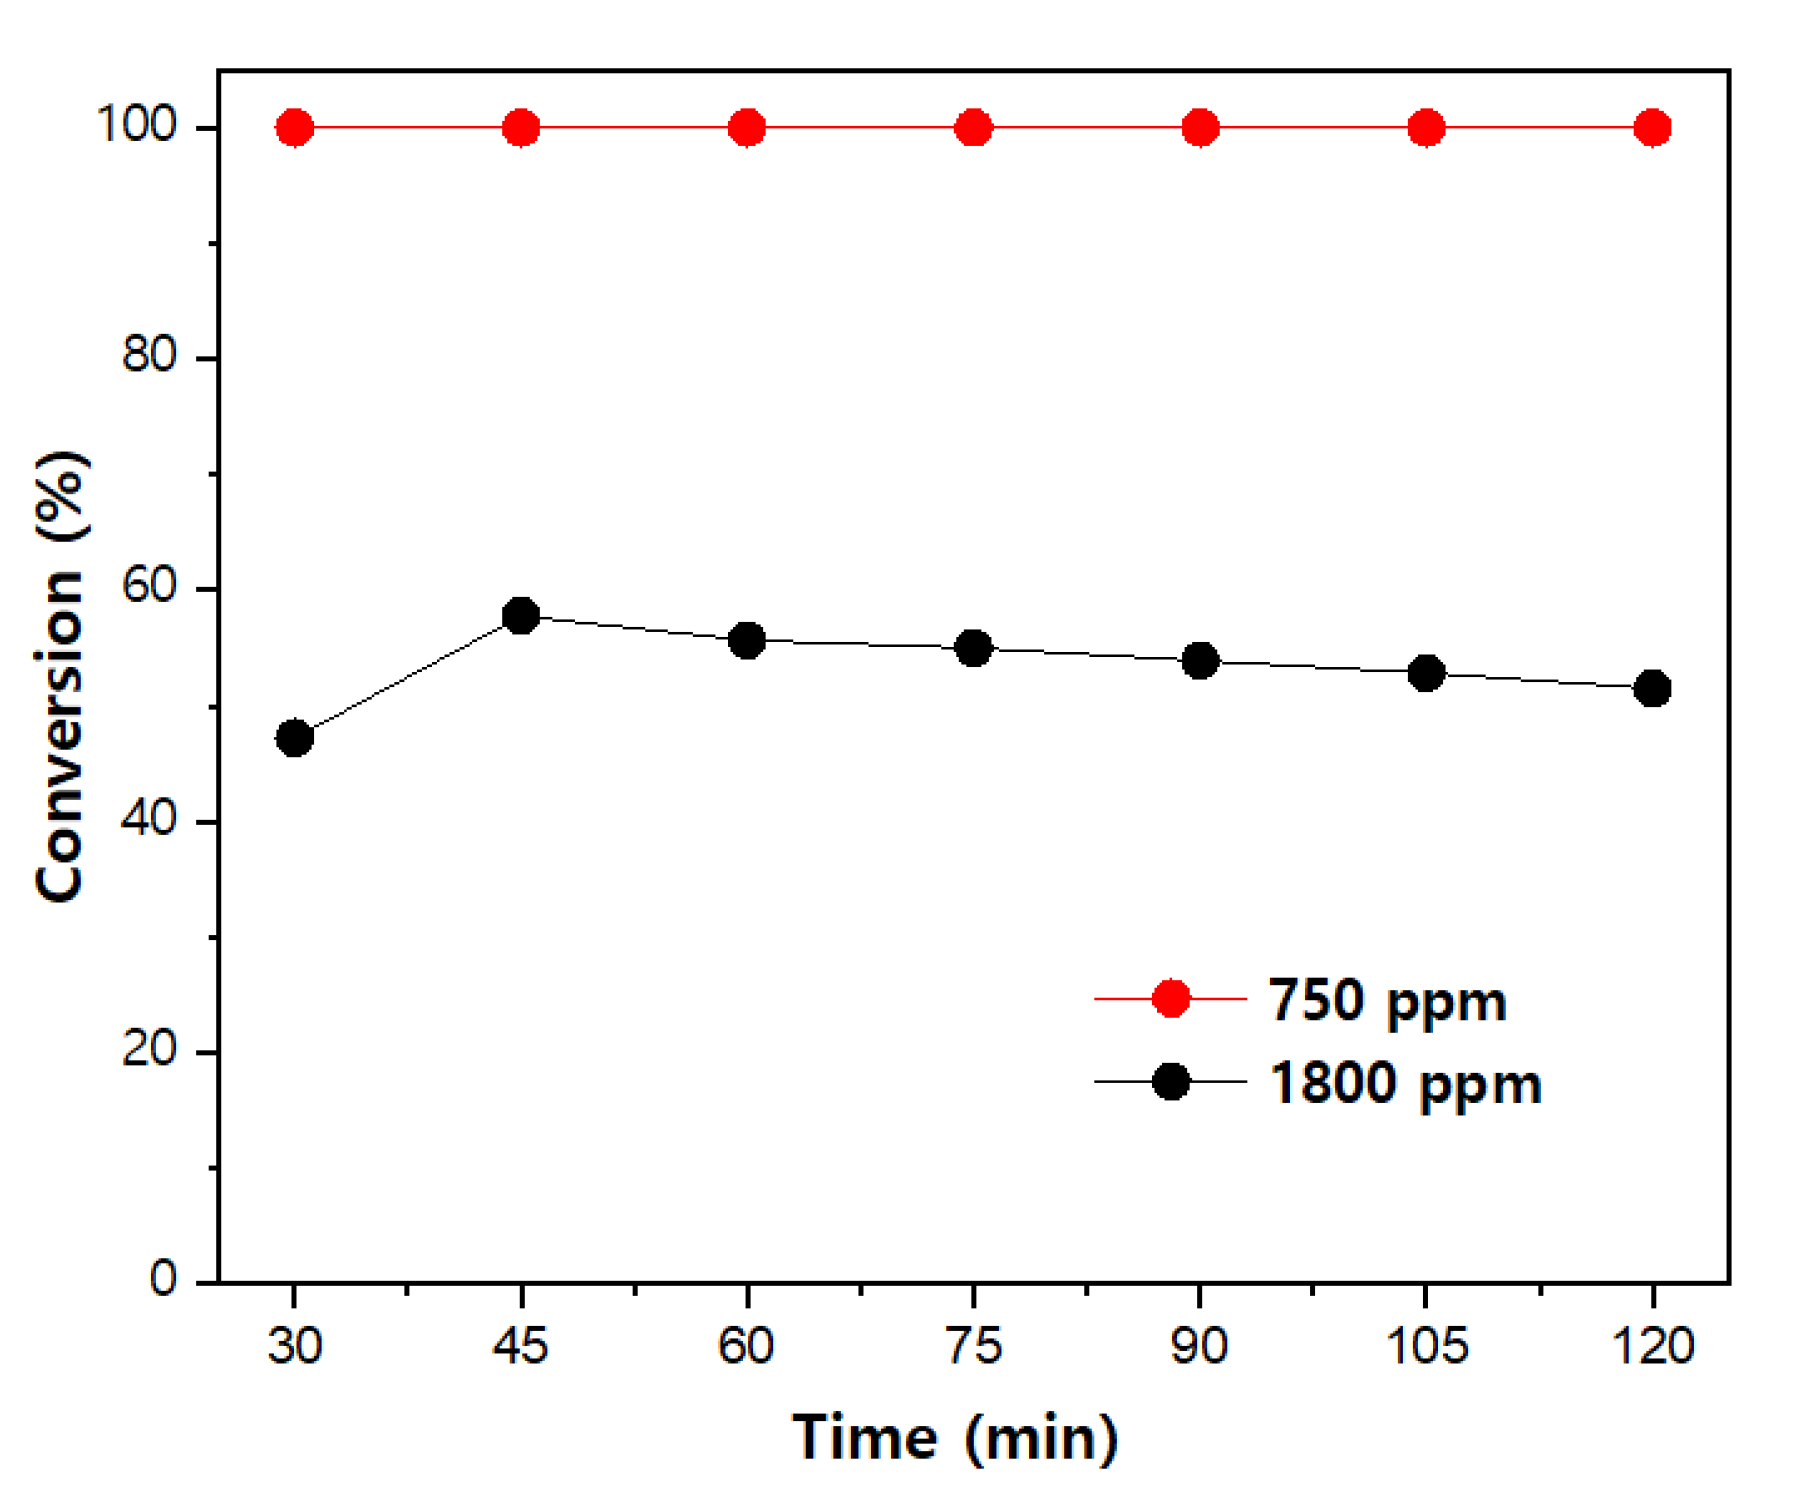
3.3. Acetaldehyde Degradation Characteristics according to the Initial Inflow Concentration

The concentration of acetaldehyde initially introduced into the reactor was also varied. At an initial aldehyde concentration of 1500–1800 ppm, the conversion rate of acetaldehyde was maintained at approximately 60%, with the catalyst treated at 650 °C (Figure 4). This is consistent with a study [46] that reported incomplete photocatalytic oxidation owing to the active part of their catalyst being covered by the excess amount of contaminant molecules initially introduced; this reduced the generation of radicals on the surface of the catalyst. Notably, using the catalyst heat-treated at 650 °C with a significantly reduced initial acetaldehyde concentration (750 ppm) resulted in a conversion rate of 100% after 30 min when irradiated with a UV-C light source (Figure 7).

3.4. Acetaldehyde Degradation Characteristics according to Light Source Conditions

Different light sources were also tested. When the catalysts were irradiated using the UV-A (365 nm) light source, all three showed conversion rates of less than 5% (Figure 4). Irradiation with the 365 nm light resulted in almost no oxidation of the contaminants, which is consistent with a previous paper [47]. Conversely, with the UV-C light source, the conversion rate achieved with the catalyst heat-treated at 450 °C reached 42% before leveling out; additionally, the conversion rate of the catalyst heat-treated at 650 °C reached up to 57% 45 min after irradiation and that of the catalyst heat-treated at 850 °C was 23% at its highest; however, this gradually decreased and stabilized in the 10% range. Therefore, the UV-C light source induced higher conversion rates than those of the UV-A source, presumably because UV-C light has a higher light flux than that of UV-A light. Another study demonstrated greater photon flux of short-wavelength light than long-wavelength light, along with the high acetaldehyde removal efficiency of short-wavelength light [48].
Furthermore, experiments with and without a catalyst in the reactor were conducted to determine the possibility of direct acetaldehyde decomposition in the presence of a light source only. The conversion rate was 4.7% when only UV-C irradiation was used in the reactor for 45 min, which decreased to a constant value of 3% after 120 min (Figure 8). However, when the catalyst was present in the reactor (flow rate: 40 sccm, UV-C light), the conversion rate of acetaldehyde reached as high as 57%, suggesting that irradiation with a light source did not affect the direct oxidation of acetaldehyde.

3.5. Effects of Moisture on Organic Matter Degradation Characteristics of the Catalysts

To determine the effects of moisture on the photocatalytic conversion rate, experiments were conducted with and without moisture; a vapor evaporation tube was installed in front of the dilution tube for use while the gas-phase acetaldehyde was flowed in the reactor. A three-way valve was used to block the inflow of water into the photoreactor, and acetaldehyde photodegradation experiments were conducted using three catalysts heat-treated at 450, 650, and 850 °C. The gas flow rate was 40 sccm, and UV-C was used as the light source. As a result of the experiment, the conversion rates in the absence of water were 24%, 30% and 11%, respectively. This is a much lower result than when the reaction was induced by supplying moisture (Figure 9).
Acetic acid, which is typically the predominant byproduct of acetaldehyde degradation, was evidently not produced in any of the reaction experiments. However, a thorough analysis revealed that acetic acid was formed but decomposed over time into CO2 and H2O; the conversion rates were calculated taking this into account. Considering that direct contact between superoxide radicals and acetaldehyde occurs while acetaldehyde is adsorbed on the catalyst surface, the following reaction can be considered [49]:
CH3CHO + O2· → CH3CO· + HO2
CH3CHO + HO2 → CH3CO + H2O2
CH3CO + ·OH → CH3COOH + e
The total reaction is:
2CH3CHO + O2 → 2CH3COOH
Under strong illumination, further oxidation proceeds similarly.
2CH3COOH + O2 → 4CO2 + 4H2O
The enhanced acetaldehyde conversion that was observed in the presence of moisture is likely because of the introduction of species such as OH and HO2 radicals to the surface of the catalyst. Additionally, our results are consistent with those of a study [50] on the role of moisture in the photocatalytic degradation of gaseous pollutants.

4. Conclusions

In this study, a TiO2–alumina photocatalyst was prepared using the sol–gel method and inserted into a functional photoreactor to evaluate the conversion rate of gaseous acetaldehyde. Photocatalysts of three types were prepared, according to the firing temperatures, and their properties were evaluated for various conditions in the gas phase experiment.
The experimental results confirmed that the acetaldehyde conversion of the TiO2–alumina catalyst at 650 °C was superior to that of the catalyst treated at 450 °C or 850 °C. As the calcination temperature increased, the conversion rate decreased as the anatase phase changed to the rutile phase, and the calcination temperature also affected the crystal size. Moreover, the conversion rate was higher as the residence time of the reaction gas flowing in the photoreactor increased, a light source of a low wavelength region was irradiated, and moisture was continuously supplied into the photoreactor. By optimizing these various factors, a photocatalyst at a firing temperature of 650 °C was applied to the functional photoreactor, and the highest conversion rate was achieved when a flow rate of 40 sccm and a UV-C light source were used.
The TiO2 photocatalyst coated on the surface-treated alumina substrate showed the potential to remove various gaseous contaminants when used in a functional photoreactor and is expected to be applied as a novel material for air purification systems.

Author Contributions

Writing—original draft preparation, investigation, and editing, S.J.K. and E.M.K.; investigation, E.M.K.; validation and review, H.K.J.; methodology and analysis, S.B.K.; conceptualization and arrangement, J.Y.C. and J.H.K. All authors have read and agreed to the published version of the manuscript.

Funding

This research received no external funding.

Institutional Review Board Statement

Not applicable.

Informed Consent Statement

Not applicable.

Data Availability Statement

Not applicable.

Acknowledgments

This research was supported by the Korea Institute of Industrial Technology (KITECH).

Conflicts of Interest

The authors declare no conflict of interest.

References

  1. Cheng, Y.H.; Lin, C.C.; Hsu, S.C. Comparison of conventional and green building materials in respect of VOC emissions and ozone impact on secondary carvonyl emissions. Build Environ. 2015, 87, 274–282. [Google Scholar] [CrossRef]
  2. Yu, B.F.; Hu, Z.B.; Liu, M.; Yang, H.L.; Kong, Q.X.; Liu, Y.H. Review of research on air-conditioning systems and indoor air quality control for human health. Int. J. Refrig. 2009, 32, 3–20. [Google Scholar] [CrossRef]
  3. Zhu, S.; Wang, D. Photocatalysis: Basic principles, diverse forms of implementations and emerging scientific opportunities. Adv. Energy Mater. 2017, 7, 1700841. [Google Scholar] [CrossRef] [Green Version]
  4. Weng, S.K.; Jing, W.L.; Woon, C.C.; Yean, L.P.; Lan, C.S. An overview of photocatalytic degradation: Photocatalyst, mechanisms, and development of photcatalytic membrane. Environ. Sci. Pollut. Res. Int. 2020, 27, 2522–2565. [Google Scholar]
  5. Fajar, B.L. Photocatalyst Principle and Application. Basic Concept. 2014. Available online: https://www.slideshare.net/fajarbudilaksono5/photocatalyst-principle-and-application (accessed on 5 March 2022).
  6. Marta, I.L.; Natalia, Q. Advanced Oxidation Processes for Water and Wastewater Treatment. Recent Pat. Eng. 2010, 4, 217–241. [Google Scholar]
  7. Rasoul, M.; Janan, P.; Ebrahim, K. Photocatalytic Removal of Nox Gas from Air by TiO2/Polymer Composite Nanofibers. Nanochem Res. 2018, 3, 212–218. [Google Scholar]
  8. Janusz, L.; Yi, H.Y.; Jeffrey, C.S.W. Removal of NOx by Photocatalytic Process. J. Photochem. Photobiol. C Photochem. Rev. 2013, 14, 29–52. [Google Scholar]
  9. Lee, W.I.; Choi, G.J.; Do, Y.R. Effect of Au and WO3 on the Surface Structure and Photocatalytic Activity of TiO2. Bull. Korean Chem. Soc. 1997, 18, 667–670. [Google Scholar]
  10. Saini, K.K.; Sharma, S.D.; Chanderkant; Kar, M.; Singh, D.; Sharma, C.P. Structural and optical properties of TiO2 thin films derived by sol–gel dip coating process. J. Non-Cryst. Solids 2007, 353, 2469–2473. [Google Scholar] [CrossRef]
  11. Son, H.S. Removal of gaseous benzene using TiO2 photocatalyst coated on ceramic and glass. J. Korean Soc. Atmos. Environ. 2003, 19, 57–66. [Google Scholar]
  12. Burns, G.P. Titanium dioxide dielectric films formed by rapid thermal oxidation. J. Appl. Phys. 1989, 65, 2095. [Google Scholar] [CrossRef]
  13. Schiller, S.; Beister, G.; Sieber, W.; Schirmer, G.; Hacker, E. Influence of deposition parameters on the optical and structural properties of TiO2 films produced by reactive d.c. plasmatron sputtering. Thin Solid Films 1981, 83, 239. [Google Scholar] [CrossRef]
  14. Suhail, M.H.; Mohan Rao, G.; Mohan, S.D. C reactive magnetron sputtering of titanium-structural and optical characterization of TiO2 films. J. Appl. Phys. 1992, 71, 1421. [Google Scholar] [CrossRef]
  15. Okimura, K.; Maeda, N.; Shibata, A. Characteristics of rutile TiO2 films prepared by r.f. magnetron sputtering at a low temperature. Thin Solid Films 1996, 281, 427–430. [Google Scholar] [CrossRef]
  16. Rice, G.W. Laser-Driven Pyrolysis: Synthesis of TiO2 from Titanium Isopropoxide. J. Am. Ceram. Soc. 1987, 70, C117–C120. [Google Scholar] [CrossRef]
  17. Zhang, S.; Zhu, Y.F.; Brodie, D.E. Photoconducting TiO2 prepared by spray pyrolysis using TiCl4. Thin Solid Films 1992, 213, 265–270. [Google Scholar] [CrossRef]
  18. Yeung, K.S.; Lam, Y.W. A simple chemical vapour deposition method for depositing thin TiO2 films. Thin Solid Films 1983, 109, 169–178. [Google Scholar] [CrossRef]
  19. Lu, J.P.; Wang, J.; Raj, R. Solution precursor chemical vapor deposition of titanium oxide thin films. Thin Solid Films 1991, 204, L13–L17. [Google Scholar] [CrossRef]
  20. Kim, B.H.; Lee, J.Y.; Choa, Y.H.; Higuchi, M.; Mizutani, N. Preparation of TiO2 thin film by liquid sprayed mist CVD method. Mater. Sci. Eng. B 2004, 107, 289–294. [Google Scholar] [CrossRef]
  21. Wang, W.B.; Yanguas-Gil, A.; Yang, Y.; Kim, D.Y.; Girolami, G.S.; Abelson, J.R. Chemical vapor deposition of TiO2 thin films from a new halogen-free precursor. J. Vac. Sci. Technol. A 2014, 32, 061502. [Google Scholar] [CrossRef]
  22. Hussin, R.; Choy, K.L.; Hou, X. Growth of TiO2 Thin Films by Atomic Layer Deposition (ALD). Adv. Mater. Res. 2016, 1133, 352–356. [Google Scholar] [CrossRef]
  23. Lai, X.; Weng, Y.; Chen, G.; Que, S.; Zhou, X.; Yan, Q.; Wu, C.; Guo, T.; Sun, J.; Zhang, Y. Morphology regulation of TiO2 thin film by ALD growth temperature and its applications to encapsulation and light extraction. J. Mater. Sci. Mater. Electron. 2020, 31, 21316–21324. [Google Scholar] [CrossRef]
  24. Yoko, T.; Yuasa, A.; Kamiya, K.; Sakka, S. Sol-Gel-Derived TiO2 Film Semiconductor Electrode for Photocleavage of Water: Preparation and Effects of Postheating Treatment on the Photoelectrochemical Behavior. J. Electrochem. Soc. 1991, 138, 2279. [Google Scholar] [CrossRef]
  25. Vorotilov, K.A.; Orlova, E.V.; Petrovsky, V.I. Sol-gel TiO2 films on silicon substrates. Thin Solid Films 1992, 207, 180–184. [Google Scholar] [CrossRef]
  26. Nagpal, V.J.; Davis, R.M.; Desu, S.B. Novel thin films of titanium dioxide particles synthesized by a sol-gel process. J. Mater. Res. 1995, 10, 3068–3078. [Google Scholar] [CrossRef]
  27. Su, C.; Hong, B.-Y.; Tseng, C.-M. Sol–gel preparation and photocatalysis of titanium dioxide. Catal. Today 2004, 96, 119–126. [Google Scholar] [CrossRef]
  28. Bach, H.; Krause, D. Thin Films on Glass; Springer: Heidelberg, Germany, 1997. [Google Scholar]
  29. Yoko, T.; Yuasa, A.; Kamiya, K.; Sakka, S. Sol-Gel Derived TiO2 Film Semiconductor Electrode for Photocleavage of Water: Electrode Reaction Mechanism (Commemoration Issue Dedicated to Professor Tetsuya HANAI on the Occasion of His Retirement). Bull. Inst. Chem. Res. Kyoto Univ. 1991, 69, 311. [Google Scholar]
  30. Xuzhuang, Y.; Yang, D.; Huaiyong, Z.; Jiangwen, L.; Martins, W.N.; Frost, R.; Daniel, L.; Yuenian, S. Mesoporous structure with size controllable anatase attached on silicate layers for efficient photocatalysis. J. Phys. Chem. C 2009, 113, 8243–8248. [Google Scholar] [CrossRef]
  31. Mishra, A.; Mehta, A.; Basu, S. Clay supported TiO2 nanoparticles for photocatalytic degradation of environmental pollutants: A review. J. Environ. Chem. Eng. 2018, 6, 6088–6107. [Google Scholar] [CrossRef]
  32. Szczepanik, B. Photocatalytic degradation of organic contaminants over clay-TiO2 nanocomposites: A review. Appl. Clay Sci. 2017, 141, 227–239. [Google Scholar] [CrossRef]
  33. Danfa, S.; Martins, R.C.; Quina, M.J.; Gomes, J. Supported TiO2 in ceramic materials for the photocatalytic degradation of contaminants of emerging concern in liquid effluents: A Review. Molecules 2021, 26, 5363. [Google Scholar] [CrossRef]
  34. Studart, A.R.; Gonzenbach, U.T.; Tervoort, E.; Gauckler, L.J. Processing Routes to Macroporous Ceramics: A Review. J. Am. Ceram. Soc. 2006, 89, 1771–1789. [Google Scholar] [CrossRef]
  35. Yildiz, T.; Yatmaz, H.C.; Öztürk, K. Anatase TiO2 powder immobilized on reticulated Al2O3 ceramics as a photocatalyst for degradation of RO16 azo dye. Ceram. Int. 2020, 46, 8651–8657. [Google Scholar] [CrossRef]
  36. Obregon, S.; Gonzalez, V.R. Photocatalytic TiO2 thin films and coating prepared sol-gel processing: A brief review. J. Sol-Gel Sci. Technol. 2021, 102, 125–141. [Google Scholar] [CrossRef]
  37. Pedrini, L.F.K.; Escaliante, L.C.; Scalvi, L.V.A. Deposition of TiO2 thin films by dip coating technique from a two-phase solution method and application to photocatalysis. Mater. Res. 2021, 24 (Suppl. S1), e20210007. [Google Scholar] [CrossRef]
  38. Zrinka, S.; Vilko, M.; Lidija., C.; Martina, B.; Irena, A.; Mattia., G. Titania-Coated Alumina foam Photocatalyst for Memantine Degradation Derived by Replica Method and Sol-Gel Reaction. Materials 2020, 13, 227. [Google Scholar]
  39. Hu, L.; Yoko, T.; Kozuka, H.; Sakka, S. Effects of solvent on properties of sol–gel-derived TiO2 coating films. Thin Solid Films 1992, 219, 18–23. [Google Scholar] [CrossRef]
  40. Yu, J.G.; Yu, H.Y.; Cheng, B.; Zhao, X.J.; Yu, J.C.; Ho, W.K. The effect of Calcinationn Temperature on the Surface Microstructure and Photocatalytic Activity of TiO2 Thin Films Prepared by Liquid Phase Deposition. J. Phys. Chem. B 2003, 107, 13871–13879. [Google Scholar] [CrossRef]
  41. Omotoso, T.; Boonyasuwat, S.; Crossley, S.P. Understanding the role of TiO2 crystal structure on the enhanced activity and stability of Ru/TiO2 catalysts for the conversion of lignin-derived oxygenates. Green Chem. 2014, 16, 645–652. [Google Scholar] [CrossRef]
  42. Zhang, W.; Yang, B.; Chen, J. Effects of Calcination Temperature on Preparation of Boron-Doped TiO2 by Sol-Gel Method. Int. J. Photoenergy 2012, 2012, 528637. [Google Scholar] [CrossRef] [Green Version]
  43. Yoko, T.; Hu, L.; Kozuka, H.; Sakka, S. Photoelectrochemical properties of TiO2 coating films prepared using different solvents by the sol-gel method. Thin Solid Films 1996, 283, 188–195. [Google Scholar] [CrossRef]
  44. Kandiel, T.A.; Robben, L.; Alkaim, A.; Bahnemann, D. Brookite versus anatase TiO2 photocatalysts: Phase transformations and photocatalytic activities. Photochem. Photobiol. Sci. 2013, 12, 602–609. [Google Scholar] [CrossRef] [PubMed] [Green Version]
  45. Pengyi, Z.; Fuyan, L.; Gang, Y.; Qing, C.; Wanpeng, Z. A Comparative Study on decomposition of gaseous toluene by O3/UV, TiO2/UV and O3/TiO2/UV. J. Photchem. Photobiol. A Chem. 2003, 156, 189–194. [Google Scholar] [CrossRef]
  46. Avasarala, B.K.; Tirukkovalluri, S.R.; Bojja, S. Photocatalytic degradation of monocrotophos pesticide—An endocrine disruptor by magnesium doped titania. J. Hazard. Mater. 2011, 186, 1234–1240. [Google Scholar] [CrossRef] [PubMed]
  47. Ku, Y.; Ma, C.M.; Shen, Y.S. Decomposition of gaseous trichloroethylene in a photoreactor with TiO2-coated nonwoven fiber textile. Appl. Catal. B Environ. 2001, 34, 181–190. [Google Scholar] [CrossRef]
  48. Chuang, Y.H.; Hong, G.B.; Chang, C.T. Study on particulates and volatile organic compounds removal with TiO2 nonwoven filter prepared by electrospinning. J. Air Waste Manag. Assoc. 2014, 64, 738–742. [Google Scholar] [CrossRef]
  49. Sopyan, I.; Watanabe, M.; Murasawa, S.; Hashimoto, K.; Fujishima, A. An efficient TiO2 thin film photocatalyst: Photocatalytic properties in gas phase acetaldehyde degradation. J. Photochem. Photobiol. A Chem. 1996, 98, 79–86. [Google Scholar] [CrossRef]
  50. Guo, M.Z.; Ling, T.C.; Poon, C.S. Photocatalytic NOx degradation of concrete surface layers intermixed and spray-coated with nano-TiO2: Influence of experimental factors. Cem. Concr. Compos. 2017, 83, 279–289. [Google Scholar] [CrossRef]
Figure 1. Schematics of the (a) alumina substrate and (b) photoreactor.
Applsci 12 05796 g001
Figure 2. Preparation of the TiO2 catalyst.
Applsci 12 05796 g002
Figure 3. Schematic diagram of the experimental setup.
Applsci 12 05796 g003
Figure 4. Acetaldehyde photodegradation of the catalyst according to heat-treatment temperature: (a) 450 °C, (b) 650 °C, and (c) 850 °C (cc (sccm): standard cubic centimeter per minute (cm3/min)).
Applsci 12 05796 g004
Figure 5. FE-SEM photographs (2000×) of the catalyst on (a) an alumina plate and (bd) heat-treated at (b) 450 °C, (c) 650 °C, and (d) 850 °C.
Applsci 12 05796 g005
Figure 6. XRD patterns of the catalysts prepared at different heat-treatment temperatures: (a) 450 °C, (b) 650 °C, and (c) 850 °C (● anatase (JCPDS no. 21-1272); □ rutile (JCPDS no. 21-1276)).
Applsci 12 05796 g006
Figure 7. Change in the conversion rate of acetaldehyde with the initial acetaldehyde concentration (650 °C catalyst, UV-C light, flow rate: 40 sccm).
Applsci 12 05796 g007
Figure 8. Comparison of the conversion rate of acetaldehyde with and without catalyst (catalyst calcined at 650 °C, UV-C light, flow rate: 40 sccm).
Applsci 12 05796 g008
Figure 9. Comparison of the conversion rate of acetaldehyde in the (a) presence and (b) absence of moisture.
Applsci 12 05796 g009
Publisher’s Note: MDPI stays neutral with regard to jurisdictional claims in published maps and institutional affiliations.

