
Exploring the Nonlinear Effects of Built Environment on Bus-Transfer Ridership: Take Shanghai as an Example


Abstract
1. Introduction
2. Literature Review

| Citation | A | B | C | D | E | Methodology | Linear Model | Nonlinear Model | ||||||||||
|---|---|---|---|---|---|---|---|---|---|---|---|---|---|---|---|---|---|---|
| A1 | A2 | A3 | B1 | B2 | C1 | C2 | C3 | C4 | C5 | C6 | D1 | D2 | D3 | |||||
| [9] | ✓ | ✓ | ✓ | ✓ | ✓ | ✓ | ✓ | ✓ | Ordinary least squares | ✓ | ||||||||
| [30] | ✓ | ✓ | Social network analysis | - | - | |||||||||||||
| [31] | ✓ | ✓ | ✓ | ✓ | ✓ | ✓ | Geographically and temporally weighted regression | ✓ | ||||||||||
| [32] | ✓ | ✓ | ✓ | ✓ | ✓ | ✓ | ✓ | ✓ | Geographically weighted regression | ✓ | ||||||||
| [36] | ✓ | ✓ | Ordinal regression models | ✓ | ||||||||||||||
| [38] | ✓ | ✓ | ✓ | ✓ | ✓ | ✓ | ✓ | ✓ | ✓ | Hybrid model | ✓ | |||||||
| [39] | ✓ | ✓ | ✓ | ✓ | ✓ | ✓ | ✓ | Multivariate linear model | ✓ | |||||||||
| [41] | ✓ | ✓ | Fitting analysis | ✓ | ||||||||||||||
| [42] | ✓ | ✓ | ✓ | ✓ | ✓ | Multiple regression models | ✓ | |||||||||||
| [43] | ✓ | ✓ | ✓ | ✓ | Gravity-based regression model | ✓ | ||||||||||||
| This paper | ✓ | ✓ | ✓ | ✓ | ✓ | ✓ | ✓ | ✓ | ✓ | ✓ | ✓ | ✓ | ✓ | ✓ | ✓ | XGBoost | - | ✓ |
3. Data and Variables
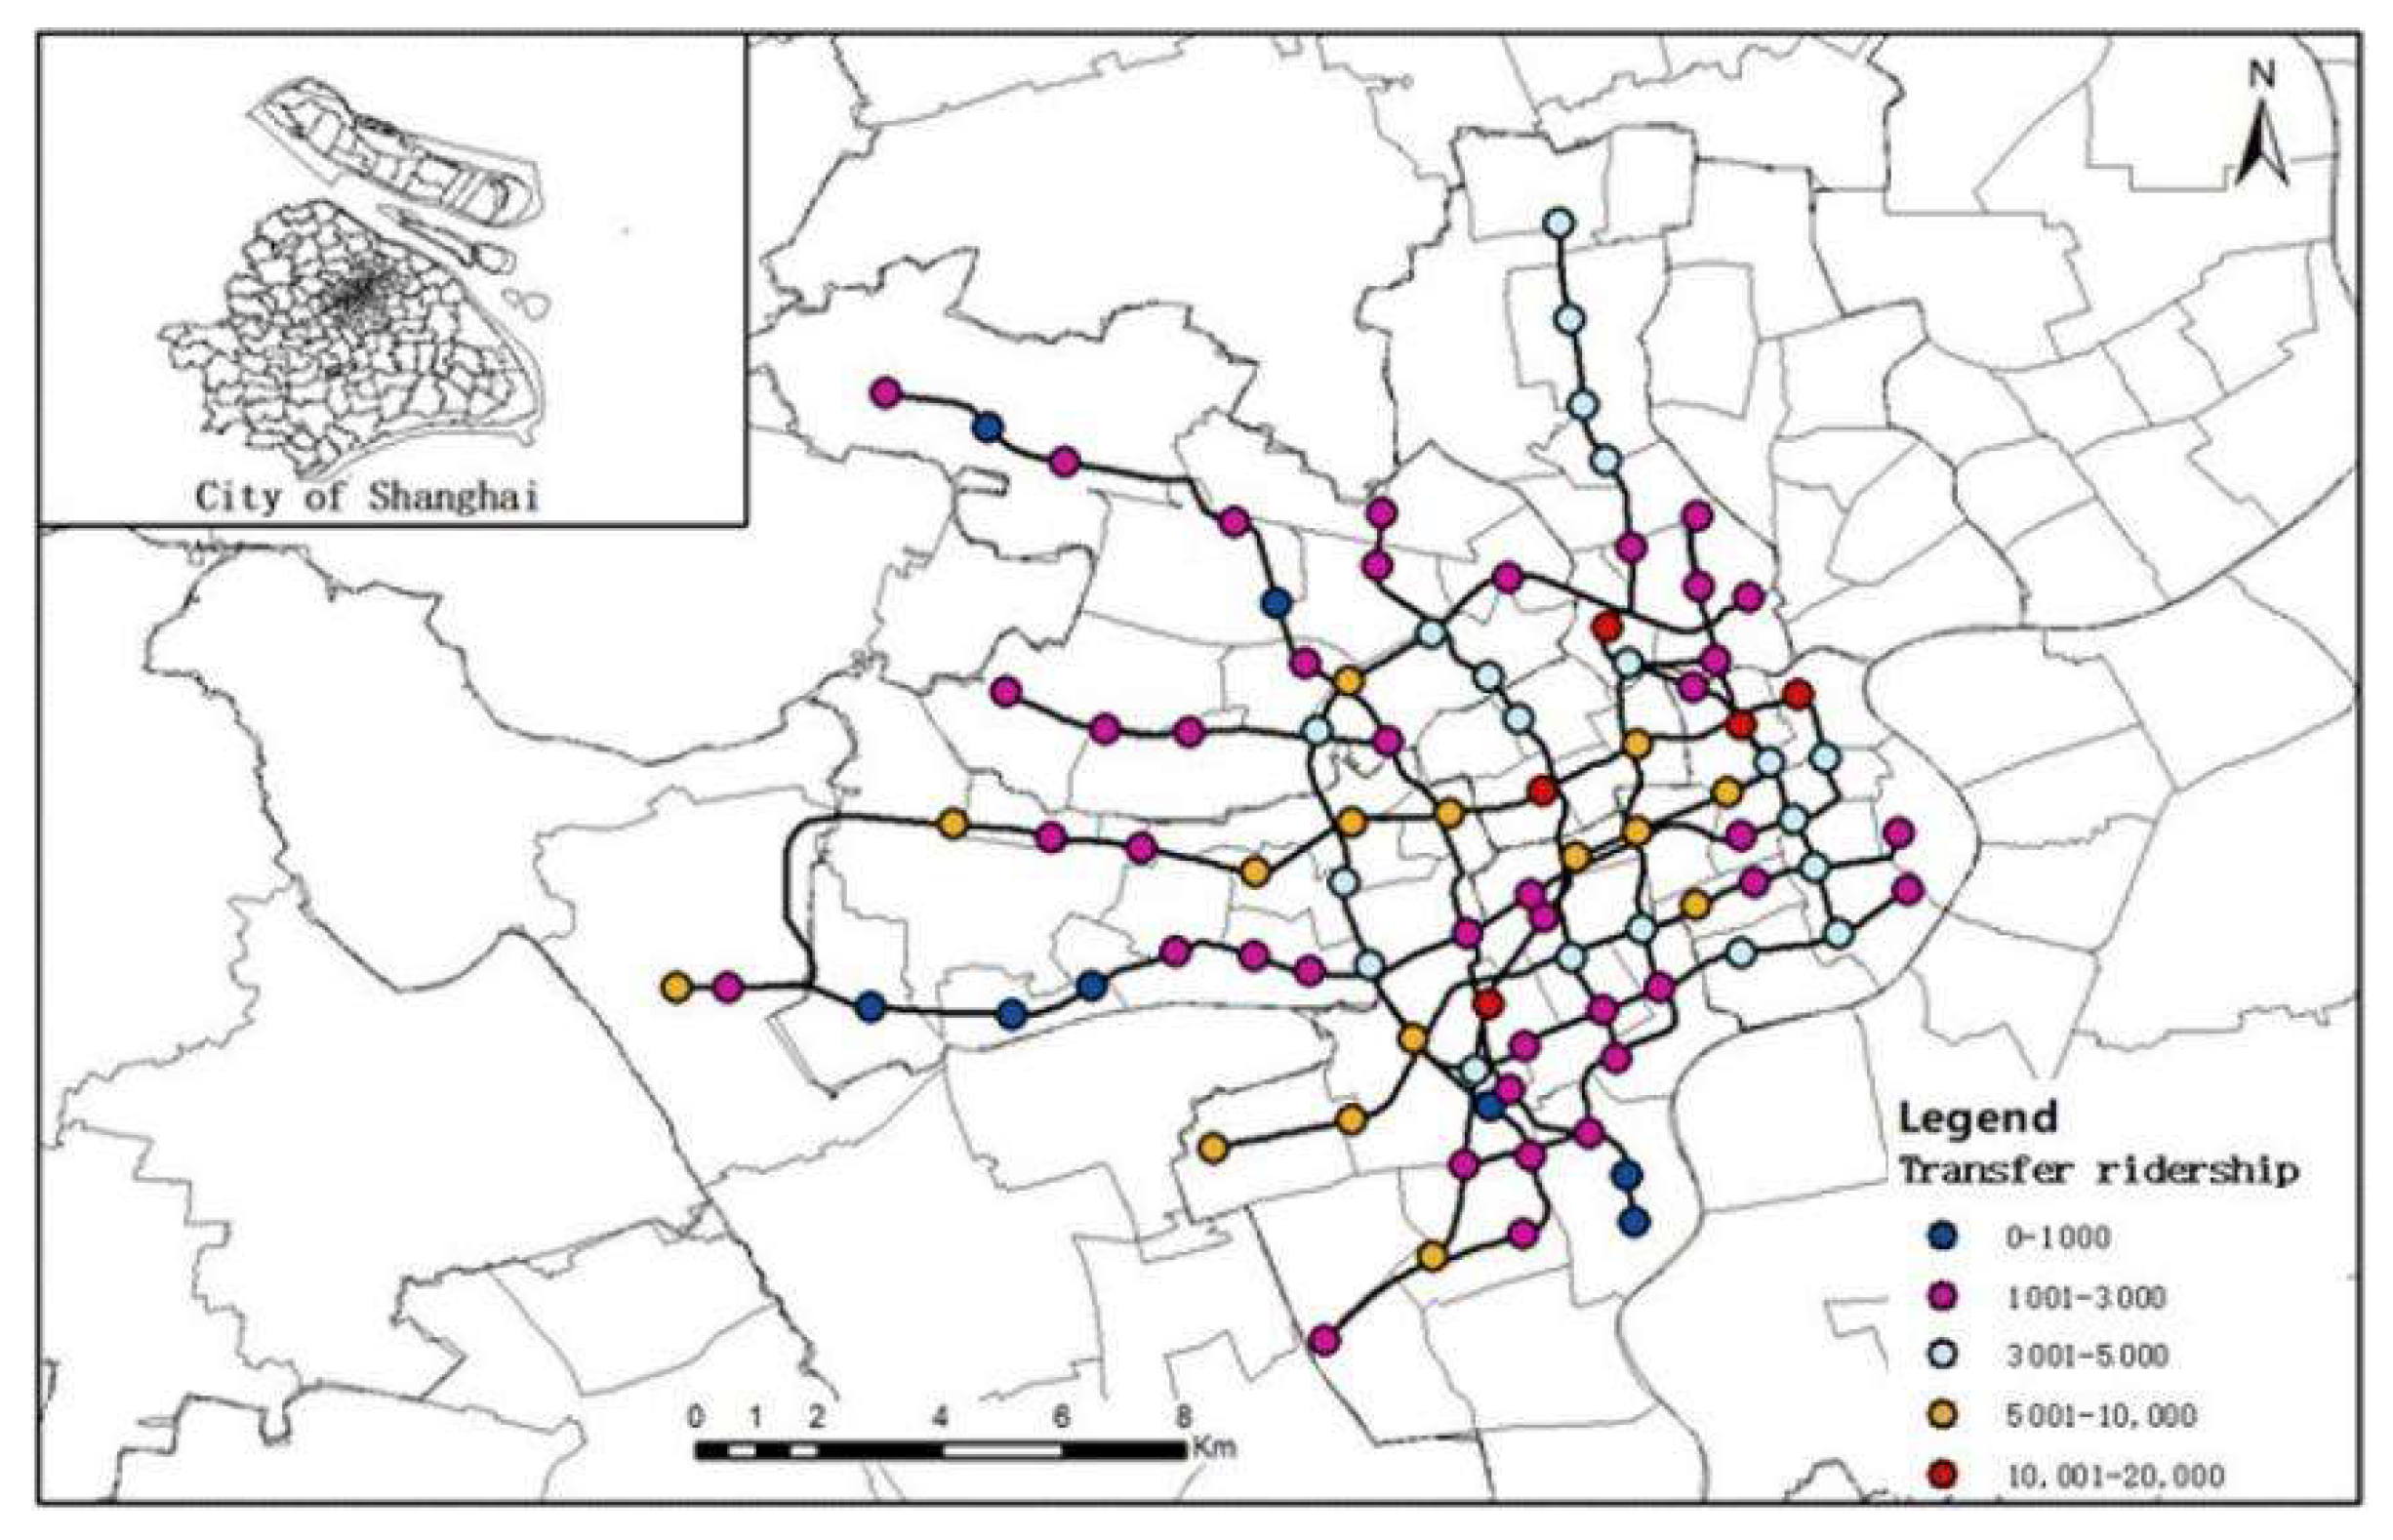
3.1. Study Area
3.2. Data Sources
3.3. Variables Description
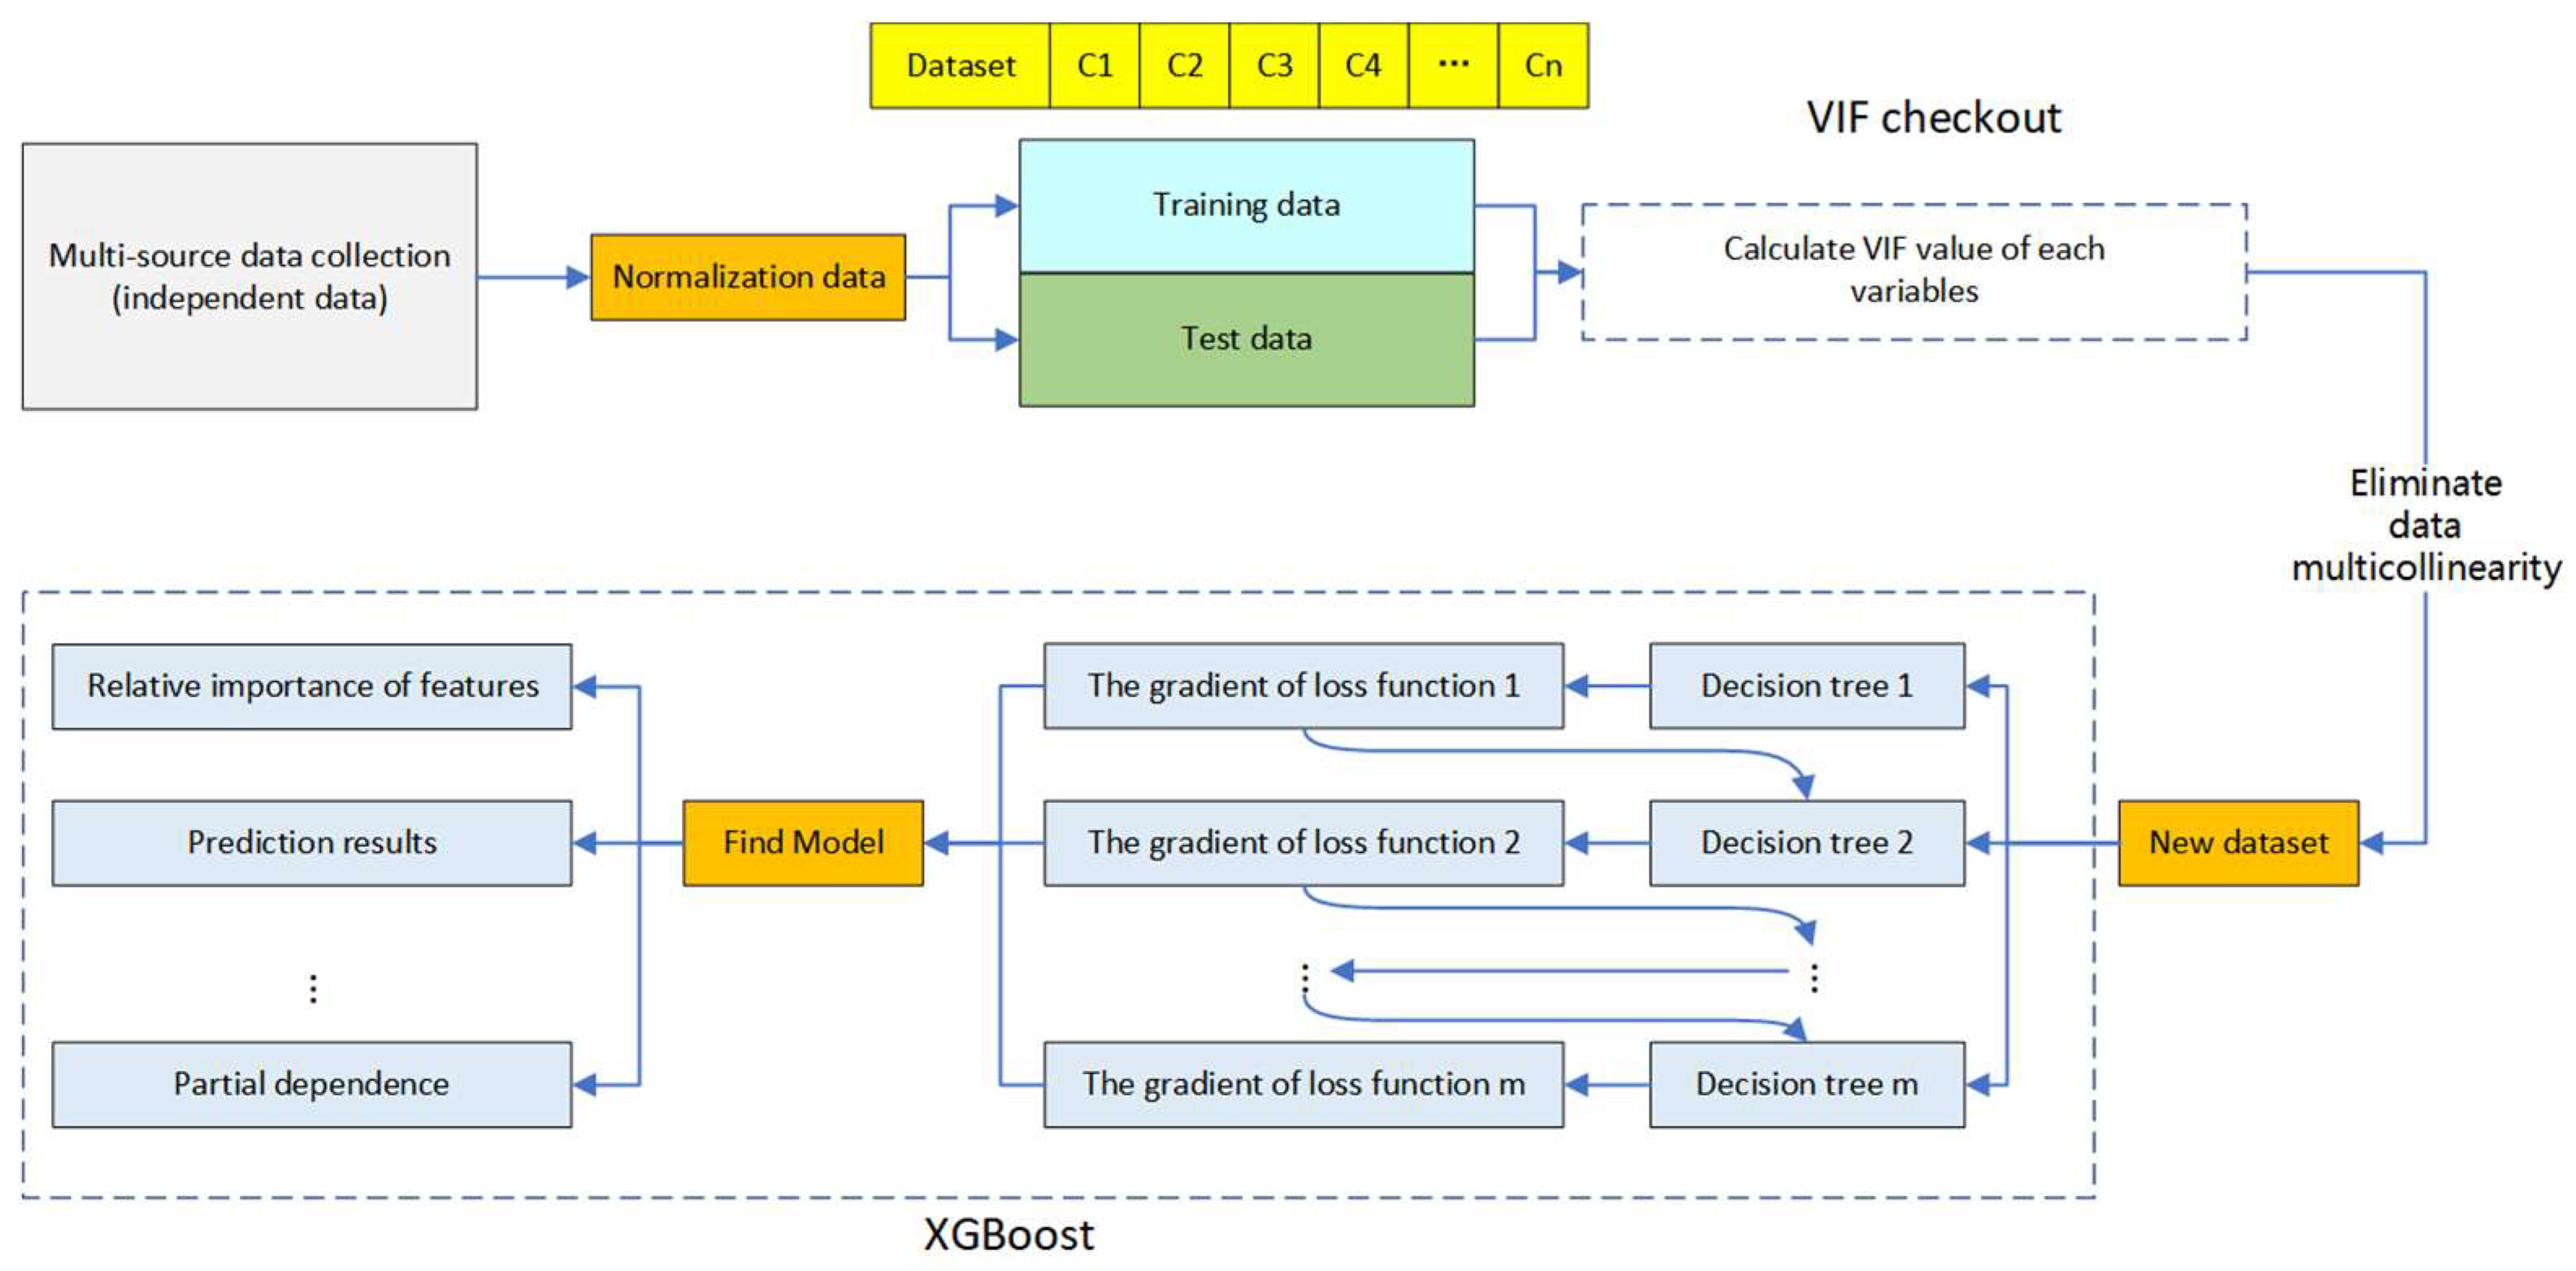
4. Methodology
5. Results and Discussion
5.1. Model Comparison
5.2. Relative Importance of the Independent Variables
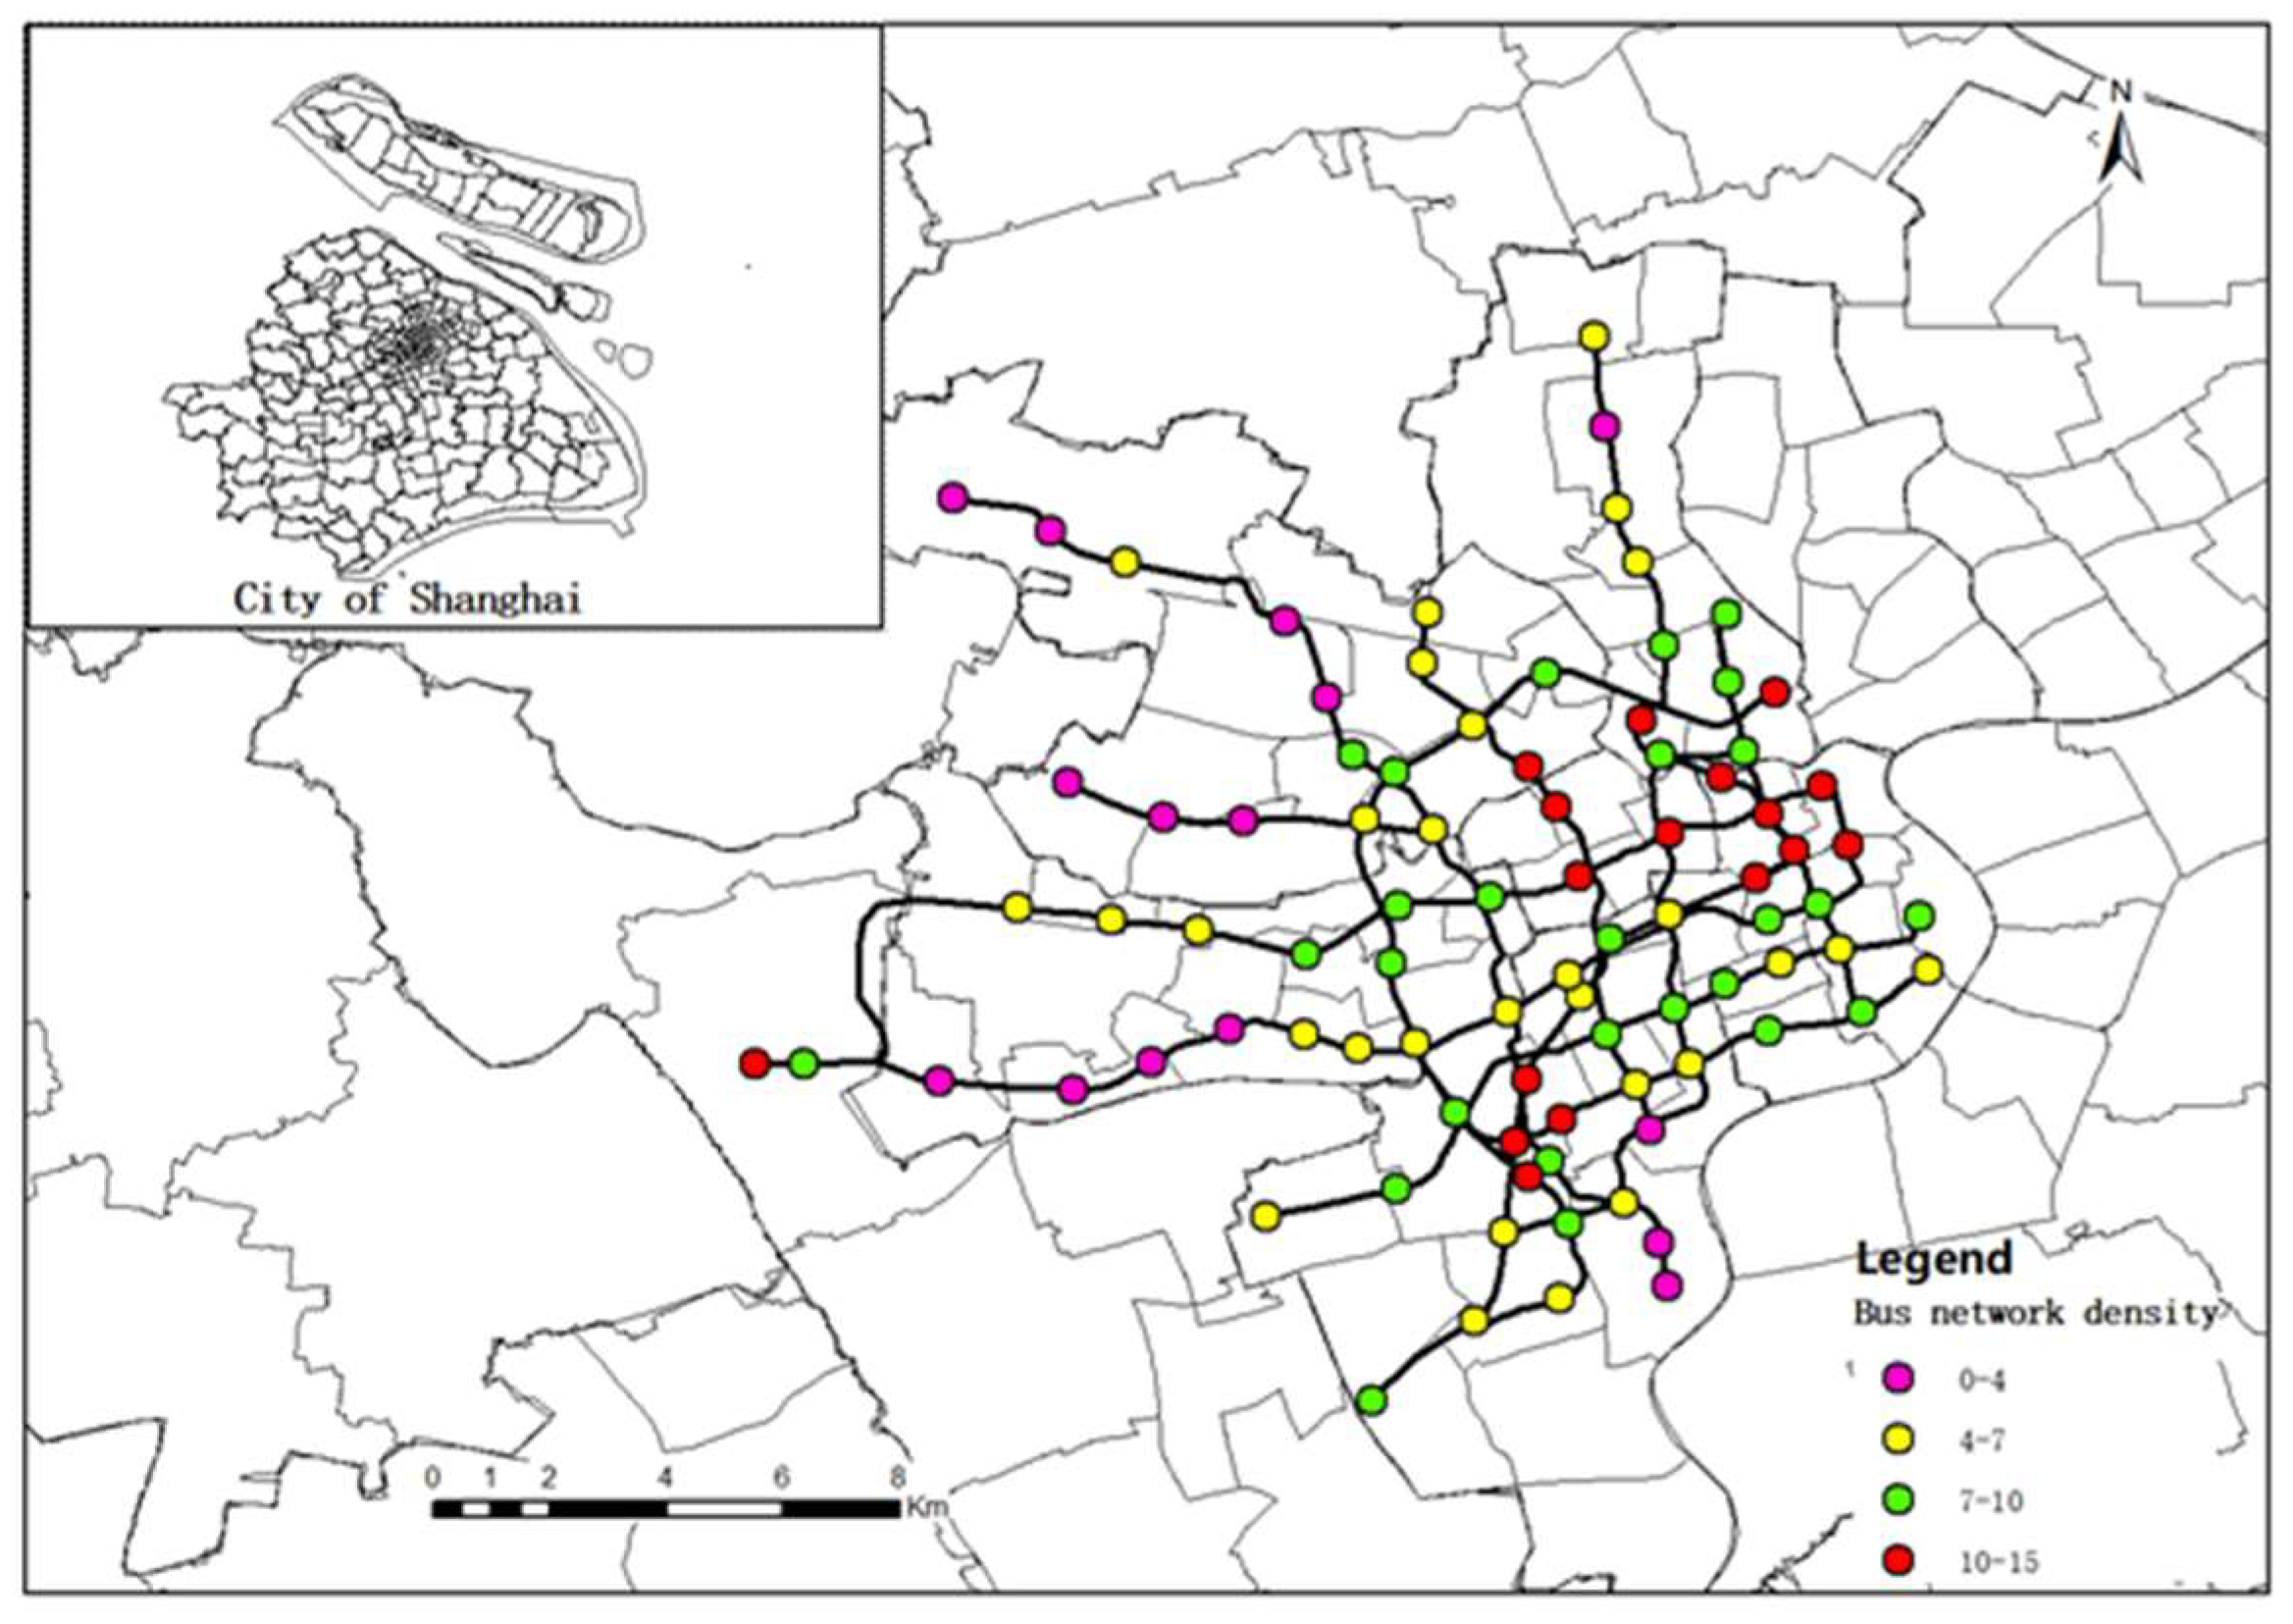
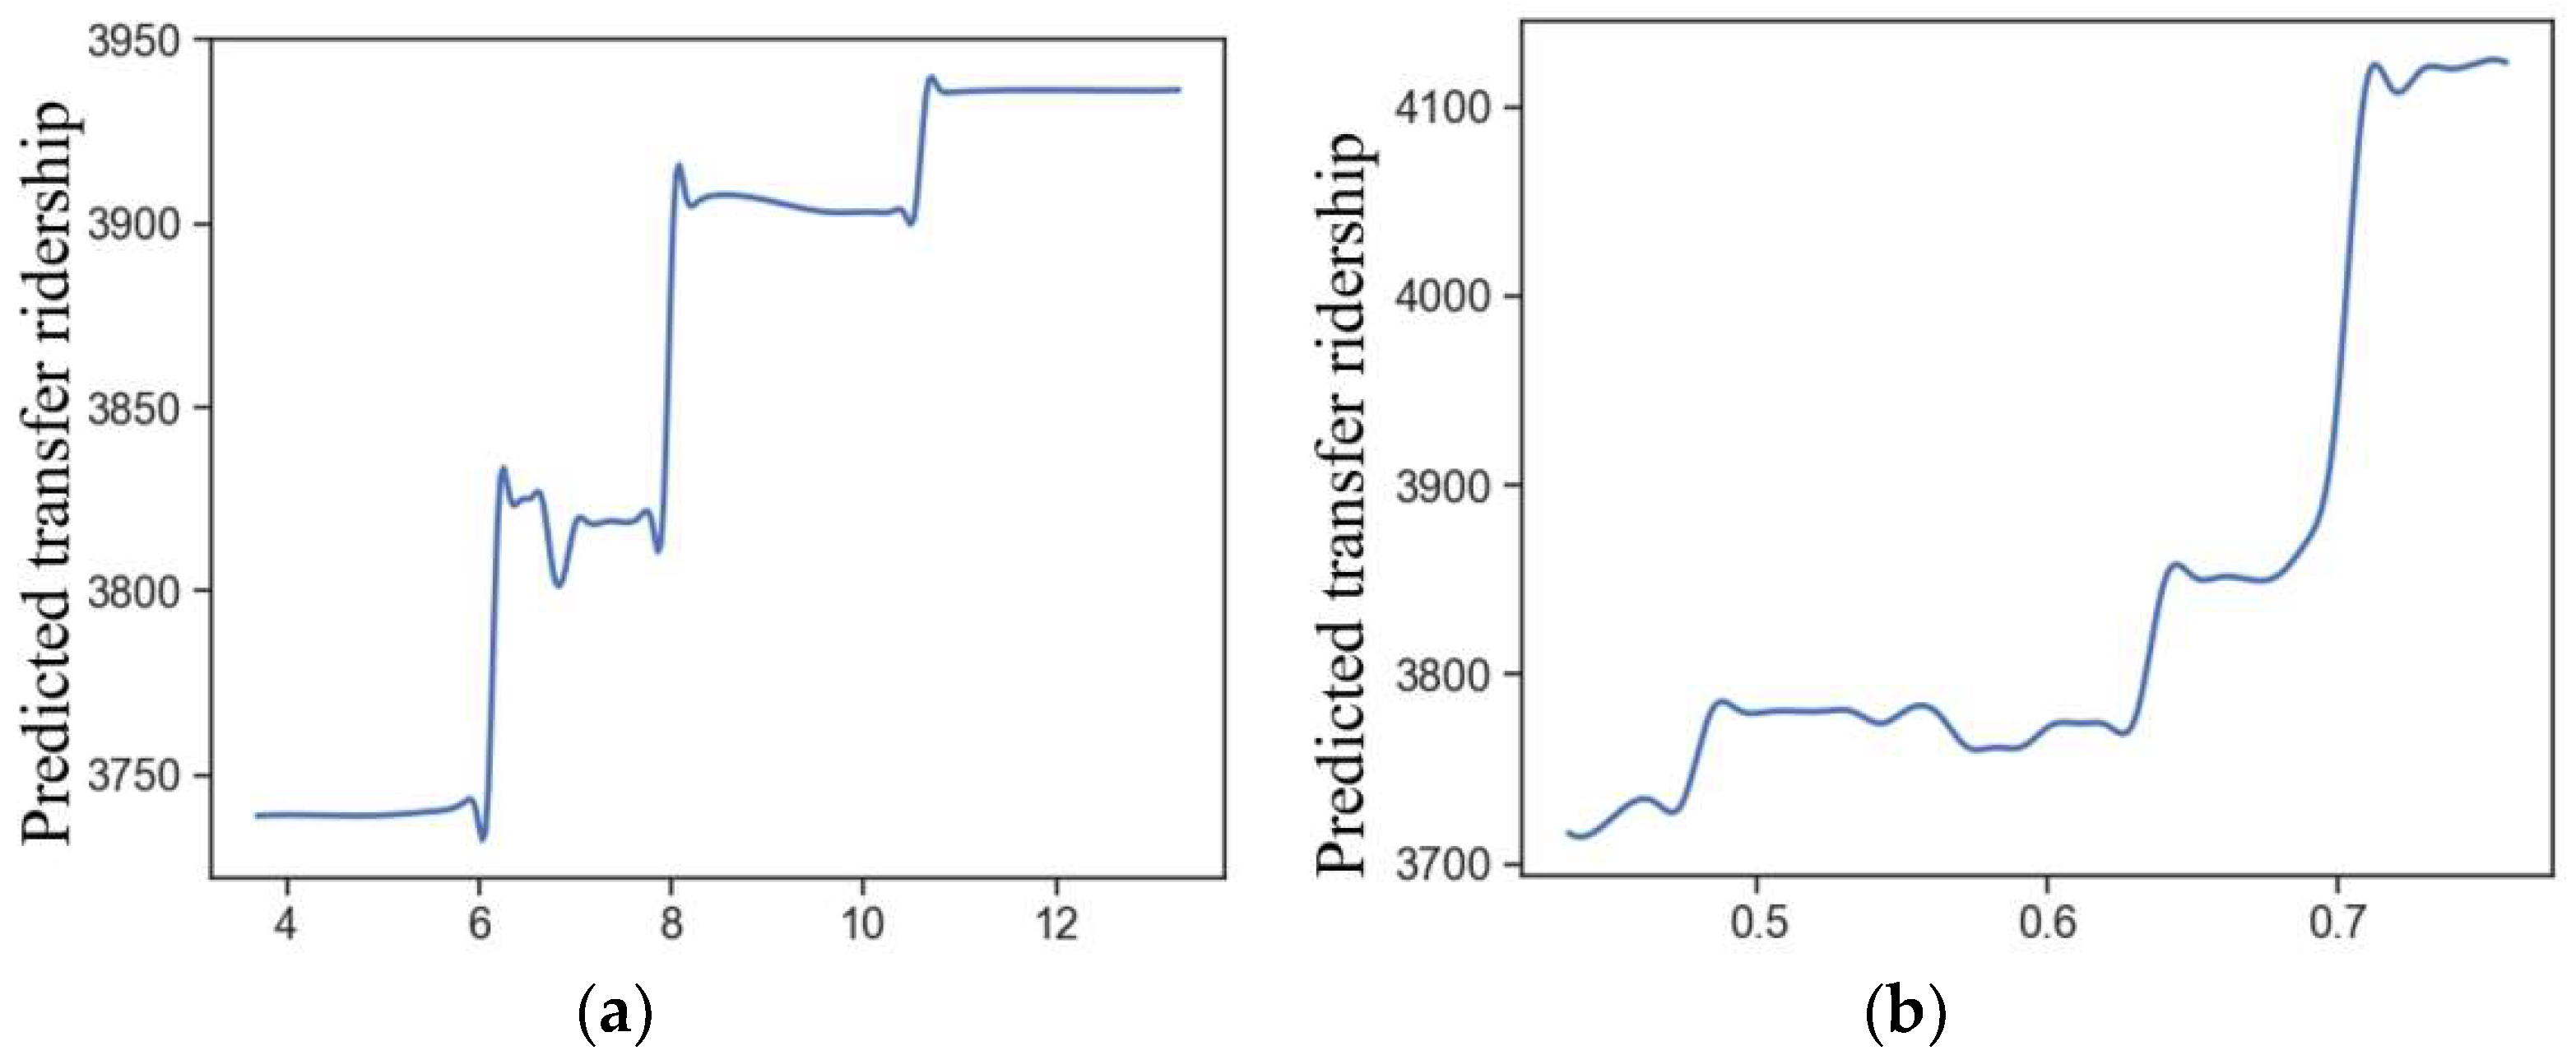
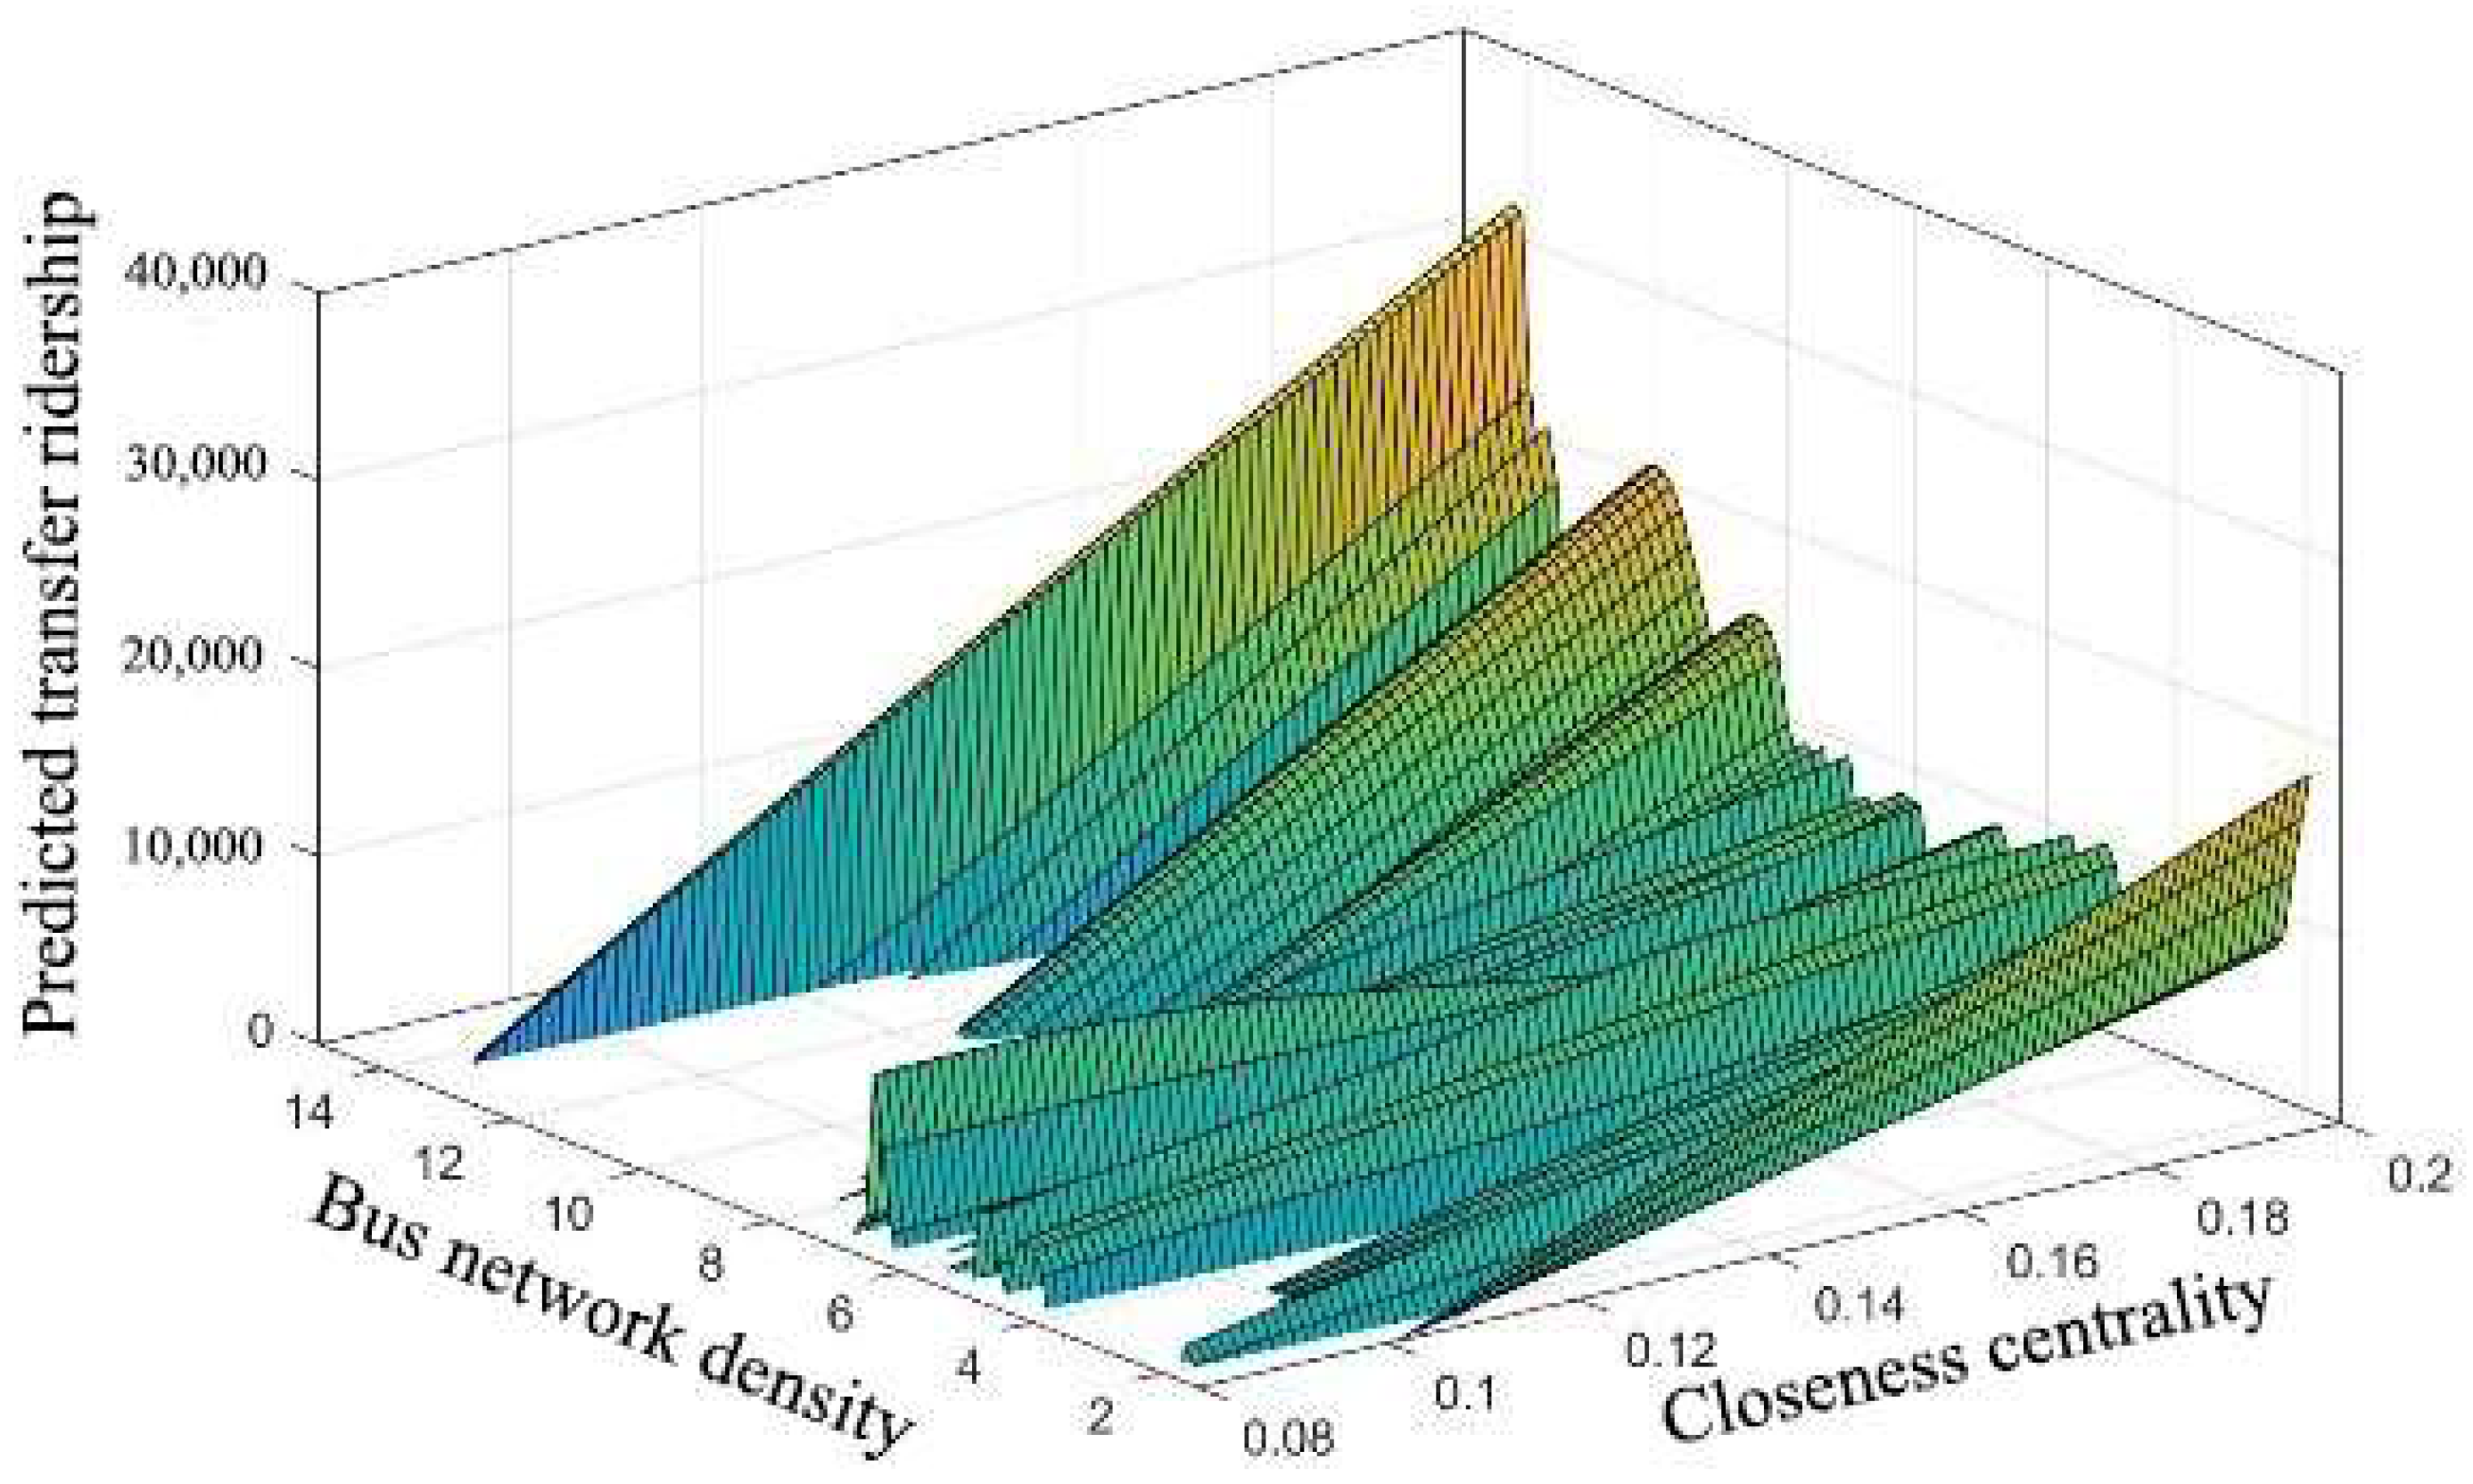
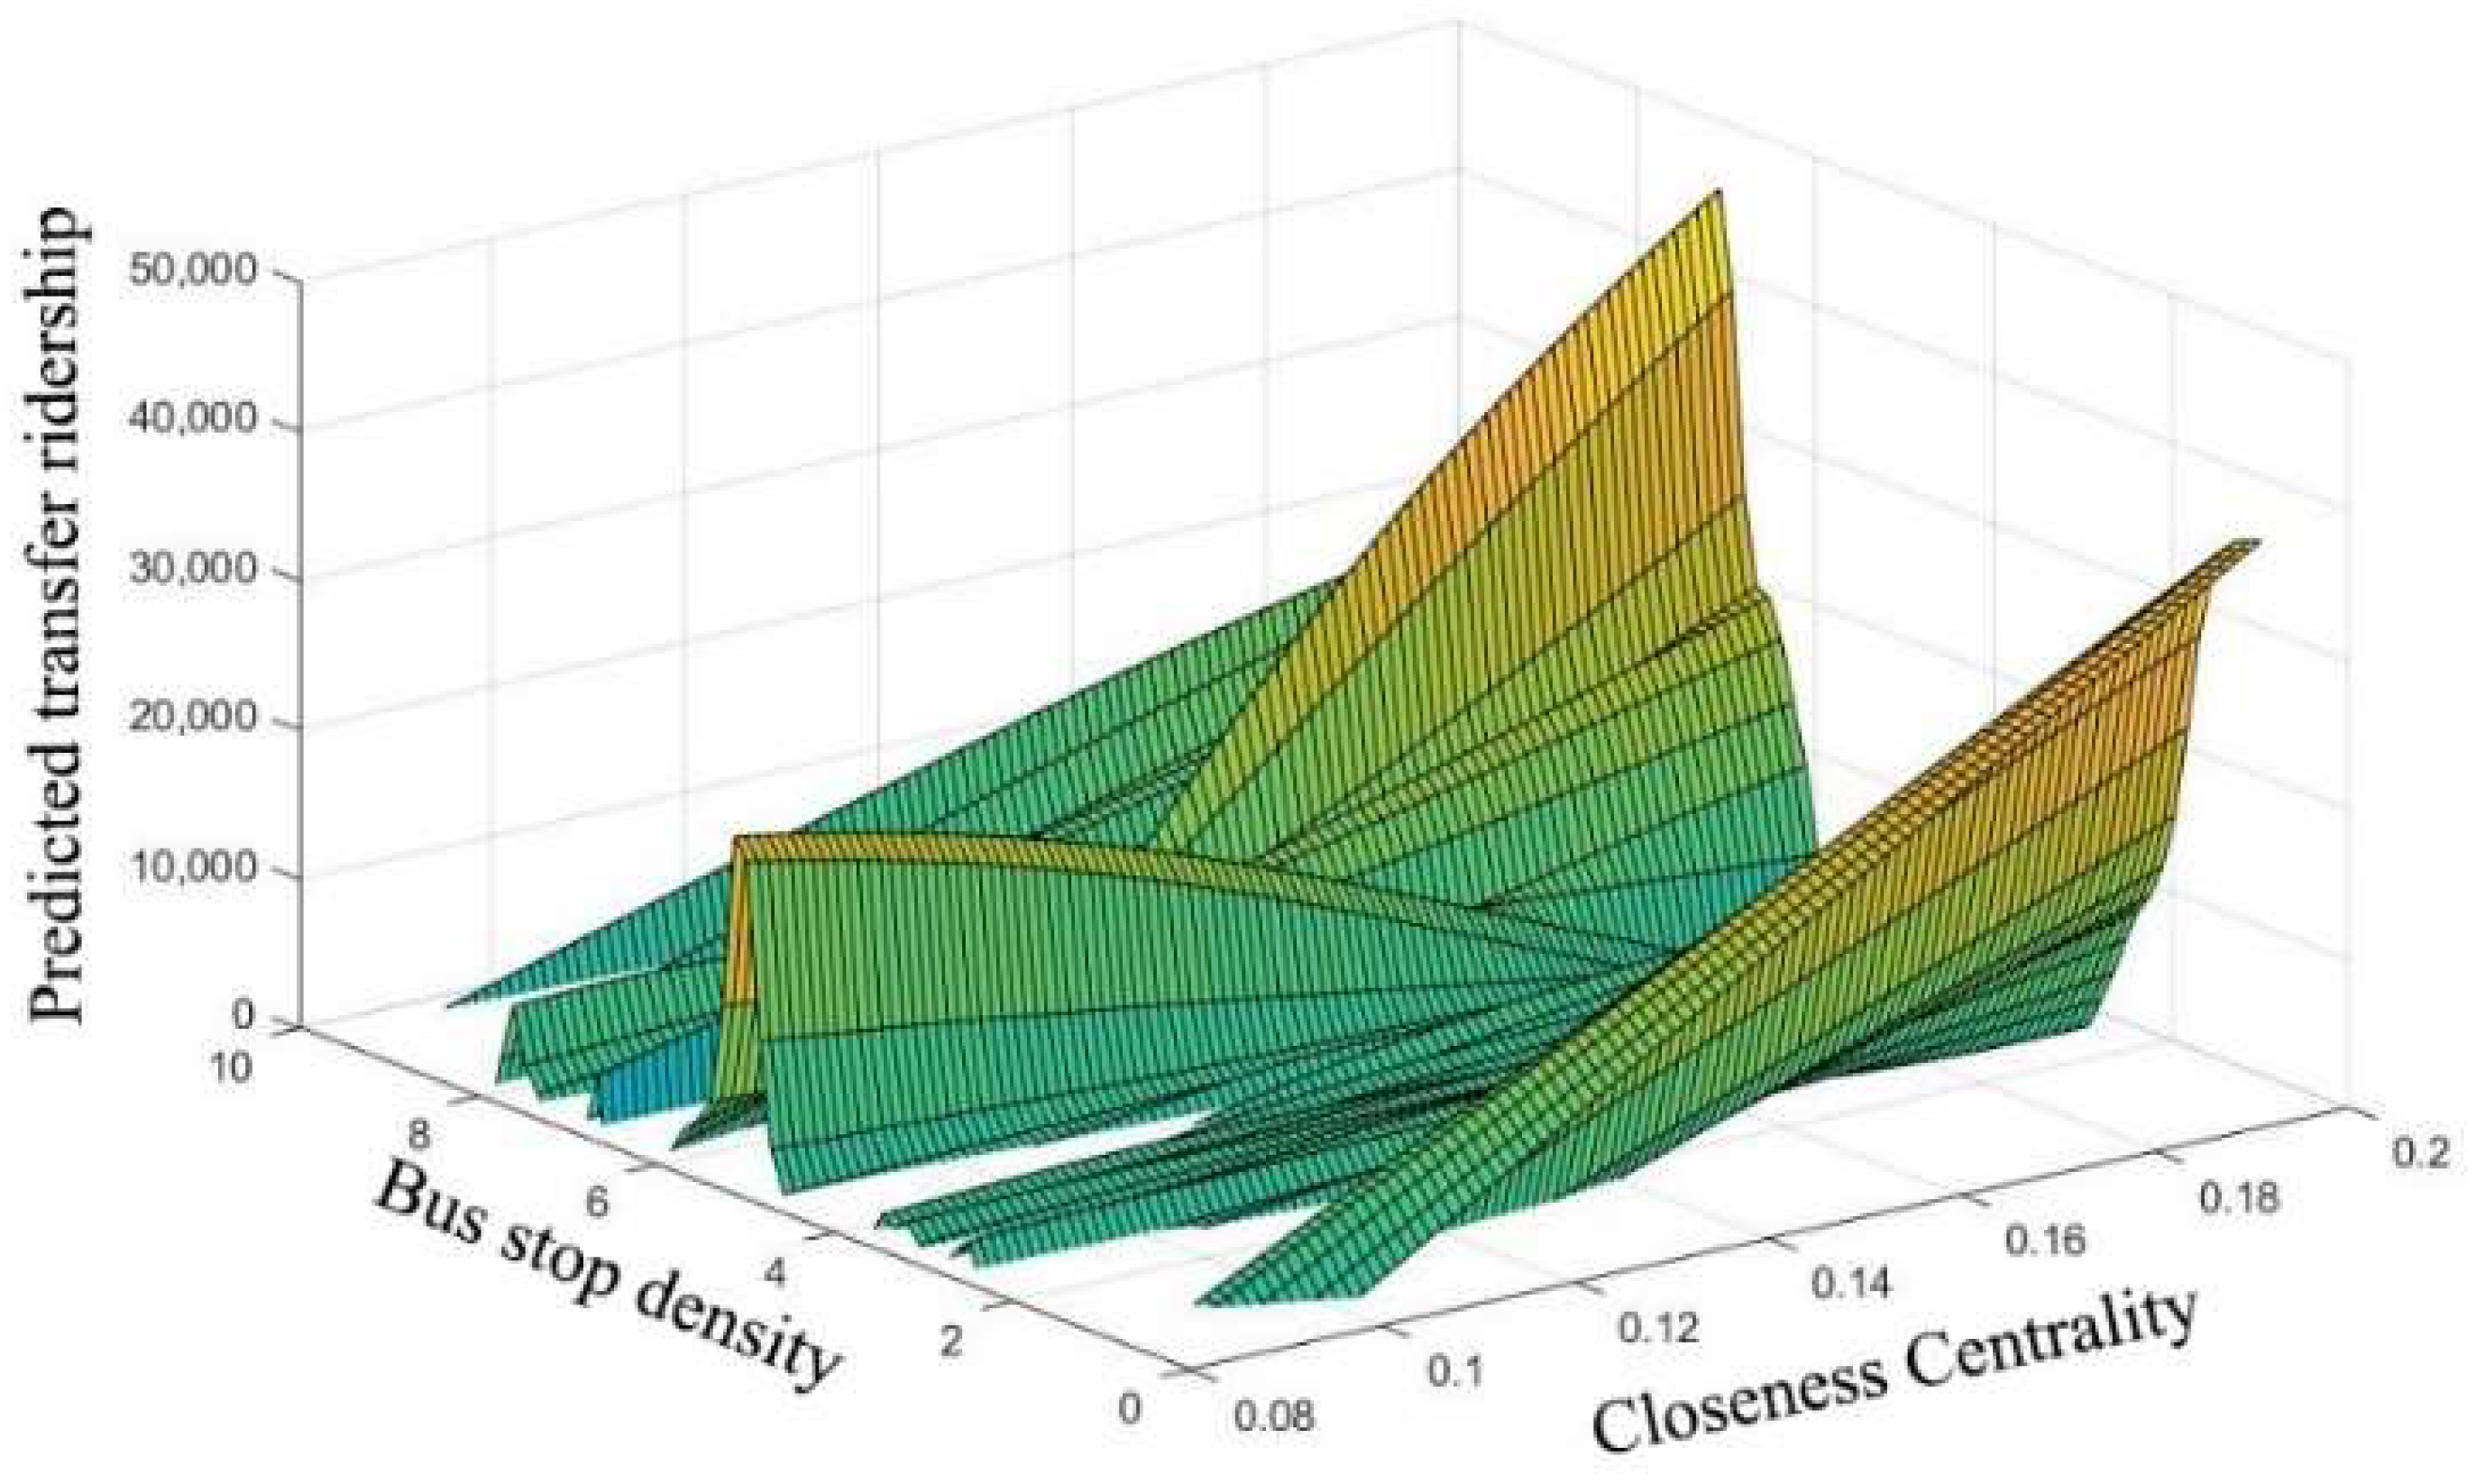
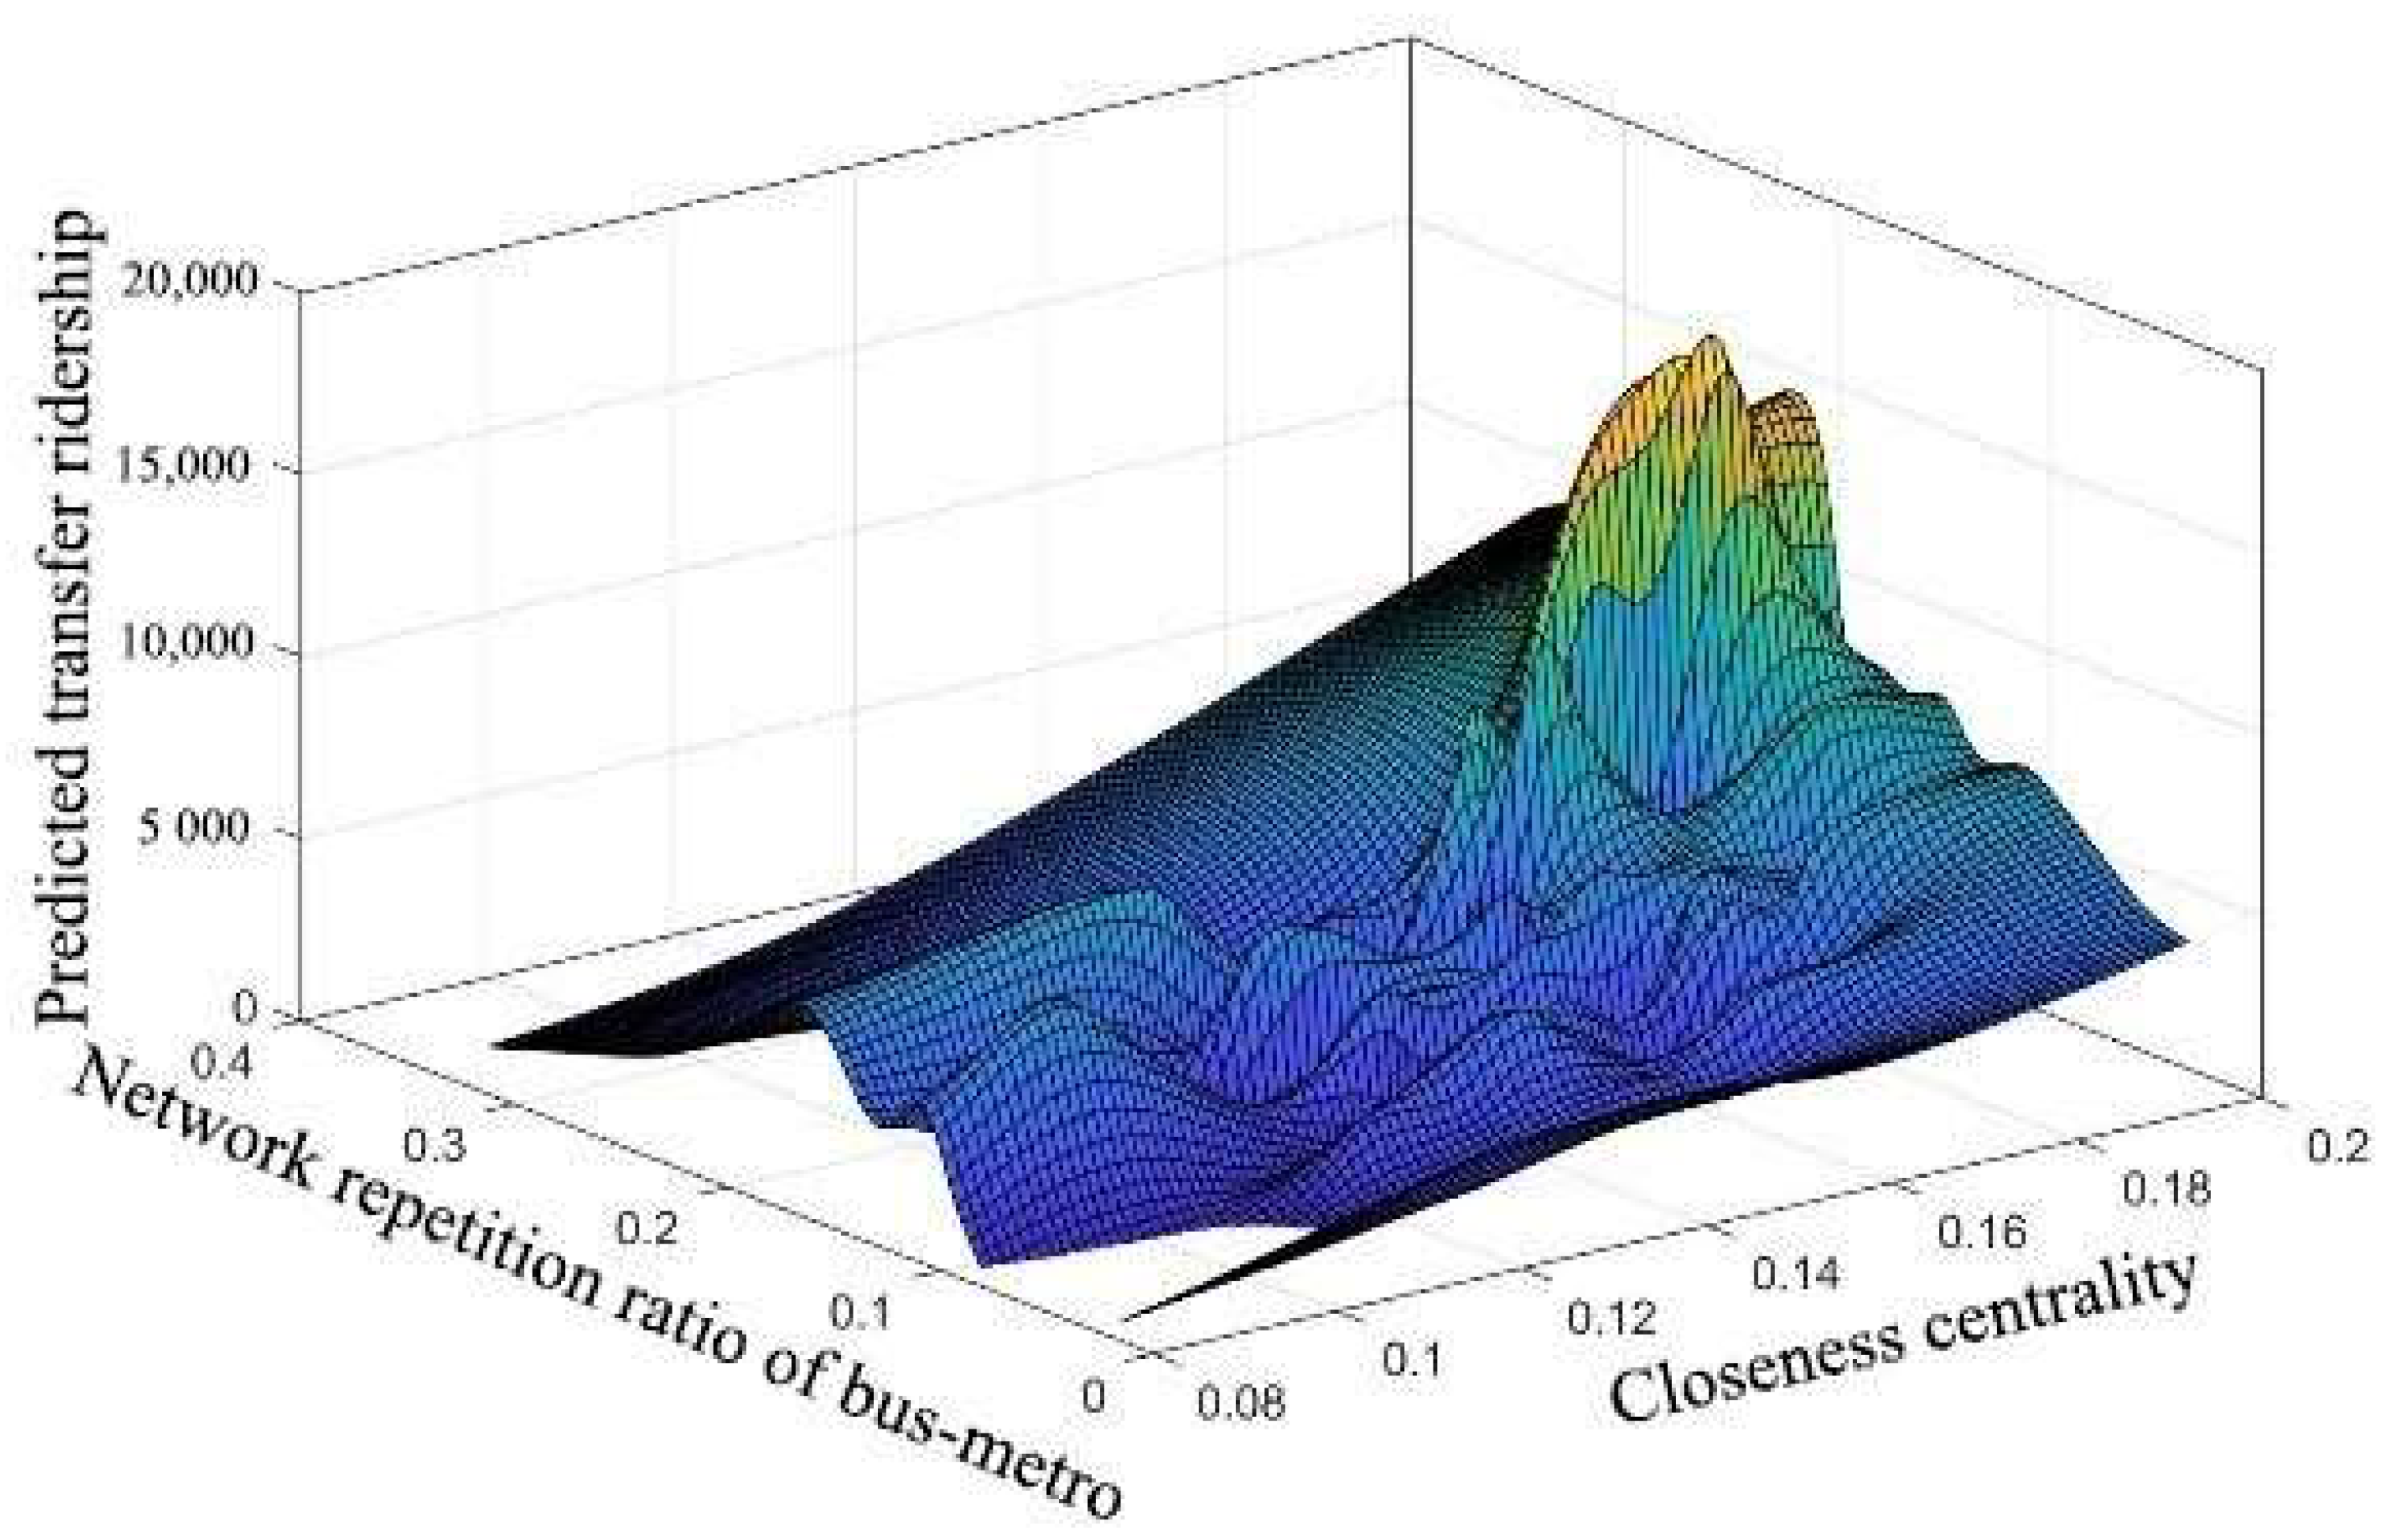
- As shown in Table 4, the bus–metro connection characteristics account for 53.77%, and the bus-network density is the most significant factor affecting transfer ridership, accounting for 27.56%, which is consistent with the results of [89]. The relative contribution rates of bus-stop density, network repetition ratio of bus–metro, and average transfer distance are 17.27%, 8.49%, and 0.45%, respectively. Similar to [30], this result emphasizes the importance of forming interfaces between different transportation systems.
- The location of metro stations in a transit network plays an important role in predicting transfer ridership, accounting for 22.1%. Closeness centrality is an important index to measure the transfer efficiency of bus–metro, ranking second among all variables, and the relative contribution rate is 21.6%. The distance to the central station has a small correlation with transfer ridership, respectively.
- The land-use attributes for trip attraction play a great guiding role in increasing the attraction of rail transit [90]. In this paper, the land-use attributes for trip attraction account for 5.39%, especially the commercial ratio, which contributes 3.28%. By contrast, the land-use attributes for trip production only account for 11%, which influence the ridership slightly. The result shows that the developed business circle in a region will drive the development of the surrounding bus–metro combined travel.
- In terms of demographic factors, population density (ages between 20–44) is an important factor, with a contribution rate of 5.37%, which can be attributed to younger employees that prefer to travel by public transport. The regional PGDP reflects the private car ownership in the region, to a certain extent. The number of private cars has a negative impact on passengers’ bus-travel mode, so the number of private cars should be reduced [49,91,92].
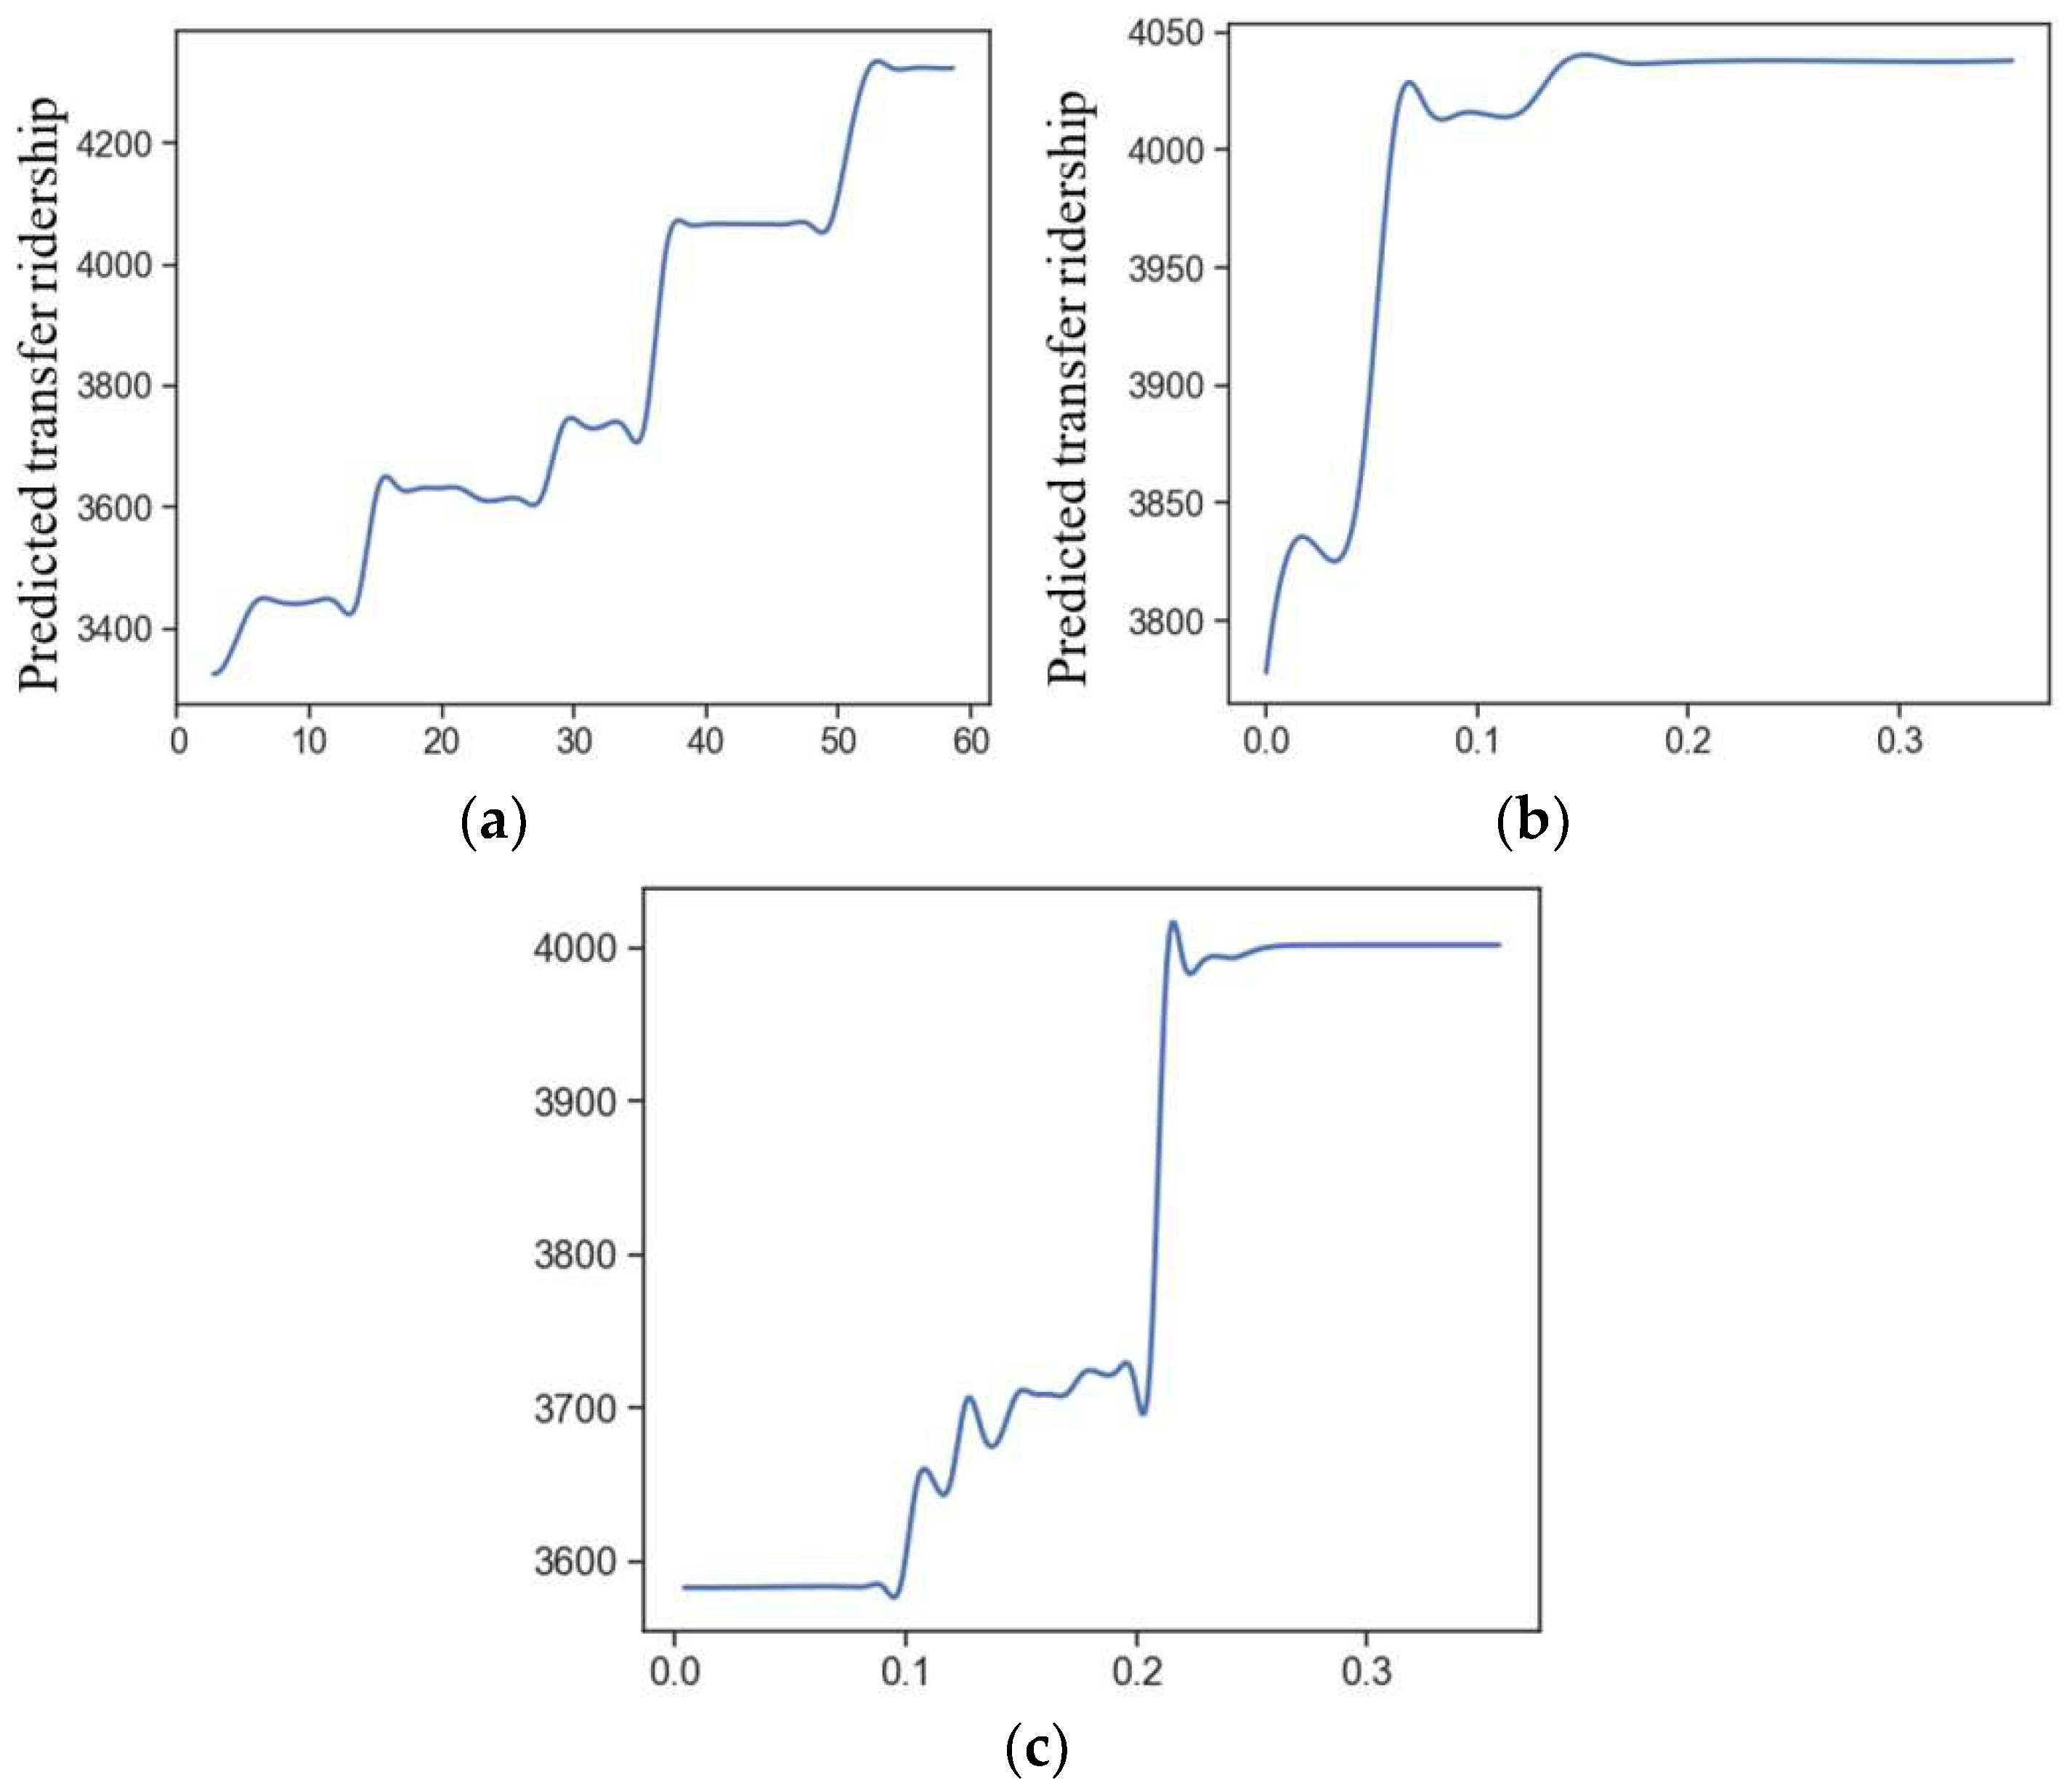
5.3. Nonlinear Effect between Built Environment and Bus–Metro-Transfer Ridership
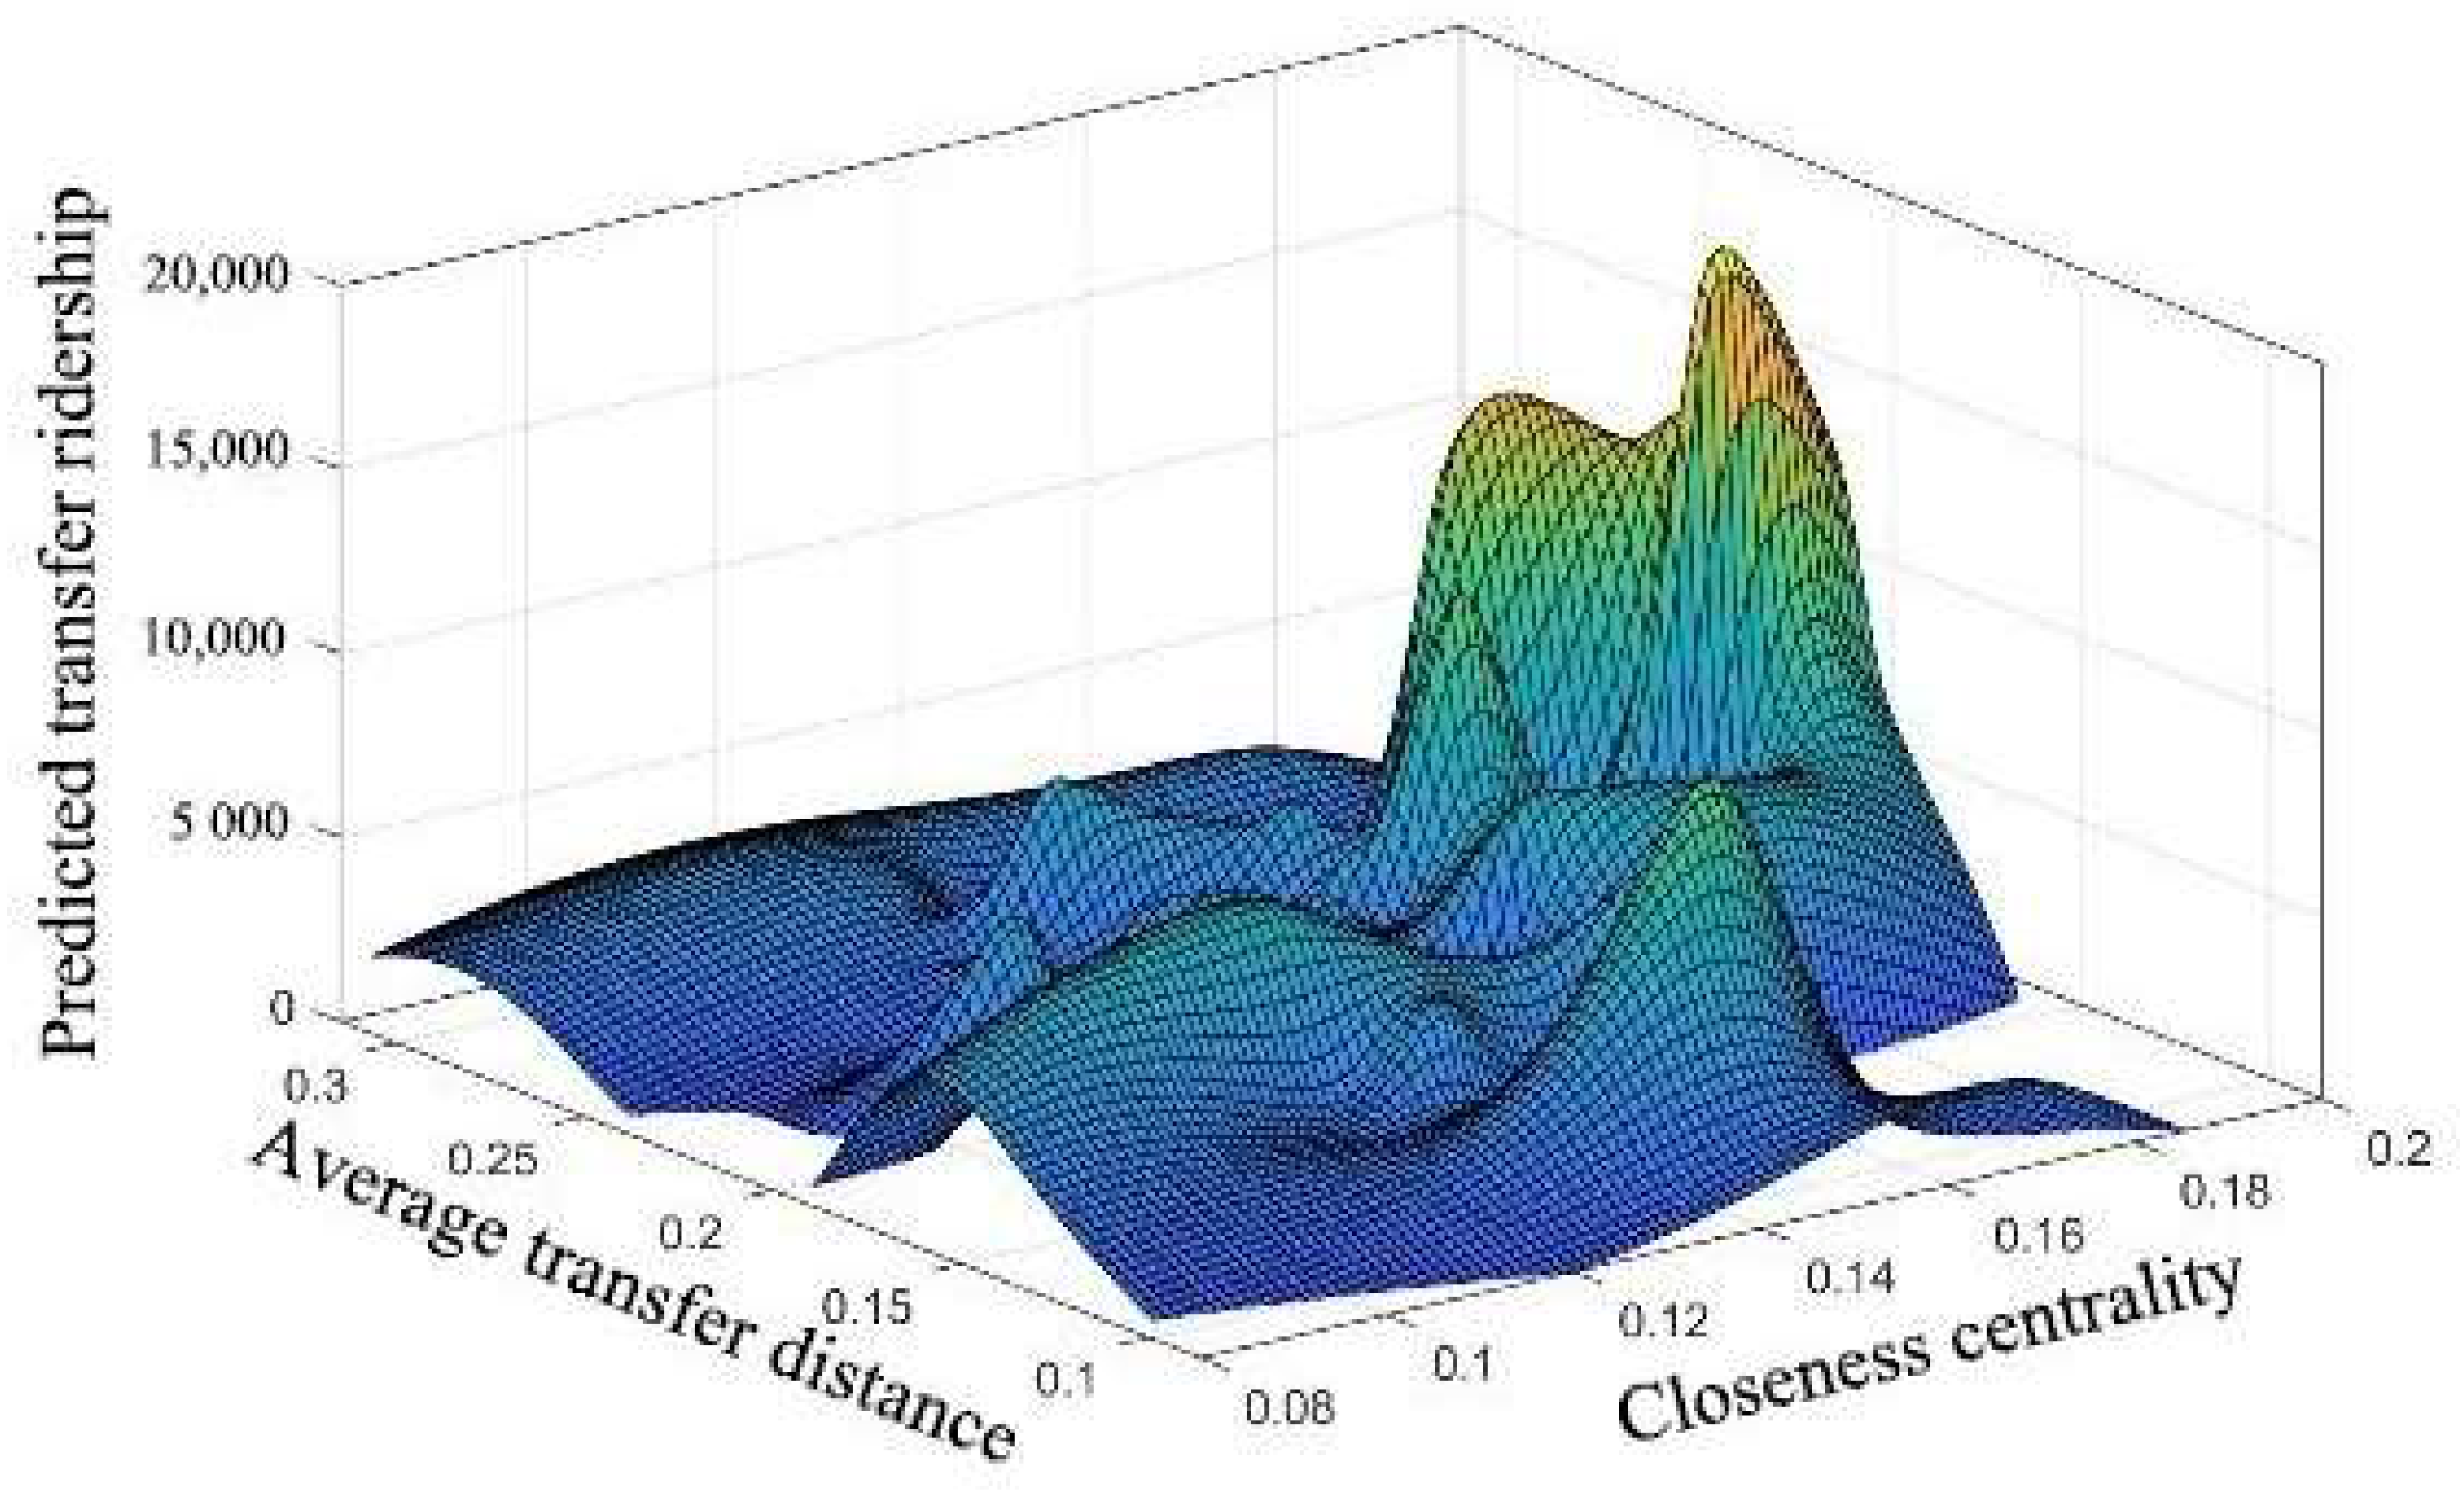
5.4. Interaction Effects of Bus–Metro Connection Characteristics and Closeness Centrality on Transfer Ridership
6. Conclusions
Author Contributions
Funding
Institutional Review Board Statement
Informed Consent Statement
Data Availability Statement
Acknowledgments
Conflicts of Interest
References
- Adnan, M.; Biran, B.-H.N.; Baburajan, V.; Basak, K.; Ben-Akiva, M. Examining impacts of time-based pricing strategies in public transportation: A study of Singapore. Transp. Res. Part A Policy Pract. 2020, 140, 127–141. [Google Scholar] [CrossRef]
- Wang, M.; Mao, B.; Yang, Y.; Shi, R.; Huang, J. Determining the Level of Service Scale of Public Transport System considering the Distribution of Service Quality. J. Adv. Transp. 2022, 2022, 1–14. [Google Scholar] [CrossRef]
- Ding, L.; Zhang, K.; Xie, B. Incorporating Space-Time Correlation of Population Densities into the Design of a Candidate Rail Transit Line over Years. Discret. Dyn. Nat. Soc. 2021, 2021, 1–12. [Google Scholar] [CrossRef]
- Yue, M.; Kang, C.; Andris, C.; Qin, K.; Liu, Y.; Meng, Q. Understanding the interplay between bus, metro, and cab ridership dynamics in Shenzhen, China. Trans. GIS 2018, 22, 855–871. [Google Scholar] [CrossRef]
- Zhao, D.; Wang, W.; Li, C.; Ji, Y.; Hu, X.; Wang, W. Recognizing metro-bus transfers from smart card data. Transp. Plan. Technol. 2018, 42, 70–83. [Google Scholar] [CrossRef]
- Li, J.; Lu, Y.; Ling, L. The Integration of Public Bicycle and Metro Transit: A Case Study in Suzhou, China. In ICTE 2019; American Society of Civil Engineers: Reston, VA, USA, 2020. [Google Scholar] [CrossRef]
- Gan, Z.; Yang, M.; Feng, T.; Timmermans, H.J. Examining the relationship between built environment and metro ridership at station-to-station level. Transp. Res. Part D Transp. Environ. 2020, 82, 102332. [Google Scholar] [CrossRef]
- Loo, B.; Chen, C.; Chan, E.T. Rail-based transit-oriented development: Lessons from New York City and Hong Kong. Landsc. Urban Plan. 2010, 97, 202–212. [Google Scholar] [CrossRef]
- Zhao, J.; Deng, W.; Song, Y.; Zhu, Y. What influences Metro station ridership in China? Insights from Nanjing. Cities 2013, 35, 114–124. [Google Scholar] [CrossRef]
- Kong, X.; Yang, J. A new method for forecasting station-level transit ridership from land-use perspective: The case of shenzhen city (in Chinese). Sci. Geogr. Sin 2018, 38, 2074–2083. [Google Scholar] [CrossRef]
- Wu, J.; Yang, M.; Sun, S.; Zhao, J. Modeling Travel Mode Choices in Connection to Metro Stations by Mixed Logit Models: A Case Study in Nanjing, China. Promet-Traffic Transp. 2018, 30, 549–561. [Google Scholar] [CrossRef]
- Munizaga, M.A.; Palma, C. Estimation of a disaggregate multimodal public transport Origin–Destination matrix from passive smartcard data from Santiago, Chile. Transp. Res. Part C Emerg. Technol. 2012, 24, 9–18. [Google Scholar] [CrossRef]
- Wang, J.; Ren, J.; Fu, X. Research on Bus and Metro Transfer From Perspective of Hypernetwork—A Case Study of Xi’an, China (December 2020). IEEE Access 2020, 8, 227048–227063. [Google Scholar] [CrossRef]
- Chakrabarti, S.; Giuliano, G. Does service reliability determine transit patronage? Insights from the Los Angeles Metro bus system. Transp. Policy 2015, 42, 12–20. [Google Scholar] [CrossRef]
- Cheng, Y.-H.; Tseng, W.-C. Exploring the effects of perceived values, free bus transfer, and penalties on intermodal metro–bus transfer users’ intention. Transp. Policy 2016, 47, 127–138. [Google Scholar] [CrossRef]
- Lei, D.; Chen, X.; Cheng, L.; Zhang, L.; Wang, P.; Wang, K. Minimum entropy rate-improved trip-chain method for origin–destination estimation using smart card data. Transp. Res. Part C Emerg. Technol. 2021, 130, 103307. [Google Scholar] [CrossRef]
- Ma, X.; Wang, Y. Development of a Data-Driven Platform for Transit Performance Measures Using Smart Card and GPS Data. J. Transp. Eng. 2014, 140, 04014063. [Google Scholar] [CrossRef]
- Lee, H.; Park, H.-C.; Kho, S.-Y.; Kim, D.-K. Assessing transit competitiveness in Seoul considering actual transit travel times based on smart card data. J. Transp. Geogr. 2019, 80, 102546. [Google Scholar] [CrossRef]
- Li, Y.-T.; Iwamoto, T.; Schmöcker, J.-D.; Nakamura, T.; Uno, N. Analyzing long-term travel behaviour: A comparison of smart card data and graphical usage patterns. Transp. Res. Procedia 2018, 32, 34–43. [Google Scholar] [CrossRef]
- Deng, Y.; Wang, J.; Gao, C.; Li, X.; Wang, Z.; Li, X. Assessing temporal–spatial characteristics of urban travel behaviors from multiday smart-card data. Phys. A: Stat. Mech. Its Appl. 2021, 576, 126058. [Google Scholar] [CrossRef]
- Huang, Z.; Xu, L.; Lin, Y.; Wu, P.; Feng, B. Citywide Metro-to-Bus Transfer Behavior Identification Based on Combined Data from Smart Cards and GPS. Appl. Sci. 2019, 9, 3597. [Google Scholar] [CrossRef]
- Wang, Z.-J.; Liu, Y.; Chen, F. Evaluation and Improvement of the Interchange from Bus to Metro Using Smart Card Data and GIS. J. Urban Plan. Dev. 2018, 144, 05018004. [Google Scholar] [CrossRef]
- El Mahrsi, M.K.; Come, E.; Oukhellou, L.; Verleysen, M. Clustering Smart Card Data for Urban Mobility Analysis. IEEE Trans. Intell. Transp. Syst. 2017, 18, 712–728. [Google Scholar] [CrossRef]
- Wu, X.; Tao, T.; Cao, J.; Fan, Y.; Ramaswami, A. Examining threshold effects of built environment elements on travel-related carbon-dioxide emissions. Transp. Res. Part D Transp. Environ. 2019, 75, 1–12. [Google Scholar] [CrossRef]
- Caset, F.; Blainey, S.; Derudder, B.; Boussauw, K.; Witlox, F. Integrating node-place and trip end models to explore drivers of rail ridership in Flanders, Belgium. J. Transp. Geogr. 2020, 87, 102796. [Google Scholar] [CrossRef]
- Li, S.; Lyu, D.; Liu, X.; Tan, Z.; Gao, F.; Huang, G.; Wu, Z. The varying patterns of rail transit ridership and their relationships with fine-scale built environment factors: Big data analytics from Guangzhou. Cities 2020, 99, 102580. [Google Scholar] [CrossRef]
- Ding, C.; Cao, X.; Liu, C. How does the station-area built environment influence Metrorail ridership? Using gradient boosting decision trees to identify non-linear thresholds. J. Transp. Geogr. 2019, 77, 70–78. [Google Scholar] [CrossRef]
- Van Wee, B.; Handy, S. Key research themes on urban space, scale, and sustainable urban mobility. Int. J. Sustain. Transp. 2013, 10, 18–24. [Google Scholar] [CrossRef]
- Zhang, W. Does compact land use trigger a rise in crime and a fall in ridership? A role for crime in the land use–travel connection. Urban Stud. 2016, 53, 3007–3026. [Google Scholar] [CrossRef]
- Wu, S.-S.; Zhuang, Y.; Chen, J.; Wang, W.; Bai, Y.; Lo, S.-M. Rethinking bus-to-metro accessibility in new town development: Case studies in Shanghai. Cities 2019, 94, 211–224. [Google Scholar] [CrossRef]
- Ma, X.; Zhang, J.; Ding, C.; Wang, Y. A geographically and temporally weighted regression model to explore the spatiotemporal influence of built environment on transit ridership. Comput. Environ. Urban Syst. 2018, 70, 113–124. [Google Scholar] [CrossRef]
- Tu, W.; Cao, R.; Yue, Y.; Zhou, B.; Li, Q.; Li, Q. Spatial variations in urban public ridership derived from GPS trajectories and smart card data. J. Transp. Geogr. 2018, 69, 45–57. [Google Scholar] [CrossRef]
- Navarrete, F.J.; Ortúzar, J.D.D. Subjective valuation of the transit transfer experience: The case of Santiago de Chile. Transp. Policy 2013, 25, 138–147. [Google Scholar] [CrossRef]
- Martínez, M.J.; Cornejo, J. Value of the Facilities and Attributes of New Heavy Rail and Bus Rapid Transit Projects in a Developing City: The Case of Lima, Peru. Transp. Res. Rec. J. Transp. Res. Board 2003, 1835, 50–58. [Google Scholar] [CrossRef]
- Chowdhury, S. The Effect of Interchange Attributes on Public-Transport Users′Intention to Use Routes Involving Transfers. Psychol. Behav. Sci. 2013, 2, 5. [Google Scholar] [CrossRef]
- Cherry, T.; Townsend, C. Assessment of Potential Improvements to Metro–Bus Transfers in Bangkok, Thailand. Transp. Res. Rec. J. Transp. Res. Board 2012, 2276, 116–122. [Google Scholar] [CrossRef]
- Chen, E.; Zhang, W.; Ye, Z.; Yang, M. Unraveling Latent Transfer Patterns Between Metro and Bus From Large-Scale Smart Card Data. IEEE Trans. Intell. Transp. Syst. 2020, 23, 3351–3365. [Google Scholar] [CrossRef]
- Chen, E.; Ye, Z.; Wu, H. Nonlinear effects of built environment on intermodal transit trips considering spatial heterogeneity. Transp. Res. Part D: Transp. Environ. 2021, 90, 102677. [Google Scholar] [CrossRef]
- Aston, L.; Currie, G.; Kamruzzaman, M.; Delbosc, A.; Brands, T.; van Oort, N.; Teller, D. Multi-city exploration of built environment and transit mode use: Comparison of Melbourne, Amsterdam and Boston. J. Transp. Geogr. 2021, 95, 103136. [Google Scholar] [CrossRef]
- Sagaris, L.; Tiznado-Aitken, I.; Steiniger, S. Exploring the social and spatial potential of an intermodal approach to transport planning. Int. J. Sustain. Transp. 2017, 11, 721–736. [Google Scholar] [CrossRef]
- Zhao, D.; Wang, W.; Woodburn, A.; Ryerson, M. Isolating high-priority metro and feeder bus transfers using smart card data. Transportation 2016, 44, 1535–1554. [Google Scholar] [CrossRef]
- Sung, H.; Oh, J.-T. Transit-oriented development in a high-density city: Identifying its association with transit ridership in Seoul, Korea. Cities 2011, 28, 70–82. [Google Scholar] [CrossRef]
- Wang, W.; Wang, Y.; Correia, G.H.D.A.; Chen, Y. A Network-Based Model of Passenger Transfer Flow between Bus and Metro: An Application to the Public Transport System of Beijing. J. Adv. Transp. 2020, 2020, 1–12. [Google Scholar] [CrossRef]
- Lin, C.; Wang, K.; Wu, D.; Gong, B. Passenger Flow Prediction Based on Land Use around Metro Stations: A Case Study. Sustainability 2020, 12, 6844. [Google Scholar] [CrossRef]
- Ding, C.; Cao, X.; Næss, P. Applying gradient boosting decision trees to examine non-linear effects of the built environment on driving distance in Oslo. Transp. Res. Part A Policy Pract. 2018, 110, 107–117. [Google Scholar] [CrossRef]
- Gutiérrez, J.; Cardozo, O.D.; García-Palomares, J.C. Transit ridership forecasting at station level: An approach based on distance-decay weighted regression. J. Transp. Geogr. 2011, 19, 1081–1092. [Google Scholar] [CrossRef]
- Jun, M.-J.; Choi, K.; Jeong, J.-E.; Kwon, K.-H.; Kim, H.-J. Land use characteristics of subway catchment areas and their influence on subway ridership in Seoul. J. Transp. Geogr. 2015, 48, 30–40. [Google Scholar] [CrossRef]
- Ewing, R.; Hamidi, S.; Gallivan, F.; Nelson, A.C.; Grace, J.B. Combined Effects of Compact Development, Transportation Investments, and Road User Pricing on Vehicle Miles Traveled in Urbanized Areas. Transp. Res. Rec. J. Transp. Res. Board 2013, 2397, 117–124. [Google Scholar] [CrossRef]
- Guo, Z.; Agrawal, A.W.; Dill, J. Are Land Use Planning and Congestion Pricing Mutually Supportive? J. Am. Plan. Assoc. 2011, 77, 232–250. [Google Scholar] [CrossRef]
- Litman, T.A. Understanding Transport Demands and Elasticities-How Prices and Other Factors Affect Travel Behavior. 2021. Victoria Transport Policy Institute. Available online: https://policycommons.net/artifacts/1543673/understanding-transport-demands-and-elasticities/2233482/ (accessed on 5 June 2022).
- Zhang, W.; Zhang, M. Incorporating land use and pricing policies for reducing car dependence: Analytical framework and empirical evidence. Urban Stud. 2017, 55, 3012–3033. [Google Scholar] [CrossRef]
- Zhou, Y.; Zheng, S. Public Transit Station Ranking in Bus-Metro Integrated Network. In Proceedings of the CICTP 2020, Xi’an, China, 14–16 August 2020; pp. 2683–2691. [Google Scholar]
- Huang, X.; Tan, J. Understanding spatio-temporal mobility patterns for seniors, child/student and adult using smart card data. Int. Arch. Photogramm. Remote Sens. Spat. Inf. Sci. 2014, XL-1, 167–172. [Google Scholar] [CrossRef]
- An, D.; Tong, X.; Liu, K.; Chan, E.H.W. Understanding the impact of built environment on metro ridership using open source in Shanghai. Cities 2019, 93, 177–187. [Google Scholar] [CrossRef]
- Hochmair, H.H. Spatiotemporal Pattern Analysis of Taxi Trips in New York City. Transp. Res. Rec. J. Transp. Res. Board 2016, 2542, 45–56. [Google Scholar] [CrossRef]
- Kuby, M.; Barranda, A.; Upchurch, C. Factors influencing light-rail station boardings in the United States. Transp. Res. Part A Policy Pract. 2004, 38, 223–247. [Google Scholar] [CrossRef]
- Lin, J.-J.; Shin, T.-Y. Does Transit-Oriented Development Affect Metro Ridership? Transp. Res. Rec. J. Transp. Res. Board 2008, 2063, 149–158. [Google Scholar] [CrossRef]
- Liu, J.; Wang, B.; Xiao, L. Non-linear associations between built environment and active travel for working and shopping: An extreme gradient boosting approach. J. Transp. Geogr. 2021, 92, 103034. [Google Scholar] [CrossRef]
- Dong, W.; Cao, X.; Wu, X.; Dong, Y. Examining pedestrian satisfaction in gated and open communities: An integration of gradient boosting decision trees and impact-asymmetry analysis. Landsc. Urban Plan. 2019, 185, 246–257. [Google Scholar] [CrossRef]
- Tao, T.; Wu, X.; Cao, J.; Fan, Y.; Das, K.; Ramaswami, A. Exploring the Nonlinear Relationship between the Built Environment and Active Travel in the Twin Cities. J. Plan. Educ. Res. 2020, 0739456X20915765. [Google Scholar] [CrossRef]
- Yang, L.; Ao, Y.; Ke, J.; Lu, Y.; Liang, Y. To walk or not to walk? Examining non-linear effects of streetscape greenery on walking propensity of older adults. J. Transp. Geogr. 2021, 94, 103099. [Google Scholar] [CrossRef]
- Galster, G.C. Nonlinear and Threshold Effects Related to Neighborhood: Implications for Planning and Policy. J. Plan. Lit. 2018, 33, 492–508. [Google Scholar] [CrossRef]
- Cheng, L.; Chen, X.; De Vos, J.; Lai, X.; Witlox, F. Applying a random forest method approach to model travel mode choice behavior. Travel Behav. Soc. 2018, 14, 1–10. [Google Scholar] [CrossRef]
- Cheng, L.; De Vos, J.; Zhao, P.; Yang, M.; Witlox, F. Examining non-linear built environment effects on elderly’s walking: A random forest approach. Transp. Res. Part D Transp. Environ. 2020, 88, 102552. [Google Scholar] [CrossRef]
- Ding, C.; Cao, X.; Wang, Y. Synergistic effects of the built environment and commuting programs on commute mode choice. Transp. Res. Part A Policy Pract. 2018, 118, 104–118. [Google Scholar] [CrossRef]
- Wang, L.; Zhao, C.; Liu, X.; Chen, X.; Li, C.; Wang, T.; Wu, J.; Zhang, Y. Non-Linear Effects of the Built Environment and Social Environment on Bus Use among Older Adults in China: An Application of the XGBoost Model. Int. J. Environ. Res. Public Health 2021, 18, 9592. [Google Scholar] [CrossRef] [PubMed]
- Wu, Z.; Zhu, M.; Kang, Y.; Leung, E.L.-H.; Lei, T.; Shen, C.; Jiang, D.; Wang, Z.; Cao, D.; Hou, T. Do we need different machine learning algorithms for QSAR modeling? A comprehensive assessment of 16 machine learning algorithms on 14 QSAR data sets. Briefings Bioinform. 2020, 22, bbaa321. [Google Scholar] [CrossRef] [PubMed]
- Chen, T.; Guestrin, C. XGBoost: A Scalable Tree Boosting System. In Proceedings of the 22nd ACM SIGKDD International Conference on Knowledge Discovery and Data Mining, San Francisco, CA, USA, 13–17 August 2016; Association for Computing Machinery: New York, NY, USA, 2016; pp. 785–794. [Google Scholar] [CrossRef]
- Zhou, Y.; Chen, H.; Li, J.; Wu, Y.; Wu, J.; Chen, L. Large-Scale Station-Level Crowd Flow Forecast with ST-Unet. ISPRS Int. J. Geo-Inf. 2019, 8, 140. [Google Scholar] [CrossRef]
- Yang, Y.; Heppenstall, A.; Turner, A.; Comber, A. Using graph structural information about flows to enhance short-term demand prediction in bike-sharing systems. Comput. Environ. Urban Syst. 2020, 83, 101521. [Google Scholar] [CrossRef]
- Lyu, G.; Bertolini, L.; Pfeffer, K. Developing a TOD typology for Beijing metro station areas. J. Transp. Geogr. 2016, 55, 40–50. [Google Scholar] [CrossRef]
- Wey, W.-M.; Zhang, H.; Chang, Y.-J. Alternative transit-oriented development evaluation in sustainable built environment planning. Habitat Int. 2016, 55, 109–123. [Google Scholar] [CrossRef]
- Staricco, L.; Brovarone, E.V. Promoting TOD through regional planning. A comparative analysis of two European approaches. J. Transp. Geogr. 2018, 66, 45–52. [Google Scholar] [CrossRef]
- Chigudu, A.; Chirisa, I. The quest for a sustainable spatial planning framework in Zimbabwe and Zambia. Land Use Policy 2020, 92, 104442. [Google Scholar] [CrossRef]
- Wan, C.; Su, S. Neighborhood housing deprivation and public health: Theoretical linkage, empirical evidence, and implications for urban planning. Habitat Int. 2016, 57, 11–23. [Google Scholar] [CrossRef]
- Su, S.; Zhou, H.; Xu, M.; Ru, H.; Wang, W.; Weng, M. Auditing street walkability and associated social inequalities for planning implications. J. Transp. Geogr. 2018, 74, 62–76. [Google Scholar] [CrossRef]
- Dou, Y.; Luo, X.; Dong, L.; Wu, C.; Liang, H.; Ren, J. An empirical study on transit-oriented low-carbon urban land use planning: Exploratory Spatial Data Analysis (ESDA) on Shanghai, China. Habitat Int. 2016, 53, 379–389. [Google Scholar] [CrossRef]
- Hong-Fei, J.; Heng, S.; Qing-Yu, L.; Jin-Ling, Y.; Hong-Zhi, M. A cooperative evacuation strategy for mass passenger flow in urban rail transit transfer stations. Int. J. Mod. Phys. C 2020, 32, 2150007. [Google Scholar] [CrossRef]
- Seriani, S.; Fernández, R. Planning guidelines for metro–bus interchanges by means of a pedestrian microsimulation model. Transp. Plan. Technol. 2015, 38, 569–583. [Google Scholar] [CrossRef]
- Wang, Z.-J.; Chen, F.; Xu, T.-K. Interchange between Metro and Other Modes: Access Distance and Catchment Area. J. Urban Plan. Dev. 2016, 142, 04016012. [Google Scholar] [CrossRef]
- Lee, C.; Miller, J.S. A probability-based indicator for measuring the degree of multimodality in transportation investments. Transp. Res. Part A Policy Pract. 2017, 103, 377–390. [Google Scholar] [CrossRef]
- Fisch-Romito, V.; Guivarch, C. Transportation infrastructures in a low carbon world: An evaluation of investment needs and their determinants. Transp. Res. Part D Transp. Environ. 2019, 72, 203–219. [Google Scholar] [CrossRef]
- Song, L.; Chen, F.; Xian, K.; Sun, M. Research on a Scientific Approach for Bus and Metro Networks Integration. Procedia-Soc. Behav. Sci. 2012, 43, 740–747. [Google Scholar] [CrossRef][Green Version]
- Sun, Y.; Sun, X.; Li, B.; Gao, D. Joint Optimization of a Rail Transit Route and Bus Routes in a Transit Corridor. Procedia-Soc. Behav. Sci. 2013, 96, 1218–1226. [Google Scholar] [CrossRef]
- Rao, M.; Liu, G.; Xia, J. Exploration on the repetition coefficient of conventional bus and rail transit network—Taking Chongqing public transit network data as an example (in Chinese). Urban Constr. Theory Res. 2015, 7572. [Google Scholar]
- Zhang, D.; Qian, L.; Mao, B.; Huang, C.; Huang, B.; Si, Y. A Data-Driven Design for Fault Detection of Wind Turbines Using Random Forests and XGboost. IEEE Access 2018, 6, 21020–21031. [Google Scholar] [CrossRef]
- Tu, M.; Li, W.; Orfila, O.; Li, Y.; Gruyer, D. Exploring nonlinear effects of the built environment on ridesplitting: Evidence from Chengdu. Transp. Res. Part D: Transp. Environ. 2021, 93, 102776. [Google Scholar] [CrossRef]
- Lee, E.H.; Lee, H.; Kho, S.-Y.; Kim, D.-K. Evaluation of Transfer Efficiency between Bus and Subway based on Data Envelopment Analysis using Smart Card Data. KSCE J. Civ. Eng. 2018, 23, 788–799. [Google Scholar] [CrossRef]
- Sung, H.; Choi, K.; Lee, S.; Cheon, S. Exploring the impacts of land use by service coverage and station-level accessibility on rail transit ridership. J. Transp. Geogr. 2014, 36, 134–140. [Google Scholar] [CrossRef]
- Niemeier, D.; Grattet, R.; Beamish, T. “Blueprinting” and climate change: Regional governance and civic participation in land use and transportation planning. Environ. Plan. C Gov. Policy 2015, 33, 1600–1617. [Google Scholar] [CrossRef]
- Heinrichs, D. Autonomous Driving and Urban Land Use. Autonomous driving and urban land use. In Autonomous Driving; Springer: Berlin/Heidelberg, Germany, 2016; pp. 213–231. [Google Scholar] [CrossRef]
- Hong, L.; Yan, Y.; Ouyang, M.; Tian, H.; He, X. Vulnerability effects of passengers’ intermodal transfer distance preference and subway expansion on complementary urban public transportation systems. Reliab. Eng. Syst. Saf. 2017, 158, 58–72. [Google Scholar] [CrossRef]


| Variable Name | Description | Data Sources | Mean | S.D. | VIF |
|---|---|---|---|---|---|
| Dependent variable | |||||
| Transfer ridership | Transfer ridership from bus to metro, of a metro station (thousand) | Metro smartcard data of Shanghai on 1 September 2016 | 3.82 | 3.17 | |
| Independent variables | |||||
| Bus–metro connection characteristics | |||||
| Bus-network density | The length of bus-network centerline per square kilometer (km/km2) | OpenStreetMap (OSM) data of 2020 Shanghai | 7.46 | 3.29 | 3.46 |
| Network repetition ratio of bus–metro | The repetition ratio R = L/S, where L is the parallel line of bus and metro, and S is the total bus line per square kilometer (km/km2) | OpenStreetMap (OSM) data, of 2020 Shanghai | 0.13 | 0.05 | 1.32 |
| Bus-stop density | Number of bus stops per square kilometer (counts/km2) | Point-of-interest (POI) data, of 2020 Shanghai | 6.58 | 3.13 | 3.96 |
| Average transfer distance | Average transfer distance, from bus stop to near metro (km) | Distance crawled from the Baidu Map (map.baidu.com, accessed on 12 April 2022) | 0.2 | 0.05 | 1.40 |
| Network attributes of metro stations | |||||
| Distance to the central station | Network distance to Jing’an Temple station (km) | Distance crawled from the Baidu Map (map.baidu.com, accessed on 12 April 2022) | 4.81 | 2.55 | 6.50 |
| Closeness centrality | The closeness contrary, where n is the number of all nodes in network, is the shortest distance between node v and node u. | Distance crawled from the Baidu Map (map.baidu.com, accessed on 12 April 2022) | 0.15 | 0.02 | 4.40 |
| Land-use attributes for trip attraction | |||||
| Employment density | Number of jobs per square kilometer (thousand/km2) | Point-of-interest (POI) data, of 2020 Shanghai | 33.34 | 16.68 | 2.17 |
| Industrial ratio | The ratio I = areas, for industrial use/all land areas | Land-use data, of 2020 Shanghai | 0.05 | 0.11 | 2.69 |
| Commercial ratio | The ratio C = areas, for commercial use/all land areas | Land-use data, of 2020 Shanghai | 0.16 | 0.11 | 2.01 |
| Land-use attributes for trip production | |||||
| Residential ratio | The ratio R = areas, for residential use/all land areas | Land-use data, of 2020 Shanghai | 0.38 | 0.14 | 2.78 |
| Other land-use attributes | |||||
| Land-use diversity | Entropy index of land use (0–1): Where m is the type of land use, is the ratio of type-I land use to the total land area. | Land-use data, of Shanghai 2020 | 0.61 | 0.1 | 2.43 |
| Street density | Length of the road/area size (km/km2) | OpenStreetMap (OSM) data, of 2020 Shanghai | 7.67 | 3.00 | 2.57 |
| Demographic factors | |||||
| Car ownership | Ratio of workers with private cars, in average housing scale | Shanghai Statistical Yearbook 2020 | 0.63 | 0.08 | 1.45 |
| Population density (ages between 20 and 44) | Population between 20 and 44 years old per square kilometer (thousand person/km2) | Shanghai Statistical Yearbook 2020 | 0.41 | 0.04 | 1.47 |
| Local population density | Local population per square kilometer (thousand person/km2) | Shanghai Statistical Yearbook 2020 | 32.5 | 24.98 | 4.56 |
| Average age | Average age of the residential in the area | Shanghai Statistical Yearbook 2020 | 42.01 | 0.92 | 1.40 |
| PGDP | Per capita gross domestic product (104 RMB per capita) | Shanghai Statistical Yearbook 2020 | 4.41 | 1.96 | 3.14 |
| Housing price | Average house prices near metro station (103 RMB per square meter) 2021.6 | Baidu 2020 | 91.14 | 17.7 | 3.00 |
| Average house size | Average house scale per kilometer | Shanghai Statistical Yearbook 2020 | 2.53 | 0.09 | 1.38 |
| Metrics | Traditional Linear Model | Random Forest | Light GBM | XGBoost |
|---|---|---|---|---|
| R2 | 0.701 | 0.594 | 0.603 | 0.821 |
| MAE | 0.247 | 0.125 | 0.105 | 0.098 |
| MSE | 0.065 | 0.027 | 0.023 | 0.017 |
| Variables | Relative Importance (%) | Rank |
|---|---|---|
| Bus–Metro Connection Characteristics (53.77%) | ||
| Bus-network density | 27.56 | 1 |
| Bus-stop density | 17.27 | 3 |
| Network repetition ratio of bus–metro | 8.49 | 4 |
| Average transfer distance | 0.45 | 15 |
| Network attributes of metro stations (22.1%) | ||
| Closeness centrality | 21.6 | 2 |
| Distance to the central station | 0.5 | 14 |
| Land-use attributes for trip attraction (5.39%) | ||
| Commercial ratio | 3.28 | 7 |
| Employment density | 1.97 | 9 |
| Industrial ratio | 0.14 | 16 |
| Land-use attributes for trip production (0.11%) | ||
| Residential ratio | 0.11 | 17 |
| Other land-use attributes (0.77%) | ||
| Land-use diversity | 0.72 | 12 |
| Street density | 0.05 | 18 |
| Demographic factors (17.86%) | ||
| Average age | 6.18 | 5 |
| Population density (age between 20 and 44) | 5.73 | 6 |
| Average house size | 2.26 | 8 |
| Car ownership | 1.68 | 10 |
| Local population density | 1.37 | 11 |
| PGDP | 0.63 | 13 |
| Housing price | 0.01 | 19 |
Publisher’s Note: MDPI stays neutral with regard to jurisdictional claims in published maps and institutional affiliations. |
© 2022 by the authors. Licensee MDPI, Basel, Switzerland. This article is an open access article distributed under the terms and conditions of the Creative Commons Attribution (CC BY) license (https://creativecommons.org/licenses/by/4.0/).
Share and Cite
Liu, D.; Rong, W.; Zhang, J.; Ge, Y.-E. Exploring the Nonlinear Effects of Built Environment on Bus-Transfer Ridership: Take Shanghai as an Example. Appl. Sci. 2022, 12, 5755. https://doi.org/10.3390/app12115755
Liu D, Rong W, Zhang J, Ge Y-E. Exploring the Nonlinear Effects of Built Environment on Bus-Transfer Ridership: Take Shanghai as an Example. Applied Sciences. 2022; 12(11):5755. https://doi.org/10.3390/app12115755
Chicago/Turabian StyleLiu, Ding, Wuyue Rong, Jin Zhang, and Ying-En (Ethan) Ge. 2022. "Exploring the Nonlinear Effects of Built Environment on Bus-Transfer Ridership: Take Shanghai as an Example" Applied Sciences 12, no. 11: 5755. https://doi.org/10.3390/app12115755
APA StyleLiu, D., Rong, W., Zhang, J., & Ge, Y.-E. (2022). Exploring the Nonlinear Effects of Built Environment on Bus-Transfer Ridership: Take Shanghai as an Example. Applied Sciences, 12(11), 5755. https://doi.org/10.3390/app12115755