1. Introduction
In the last decade, the focus of structural building projects has been on interventions in existing structures rather than on the design and construction of new buildings. Such intervention projects aimed to extend, change and/or adapt the building to new performance requirements. Thus, strengthening and retrofitting activities actually represent an important amount of the activities of the construction sector.
In addition, the occurrence of several seismic events in the last decades has also highlighted the key role played by adequate maintenance of existing construction patrimony, while also drawing attention to the assessment of the seismic vulnerability of such structures and their retrofitting. The approach to these issues is quite different from that of designing new constructions from scratch, and this is also confirmed by the presence of ad hoc parts of the building codes devoted to the interventions on existing buildings, as in the Italian Building Code [
1,
2], and in the CEN [
3].
Regardless of the final objective of the interventions on existing buildings, the first step is the acquisition of an adequate level of knowledge of the structure, which can be conducted through the analysis of available documentation and through a detailed study that involves experimental tests. However, even if thorough documentation is available, the uncertainties associated with the mechanical properties of the materials still remain, because these can be strongly influenced by the construction process itself, degradation that occurred during the service life, etc.
In other cases, uncertainties about the actual strength of the construction materials arise because of additional factors, such as lack of documentation, numerous previous interventions during the service life and environmental events. These uncertainties significantly affect the assessment of the safety level of the structure.
The adoption of in-situ investigations to assess the strength of construction materials is highly recommended, particularly in the case of concrete structures, as in many cases it has been found that design specifications are not reliable for an accurate estimation of their safety level [
4,
5,
6].
However, direct determination of the material strength requires experimental tests whereby samples of the material are loaded to failure. This approach is especially recommended for reinforced concrete (r.c.) structures because the concrete strength is highly influenced by: the curing phase; the casting procedure, which may produce aggregate segregation and affect homogeneity; subsequent degradation processes depending on environmental exposure conditions; loading conditions and types of stress to which concrete is subjected to; building imperfections; damage, etc. Hence, building codes suggest extracting specimens—typically, cylindrical concrete cores—which are then cut and have their surface prepared for uniaxial compression tests.
The disadvantages of this approach are mainly associated with the characteristics of the test, which requires damaging the structural integrity. Furthermore, before drilling and extracting the concrete cores, it is necessary to use specific monitoring tools to locate the reinforcing bars and avoid their accidental cutting during the core exaction. Finally, it is also necessary to repair the investigated element. In some instances, e.g., in already damaged structures, it may be appropriate to limit the number of tested elements for stability reasons.
Moreover, the difficulty in selecting the structural element to be tested is also connected to the variability of concrete properties in the whole structure, due to the peculiarities of such a construction material, which may potentially have an impact on the accuracy of the experimental measurement of the concrete compressive strength. Indeed, in practical applications, the criteria for choosing the points on which to perform the tests are strictly related to subjective considerations and the experience of the technician, and thus, may represent a limit of the procedure. In [
7] the authors highlight that the concrete strength exhibits a wide variability within a single building.
To overcome these limits, non-destructive tests have been proposed that allow the estimation of the concrete compressive strength indirectly, i.e., starting from the measurement of another property that is strictly connected to the targeted strength. These tests also have the advantage of allowing tests to be extended to a large number of elements, as they require limited preparatory work, reduced testing times and less expensive equipment [
8,
9,
10,
11].
One of the most adopted procedures is the Rebound Hammer (RH) test which proceeds by impacting a spring driven hammer mass on the surface of the investigated r.c. element and measuring the rebound of the hammer mass. Indeed, the rebound depends on the energy absorbed by the impacted material which may be linked to its strength [
12].
It is worth noting that to guarantee reliable measurements, the surface of the investigated element must be smooth. Therefore, to this aim, the surface is prepared by means of an abrasive stone in order to minimize the effects of smoothness and carbonation of the impacted surface on the measurements. Moreover, the technician must control that the mass impacts perpendicularly to the surface and, to improve the accuracy, several readings must be acquired by repeating the measure at each point of a grid fixed on the chosen element.
However, as with any non-destructive test, even if the correct procedure is followed, there is still a number of factors affecting the rebound index (see [
13,
14,
15]).
The effects of variability of the concrete strength on non-destructive tests results have been pointed out for several structural typologies and environmental exposures: in [
16] the authors analyzed and discussed the results of an extensive experimental campaign on a viaduct, while in [
17] the authors analyzed the data acquired on a huge number of buildings by means of the Sonreb method. In the latter work, the effects on the structural safety related to the assessment of concrete strength are investigated by considering different analytical formulations of the laws that correlated the concrete strength to the results derived from Sonreb tests and by proposing new empirical laws.
In addition, the reliability of the estimated concrete compressive strength depends on the conversion model that correlates the measured rebound index with it.
Consequently, the main challenge is the calibration of the conversion model to estimate the compressive strength of concrete.
As previously cited, many factors influence concrete strength and are mostly related to the execution phase. This variability is well known and accepted in practical applications, as the influence of some factors may be canceled or significantly decreased only by adopting the precast process. Thus, usually, the aim of the tests for the assessment of concrete strength is not to acquire a local evaluation of this parameter, but to establish a value of the concrete strength that may lead to an accurate evaluation of the structural response of the investigated building to any kind of actions. For this purpose, the present study aims to assess this strength value. It should be noted that the aforementioned variability does not raise significant concerns when the sought mechanical property is directly measured, as it occurs when it is possible to drill cores and perform compression tests. However, when the choice is made to proceed by means of rebound hammer tests, this variability has an impact on the measurements, which cannot be precisely quantified. In fact, it has an effect on the variability of the coefficients of the conversion model that correlates the rebound index to the concrete strength. Therefore, a topic is related to the analysis of the variation of the coefficients of the conversion model and, thus, the accuracy of the assessed strength.
Many Authors have underlined that in practical applications the concrete strength varies due to uneven maturation of concrete, effects of corrosion of the steel bars, and vibration puddling, which may be responsible for non-uniform distribution of the aggregates, and temperature during the curing phase, etc. To limit the influence of these factors in the following analysis, it has been chosen to perform the analysis on a single building.
Another topic is the choice of the analytical formulation that correlates the concrete strength and rebound index and, in detail, if by varying the adopted formulation, the range of variability of the corresponding coefficients varies. Indeed, the influencing factors on the rebound index make it quite difficult to define a conversion model which can be applied to all testing conditions, as has been pointed out by several authors [
9,
15].
This paper deals with these topics by analyzing the data acquired during an experimental campaign in an existing building on which both compression tests on drilled cores and rebound hammer tests have been performed. The acquired data have been assembled in a huge number of combinations, as will be described later in
Section 2, in this way the data refer to the same building, have been measured in the same experimental conditions and with the same instruments and technicians; therefore, the effects of some factors, such as age, humidity, etc., may be considered equal for all the considered combinations, thus, the variations of coefficients of the conversions models are only related to other factors, i.e., those that usually affect the variability of the concrete strength and the structural response. The main aim is to verify the variability of these coefficients of the conversion model for different choices of its analytical formulation and to establish a relationship that correlates these coefficients. To this end, all the collected combinations of data have been utilized to calibrate conversion models, in this way, even if the data have been acquired for the same structure, it is verified that if the number and location of the investigated elements change, also the coefficients of the conversion model vary even if they are related to the same structure. In the present paper, several conversion models are calibrated and empirical regression laws between the coefficients of the conversion models are determined. In detail, the relationships between the coefficients of the conversion model have been established by varying the chosen analytical formulation, the measurement positions, the number of points to be tested, the coefficients of variation of the concrete strength and the rebound index. The results show that for all the investigated conversion models, a different law between their coefficients can be evaluated, which is strictly linked to the adopted conversion model and is independent of the coefficients of variation of the concrete strength and the rebound index.
2. Experimental Data
In the present paper, the assessment of the in situ compressive strengths of the concrete structural elements of an existing building is discussed. In [
7] the authors showed that the concrete strength may alter from one floor level to another and/or even from one structural element to another of the same typology within the same structure. In the case of using conventional destructive testing to evaluate existing conventional buildings, the extraction of concrete cores and the subsequent calibration of empirical models may be difficult because, on the one hand, a high value for the coefficient of variation of the concrete strength (
Covfc) may be recorded, and on the other hand, extending the destructive tests to a sufficient number of locations may be difficult or even impossible due to economic and logistic reasons. Therefore, to acquire detailed information on the structure, the use of non-destructive tests (NDTs) is quite useful.
This is also confirmed by the experimental tests here investigated which have been conducted on a building located in Bari (Italy). The building was built in the 1970s and it is composed of five floors. The experimental tests have been performed on some walls and repeated on the same walls on each floor; the walls have been chosen, as often happens in practical applications, based on some logistic constraints mainly due to the possibility of drilling a core on each investigated wall. Although the transversal section of the tested walls varies on each floor, there is one dimension that remains constant and equal at 35 cm, which ultimately determined the direction of the performed tests. The structure does not manifest cracks or damage.
The rebound tests have been performed by means of a Schmidt concrete test hammer type N, oriented orthogonally to the investigated elements and thus laying in a horizontal direction, in accordance with the manufacturer’s instructions. The testing method consists in provoking the impact of a standardized mass against the surface of the structural element under testing and in measuring the height of the rebound, the measurement is expressed in terms of the percentage of the rebound height compared to the distance traveled by the moving mass between the instant it is released and when it hits the concrete surface, this percentage is called the rebound index and is measured on a scale numbered from 10 to 100. It is worth noting that the presence of internal voids, cracks, aggregates, etc., in correspondence with the point on which the hammer is positioned for the execution of the test, may be responsible for the overestimation or underestimation of the concrete strength. Therefore, the rebound index related to each investigated element has been evaluated as the mean value of the measurements acquired in the nine points of a grid fixed upon the element’s surface, in this way the impact of possible “local” conditions on the assessed strength may be attenuated. The RH tests have been performed in a single day, to reduce the influence of environmental conditions on the acquired measurements. The surface had been rubbed off with an abrasive stone before testing, in order to guarantee the smoothness of the test surface and to minimize the influence of carbonatation. Moreover, the points of impact have been chosen as far as possible from edges and corners, and the tests have been performed in dry-air conditions inside the building.
After the rebound hammer tests, a core has been drilled on each investigated element, and subjected in a laboratory to compression tests, in accordance with prescriptions of [
18,
19]. In detail, the cylindrical cores have been extracted with a diameter of 100 mm and a ratio height/diameter equal to 2; afterward, the load-bearing surfaces of the cores have been prepared to improve the contact with the loading machine and ensure uniaxial compression conditions. In detail, 28 cores have been drilled and subjected to compression laboratory tests. In
Section 3 the calibration procedure of the conversion models based on the cited experimental data is described.
The mean value of the compression strength evaluated on the 28 drilled cores is equal to 25.26 MPa, the standard deviation is 3.4 MPa, thus, the coefficient of variation of the core compressive strength is equal to 0.13.
Regarding the RH tests, as has been previously described, the rebound index has been measured on each one of the 28 investigated walls. It has been evaluated that the mean value of the 28 measured rebound indexes is equal to 42.55 and the standard deviation is 1.9, thus, the coefficient of variation of the rebound index is equal to 0.04, showing that the dispersion of the acquired rebound indexes around the mean value is quite low compared to that of the core strength. The coefficient of variation and the standard deviation of the rebound index, which are representative of the repeatability of the test results, exhibit rather low values compared to the usual accepted ones (see [
9,
20]) and make the author confident about the representativeness of the acquired rebound values.
Indeed, if a Gaussian distribution is assumed for the rebound measurements and the adopted values are assumed equal to the average value of the nine readings, the obtained value of the coefficient of variation [
9] enables the true measurement to be estimated with an accuracy level lower than 6% and with a 95% confidence level.
The high value of the coefficient of variation of core strength highlights the high variability of the measurements. Based on this observation, it is possible to create a database of several possible combinations of the available data, for each of which a different value of the coefficient of variation of concrete strength would be expected. This approach enables the impact of the chosen points on the calibration procedure of the conversion model for the same building to be investigated. It would also shed light on the advantages and limitations of the RH tests with reference to ordinary practical applications, where the number of extracted cores may be highly limited by economic and logistic reasons. The objective is to verify the influence of the properties of the dataset on the calibration procedure also varying the chosen conversion model.
Thus, the datasets here are considered to have been obtained by collecting a huge number of combinations of the available data, which have been obtained by varying the number of experimental results that compose the dataset considered in the calibration procedure.
It is worth noting that the core strength
must be converted in the in-situ concrete strength
in order to take into account the influence of the height/diameter ratio of the core. For the present investigations, the ratio is equal to 2, the core diameter is 100 mm and a correction term, which considers the damage due to the drilling procedure, in accordance with [
21] and the in-situ concrete strength, is assessed in accordance with the following relationship:
3. Conversion Models and Calibration Procedures
The reliability of the assessed concrete strength depends on the assumption of a relationship between the acquired rebound number and the actual concrete strength. The available codes [
12] suggest performing a calibration procedure of the conversion model that correlates the RH measurement with the strength of concrete cores extracted at the same position of the RH tests.
Many empirical formulations have been proposed which make use of several models and a high number of coefficients for the same model. The main empirical models are the power law [
9]:
the linear law [
22,
23,
24]:
the exponential law [
9]:
and the polynomial law [
25,
26,
27]:
Several authors proposed favorable values for the coefficients of Equations (2)–(5) based on the results of experimental studies, which were performed in many cases in laboratory conditions or in existing buildings. However, the proposed values arguably vary in wide ranges and a conversion model suitable for any kind of application has not yet been successfully established.
Indeed, to improve the accuracy of the adopted model, a calibration procedure should be performed by minimizing the estimation error of the concrete strength on a set of in-situ strength data acquired by means of compression tests on drilled cores . In the present paper, the laws of Equations (3)–(5) are investigated.
In detail, the coefficients of the linear empirical law are obtained by minimizing the following mean square error:
where
is the in-situ strength evaluated on the basis of the strength of the
i-th core,
is the rebound index registered at the same position of the
i-th core and
m is the number of drilled cores considered in the calibration procedure.
The exponential law may be written using logarithmic notation as follows:
where the coefficients are calibrated based on the minimization procedure of the following mean square error:
In the case of the polynomial law the mean square error can be written as:
The influencing factors on the rebound index make it quite difficult to define a conversion model which can be applied to all testing conditions, as has been reported by several authors [
9,
15]. The present work aims to highlight that, even if the same experimental conditions are ensured, the effects of some influencing factors are minimized and variability in the coefficients of conversion models still remains, which can be predicted by means of ad hoc empirical laws that have been proposed for different analytical formulations of the conversion model.
In the experimental campaign examined here, a significant number of cores have been extracted with the final aim of acquiring a deep knowledge of the concrete compressive strength. However, in the present paper, in order to consider the general practical conditions, which are usually characterized by a limited number of drilled cores due to logistic and economic reasons, the available N data have not been utilized to calibrate a single empirical conversion model. The data have been rearranged in order to build several datasets of possible results of the experimental investigations, which have been utilized to calibrate a huge number of conversion models.
In detail, the data acquired during the experimental tests have been utilized to calibrate the coefficients of three different analytical formulations, i.e., the linear law, the exponential law and the polynomial law. The data have been arranged in pairs of values: the first referring to in-situ strength, evaluated according to Equation (1) by inserting the value of core strength for the considered wall, and the second one related to the rebound index measured for the same wall on which the core was drilled. These 28 data have been combined to define a wide database, which was built as follows: firstly, the number m (m < 28) of pairs of values was set and several combinations of the available 28 pairs of values are defined. In this way, each combination corresponds to a new possible experimental setup that does not consider all the effective investigated walls. Each defined combination is considered as the acquired data and utilized to calibrate the three laws in Equations (3)–(5), by minimizing Equations (6), (8) and (9), respectively.
To take into consideration the accuracy of each conversion model, the compressive strength derived through the conversion model and the in-situ compressive strength based on the destructive tests of the extracted cores (see Equation (1)) have been compared and the Root Mean Square Error (RMSE) has been evaluated for each conversion model as follows:
where
is the concrete strength related to the
i-th investigated point of the structure and assessed by means of the chosen empirical law.
4. Linear Law
Based on the procedure described in
Section 2 and
Section 3, more than 10
7 linear conversion models have been calibrated by varying the number
m and, thus, the combinations of data considered in the calibration process. It is worth noting that the coefficient of variation related both to the concrete strength and the rebound index, varies from each combination to another even if they are acquired on the same structure.
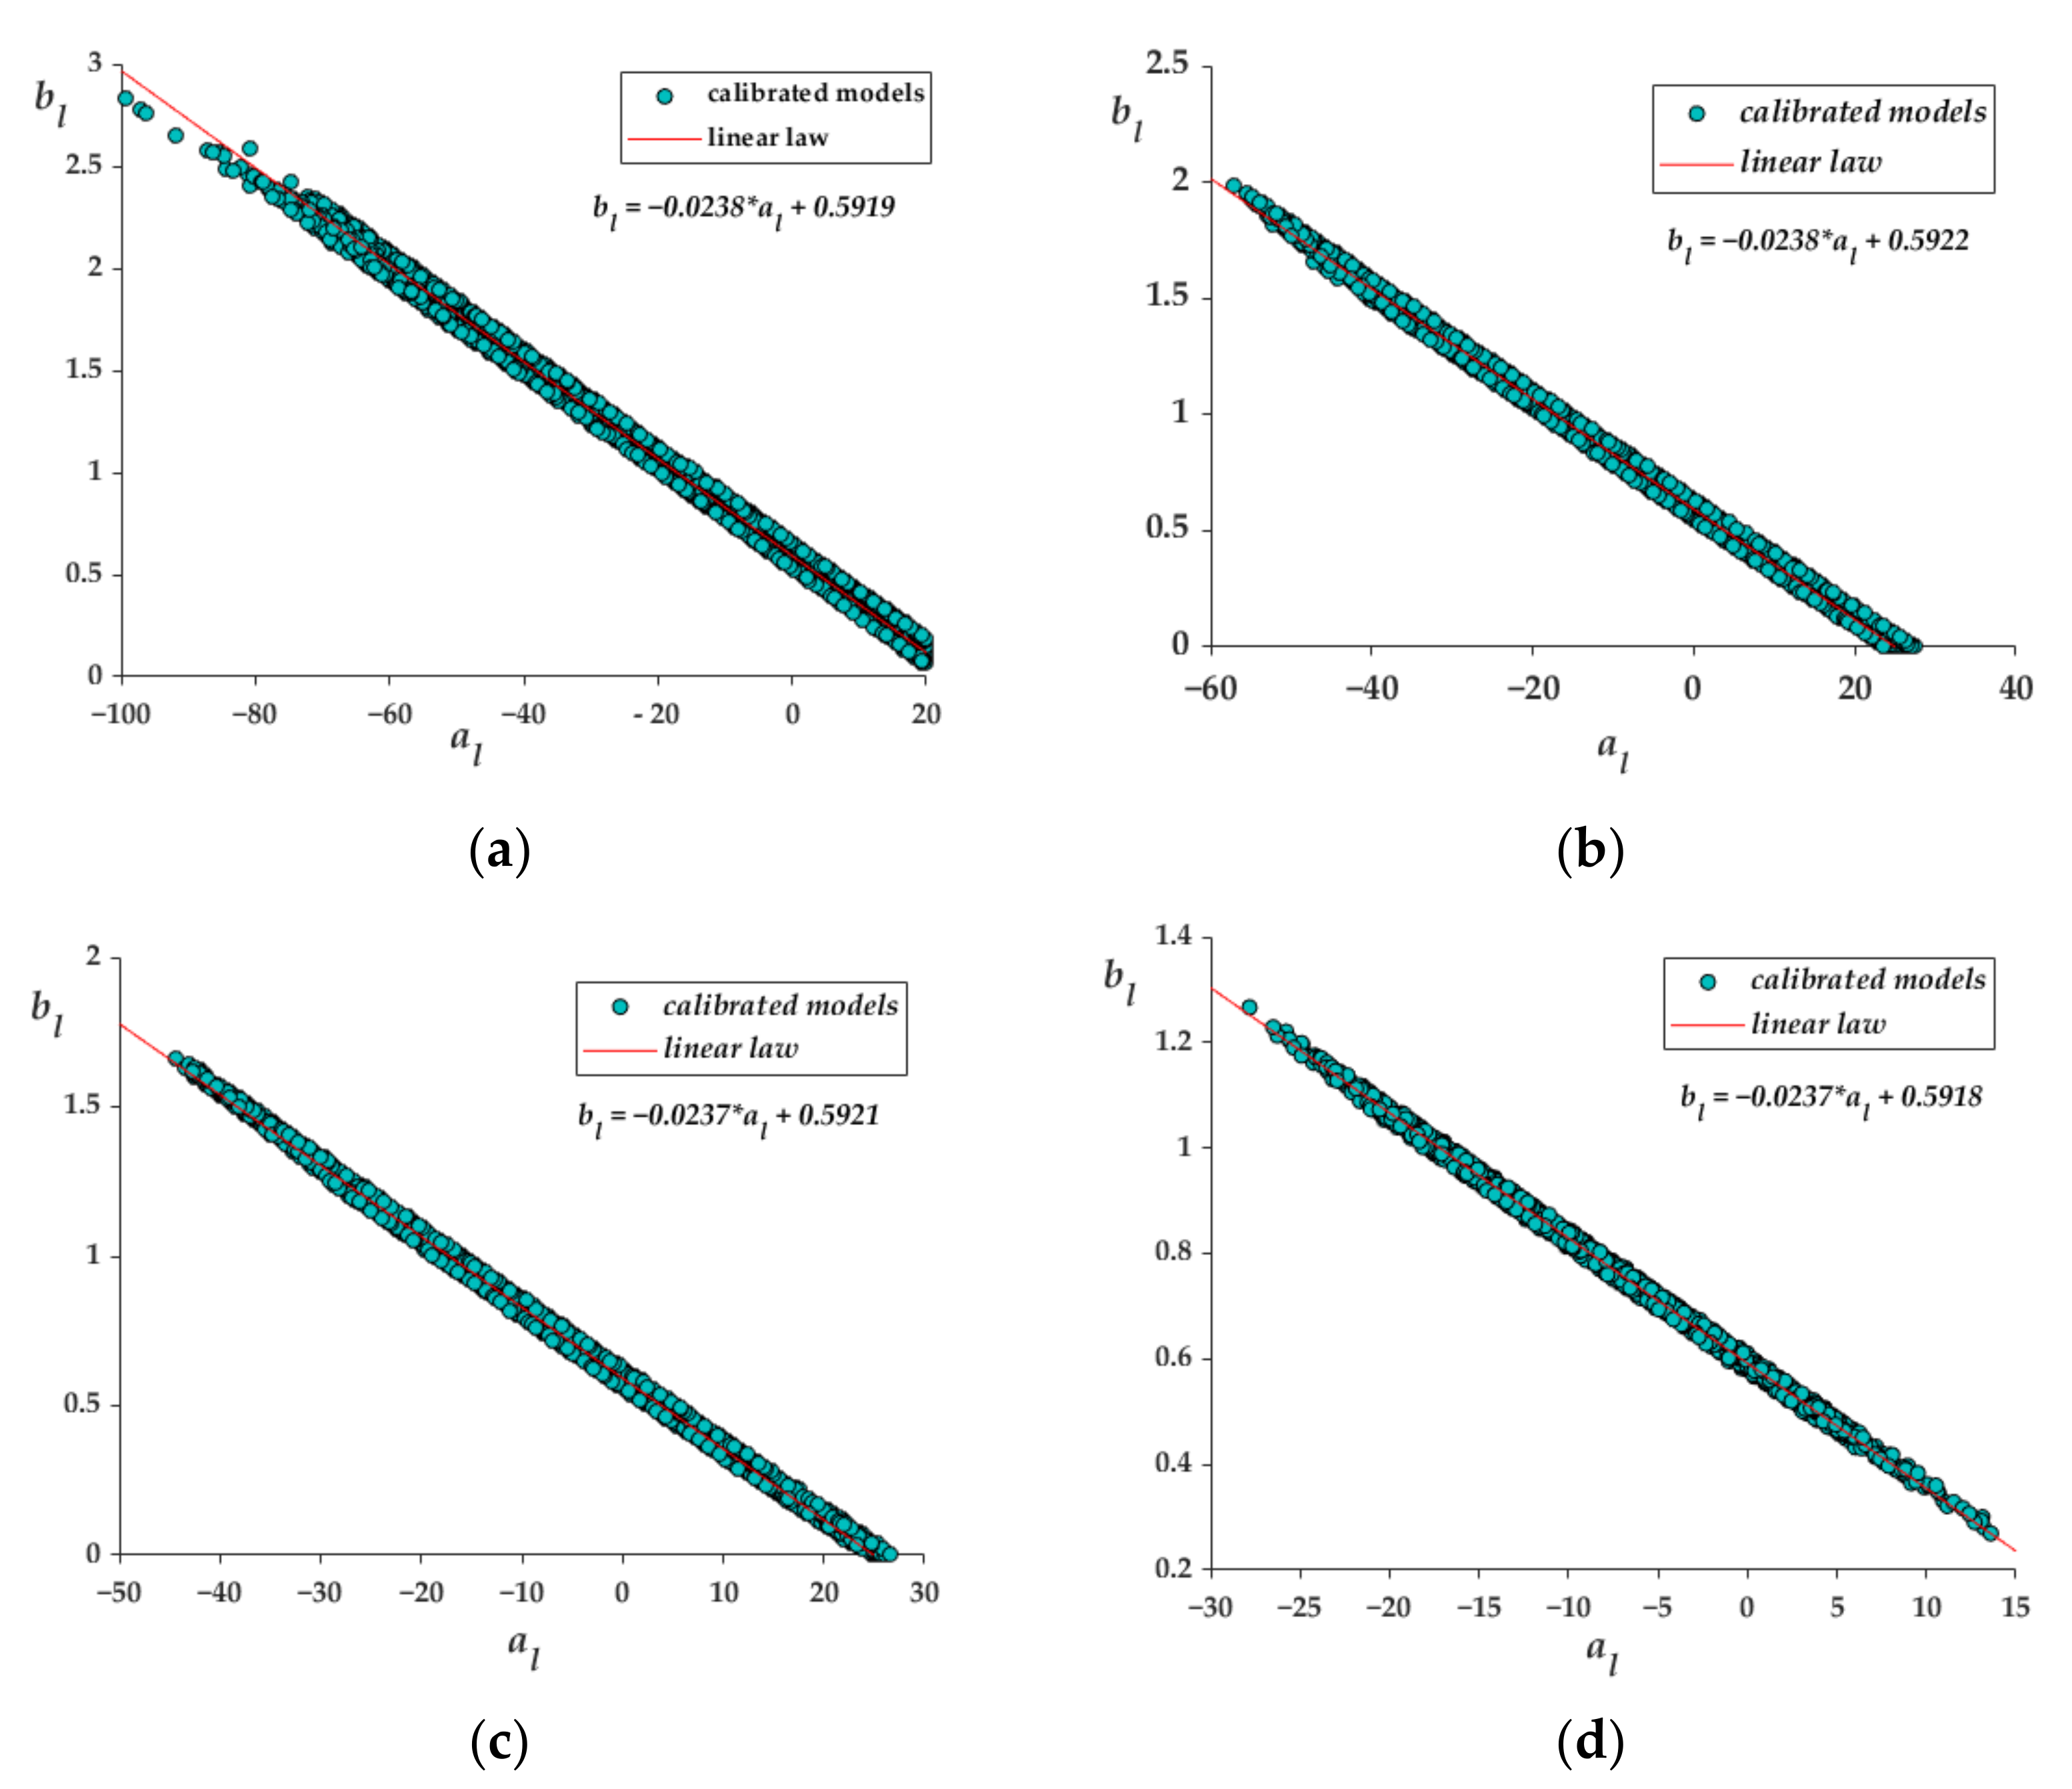
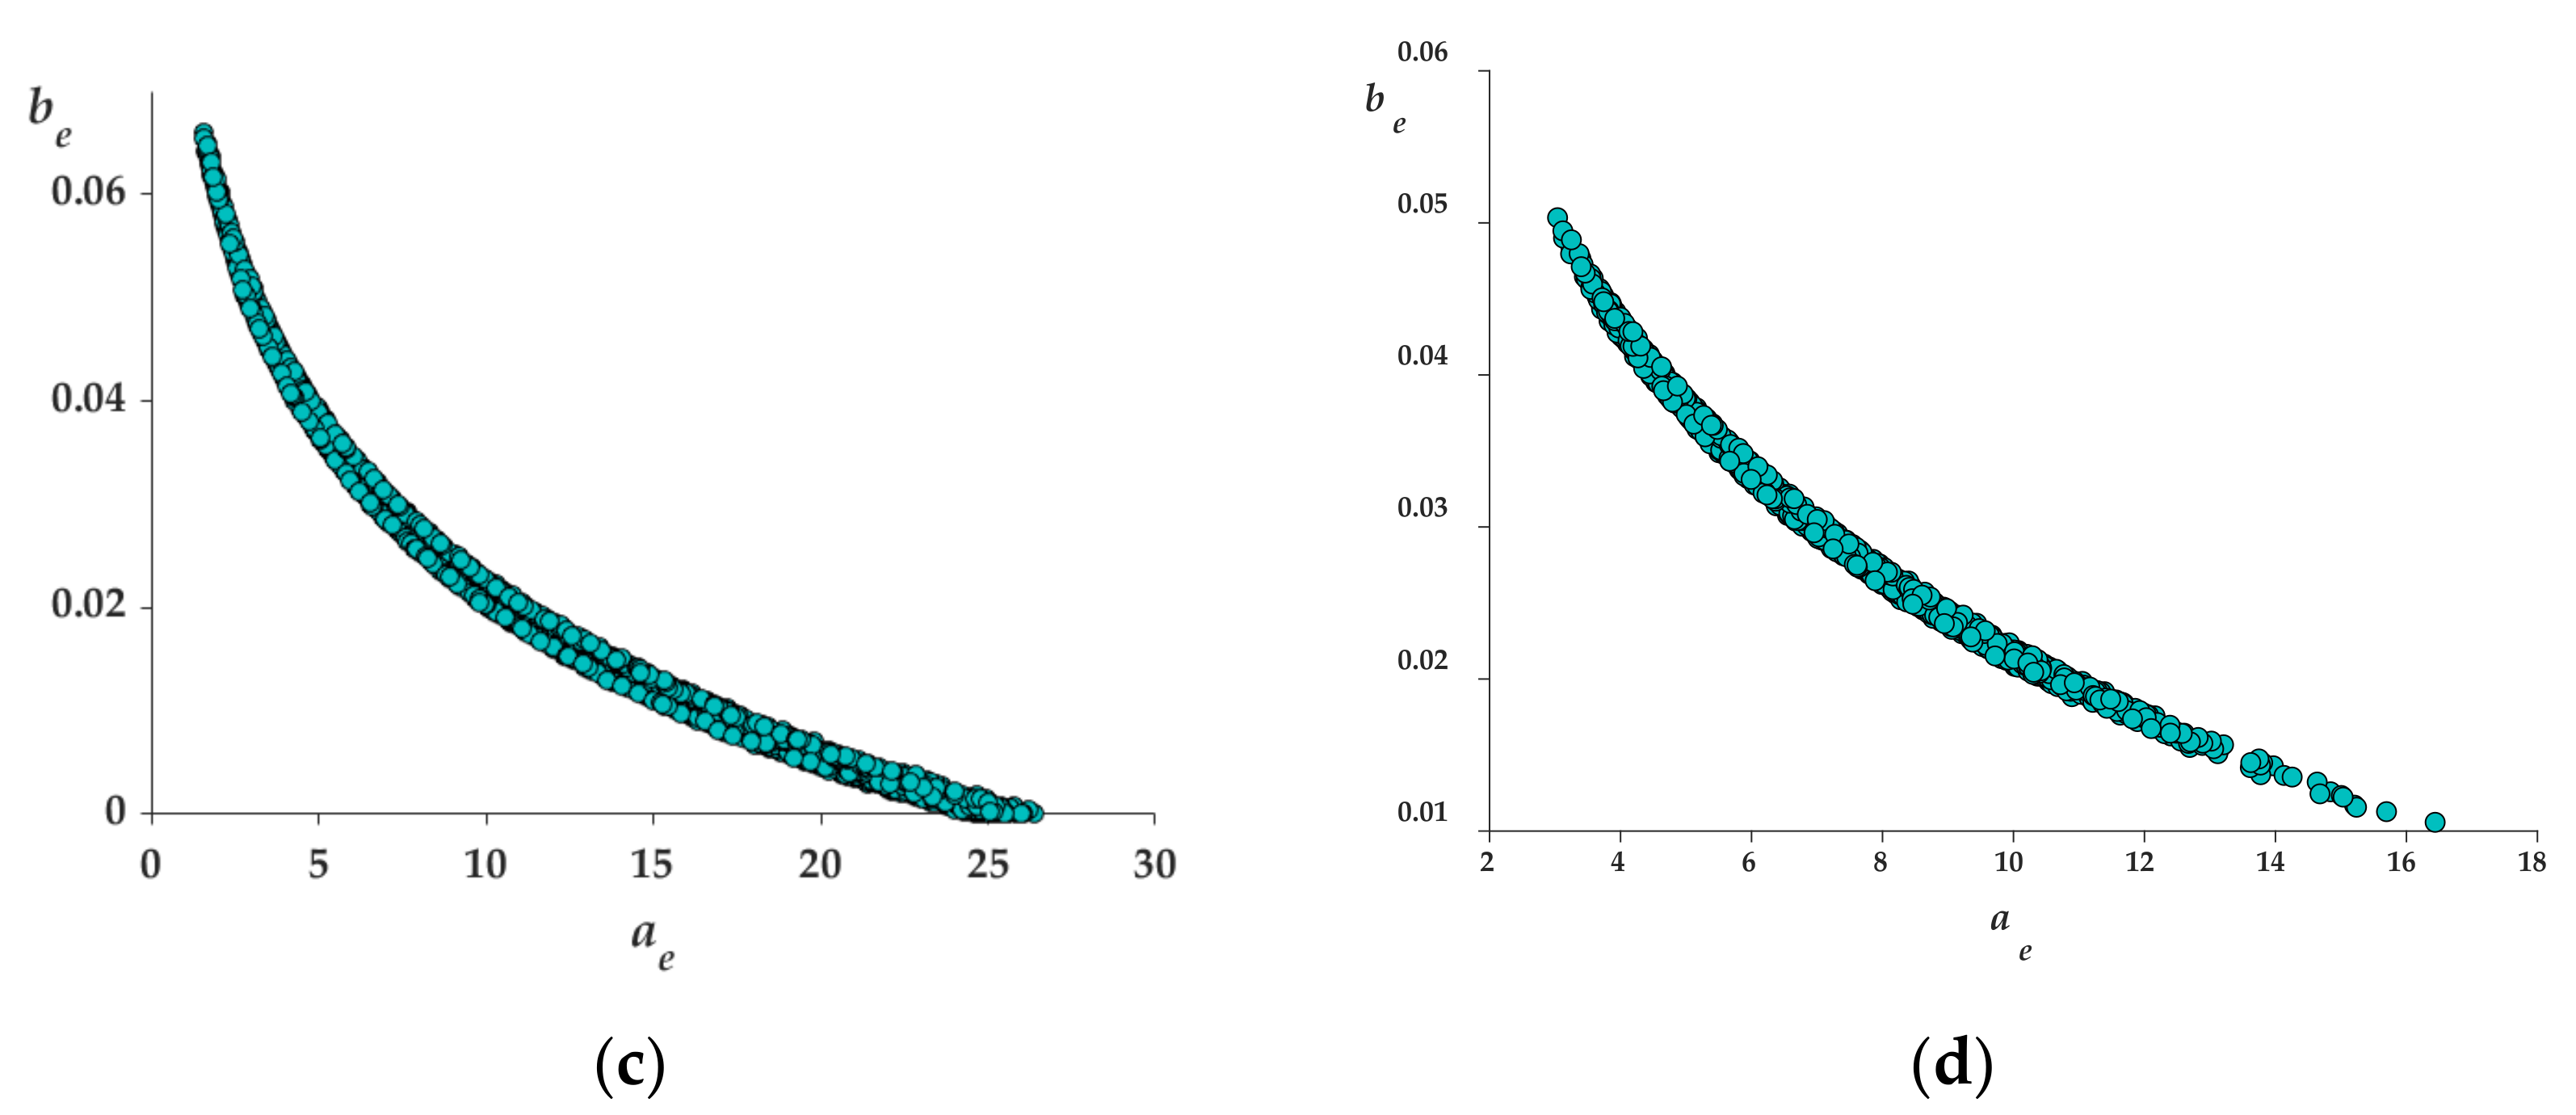
The main objective is to study the variation of the coefficients of the linear empirical law. Thus, in
Figure 1 the terms
bl and
al are plotted for several values of the number
m of data utilized for the calibration. Each point of the plots corresponds to a different combination of data and, thus, to a different linear model. It is worth mentioning that the values of the coefficients vary significantly. However, a clear relationship can be observed between such coefficients, which have been evaluated by means of a linear regression analysis. The results of such analyses have been reported in each plot with the related coefficient of determination. The values are similar and do not depend on the number
m of considered data. Moreover, considering other values of
m—whose results have not been plotted for the sake of brevity—it is possible to recognize the following relationships between the coefficients:
With a coefficient of determination equal to 0.9977, the excellent accuracy of the linear relationship in fitting the numerical values is shown.
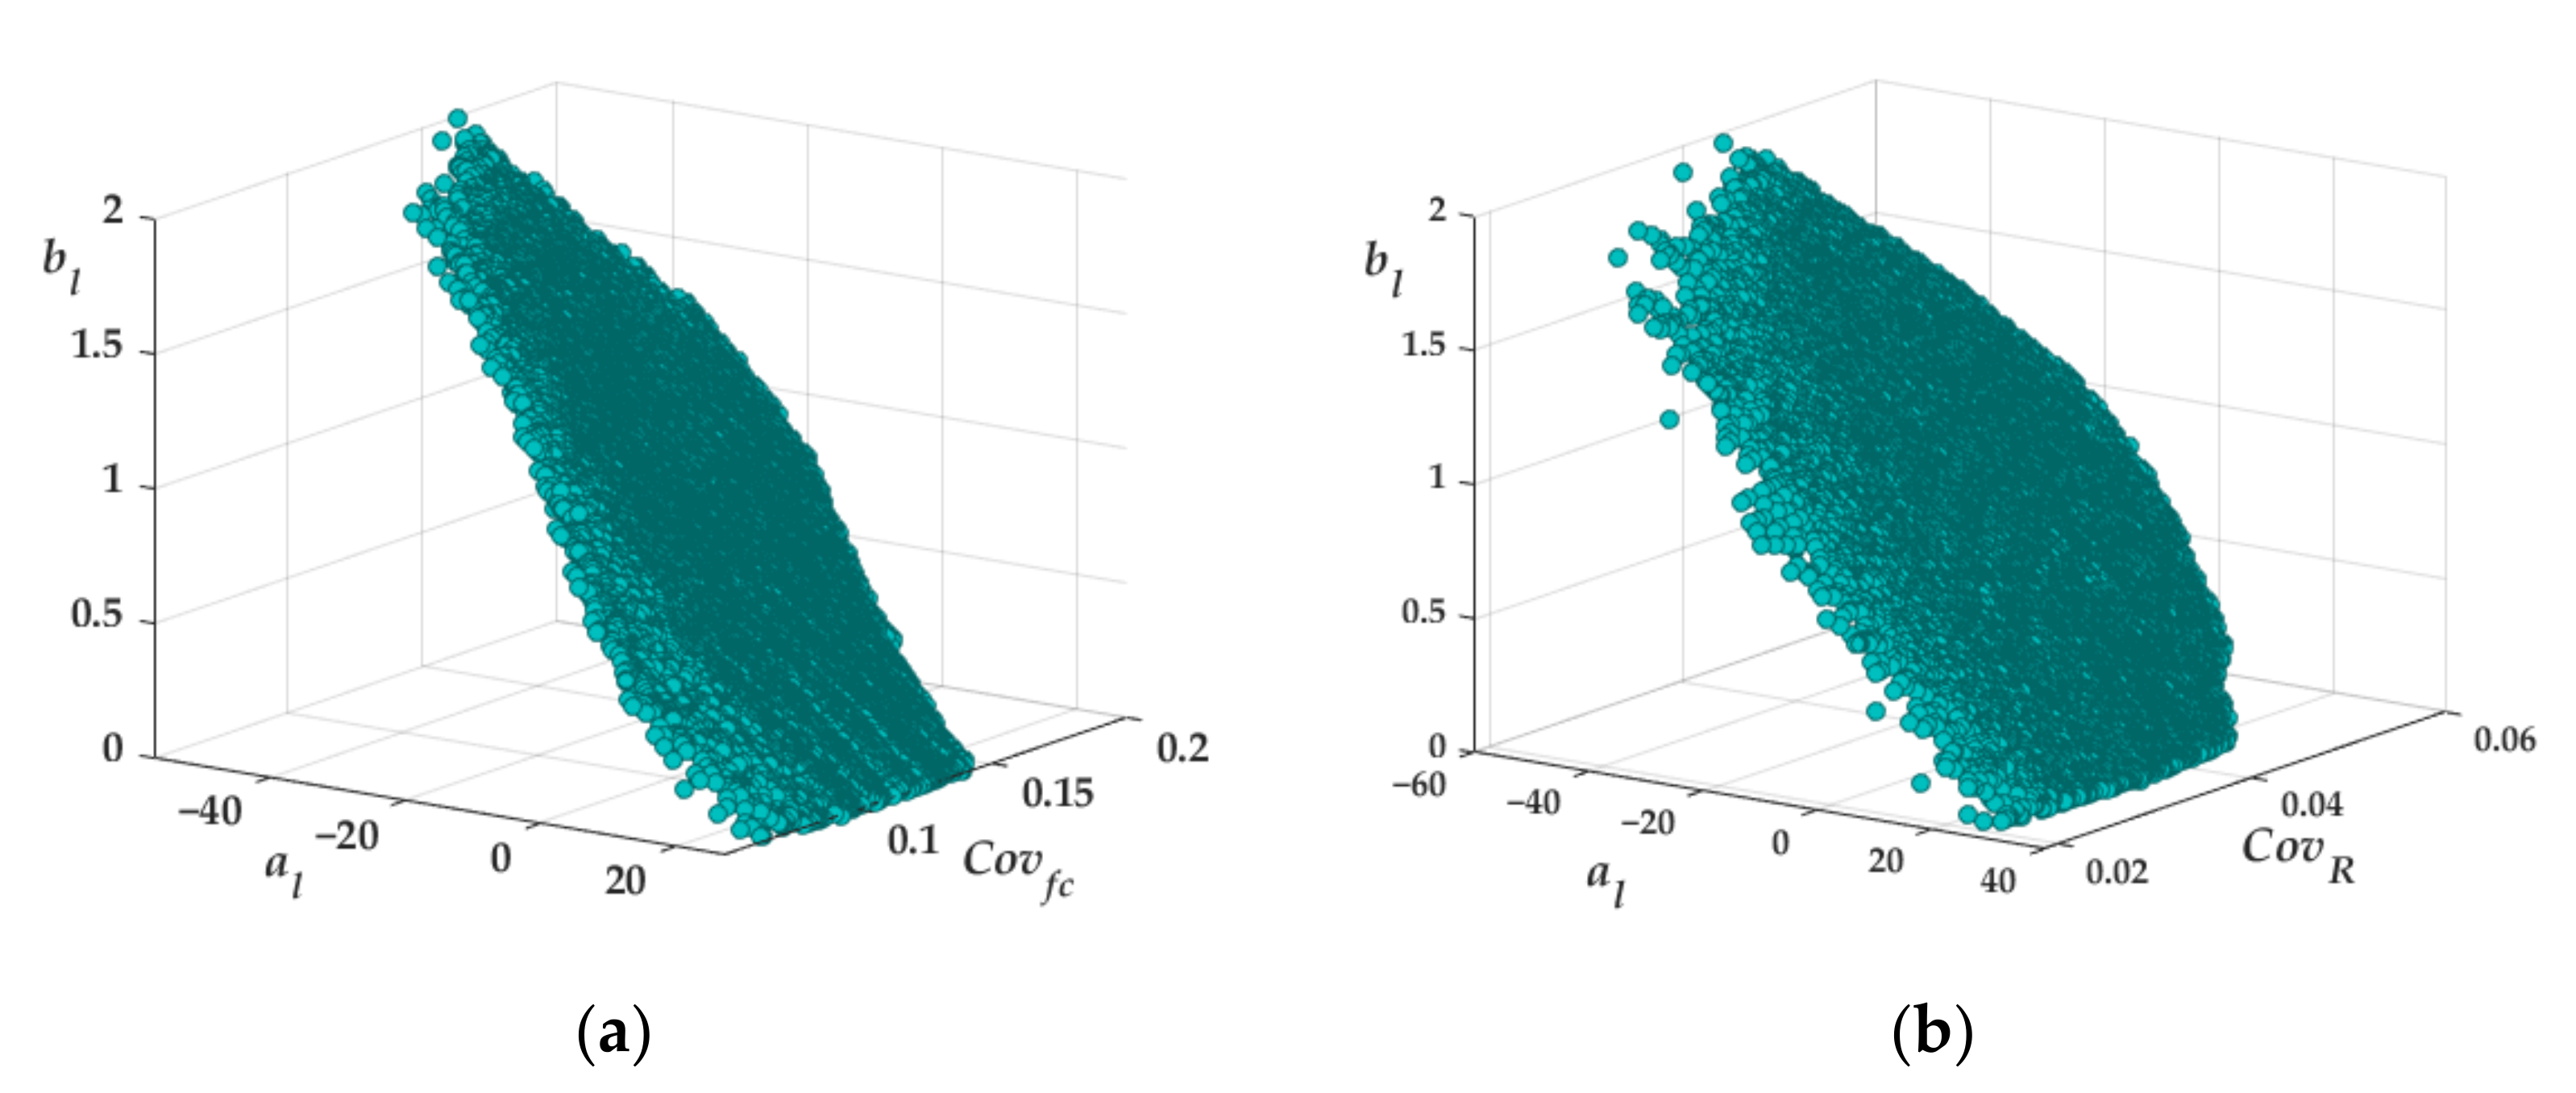
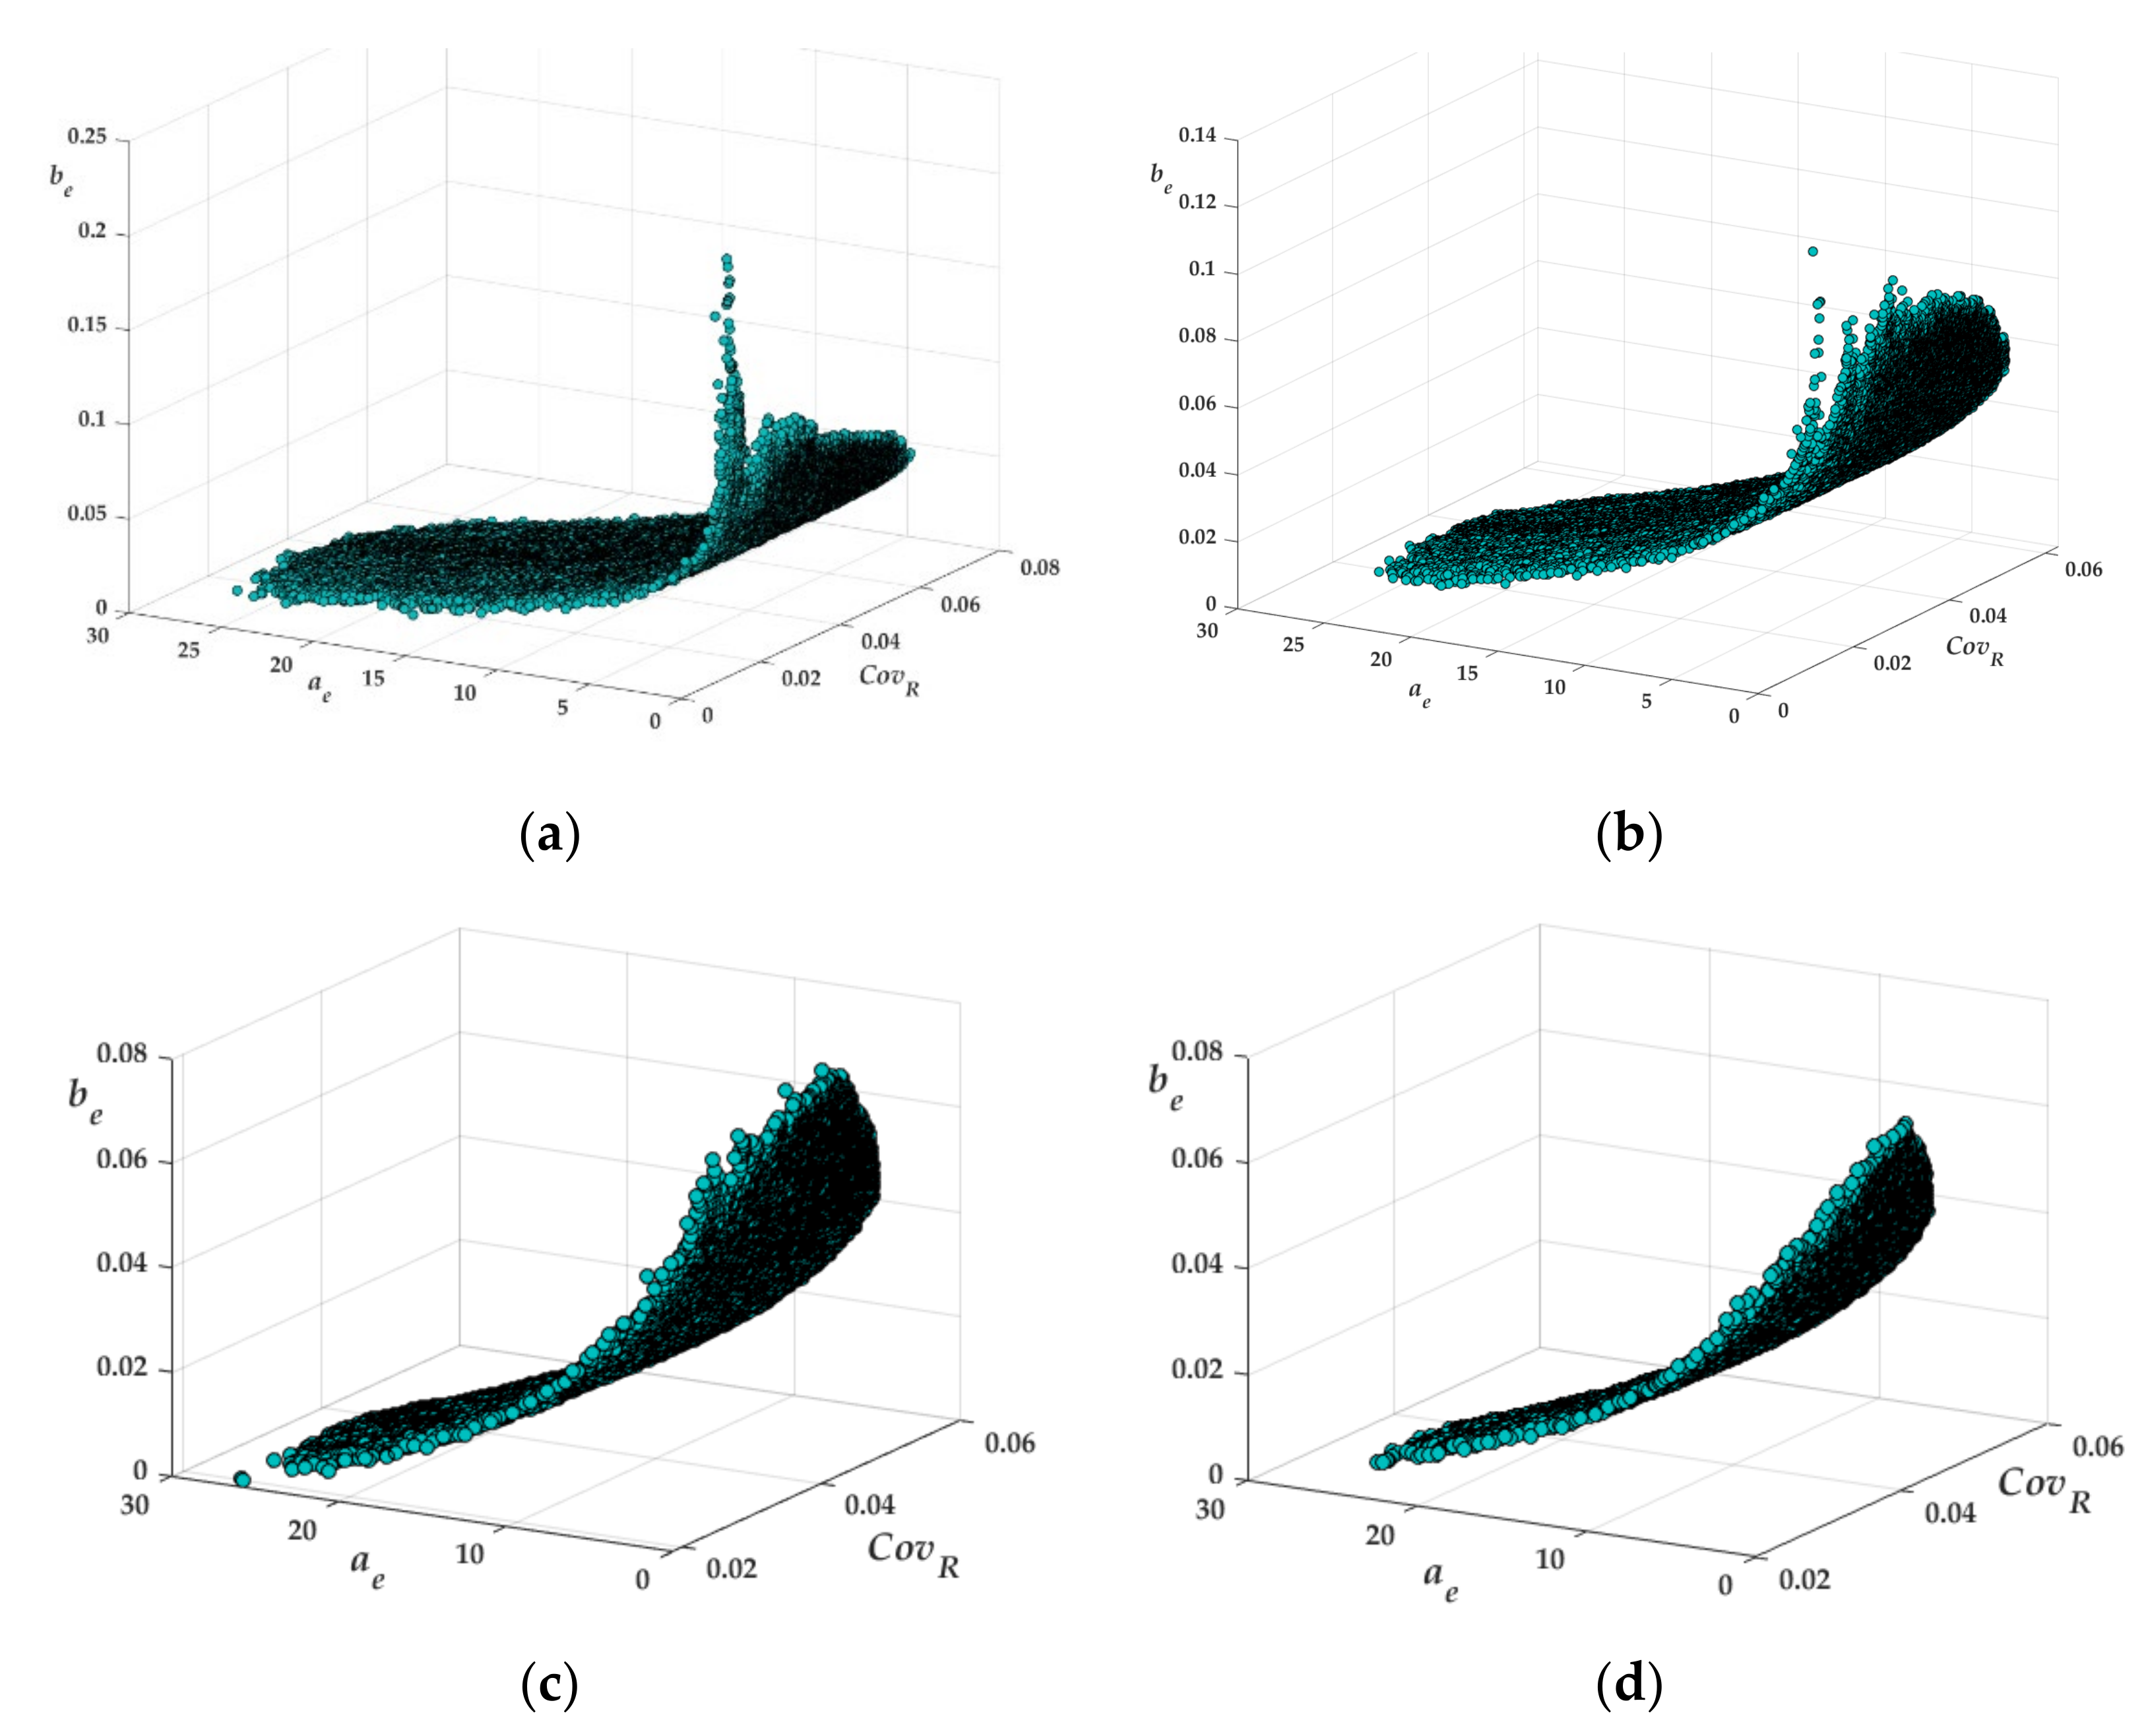
In
Figure 2 the relationship between the coefficients of the linear models has been plotted, also considering the values of the coefficient of variation of the concrete strength and of the rebound index evaluated for each combination of data composed by
m = 15 measurements. The plots show that for increasing values of the coefficient of variation of the concrete strength, the values of
tend to increase while the values of
decrease, but the relationship between such coefficients remains almost the same. Comparable behavior is observed for increasing values of the coefficient of variation of the rebound index, but the latter coefficient is characterized by a very low variation. The described trends are also detected for other values of
m but are not plotted for the sake of brevity.
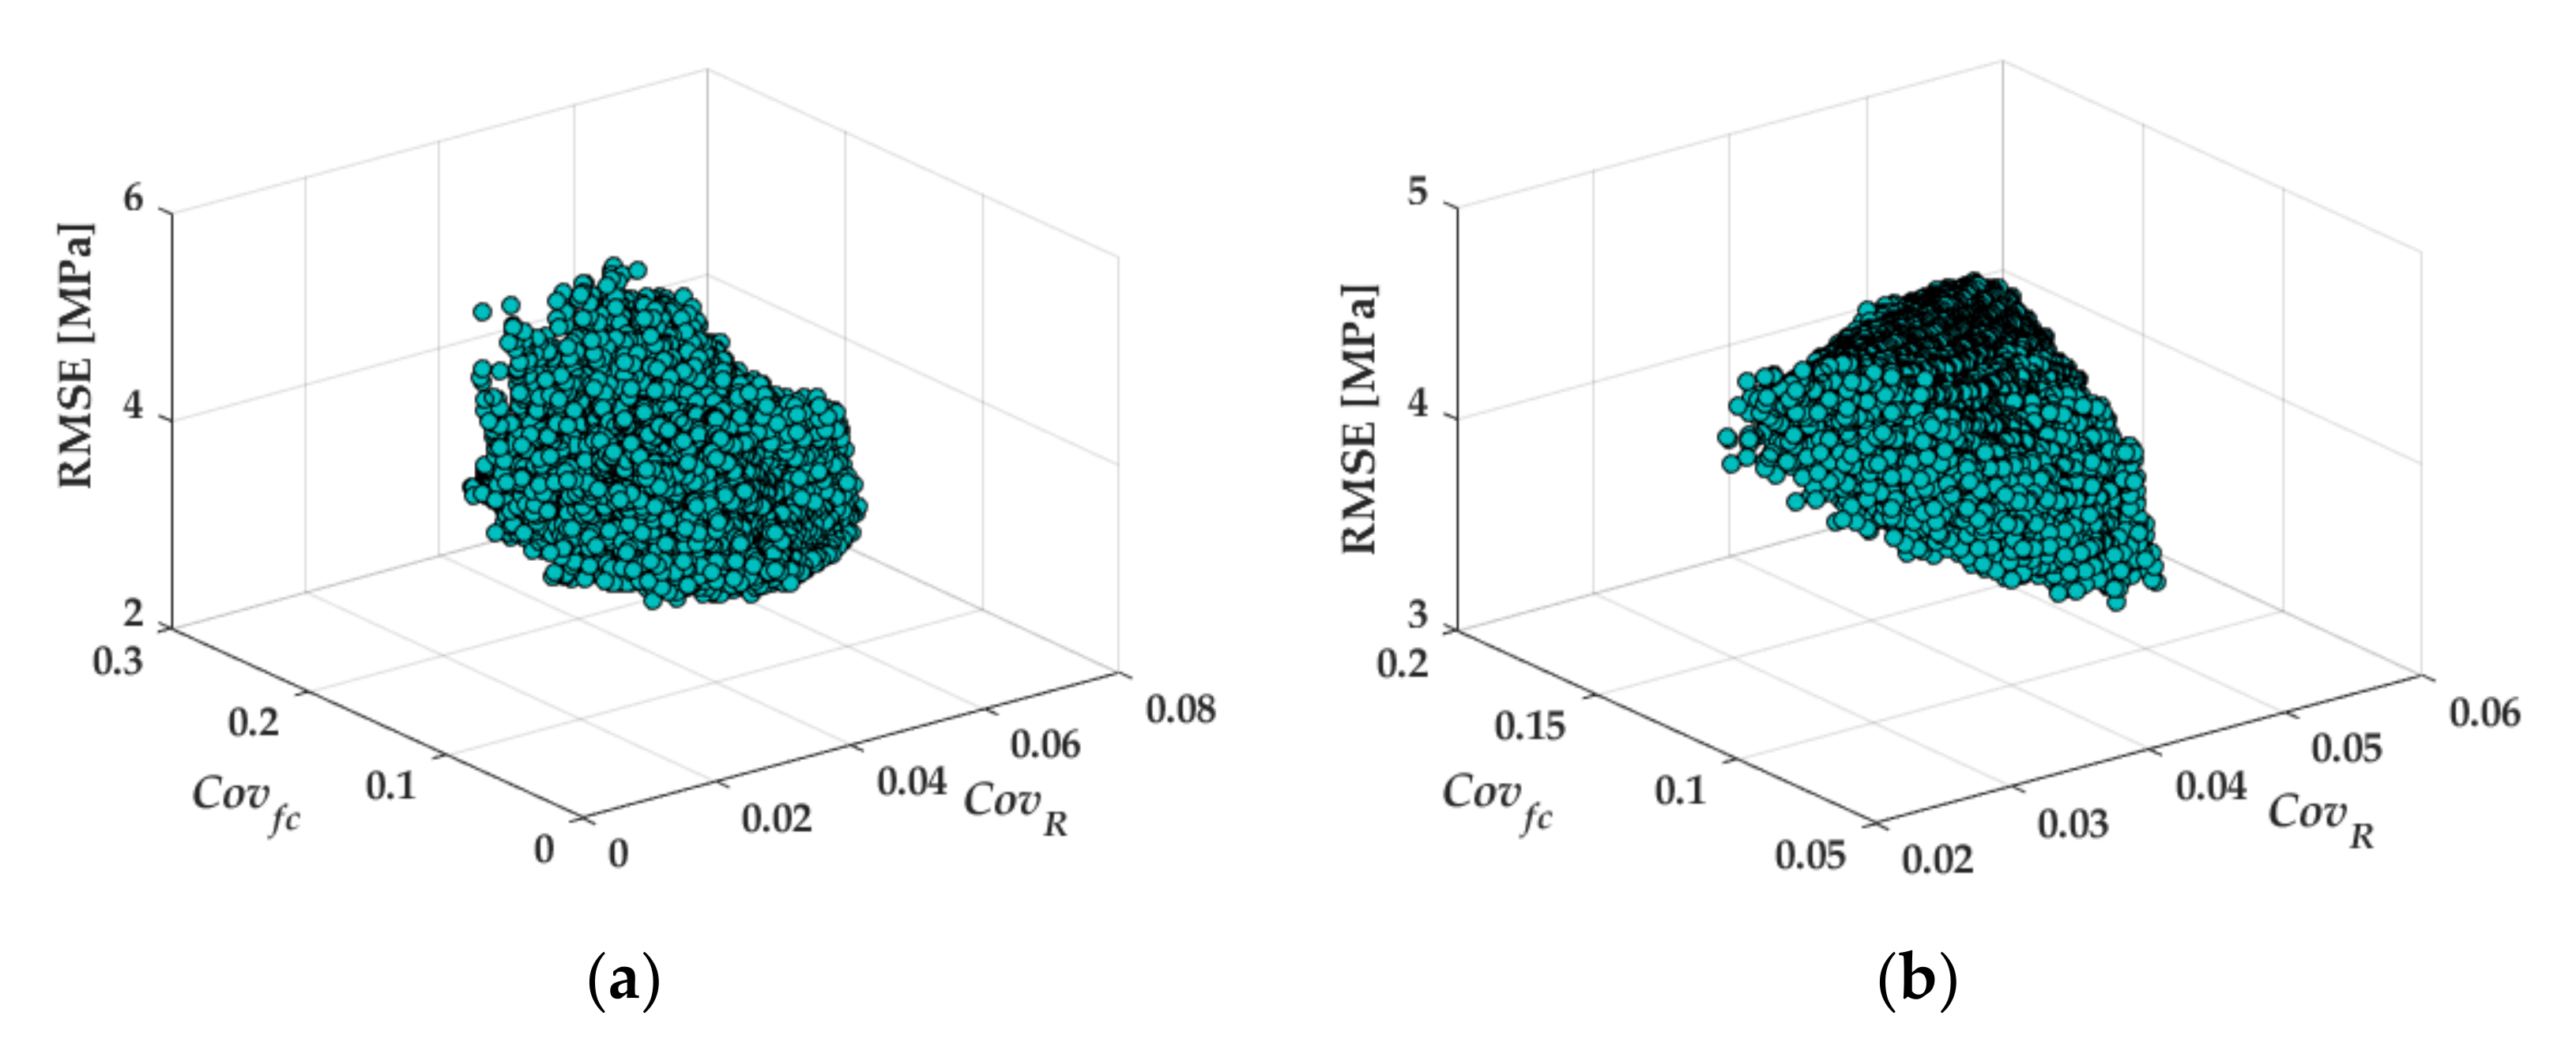
Figure 3 shows the variation of the RMSE with respect to the coefficient of variation of the concrete strength and of the rebound index for two different values of
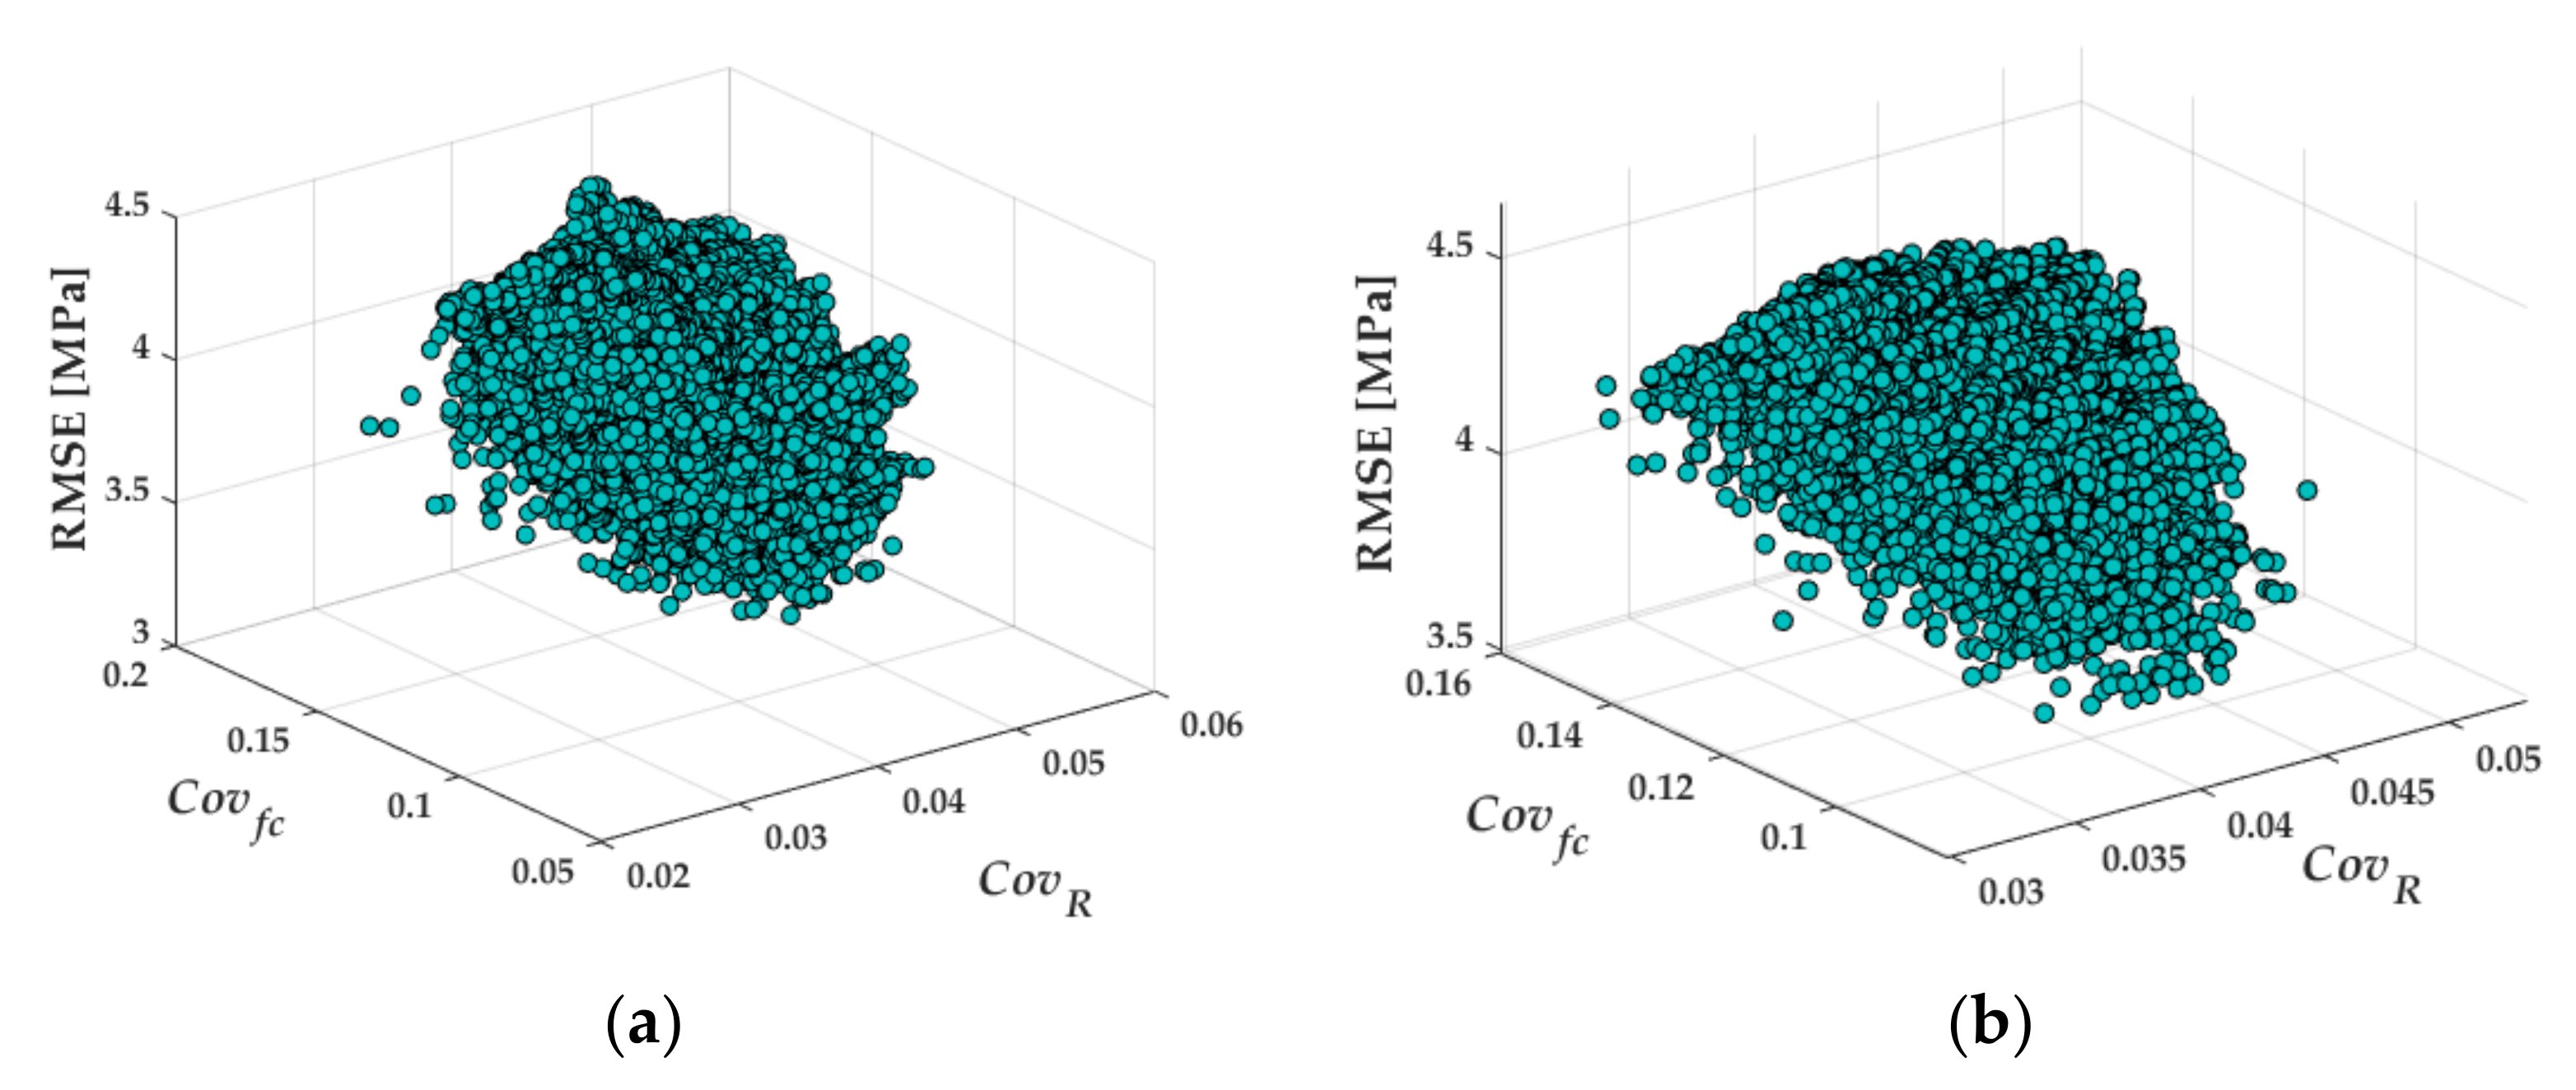
m. It is observed that even for a higher given value of
m, the range of variability of RMSE decreased, and it would not be concluded for the examined case that a direct relationship exists between the RMSE and the considered coefficients of variation.
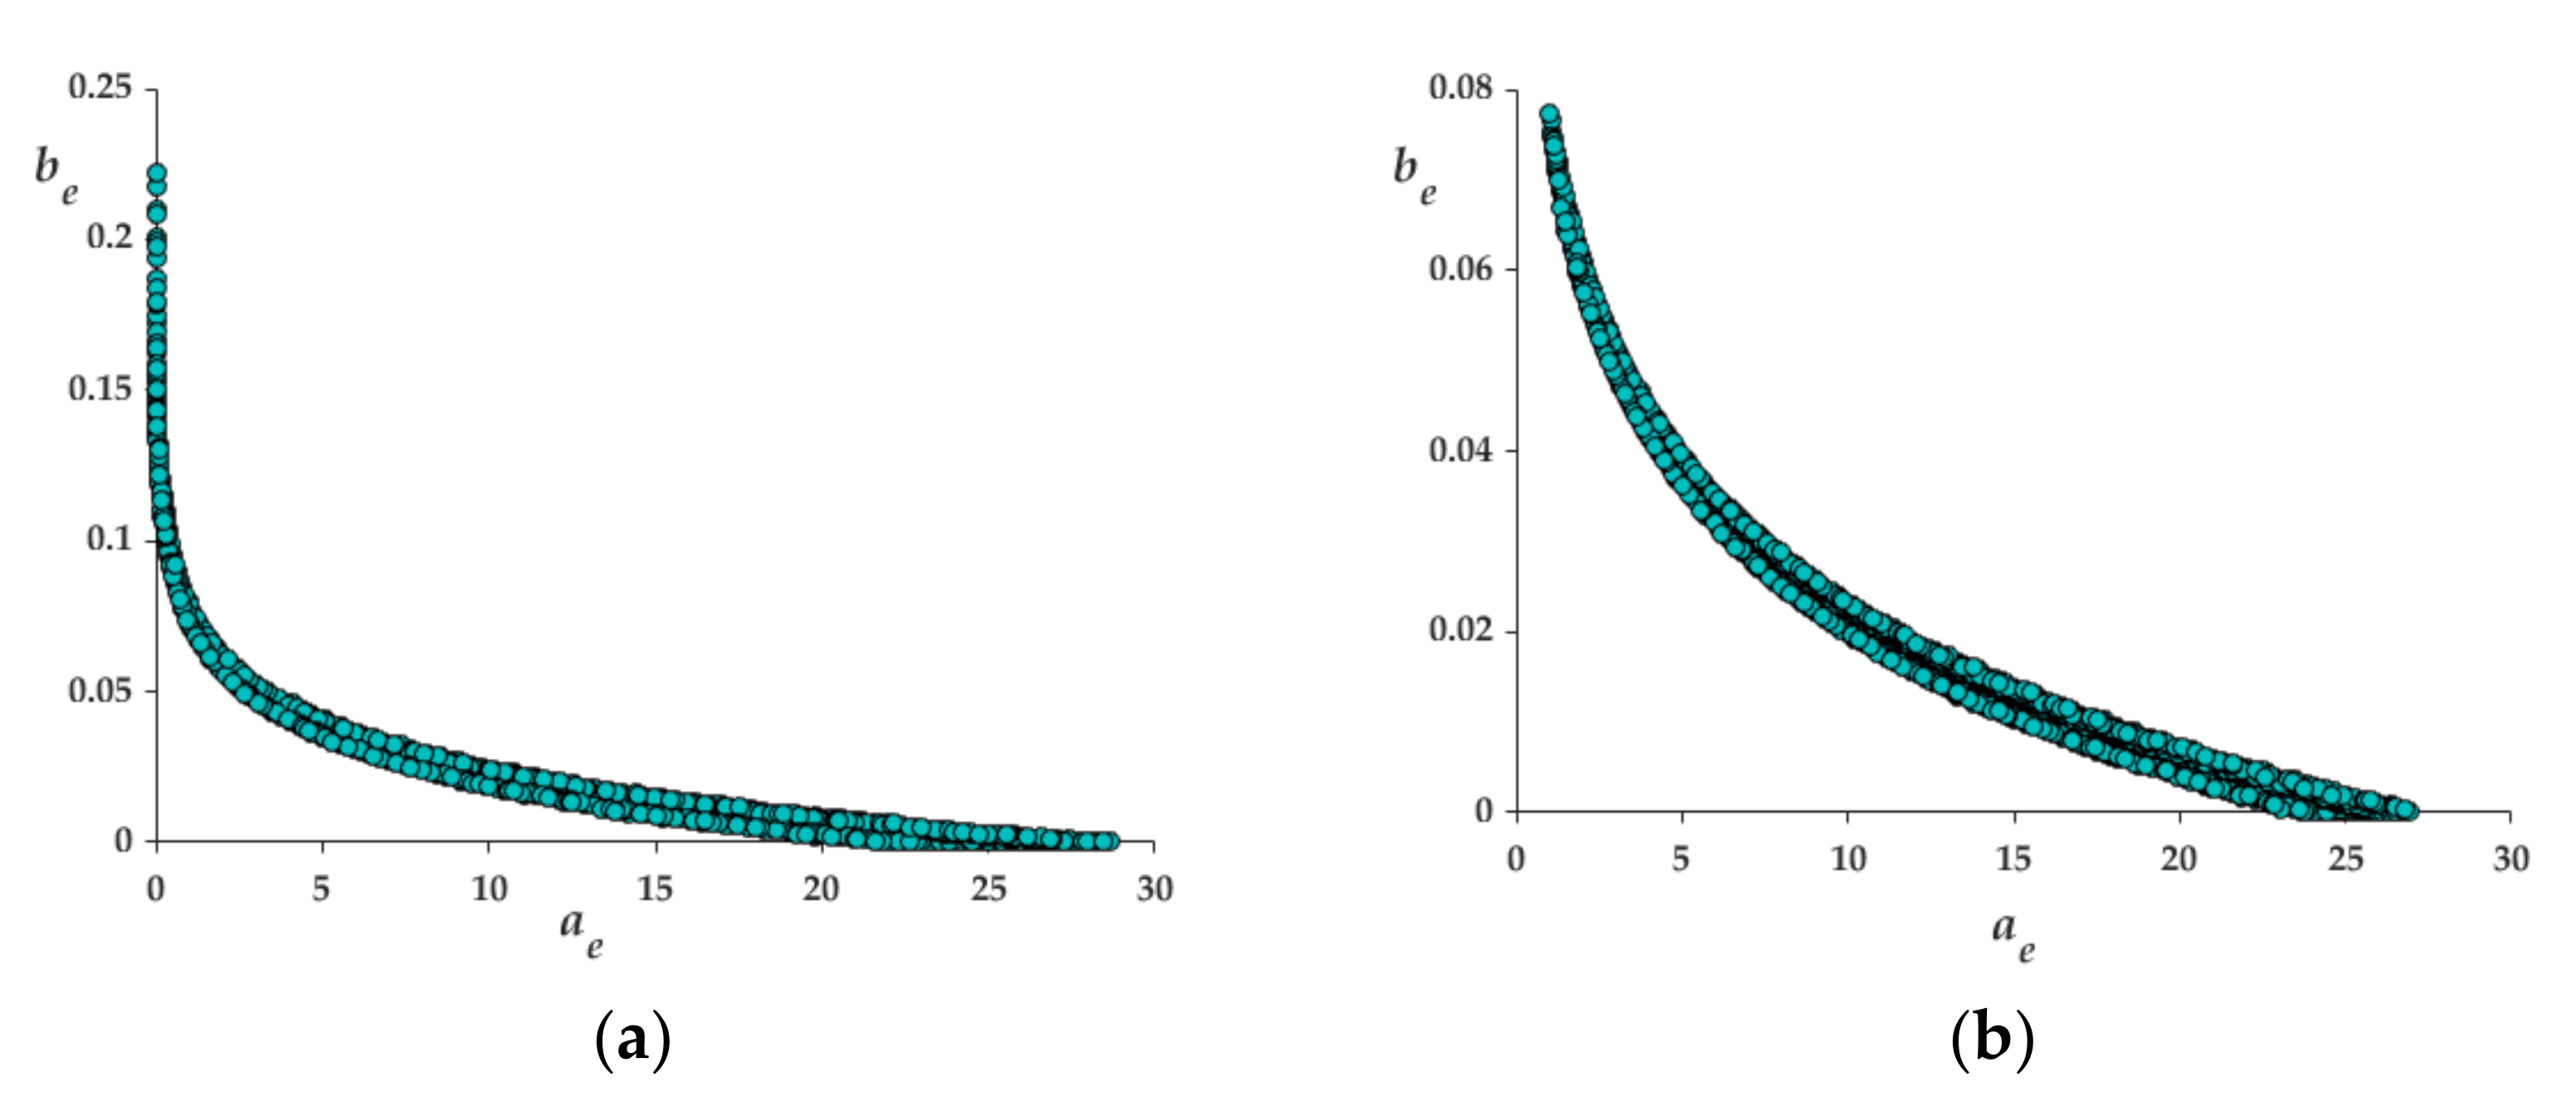
5. Exponential Law
A total number of more than 10
6 datasets have been defined and, consequently, the same number of exponential conversion models (see Equation (4)) have been established by varying the number
m of the considered data. In
Figure 4 the evaluated terms of the empirical exponential model for several values of the number
m are plotted. The analysis of the plot would show that a logarithmic relationship might exist between the terms
and
, which has been evaluated by carrying out a regression analysis. This analysis has been conducted for each value of
m ranging between 3 and 24, thus, 21 laws have been evaluated. It is found that the terms of such laws are similar; hence, the following relationship has been obtained:
With a coefficient of determination equal to 0.9976. In detail, the first coefficient of Equation (12) shows a maximum variation of 0.2%, while the second coefficient has a maximum variation of 0.14%.
The datasets have been analyzed to ascertain the influence of the coefficient of variation related to the concrete strength
Covfc, on the relationship between the coefficients of the exponential law.
Figure 5 shows that the relationship between the coefficients of the exponential law does not change significantly by varying the coefficient of variation of the concrete strength.
A similar trend is observed when analyzing the influence of the coefficient of variation of the rebound index on the law in Equation (12) (see
Figure 6).
The analysis of the RMSE for a different number,
m, of considered data reveals that the coefficient of variation of the rebound index does not seem to be significantly relevant for the accuracy of the calibrated exponential empirical law, while the latter would be fundamentally dependent on the coefficient of variation of the concrete strength. The increase of the number
m of considered data does have an impact on the range of variation of RMSE (see
Figure 7).
6. Polynomial Law
This section discusses the calibration of polynomial empirical laws (see Equation (5)) in accordance with the procedure described in
Section 2 and
Section 3. Additionally, for this law more than 10
6 conversion models have been established by minimizing the value of the Equation (9) and by varying the number
m of the considered data between 3 and 24. In
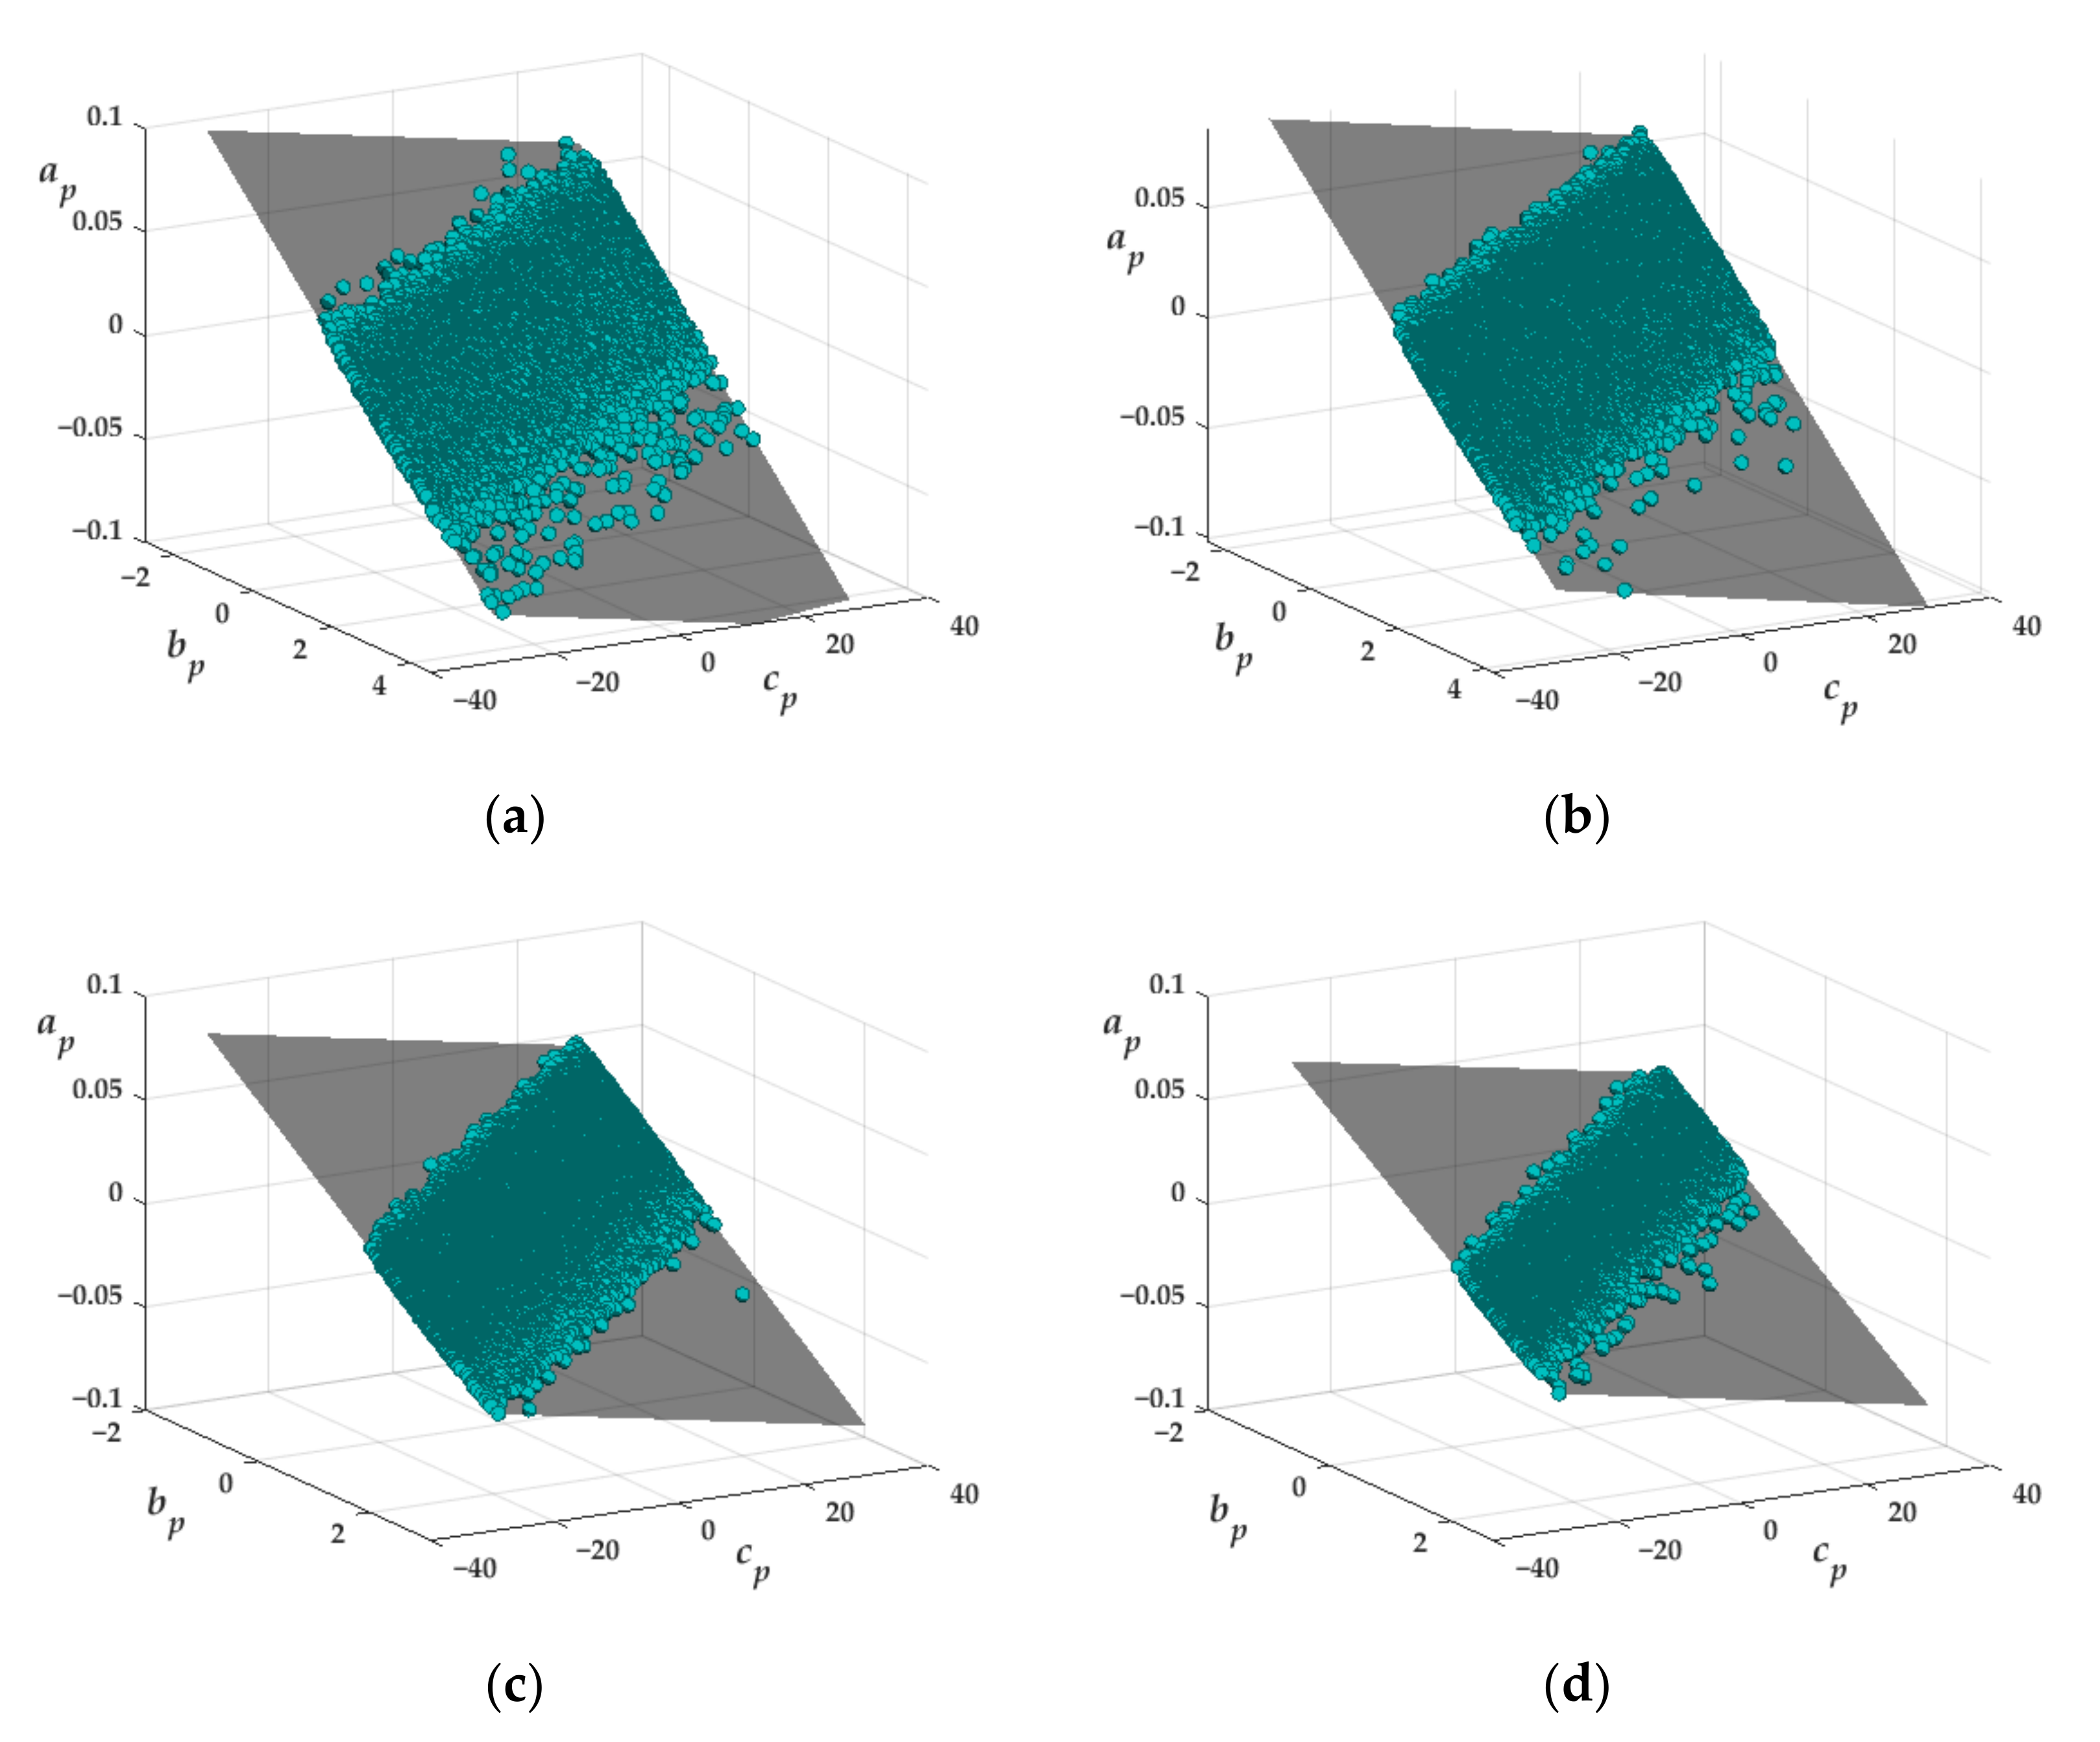
Figure 8 the coefficients of the calibrated polynomial laws are plotted for four different values of
m (i.e.,
m = 8, 11, 15, 18). The plots would indicate that all the coefficients lie on a plane, and consequently, a relationship between such coefficients may be established. Therefore, a regression analysis has been carried out for each value of
m ranging between 3 and 24. Following, the established equation is written:
With a coefficient of determination equal to 0.9996, showing a very high goodness of fit in the regression model. Moreover, by analyzing all the coefficients of Equation (13) for each value of m, the coefficient of variation of the three coefficients in Equation (13) is about 3.4%, 5.3% and 2.2%, respectively.
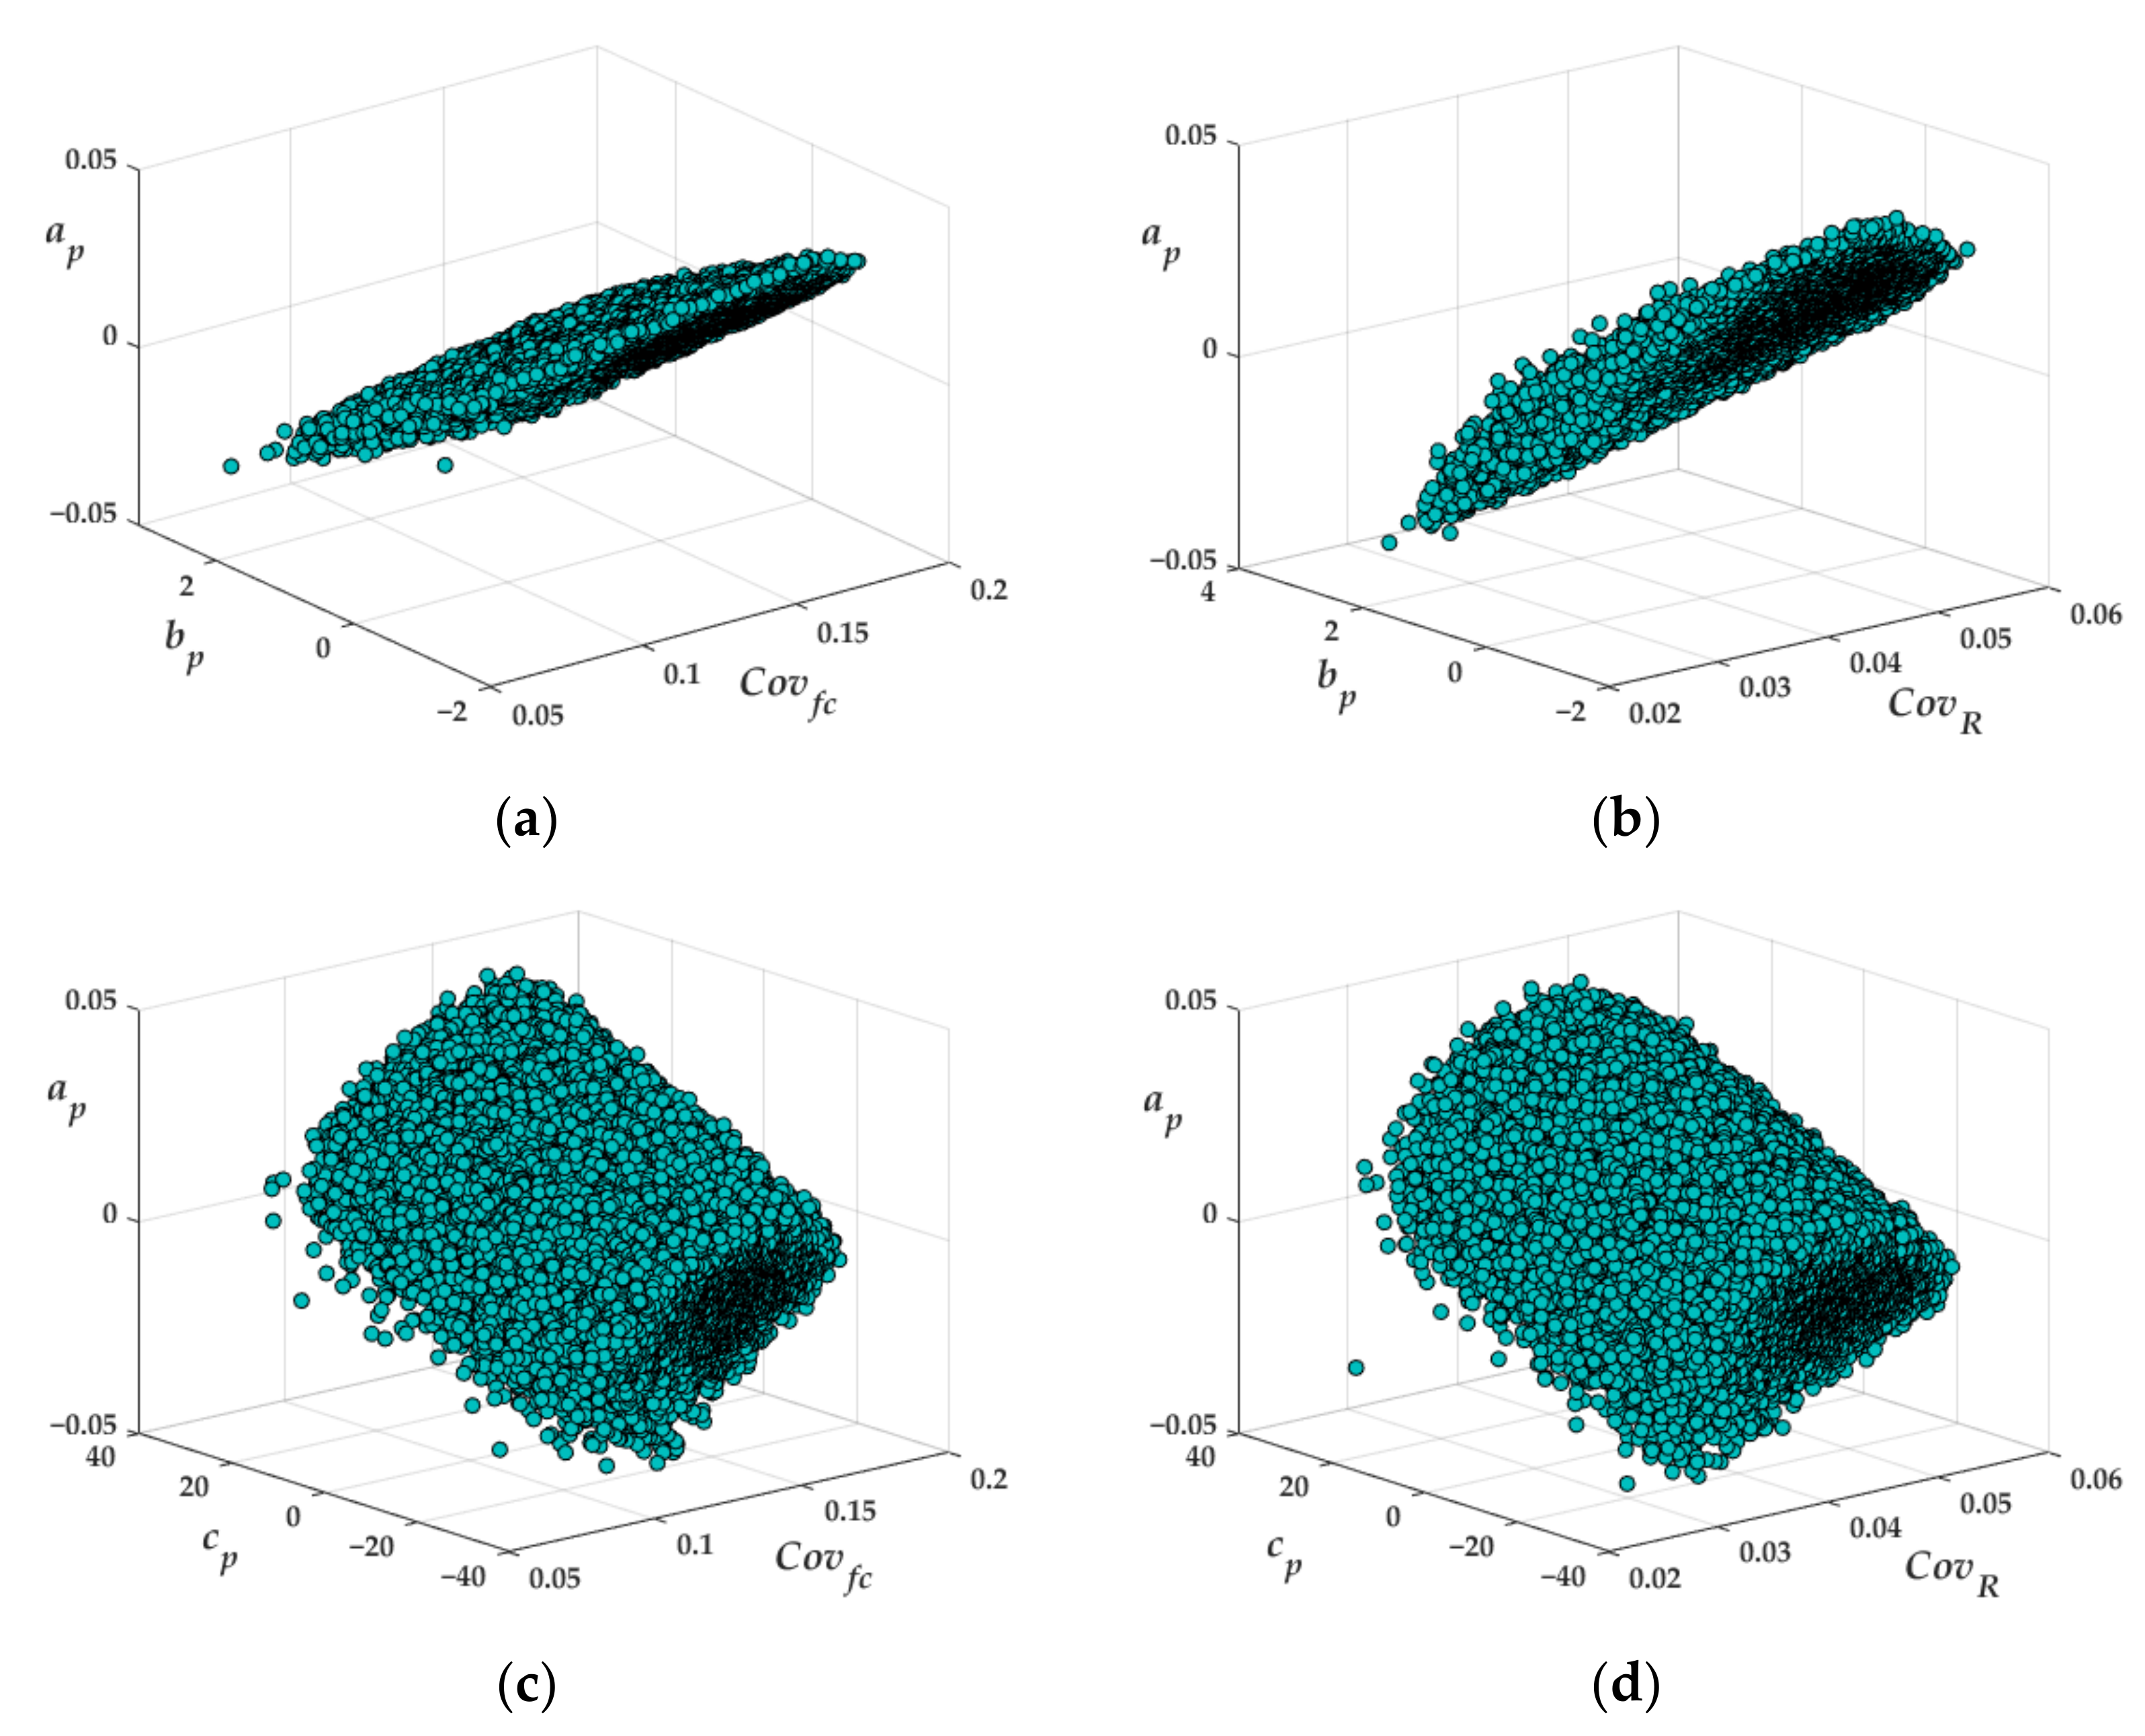
In addition, the influence of the coefficient of variation of the concrete strength on the coefficients of the polynomial law has been evaluated. In
Figure 9 the coefficients are plotted by including such coefficients of variation related to each one of the calibrated laws. It can be thus observed that the relationship between the coefficients does not seem to depend on the coefficient of variation of both the concrete strength
Covfc and the rebound number
CovR.
The previously described behavior is not affected by the number
m of considered data in the calibration procedure, as it can be verified by comparing
Figure 9 with
Figure 10 which has been plotted by considering
m equal to 18.
Figure 11 shows the RMSE evaluated for the polynomial law calibrated for two values of
m (i.e.,
m = 15 and 18). Similar trends have been obtained for the other values of
m. The graphs show that as the value of
m increases, as in the laws discussed above, the range of variability of the RMSE decreases, and although for higher values of the coefficient of variation of the concrete strength, the RMSE reaches high values and no relationship can be established.
7. Conclusions
The use of non-destructive testing in the field of diagnostics of an existing building is becoming increasingly widespread due to its versatility and swiftness. In this paper, the use of the rebound hammer test has been analyzed with detailed attention given to the choice of the empirical law, correlating the concrete strength with the rebound index. Three conversion models have been investigated to verify the variability of their coefficients, the accuracy of the assessed concrete strength with respect to the coefficient of variation of the concrete strength and of the rebound index, and the possible advantages and/or limitations related to the adopted empirical law.
The use of the linear and exponential laws involved the estimation of two coefficients each, whereas the polynomial law required the calibration of three coefficients. The analysis presented here—based on large numbers of combinations of experimental non-destructive and destructive results from an existing building—would reveal that the coefficients of those analytical models manifest a high variability in their values. Nonetheless, a relationship between such values may be always found by means of a regression analysis. In detail, for the linear law, a linear relationship exists between its two defining coefficients; for the exponential law a logarithmic equation binds the coefficients, and for the polynomial law, the coefficients lie on a plane whose equation was established. Moreover, the influence of the number m of considered data in the calibration procedure of the empirical laws on the established relationships was investigated. It was highlighted that for all the considered conversion models, varying this number in the range from 3 to 24, the highest variation in the factors of the relationships between the coefficients of the conversion models is equal to 5.3% for the polynomial law and 0.2% for the linear and the exponential laws. This result may be due to the weight of the rebound index in the analytical formulation, in fact, as its weight increases, the variation of the coefficients increases.
Furthermore, in all the considered models, the coefficient of variation of the concrete strength and of the rebound index did not affect the previously described relationships. The existence of relationships between the coefficients of the conversion model shows that these coefficients, which are calibrated by a minimization procedure, are not independent from each other. Indeed, the calibration procedure is performed based on a fixed combination of data and, thus, the coefficient of variation of the core strength and of the rebound index interfere directly in the procedure, while the regression analysis carried out on the coefficients of the conversion model has the effect of averaging the influence of these coefficients of variation.
The RMSE was also evaluated for each conversion model. Based on the methodology here examined—involving experimental results from a real existing building—it did not vary significantly when using a different empirical law, but a narrow reduction was observed in the range of variability of RMSE and of its mean value going from the exponential law to the linear one, and from the linear one to the polynomial law.
A future step of the research will be the extension of the procedure and results discussed here, to other buildings. In the first stage, other buildings characterized by comparable age of construction and environmental conditions will be selected to dismiss the possibility that the results may be due to some unconsidered factors. In a second stage, the analysis will be extended to other buildings in order to address these effects, one by one.


