
Algorithm of Smart Building Supervision for Detecting and Counting Column Ties Using Deep Learning


Abstract
:1. Introduction
2. Research Framework
2.1. Research Scope
2.2. Research Flow
- (1)
- Try 1: Network Training experiments (First detection)
- (2)
- Try 2: Network Training experiments (Fixed/Variation)
- (3)
- Try 3: Network Additional Training (Variation)
3. Literature Review
3.1. BIM Technology
3.2. Deep Learning-Based Object Detection
4. Experiment
4.1. Network for Column Tie Detection
4.1.1. Network Environment
- (1)
- MATLAB and Yolov2
- (2)
- Transfer Learning
4.1.2. Network Construction
- (1)
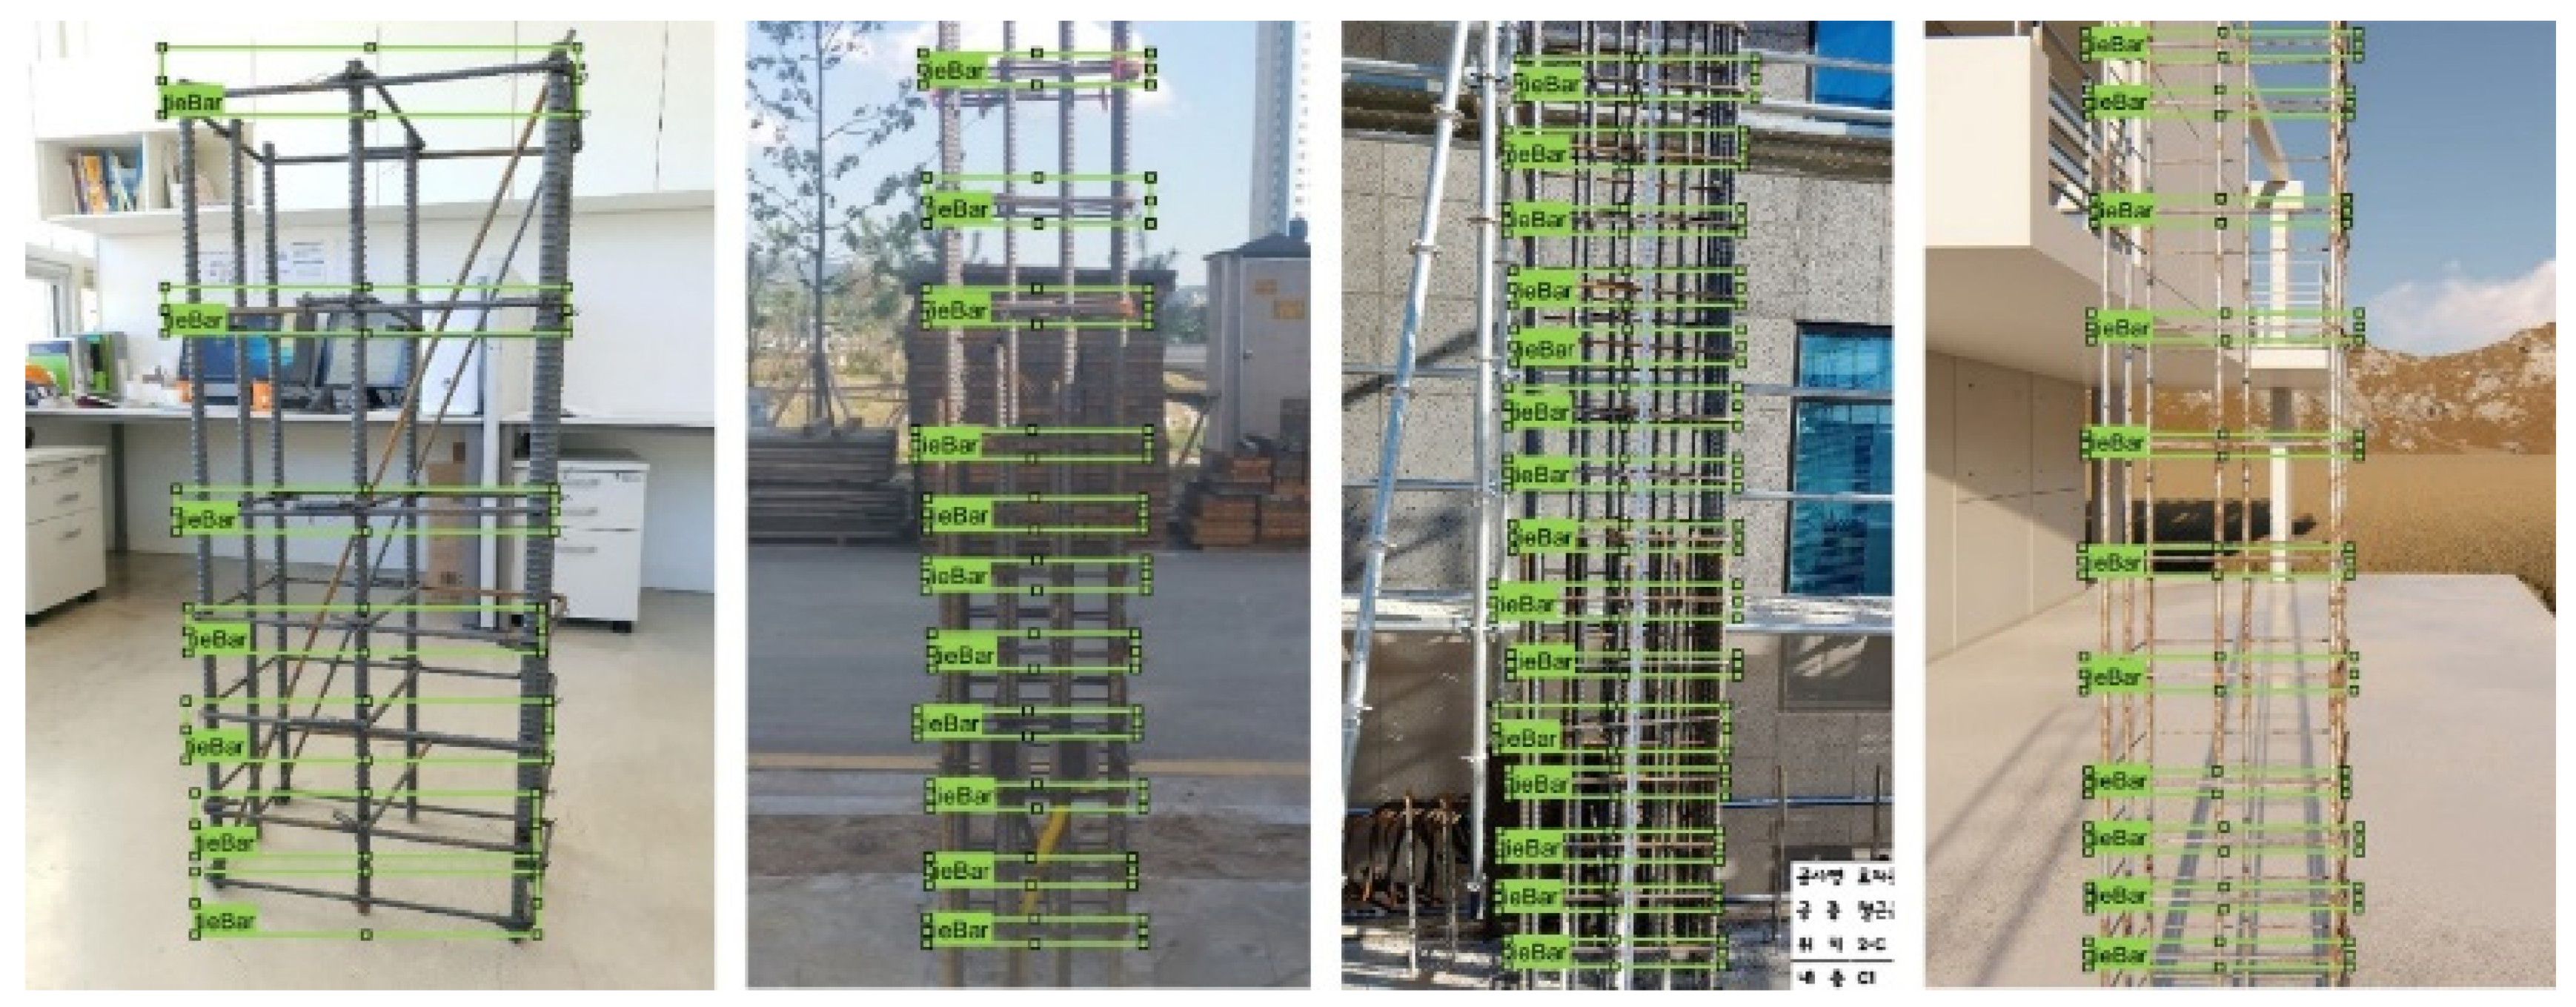
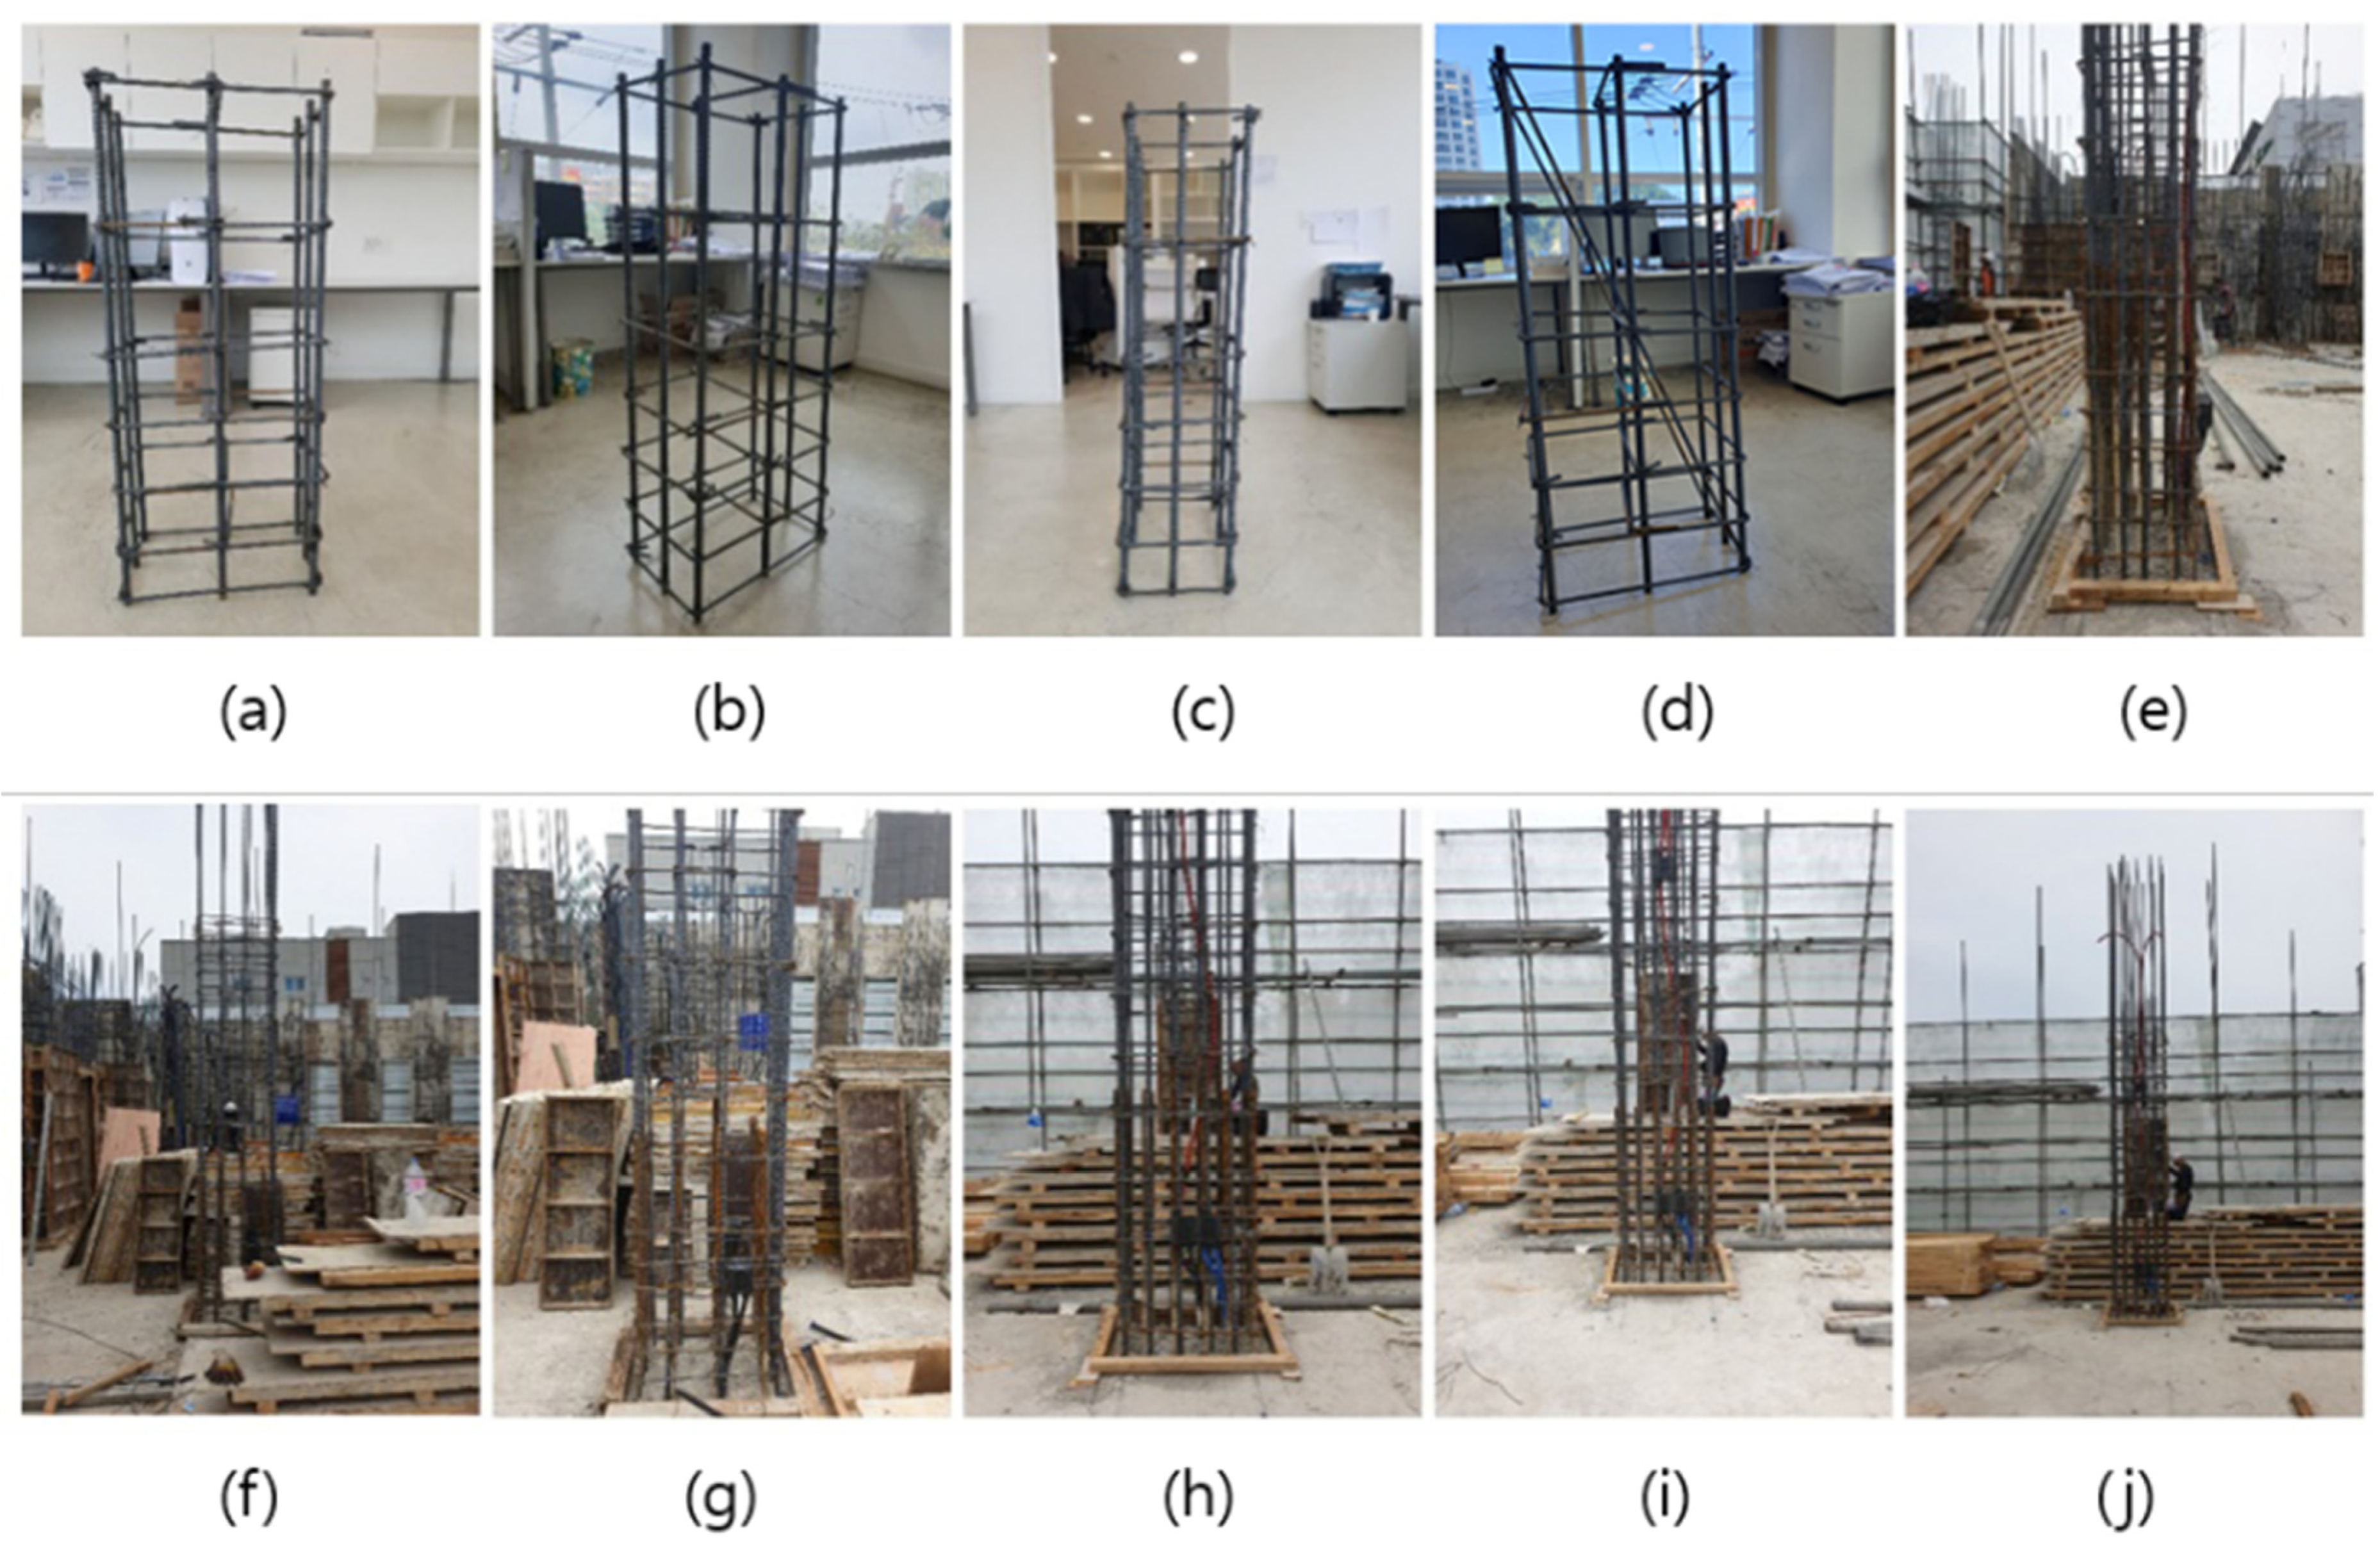
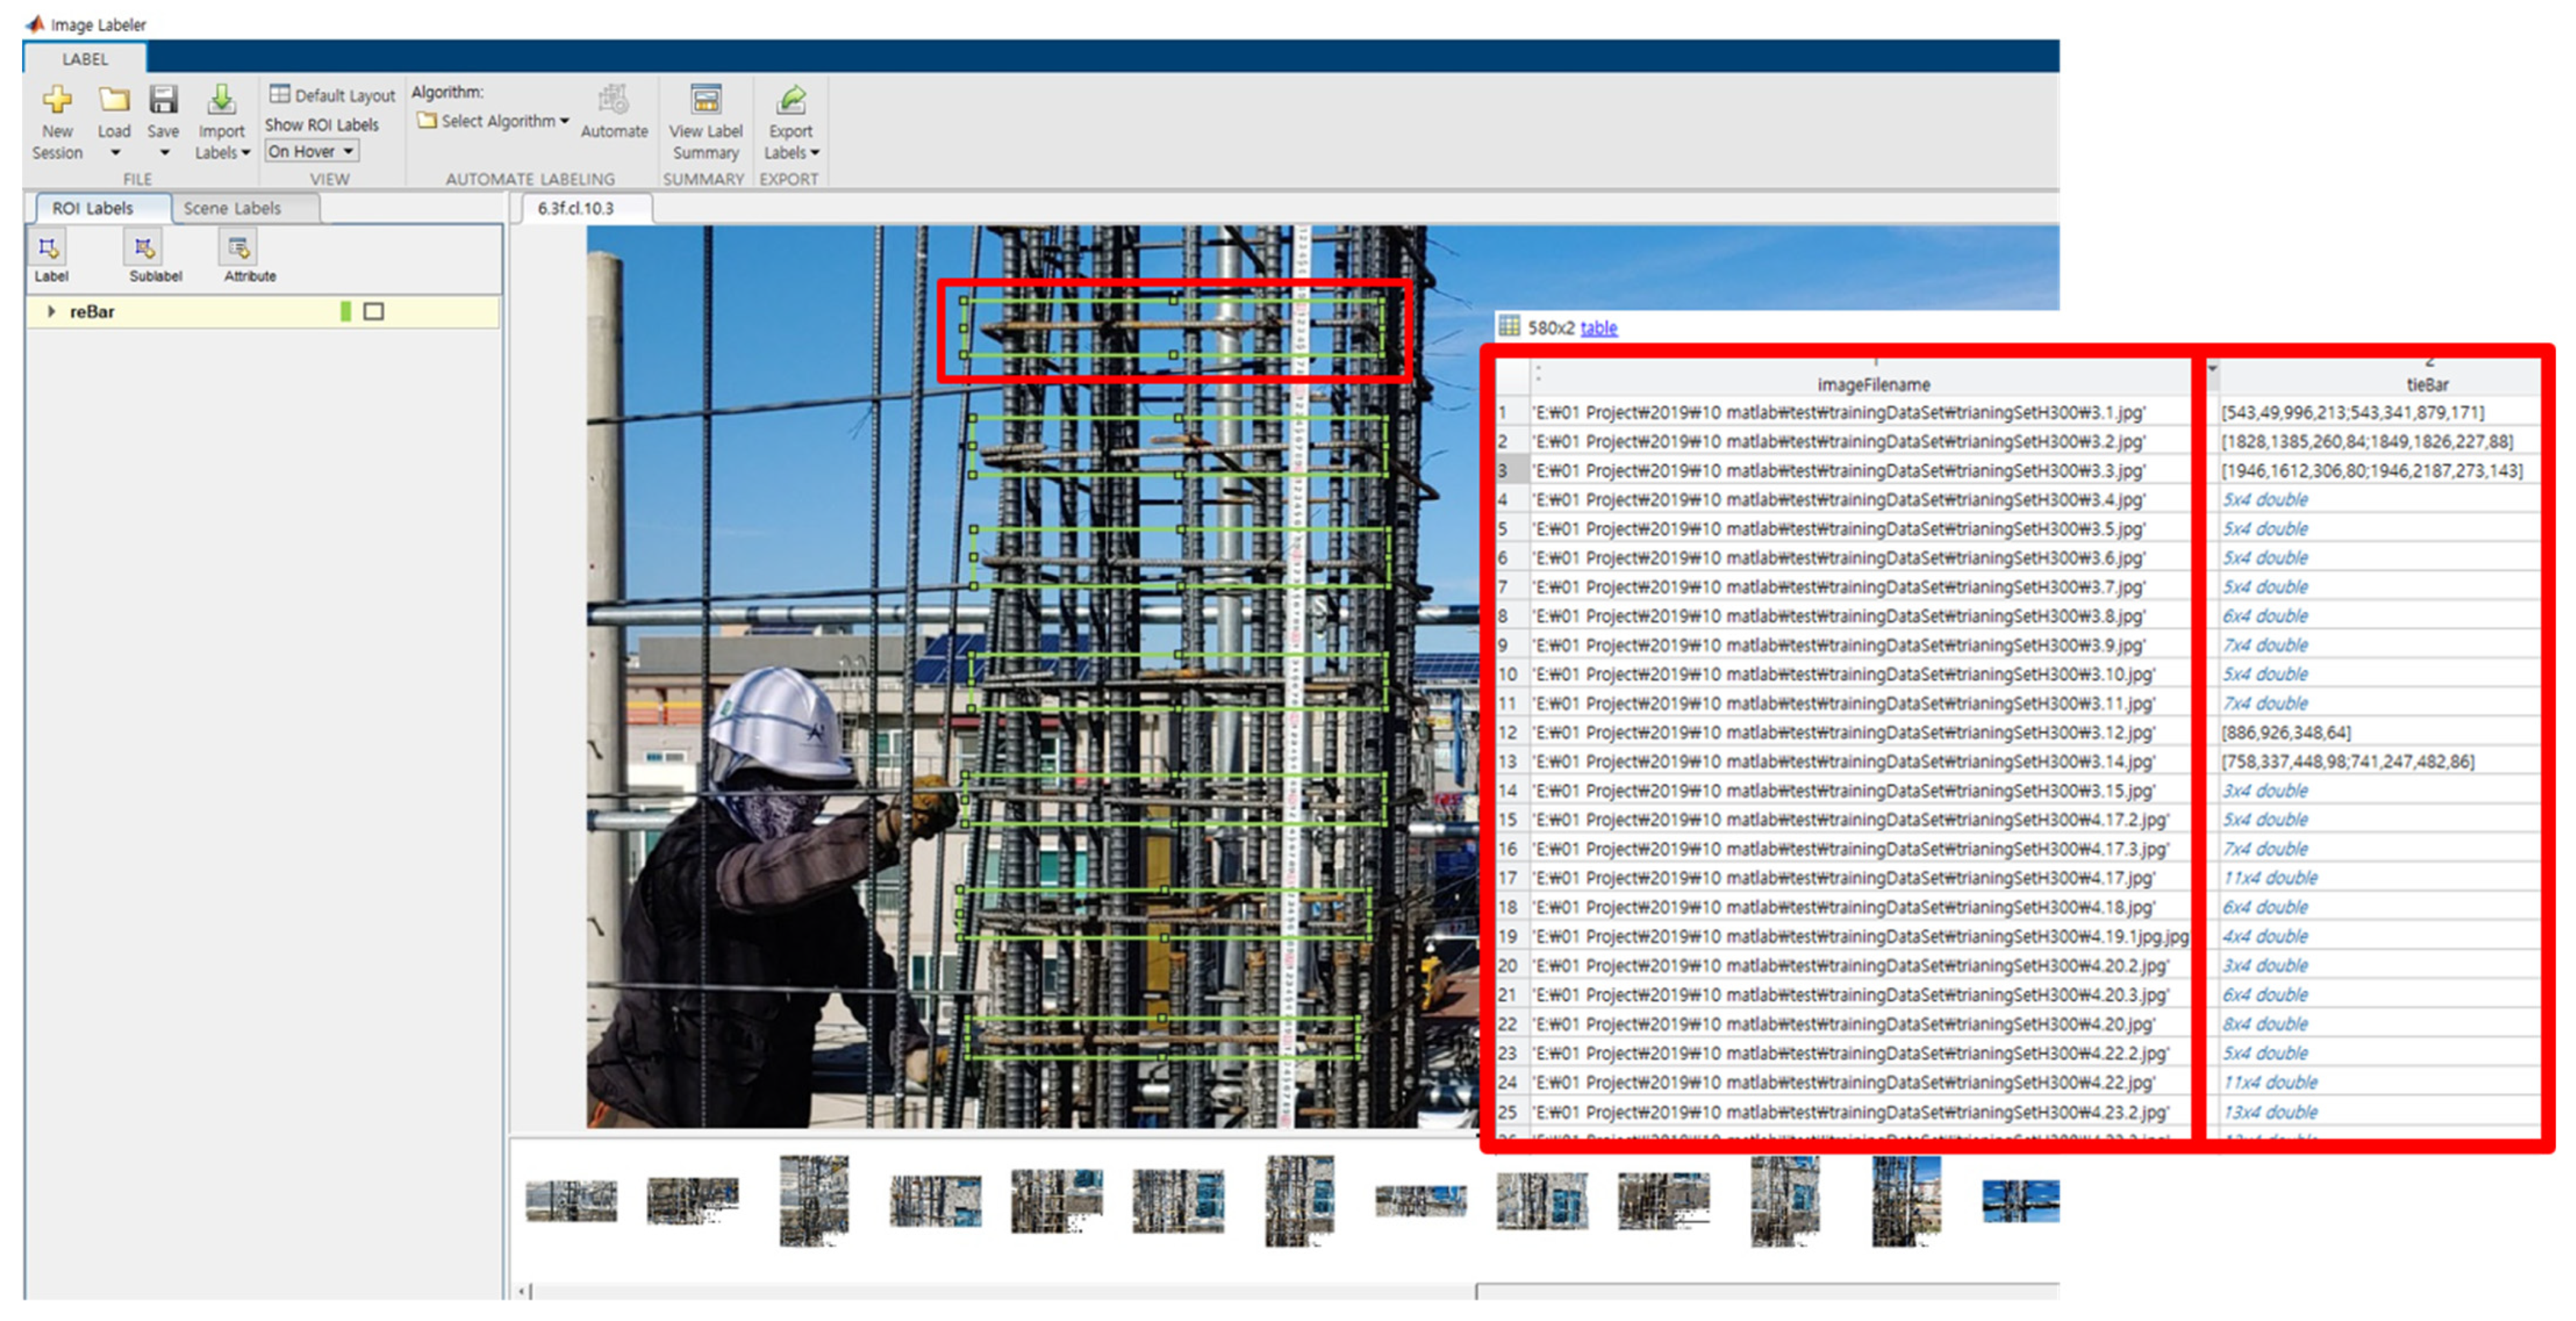
- Training Data Set
- (2)
- Feature Layers
- (3)
- Options and others
4.2. Network Experiment and Accuracy
4.2.1. Network Experiment for Initial Detection
4.2.2. Network Experiment to Find Fixed Items and Variables
4.2.3. Additional Network Training Experiment and Accuracy
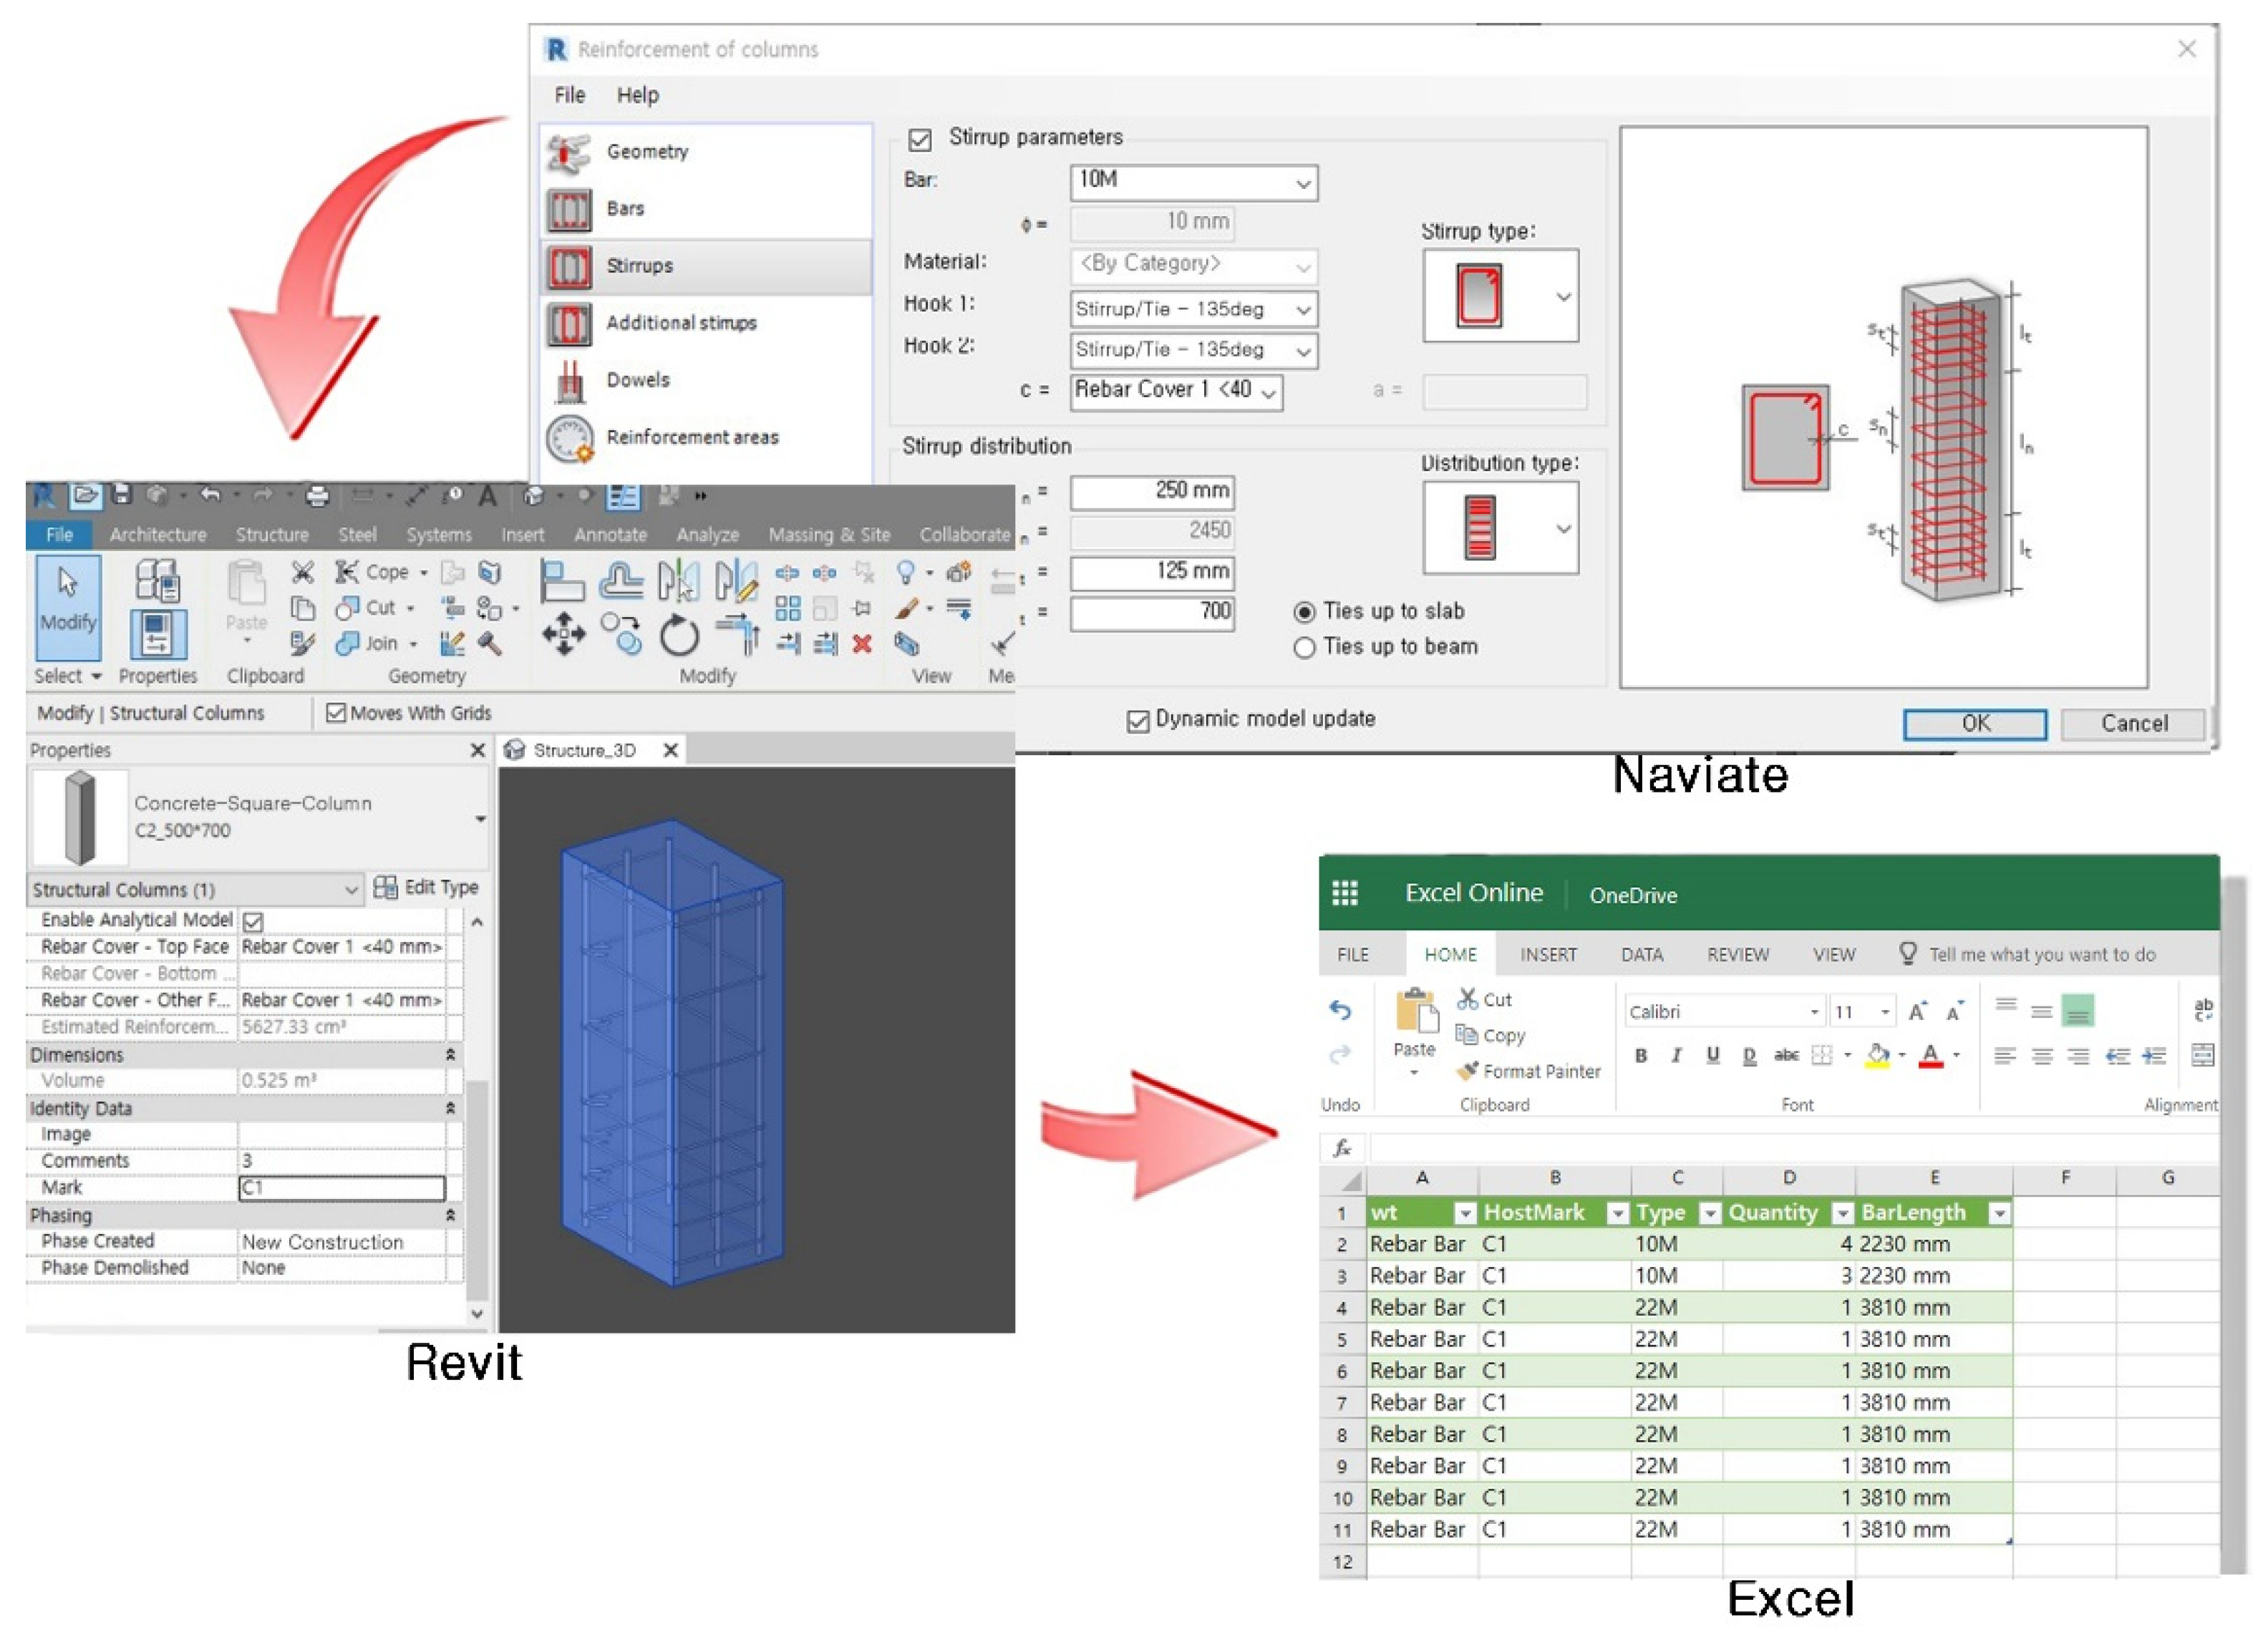
4.3. Calculation of Tie Quantity from BIM Model
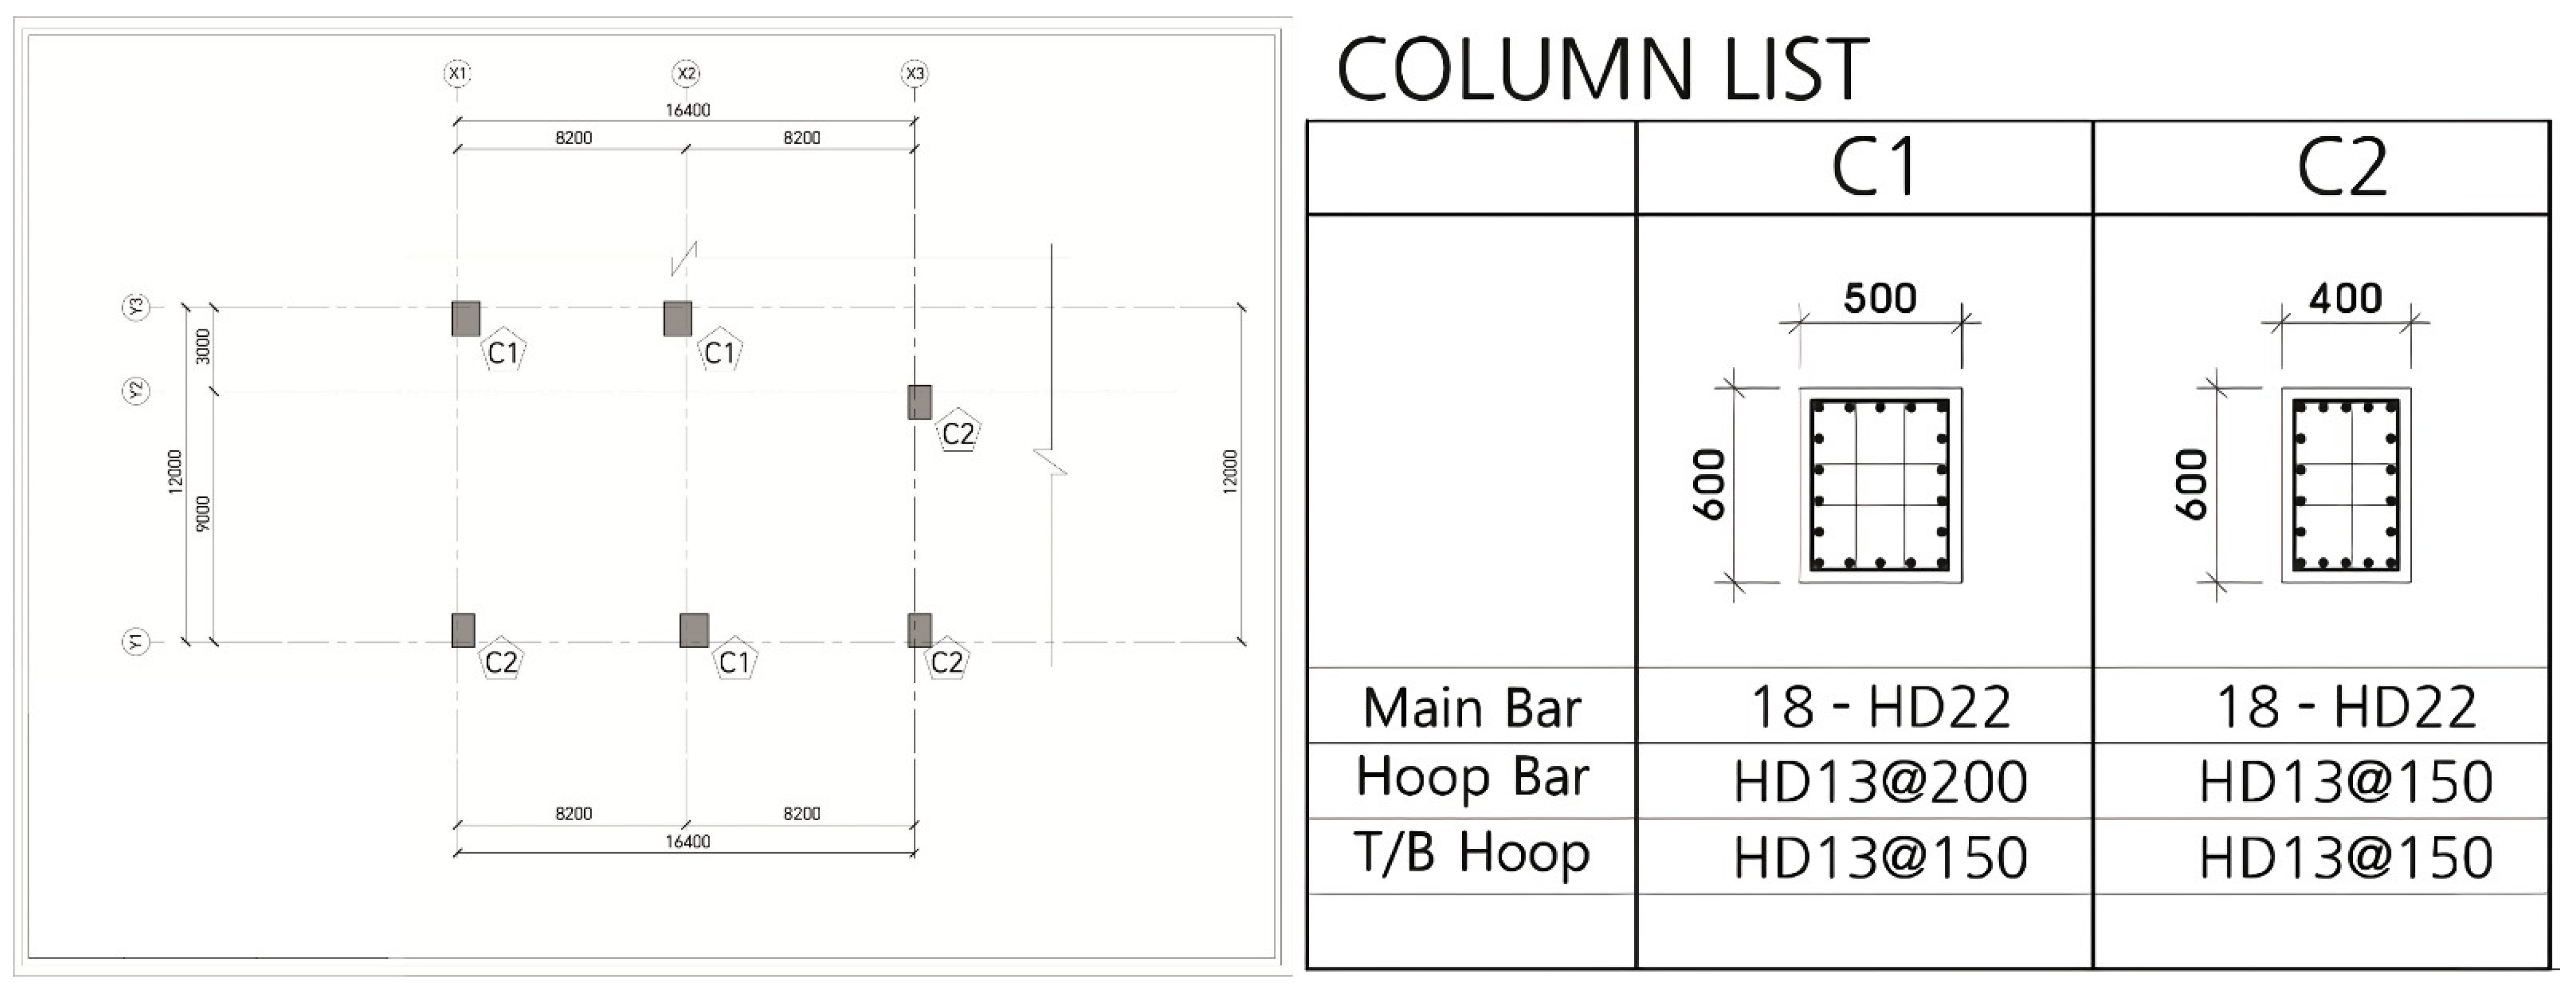
4.3.1. Column and Rebar Modeling
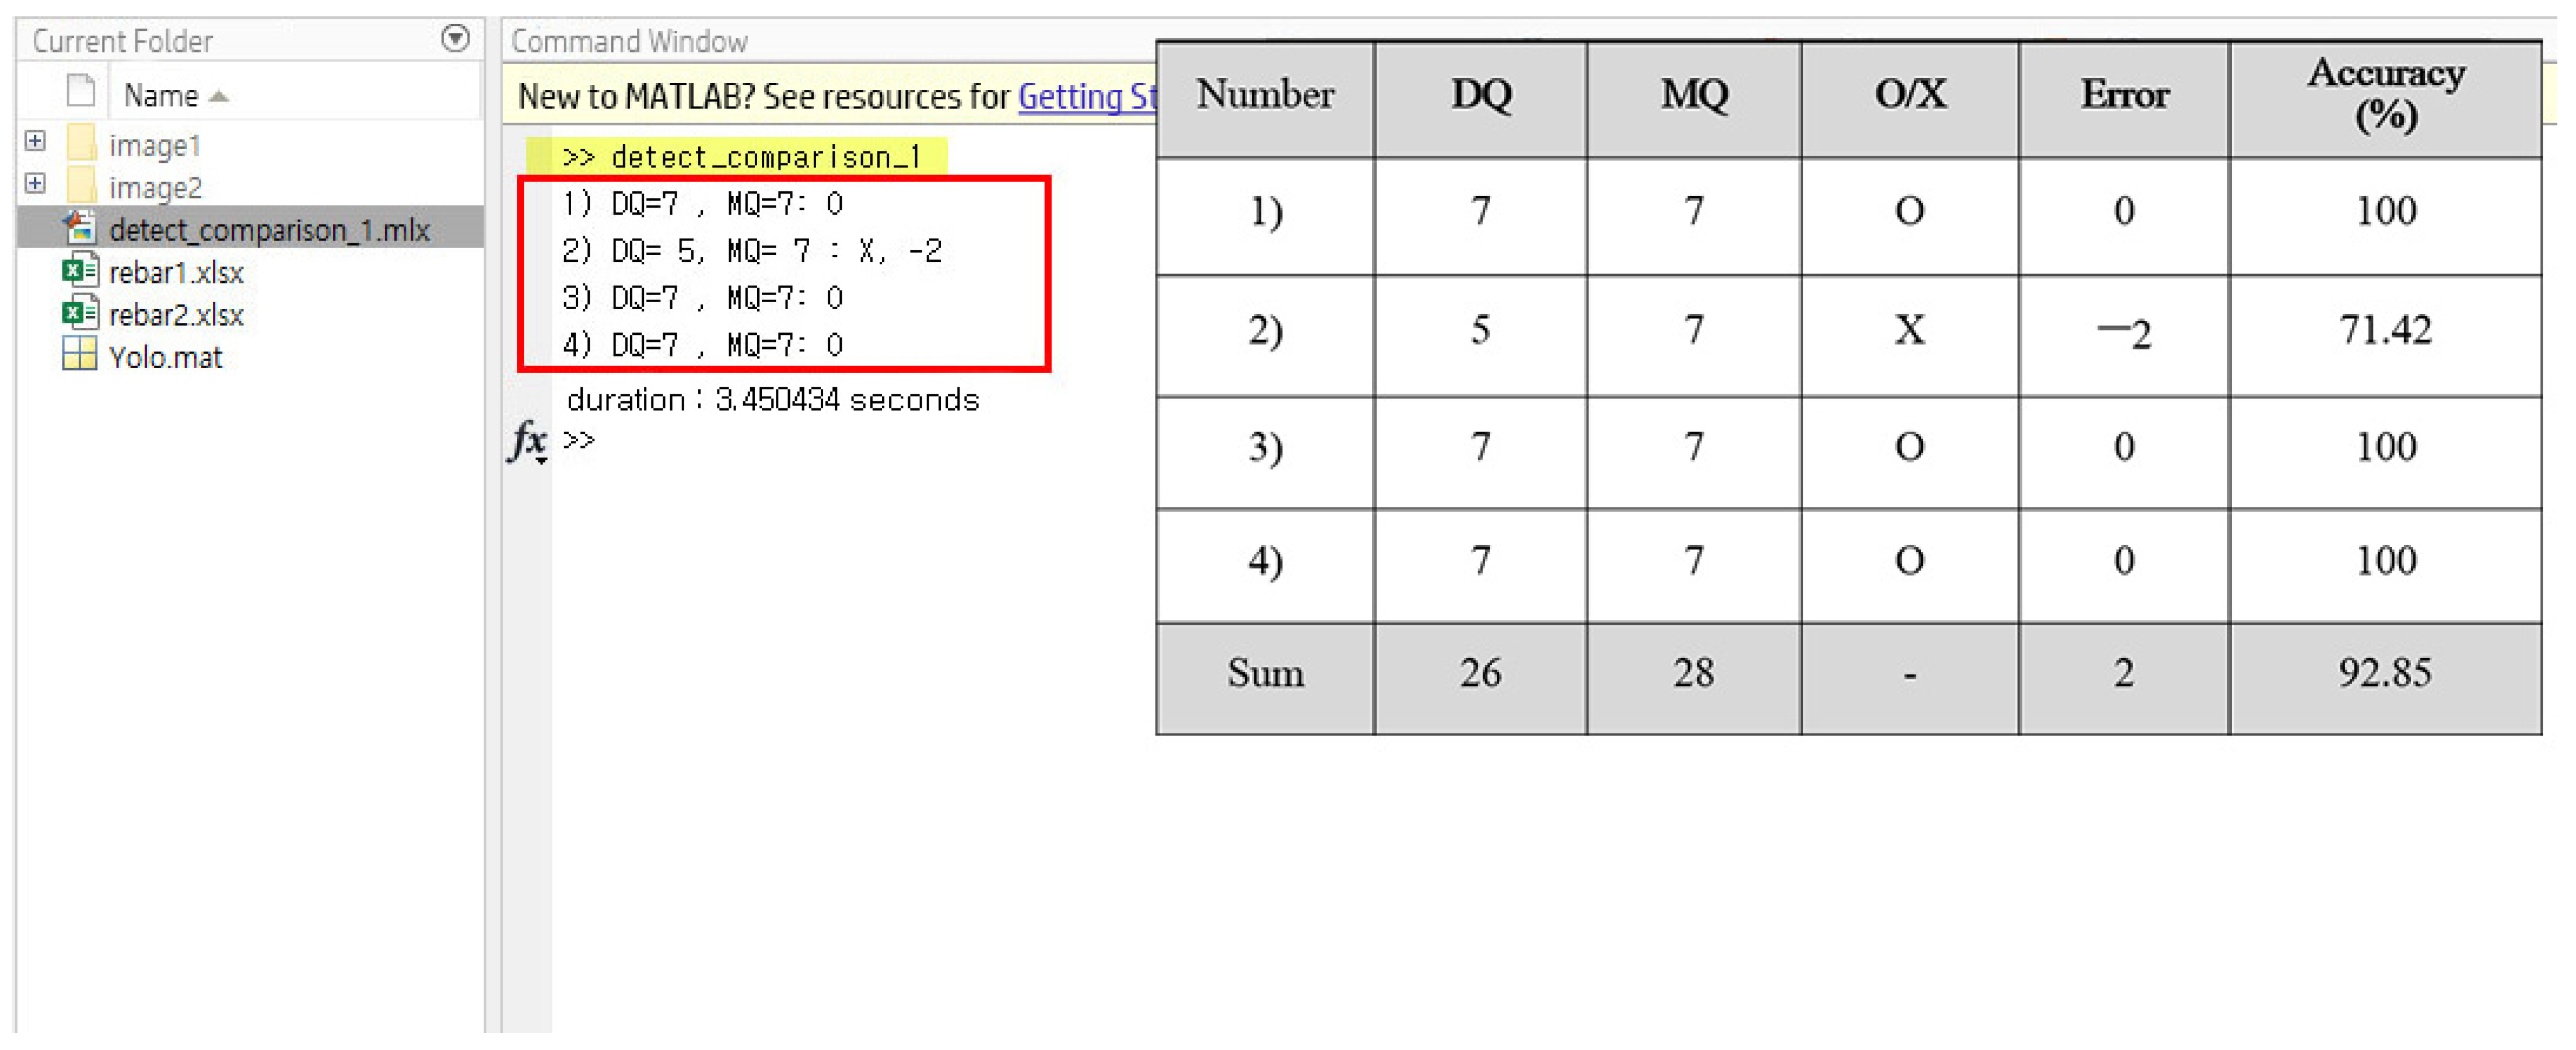
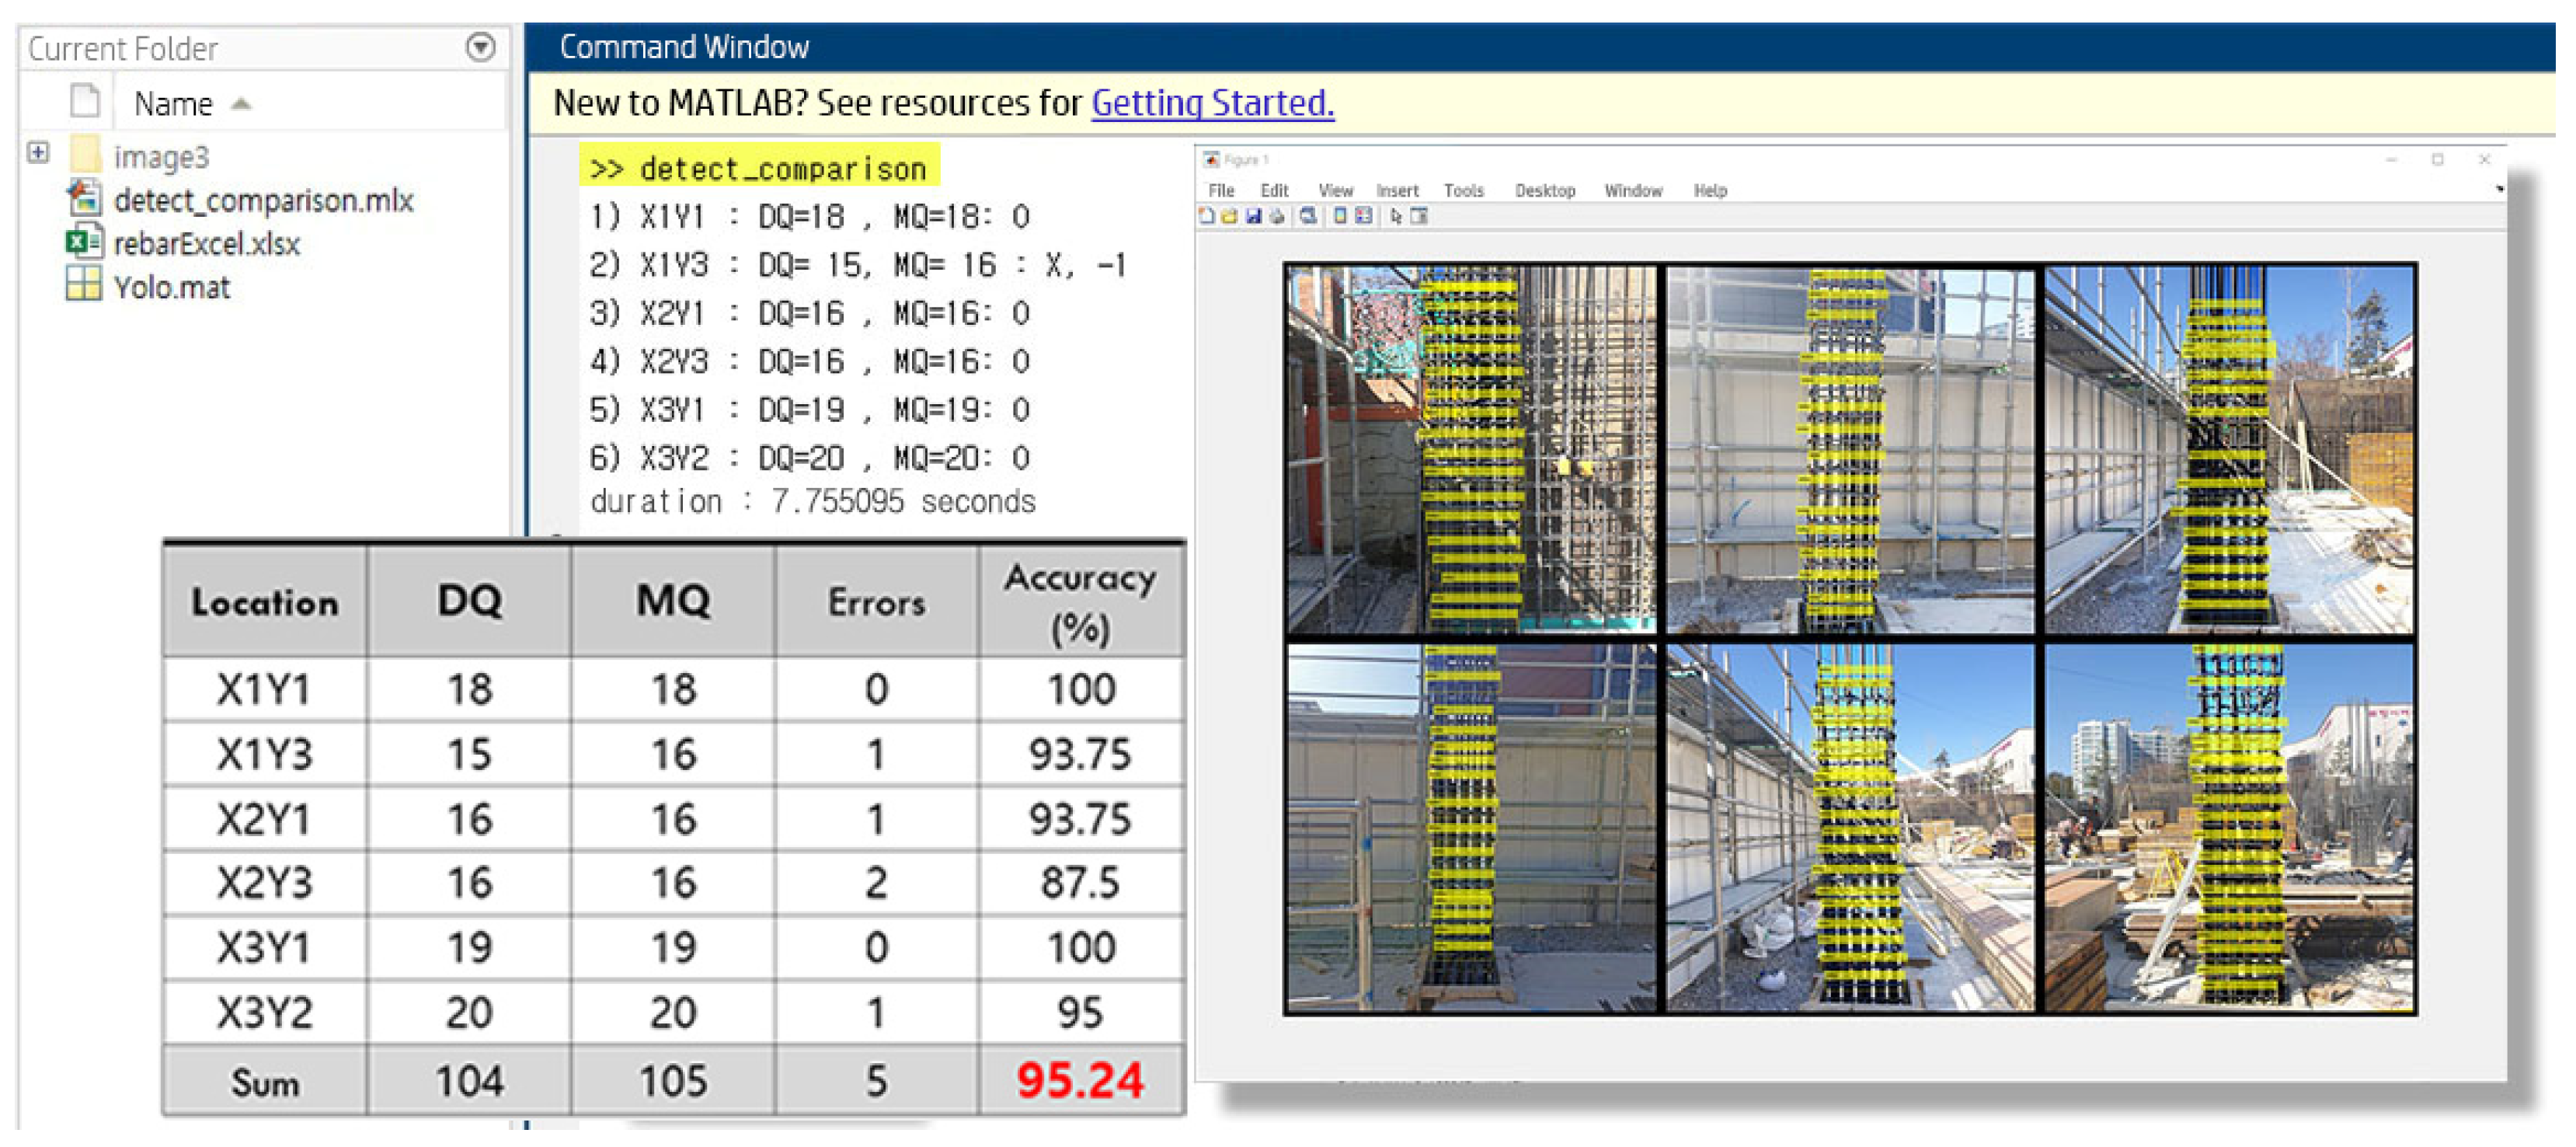
4.3.2. Comparing the Quantity of Ties from BIM with the Ties Identified in the Image
5. Development and Validations
5.1. Pre-Processing for Improving Detection Results and Accuracy
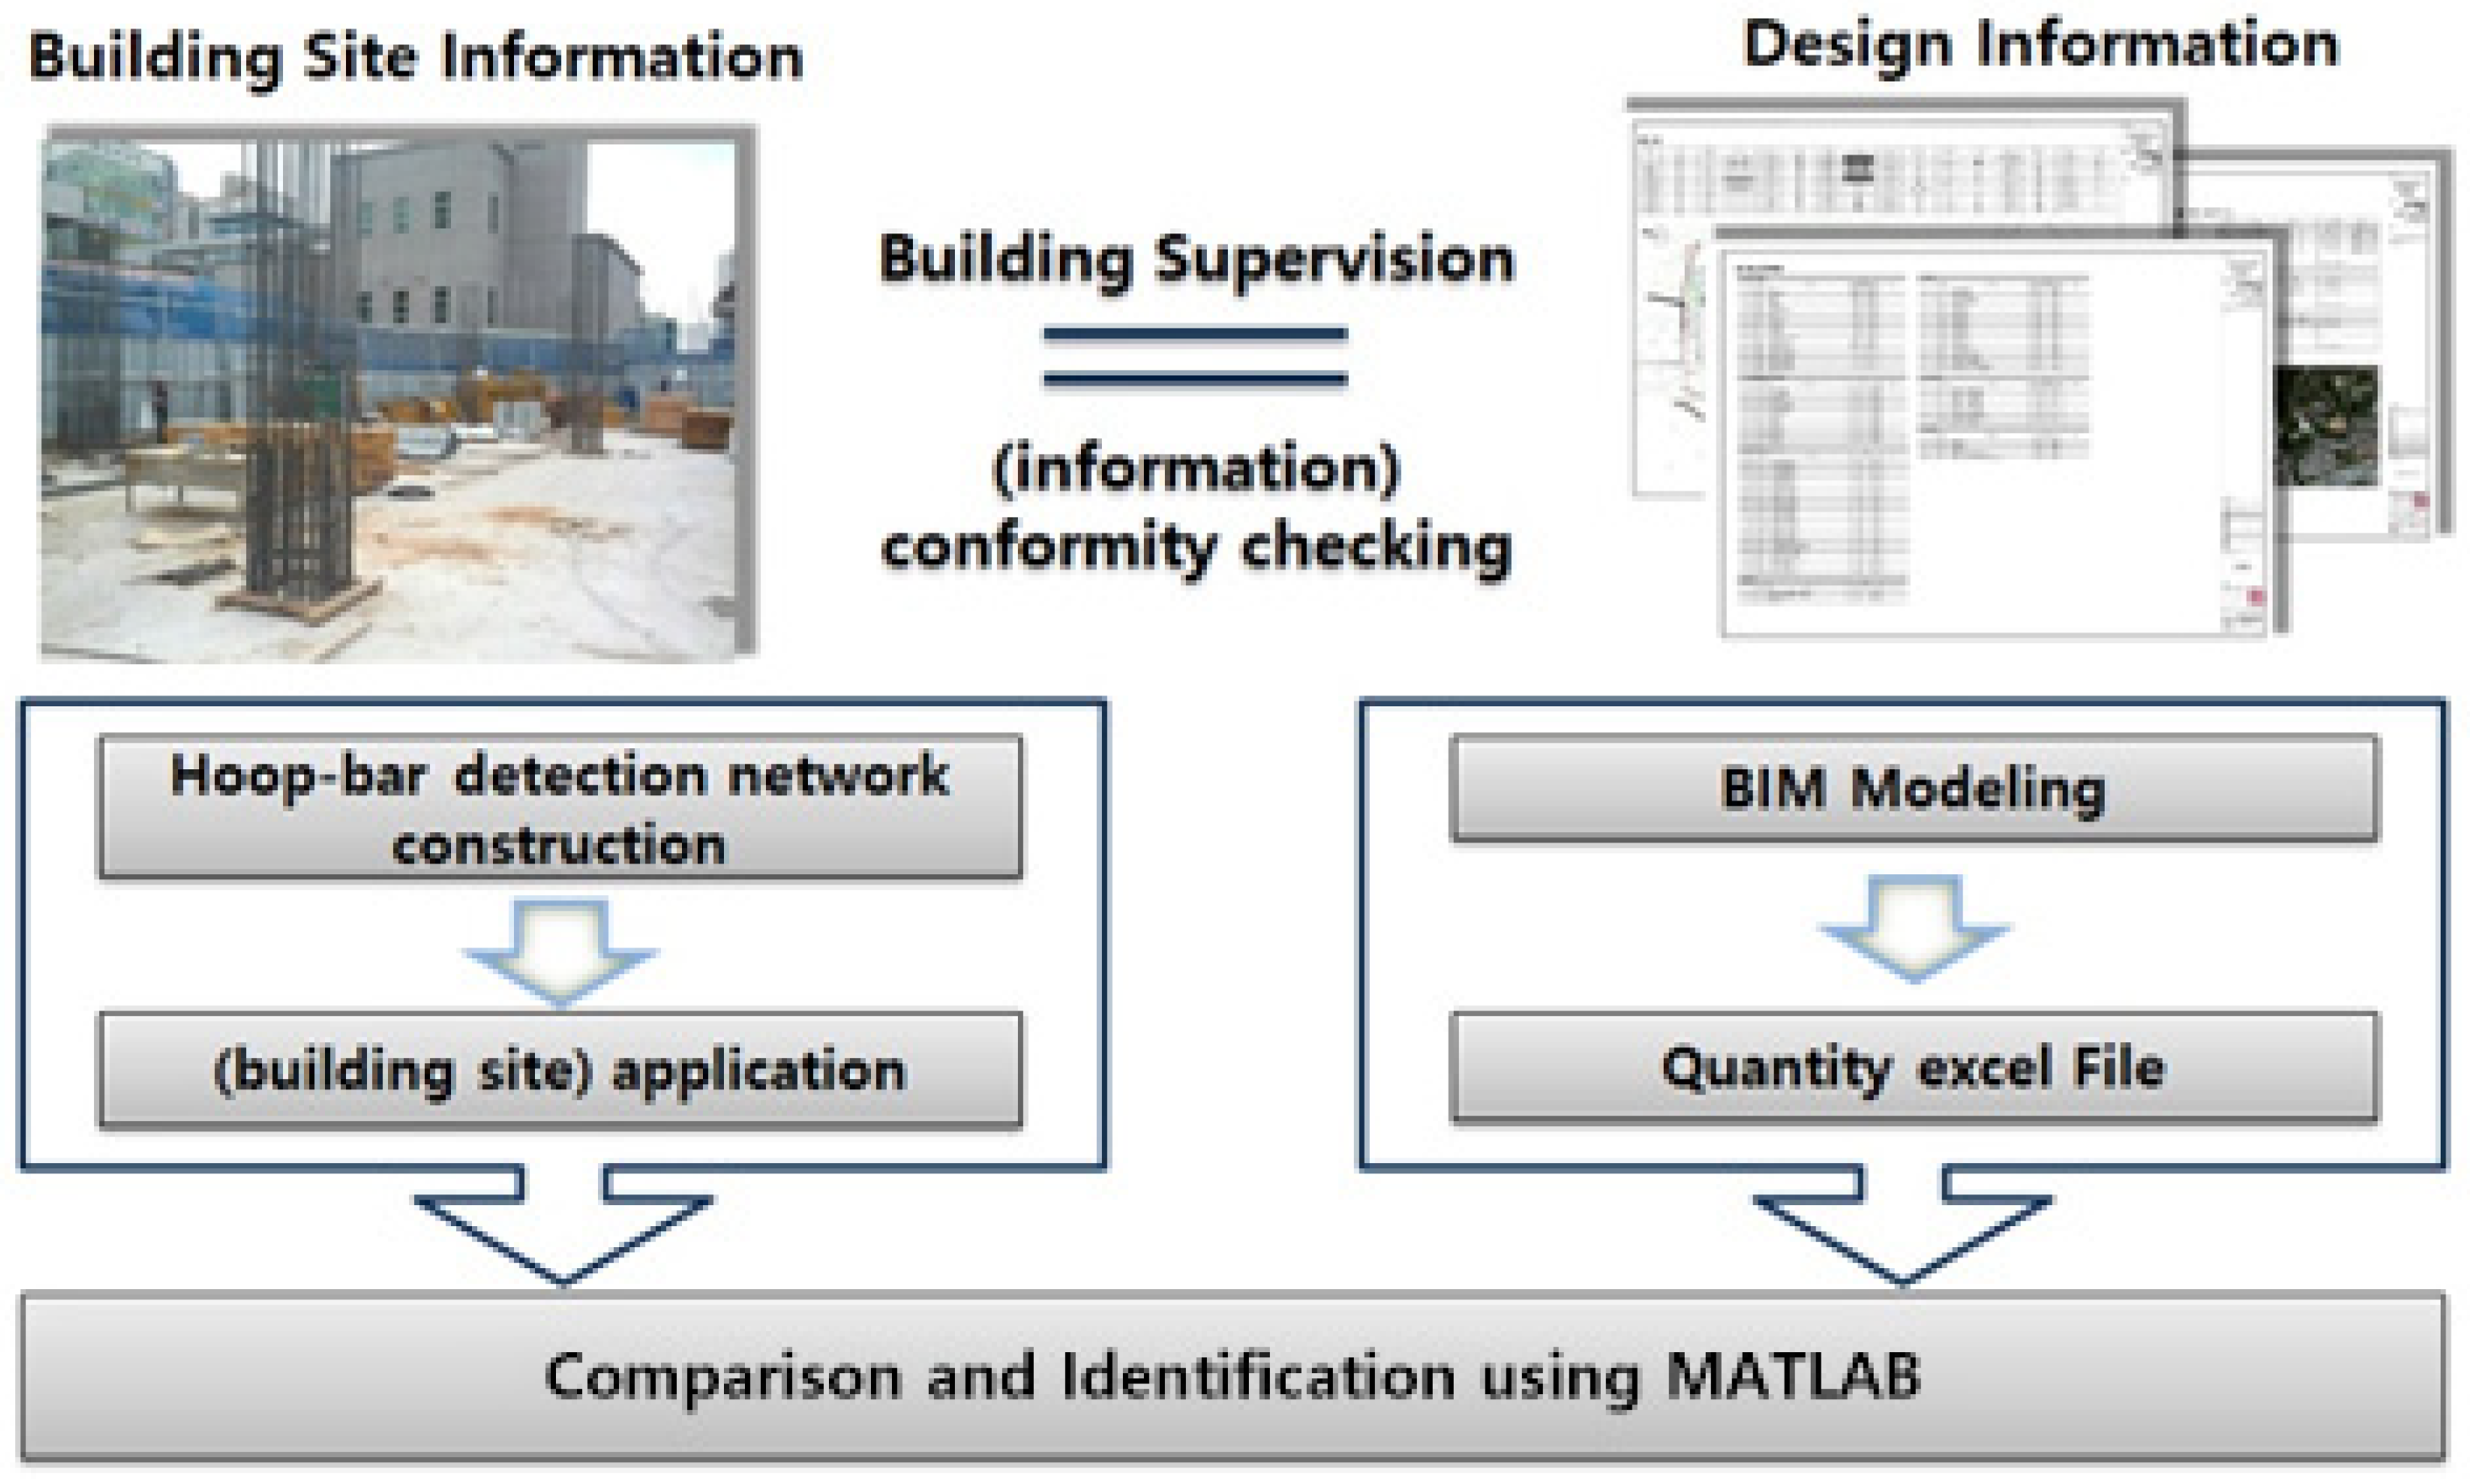
5.2. Deep Learning-Based Smart Supervision Checking System
5.2.1. Building Site and Pre-Processing of Images
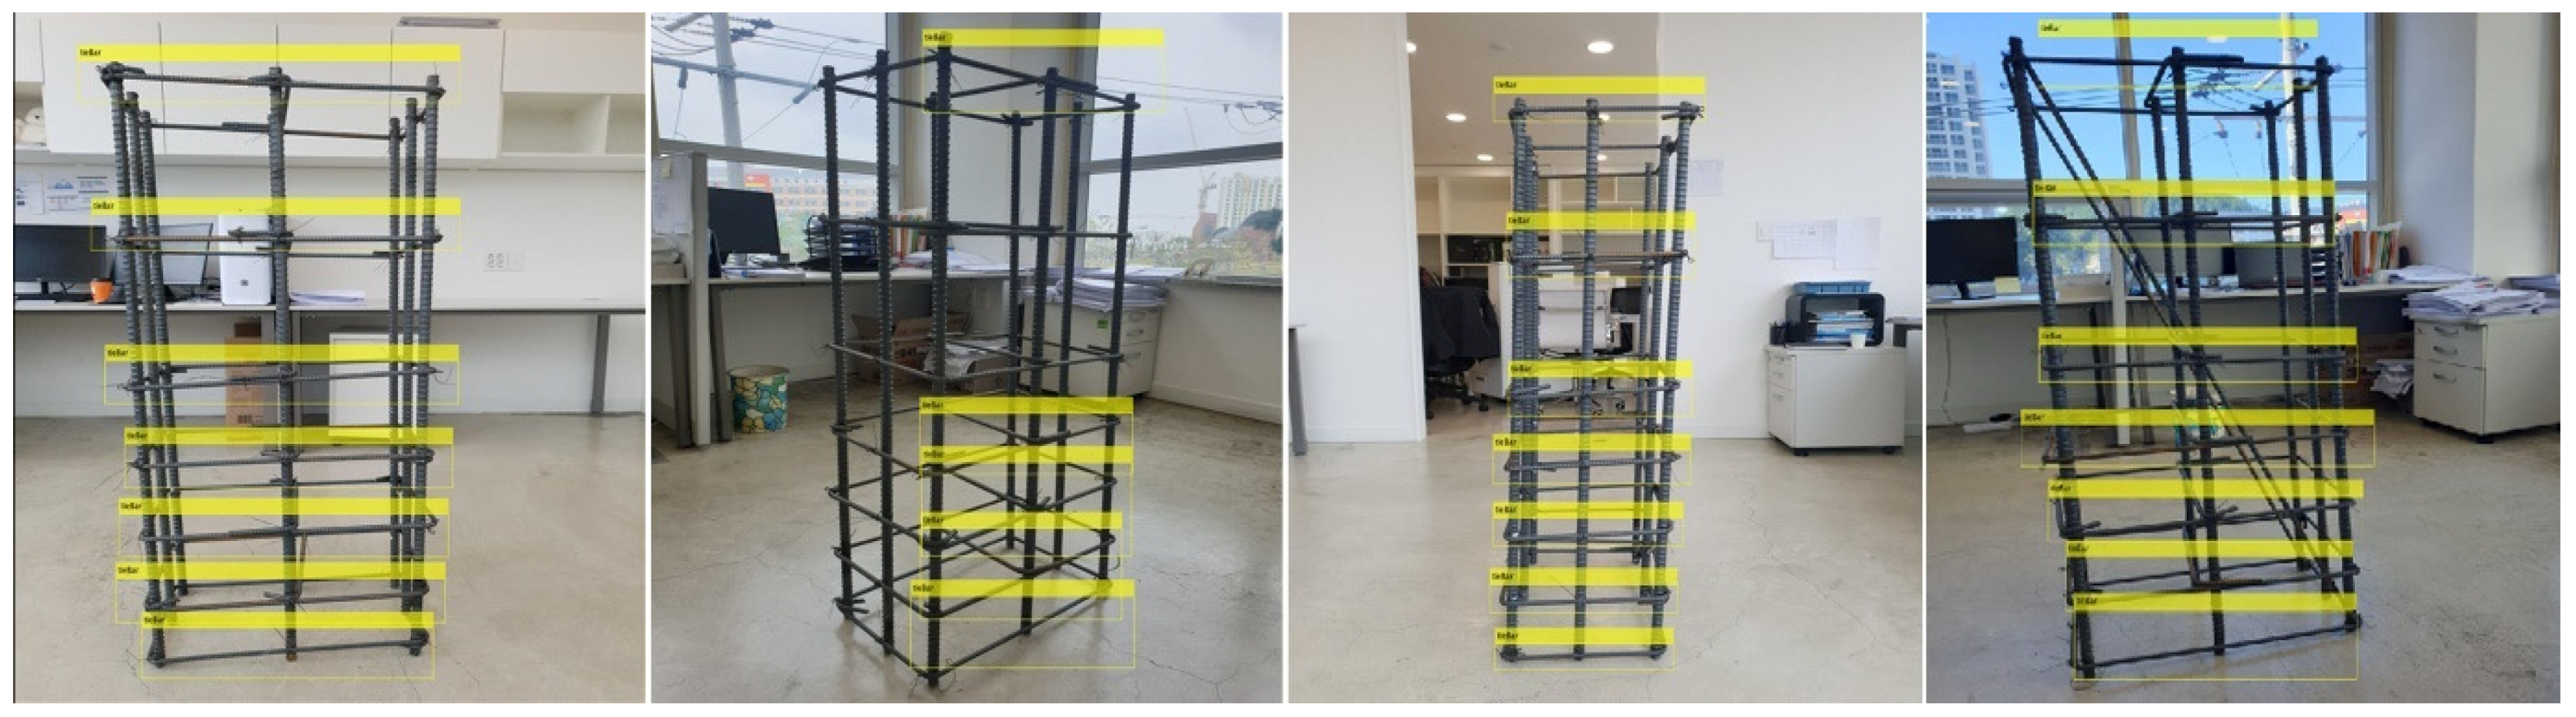
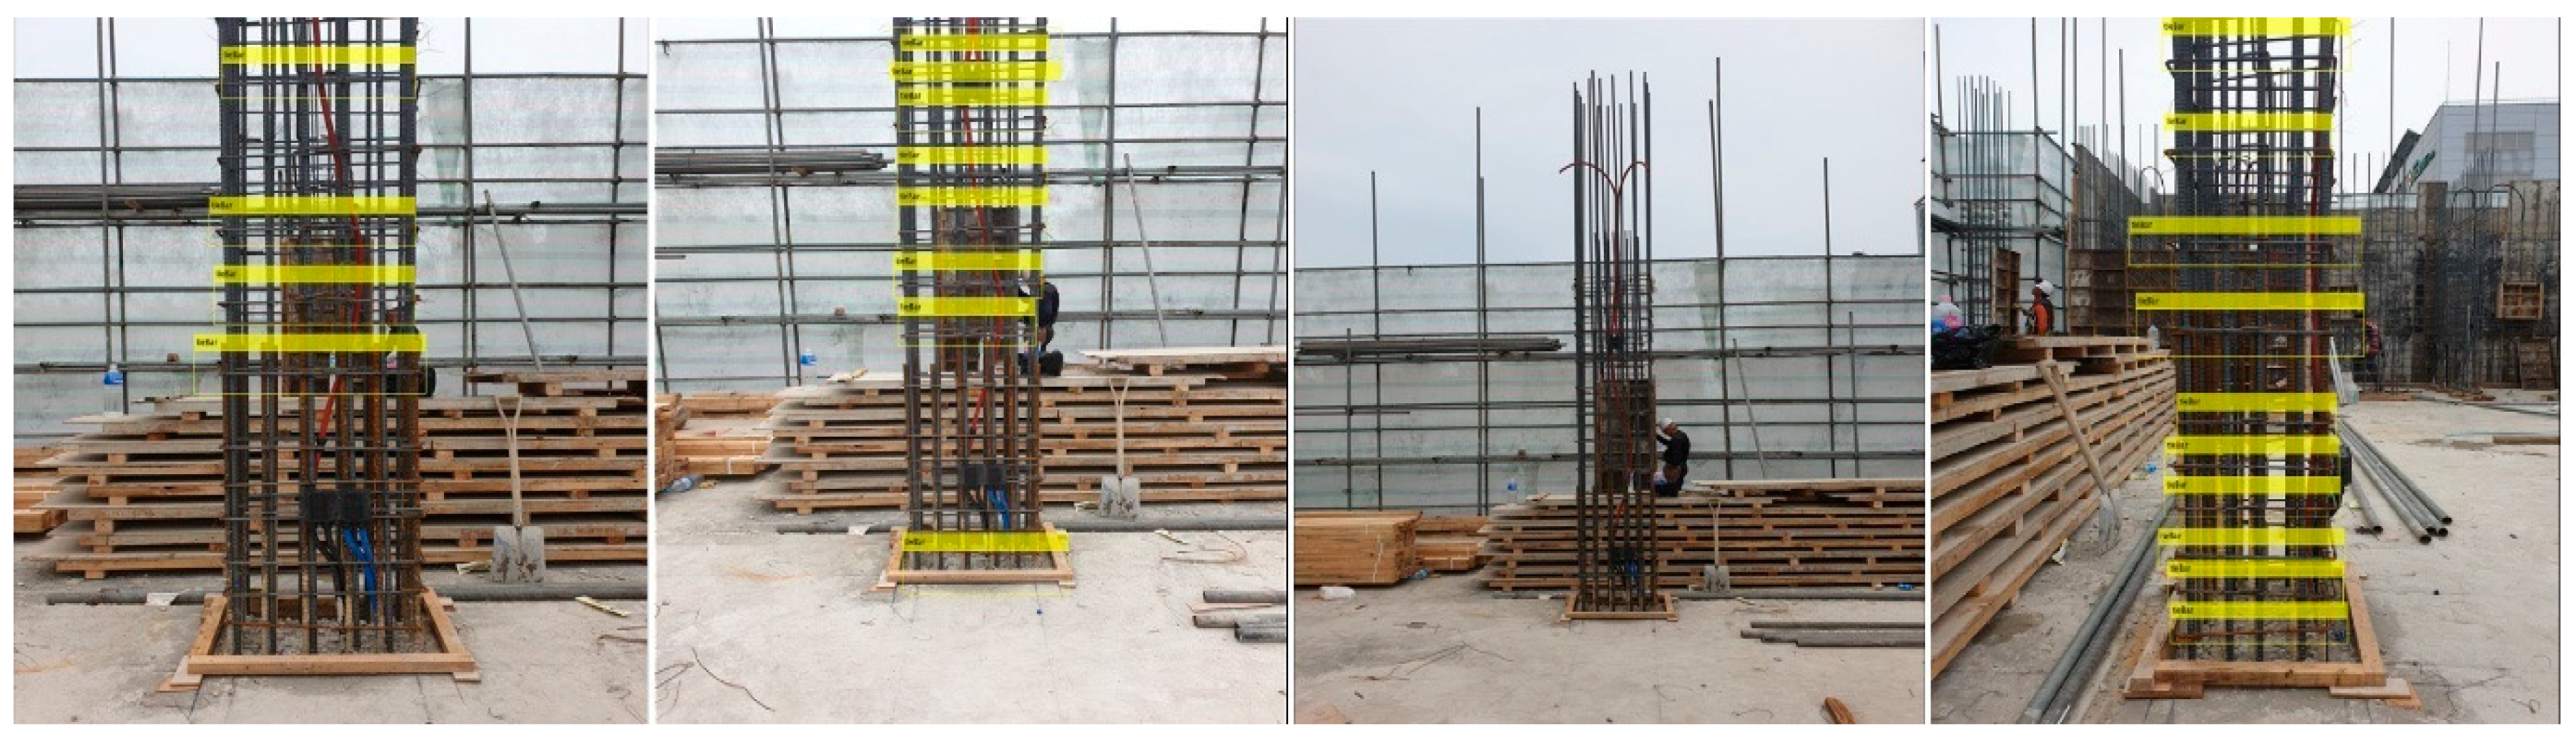
5.2.2. Application of Tie Detecting Technology Based on Deep-Learning (Validation)
6. Conclusions
- (1)
- The possibility of smart detection of column reinforcement was seen by automatically classifying the column rebars and counting the number automatically. By using deep learning technology, it was possible to achieve the purpose of the study to classify and count the ties by separating the wall rebars and the column rebars among the numerous rebars at the construction site, and also by distinguishing the vertical and horizontal rebars from the columns;
- (2)
- By using the proposed technique in the supervision work, it was possible to perform the task of counting the ties, which is difficult to actually perform. In order to increase the versatility and accuracy of the built network, image pre-processing was performed. By obtaining a high accuracy of 95.24%, it was possible to see the possibility of utilization in the actual supervision work, and the possibility of improving the efficiency of the supervision work by obtaining a time-saving effect through the application of a process that could automatically check whether or not it matches the information of the BIM;
- (3)
- It was confirmed that by partially using it at the construction site, the time was reduced by more than a few tenths of that of a manpower. This will save more time and manpower if it is used in large buildings that take a significant amount of construction time;
- (4)
- The possibility of using BIM and deep learning convergence technology could be confirmed by suggesting a process of checking whether construction site information and BIM information match.
Author Contributions
Funding
Institutional Review Board Statement
Informed Consent Statement
Data Availability Statement
Conflicts of Interest
References
- The Enforcement Decree of the Building Act (Article 91-3 (1) 5 and 6) (Cooperation with Relevant Specialized Engineers). Available online: http://www.law.go.kr/LSW/eng/engLsSc.do?menuId=2§ion=lawNm&query=building+act&x=34&y=24#EJ91:3 (accessed on 29 April 2022).
- Joongang Daily. Available online: https://news.joins.com/article/22123714 (accessed on 29 April 2022).
- Mckinsey Global Institute. Reinventing Construction: A Route to Higher Productivity; McKinsey Global Institute: South Tower, Singapore, 2017. [Google Scholar]
- NBS: Integrated Global Platform for Everyone Involved in the Design, Supply and Construction of the Built Environment. Available online: https://www.thenbs.com/ (accessed on 29 April 2022).
- Li, C.Z.; Zhong, R.Y.; Xue, F.; Xu, G.; Chen, K.; Huang, G.G.; Shen, G.Q. Integrating RFID and BIM technologies for mitigating risks and improving schedule performance of prefabricated house construction. J. Clean. Prod. 2017, 165, 1048–1062. [Google Scholar] [CrossRef]
- D’Amico, F.; Calvi, A.; Schiattarella, E.; Prete, M.D.; Veraldi, V. BIM And GIS Data Integration: A Novel Approach of Technical/Environmental Decision-Making Process in Transport Infrastructure Design. Transp. Res. Procedia 2020, 45, 803–810. [Google Scholar] [CrossRef]
- Marzouk, M.; Othman, A. Planning utility infrastructure requirements for smart cities using the integration between BIM and GIS. Sustain. Cities Soc. 2020, 57, 102–120. [Google Scholar] [CrossRef]
- Bahri, H.; Kracmarik, D.; Moezzi, R.; Kočí, J.K. Efficient Use of Mixed Reality for BIM system using Microsoft HoloLens. IFAC Pap. 2019, 52, 235–239. [Google Scholar]
- Krizhevsky, I.; Sutskever, I.; Hinton, G.E. ImageNet Classification with Deep Convolutional Neural Networks. NIPS 2012, Harrahs and Harveys, Lake Tahoe, USA. Mon.–Sat. (3–8 December 2012). Available online: https://papers.nips.cc/paper/2012 (accessed on 29 April 2022).
- Girshick, R.; Donahue, J.; Darrell, T.; Malik, J. Rich feature hierarchies for accurate object detection and sementic segmentation. arXiv 2014, arXiv:1311.2524v5. [Google Scholar]
- He, K.; Zhang, X.; Ren, S.; Sun, J. Spatial Pyramid Pooling in Deep Convolutional Networks for Visual Recognition. arXiv 2015, arXiv:1406.4729v4. [Google Scholar] [CrossRef] [PubMed] [Green Version]
- Girshick, R. Fast R-CNN. arXiv 2015, arXiv:1504,08083v2. [Google Scholar]
- Ren, S.; He, K.; Girshick, R.; Sun, J. Faster R-CNN: Towards Real-Time Object Detection with Region Proposal Networks. arXiv 2015, arXiv:1506.01497v3. [Google Scholar] [CrossRef] [PubMed] [Green Version]
- Redmond, J.; Divvala, S.; Girshick, R.; Farhadi, A. You Only Looks Once: Unified, Real-Time Object Detection. In Proceedings of the CVPR 2016, Las Vegas, NV, USA, 27–30 June 2016. [Google Scholar]
- Redmon, J.; Farhadi, A. YOLO9000: Batter, Faster, Stronger. arXiv 2017, arXiv:1612.08242v1. [Google Scholar]
- Pre-Trained Deep Neural Networks (Transfer Learning). Available online: https://kr.mathworks.com/help/deeplearning/ug/pretrained-convolutional-neural-networks.html (accessed on 29 April 2022).
- SeriesNetworks. Available online: https://kr.mathworks.com/help/deeplearning/ref/seriesnetwork.html (accessed on 29 April 2022).
- DAGNetWork. Available online: https://kr.mathworks.com/help/deeplearning/ref/dagnetwork.html (accessed on 29 April 2022).


| Training Data Set | A38 | B116 | C380 | E400 | G400 | J580 |
|---|---|---|---|---|---|---|
| (a) Rebar-Making-model | 38 | 8 | 175 | 184 | 179 | 176 |
| (b) Internet | - | 29 | 58 | 58 | 58 | 200 |
| (c) On-Site | - | 79 | 139 | 139 | 139 | 177 |
| (d) Revit Model Rendering | - | - | 8 | 19 | 24 | 27 |
| Data Number | 38 | 116 | 380 | 400 | 400 | 580 |
| Network | Depth | Size (MB) | Parameter (Unit: Million) |
|---|---|---|---|
| alexnet | 8 | 227 | 61.0 |
| vgg16 | 16 | 515 | 138 |
| vgg19 | 19 | 535 | 144 |
| squeezenet | 18 | 4.6 | 1.24 |
| googlenet | 22 | 27 | 7.0 |
| inceptionv3 | 48 | 89 | 23.9 |
| densenet201 | 201 | 77 | 20.0 |
| mobilenetv2 | 54 | 13 | 3.5 |
| resnet18 | 18 | 44 | 11.7 |
| resnet50 | 50 | 96 | 25.6 |
| resnet101 | 101 | 167 | 44.6 |
| xception | 71 | 85 | 22.9 |
| inceptionresnetv2 | 164 | 209 | 55.9 |
| Feature Network | ResNet50 | Inceptionv3 | InceptionResNetv2 | ||||||||
|---|---|---|---|---|---|---|---|---|---|---|---|
| Data Numbers | A38 | B116 | B116 | B116*5 | A38 | B116 | B116 | B116*5 | A38 | B116 | B116*5 |
| Max Batch | 20 | 20 | 20 | 20 | 20 | 20 | 20 | 20 | 20 | 20 | 20 |
| Mini Batch | 4 | 4 | 8 | 8 | 4 | 4 | 8 | 8 | 4 | 4 | 8 |
| Initial Rate | 1.0 × 10⁻⁵ | 1.0 × 10⁻⁵ | 1.0 × 10⁻⁵ | 1.0 × 10⁻⁵ | 1.0 × 10⁻⁵ | 1.0 × 10⁻⁵ | 1.0 × 10⁻⁵ | 1.0 × 10⁻⁵ | 1.0 × 10⁻⁵ | 1.0 × 10⁻⁵ | 1.0 × 10⁻⁵ |
| Sort/Shuffle | shuffle | shuffle | shuffle | shuffle | shuffle | shuffle | shuffle | shuffle | shuffle | shuffle | shuffle |
| Duration | 0:04:02 | 0:09:52 | 0:08:22 | 0:43:06 | 0:04:04 | 0:15:37 | 0:09:01 | 0:44:47 | 0:10:28 | 0:28:26 | 3:35:24 |
| Result | fail | fail | fail | part success | fail | fail | fail | part success | fail | fail | part success |
| Feature Network | ResNet50 (Data Numbers: B116*5) | |||||
|---|---|---|---|---|---|---|
| Max Epoch | 20 | 20 | 20 | 20 | 20 | 30 |
| Mini Epoch | 8 | 8 | 8 | 16 | 8 | 8 |
| Initial Rate | 1.0 × 10⁻⁵ | 1.0 × 10⁻⁵ | piecewise | 1.0 × 10⁻⁵ | 1.0× 10⁻⁵ | 1.0 × 10⁻⁵ |
| Sort/Shuffle | shuffle | sort | shuffle | shuffle | shuffle | shuffle |
| Duration | 0:43:06 | 0:43:54 | 0:43:57 | - | 0:26:50 | 1:04:26 |
| Result | Part success | fail | fail | fail (GPU memory) | part success | part success |
| Feature Network | ResNet50 (Data Numbers: B116*5) | |||||
|---|---|---|---|---|---|---|
| Max Epoch | 20 | 20 | 20 | 20 | 20 | 30 |
| Mini Epoch | 8 | 8 | 8 | 16 | 8 | 8 |
| Initial Rate | 1.0 × 10⁻⁵ | 1.0 × 10⁻⁵ | piecewise | 1.0 × 10⁻⁵ | 1.0 × 10⁻⁵ | 1.0 × 10⁻⁵ |
| Sort/Shuffle | shuffle | sort | shuffle | shuffle | shuffle | shuffle |
| Duration | 0:44:47 | 0:44:05 | 0:44:48 | - | 0:29:16 | 1:05:34 |
| Result | part success | fail | fail | fail (GPU memory) | part success | part success |
| Fixed Items | Variable Items | ||
|---|---|---|---|
| Input size | 500*500 | Feature Layers | ResNet50/Inception v3 |
| Optimizer | Adam | Max Epoch | More than 20 |
| Mini batch | 8 | Training Data Set | More than 116*5 |
| Initial rate | 1.0 × 10⁻⁵ | ||
| Sort/Shuffle | Shuffle | ||
| Feature Network | Data Number | Max Epoch | Duration | Score |
|---|---|---|---|---|
| ResNet50 | C380 | 30 | 1:21:42 | 27.5 |
| C380*4 | 30 | 3:06:49 | 28 | |
| C380*5 | 30 | 4:00:47 | 29.5 | |
| E400*5 | 30 | 4:04:40 | 28 | |
| E400*6 | 30 | 5:09:22 | 28 | |
| E400*10 | 20 | 5:26:33 | 29.5 | |
| E400*10 | 30 | 8:12:08 | 36.5 | |
| G400*5 | 30 | 4:05:23 | 35 | |
| G400*6 | 30 | 4:51:54 | 35 | |
| G400*10 | 20 | 5:23:40 | 37 | |
| J580*5 | 30 | 5:39:18 | 69.5 | |
| J580*10 | 30 | 11:12:49 | 46 | |
| J580*5 | 50 | 9:29:10 | 52 | |
| J580*5 | 100 | 19:01:50 | 61 | |
| Inceptionv3 | C380 | 30 | 0:48:04 | 27.5 |
| C380*4 | 30 | 3:14:56 | 25.5 | |
| C380*5 | 30 | 3:53:08 | 46 | |
| E400*5 | 30 | 4:15:26 | 34.5 | |
| E400*6 | 30 | 5:03:30 | 20 | |
| E400*10 | 20 | 5:32:40 | 28 | |
| E400*10 | 30 | 8:14:40 | 26.5 | |
| G400*5 | 30 | 4:14:21 | 33 | |
| G400*6 | 30 | 4:53:29 | 35.5 | |
| G400*10 | 20 | 5:35:52 | 32.5 | |
| J580*5 | 30 | 5:37:59 | 62.5 | |
| J580*10 | 30 | 11:20:00 | 41.5 | |
| J580*5 | 50 | 9:30:13 | 42 | |
| J580*5 | 100 | 18:01:50 | 39 |
| Location | X1Y1 | X1Y3 | X2Y1 | X2Y3 | X3Y1 | X3Y2 |
|---|---|---|---|---|---|---|
| Column Type | C2 | C1 | C1 | C1 | C2 | C2 |
| Height | 3450 | 3450 | 3450 | 3450 | 3450 | 3450 |
| Girder Depth | 800 | 700 | 800 | 700 | 550 | 400 |
| Top/bottom Tie | HD13@150 | HD13@150 | HD13@150 | HD13@150 | HD13@150 | HD13@150 |
| Middle Tie | HD13@150 | HD13@250 | HD13@250 | HD13@250 | HD13@150 | HD13@150 |
| Location | X1Y1 | X1Y3 | X2Y1 | X2Y3 | X3Y1 | X3Y2 | Sum |
|---|---|---|---|---|---|---|---|
| DQ | 18 | 15 | 16 | 16 | 19 | 20 | 104 |
| MQ | 18 | 16 | 16 | 16 | 19 | 20 | 105 |
| Error | 0 | 1 | 1 | 2 | 0 | 1 | 5 |
| Accuracy (%) | 100 | 93.75 | 93.75 | 87.5 | 100 | 95 | 95.24 |
Publisher’s Note: MDPI stays neutral with regard to jurisdictional claims in published maps and institutional affiliations. |
© 2022 by the authors. Licensee MDPI, Basel, Switzerland. This article is an open access article distributed under the terms and conditions of the Creative Commons Attribution (CC BY) license (https://creativecommons.org/licenses/by/4.0/).
Share and Cite
Kim, T.; Hong, S.; Choo, S. Algorithm of Smart Building Supervision for Detecting and Counting Column Ties Using Deep Learning. Appl. Sci. 2022, 12, 5535. https://doi.org/10.3390/app12115535
Kim T, Hong S, Choo S. Algorithm of Smart Building Supervision for Detecting and Counting Column Ties Using Deep Learning. Applied Sciences. 2022; 12(11):5535. https://doi.org/10.3390/app12115535
Chicago/Turabian StyleKim, Taehoon, Soonmin Hong, and Seungyeon Choo. 2022. "Algorithm of Smart Building Supervision for Detecting and Counting Column Ties Using Deep Learning" Applied Sciences 12, no. 11: 5535. https://doi.org/10.3390/app12115535
APA StyleKim, T., Hong, S., & Choo, S. (2022). Algorithm of Smart Building Supervision for Detecting and Counting Column Ties Using Deep Learning. Applied Sciences, 12(11), 5535. https://doi.org/10.3390/app12115535