Article

Characteristics of Acoustic Emission Caused by Intermittent Fatigue of Rock Salt

1
State Key Laboratory of Coal Mine Disaster Dynamics and Control, Chongqing University, Chongqing 400044, China
2
Chongqing Survey Institute, Chongqing 401121, China
3
Chongqing Geotechnical Engineering Technology Research Center, Chongqing 400010, China
4
China Institute of Water Resources and Hydropower Research, Beijing 100038, China
5
Research Center on Flood and Drought Disaster Reduction, Ministry of Water Resources, Beijing 100038, China
*
Authors to whom correspondence should be addressed.
Appl. Sci. 2022, 12(11), 5528; https://doi.org/10.3390/app12115528
Submission received: 9 May 2022 / Revised: 25 May 2022 / Accepted: 27 May 2022 / Published: 29 May 2022
(This article belongs to the Special Issue Mechanical Properties of Rocks under Complex Stress Conditions)

Abstract

:
This paper compares classic (continuous) fatigue tests and fatigue tests carried out with time intervals of no stress in rock salt using a multifunctional testing machine and acoustic emission equipment. The results show that time intervals of no stress have a strong impact on the fatigue activity of rock salt. In fatigue tests with intervals, the residual strain in circles following an interval (α circles) is generally larger than that in circles before the intervals (β circles). The insertion of a time interval with no stress in the fatigue process accelerates the accumulation of residual strain: the longer the interval, the faster the residual strain accumulates during the fatigue process and the shorter the fatigue life of the rock salt. α circles produce a greater number of acoustic emission counts than β circles, which demonstrates that residual stress leads to internal structural adjustment of rock salt on a mesoscopic scale. During intervals of no stress, acoustic emission activity becomes more active in α circles because of reverse softening caused by the Bauschinger effect, which accelerates the accumulation of plastic deformation. A qualitative relationship between the accumulated damage variable and the time interval is established. A threshold in the duration of the time interval exists (around 900 s).

1. Introduction

Rock salt is a near-perfect material for waste disposal and oil storage repositories because of its properties of excellent ductility [1,2], good self-healing features after being damaged [3,4,5,6,7], and low permeability [8,9]. Stressed states in underground engineering are extremely complicated: gas injection occurs periodically, and production is not continuous. Therefore, time intervals exist among the circles during the operation of gas storage caverns. The rheological responses of rock salt [10,11] determine the time interval duration that affects the mechanical fatigue behavior.
Since Goodman identified the Kaiser effect in rock materials [12], acoustic emission (AE) has been widely used in research because of its unique ability to explore microscopic mechanisms of rock behavior. This technique is very effective in identifying micro- and macro-defects and their temporal evolution due to fatigue in several materials [13]. Scholars around the world have studied the AE characteristics of rock salt and other materials in fatigue experiments. In experiments on rock salt, Wang et al. [14] studied the microstructural variations and damage evolvement of salt rock under cyclic loading. Li et al. [15] observed that AE counts exhibit obviously distinct characteristics in different stages of crack propagation. Čtvrtlík et al. [16] applied AE to examine and classify different deformation mechanisms. Loukidis et al. [17] discovered marble specimens under various loading schemes using acoustic emission in terms of F-function. Maji et al. [18] used AE to develop a statistical model of crack propagation that assesses the distance and angular relationship of neighboring cracking events arranged in their temporal order of occurrence. Dimos et al. [19] demonstrated the capability of AE to predict the fracture of marble specimens using F-function. Md Nor N et al. [20] studied the fatigue damage to a reinforced concrete beam using AE during fatigue. Although application of AE to fatigue studies appears mature and complete, little work has been carried out on the effect of fatigue applied with intermittent time intervals.

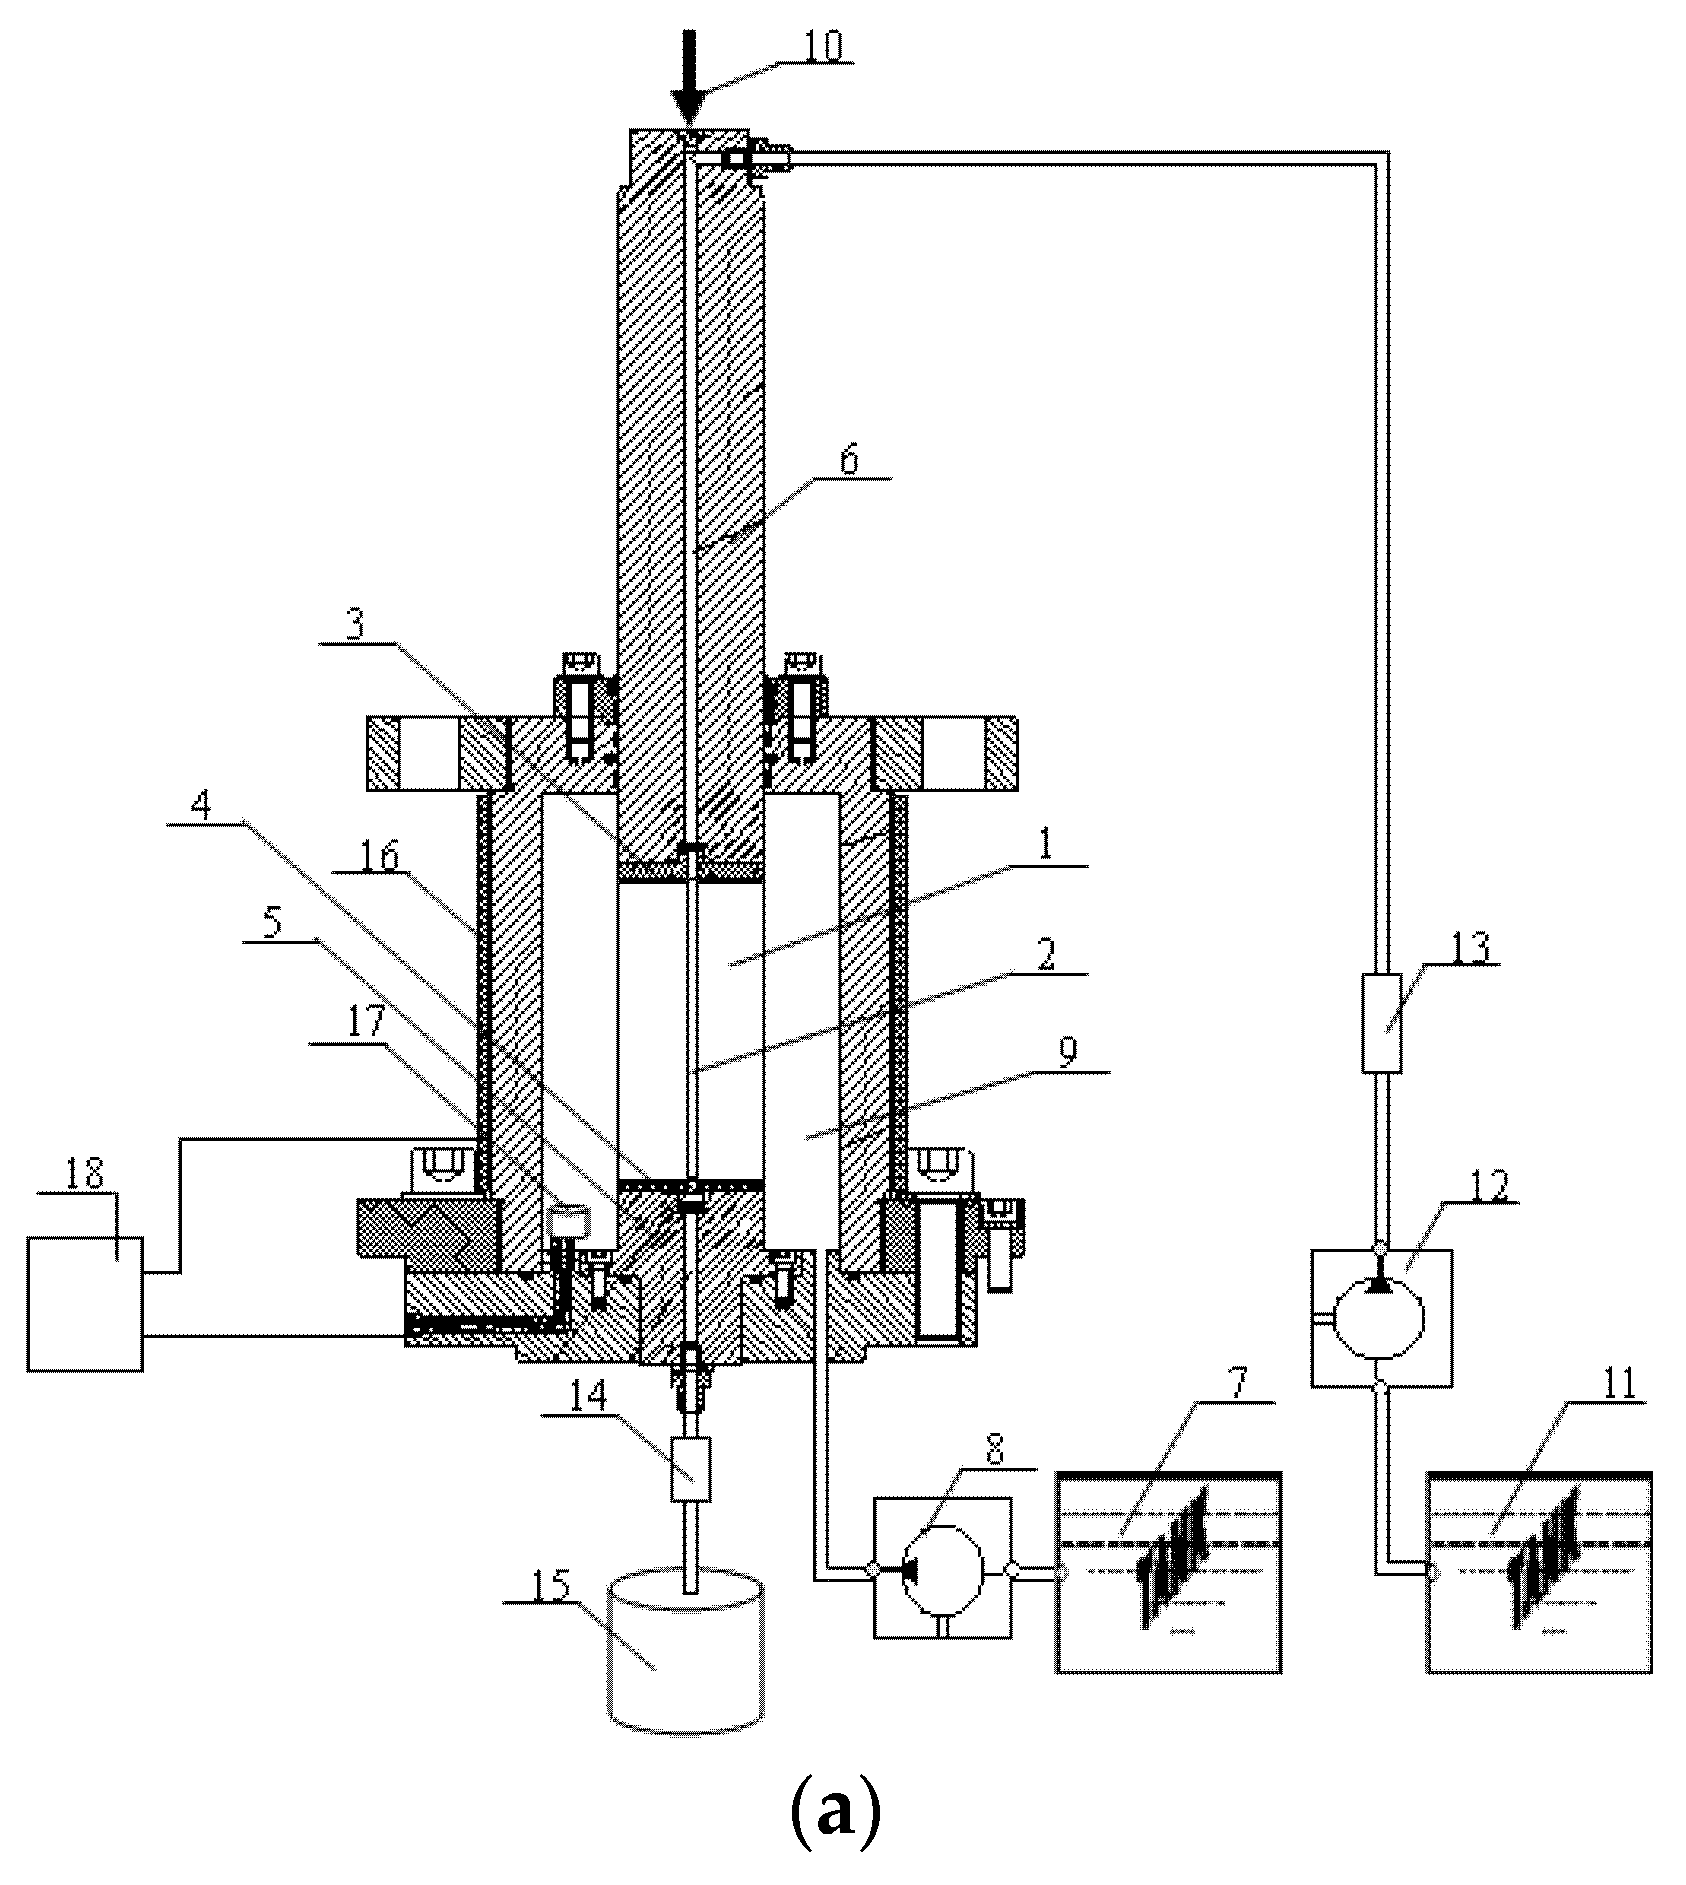
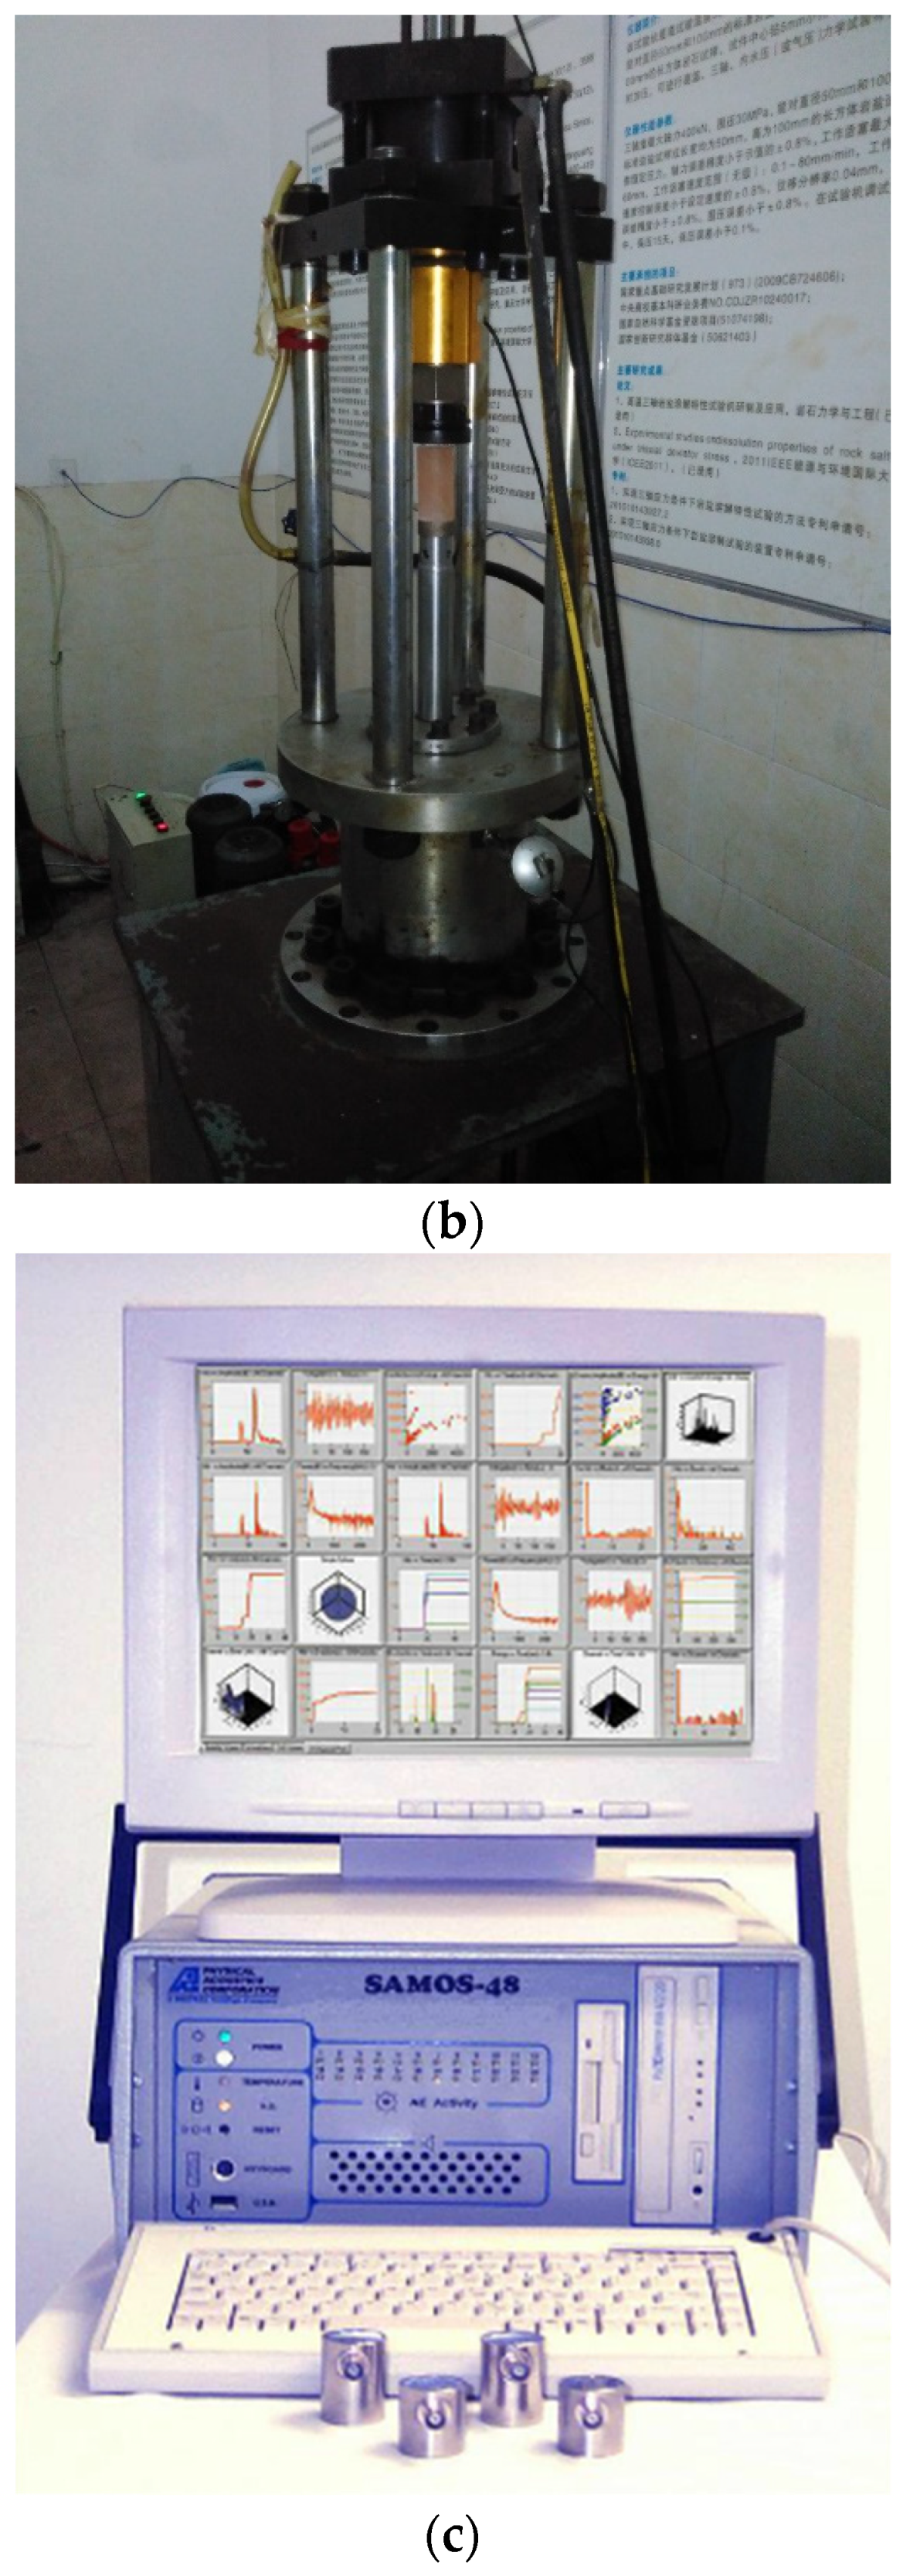
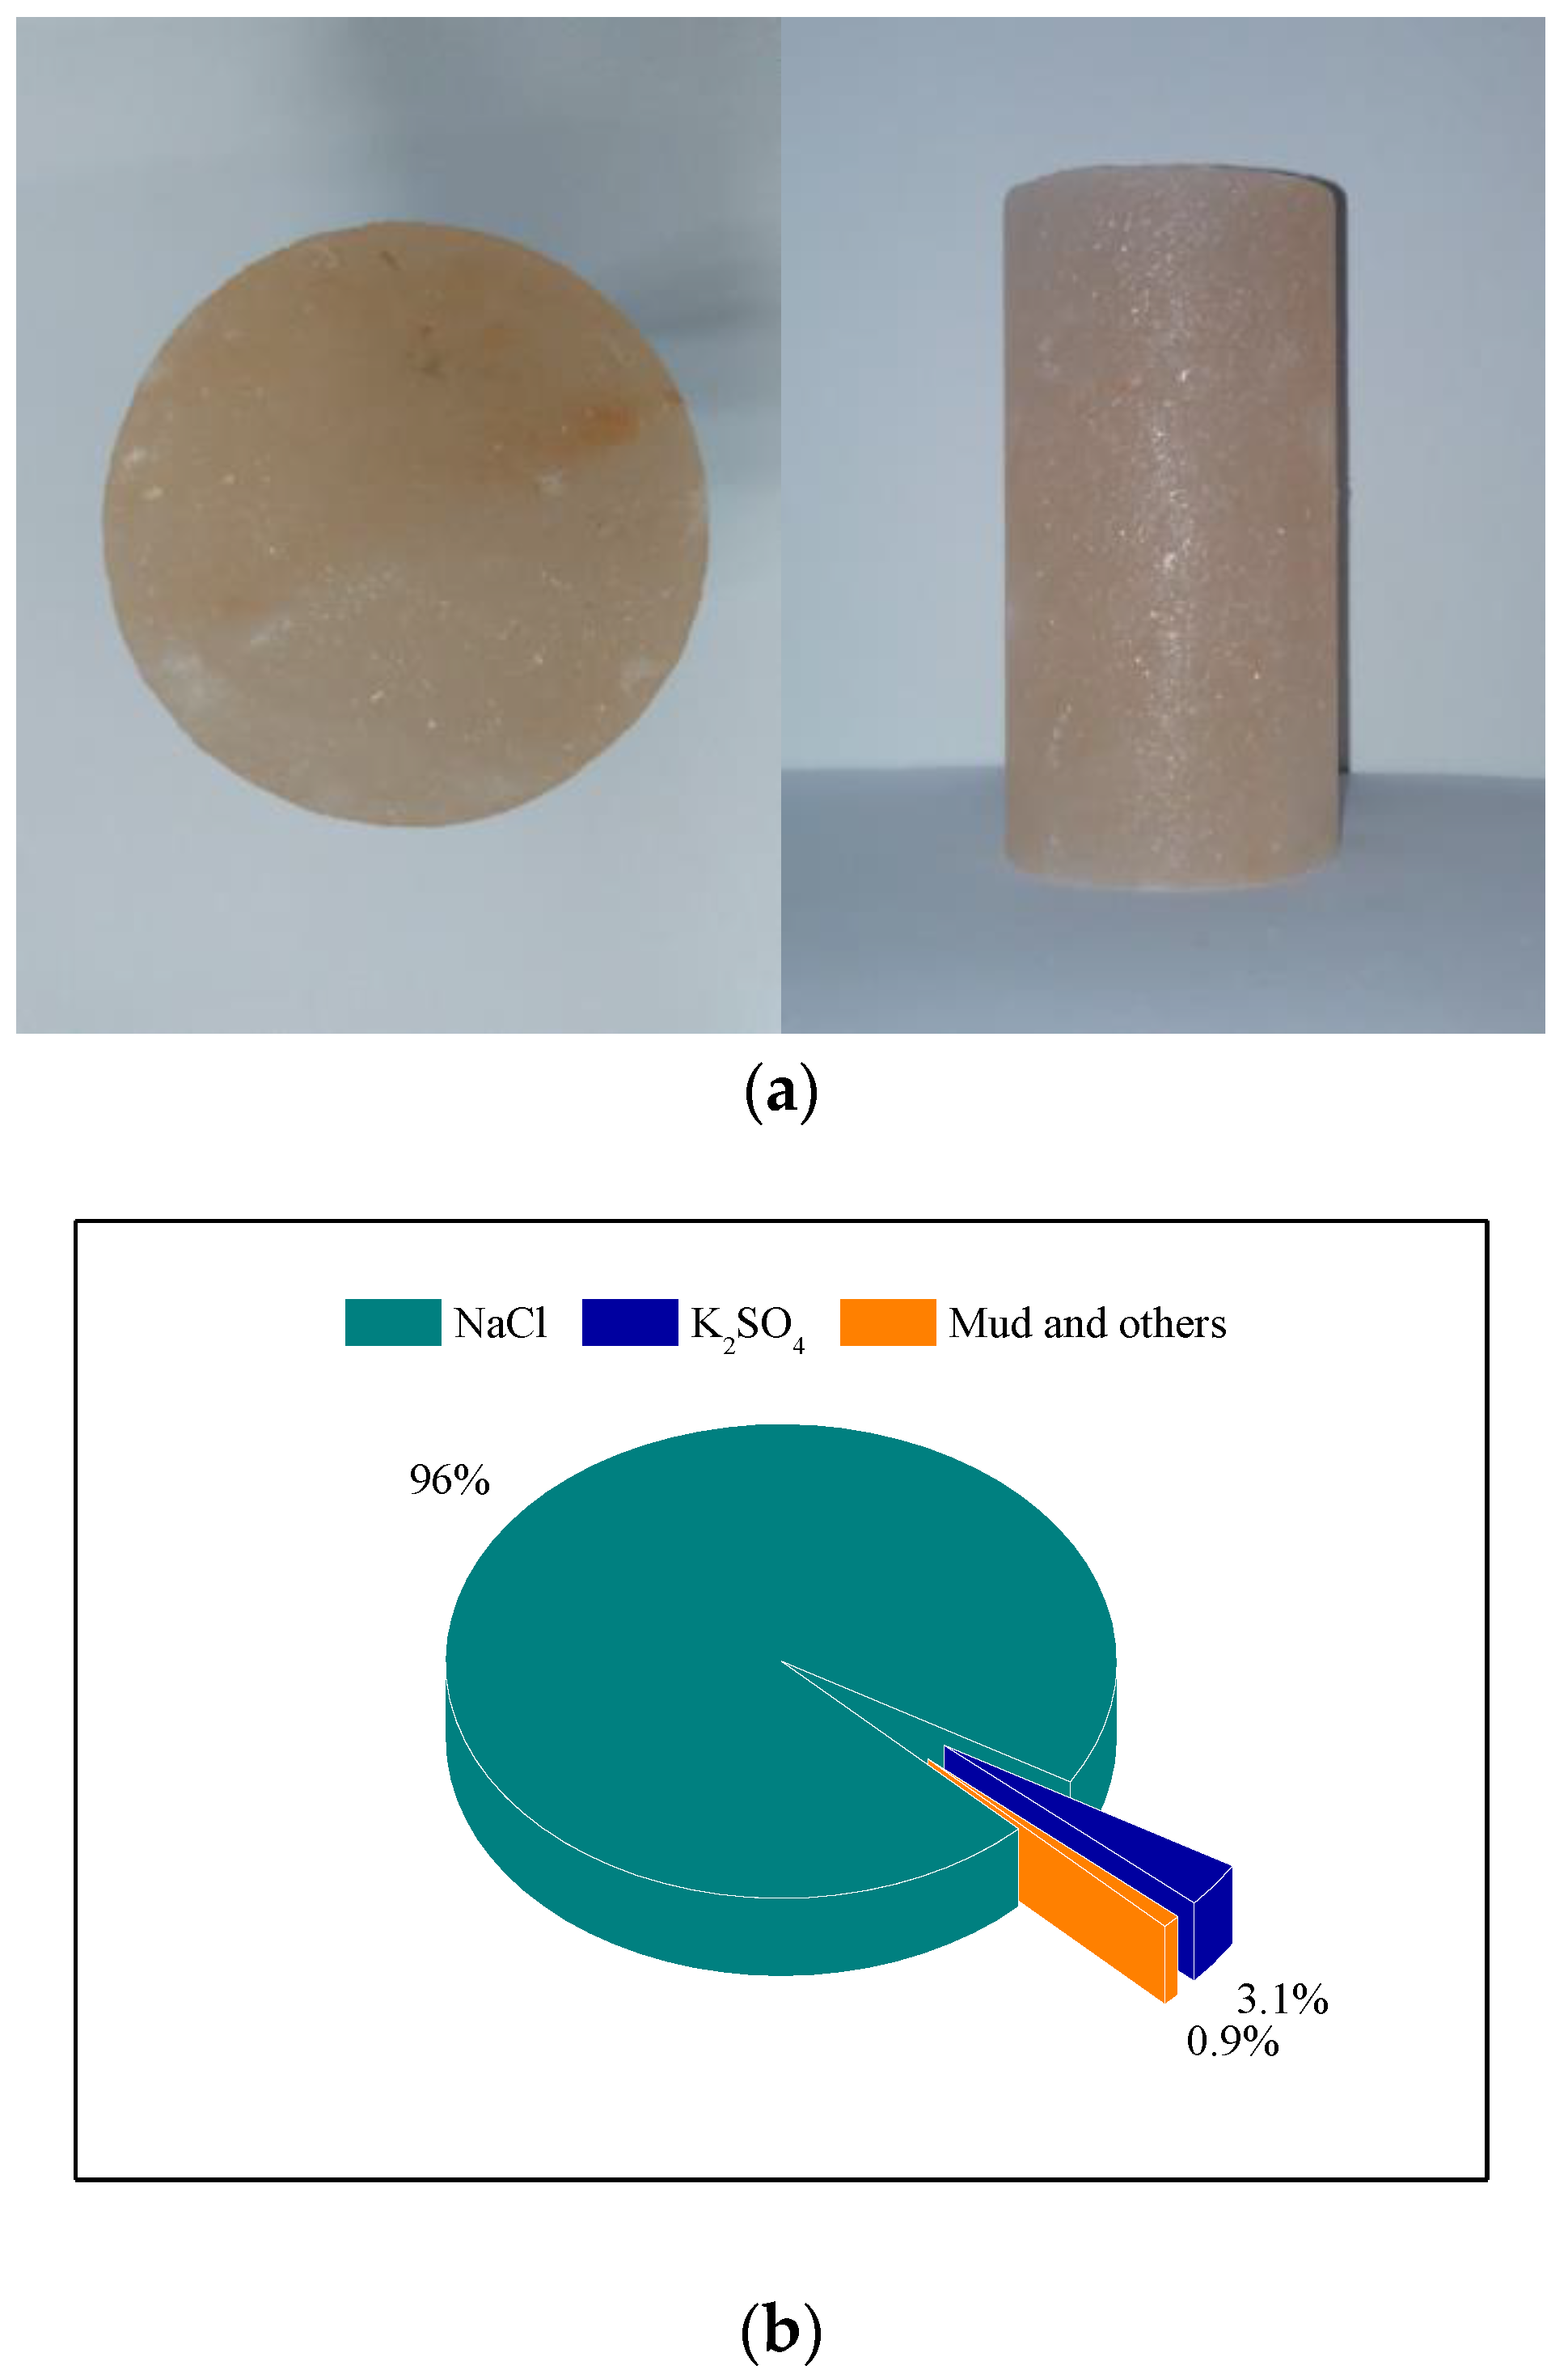
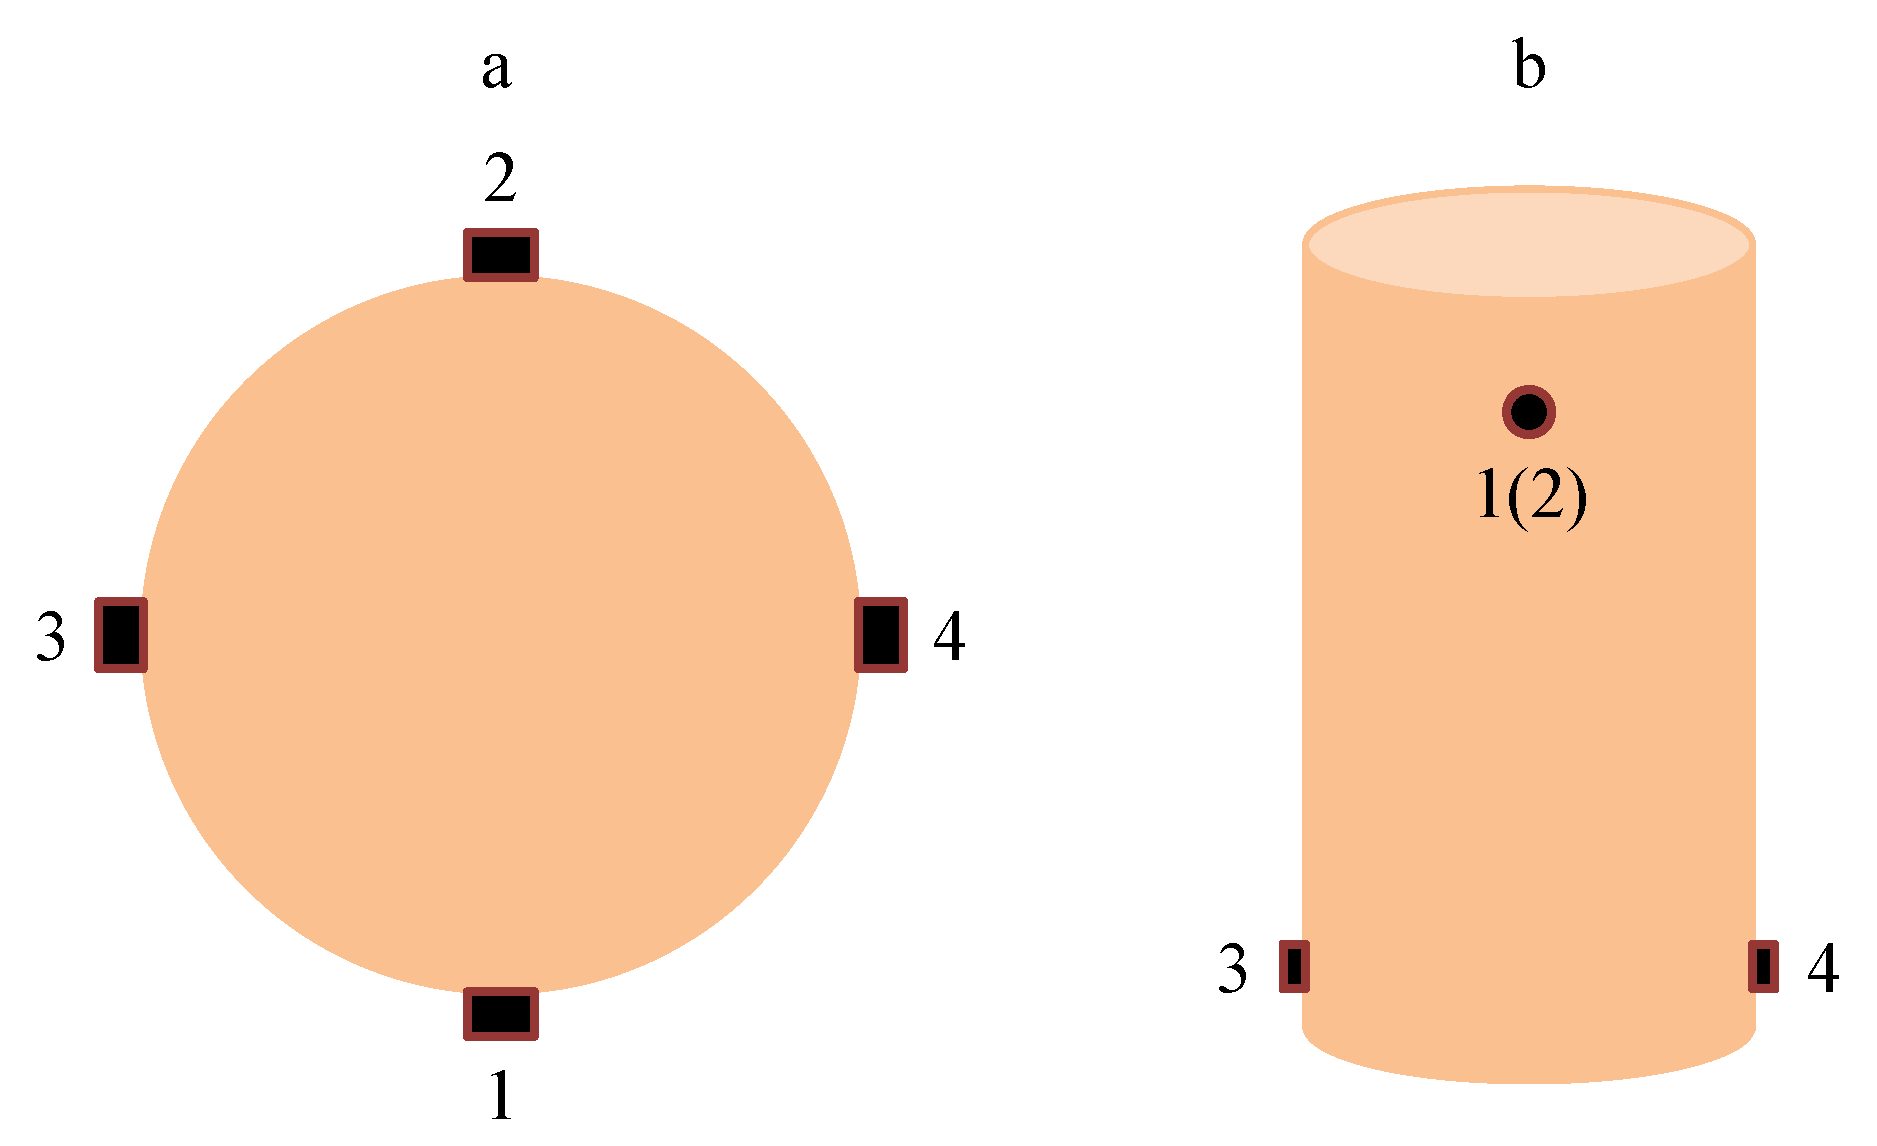
2. Experimental Apparatus and Samples
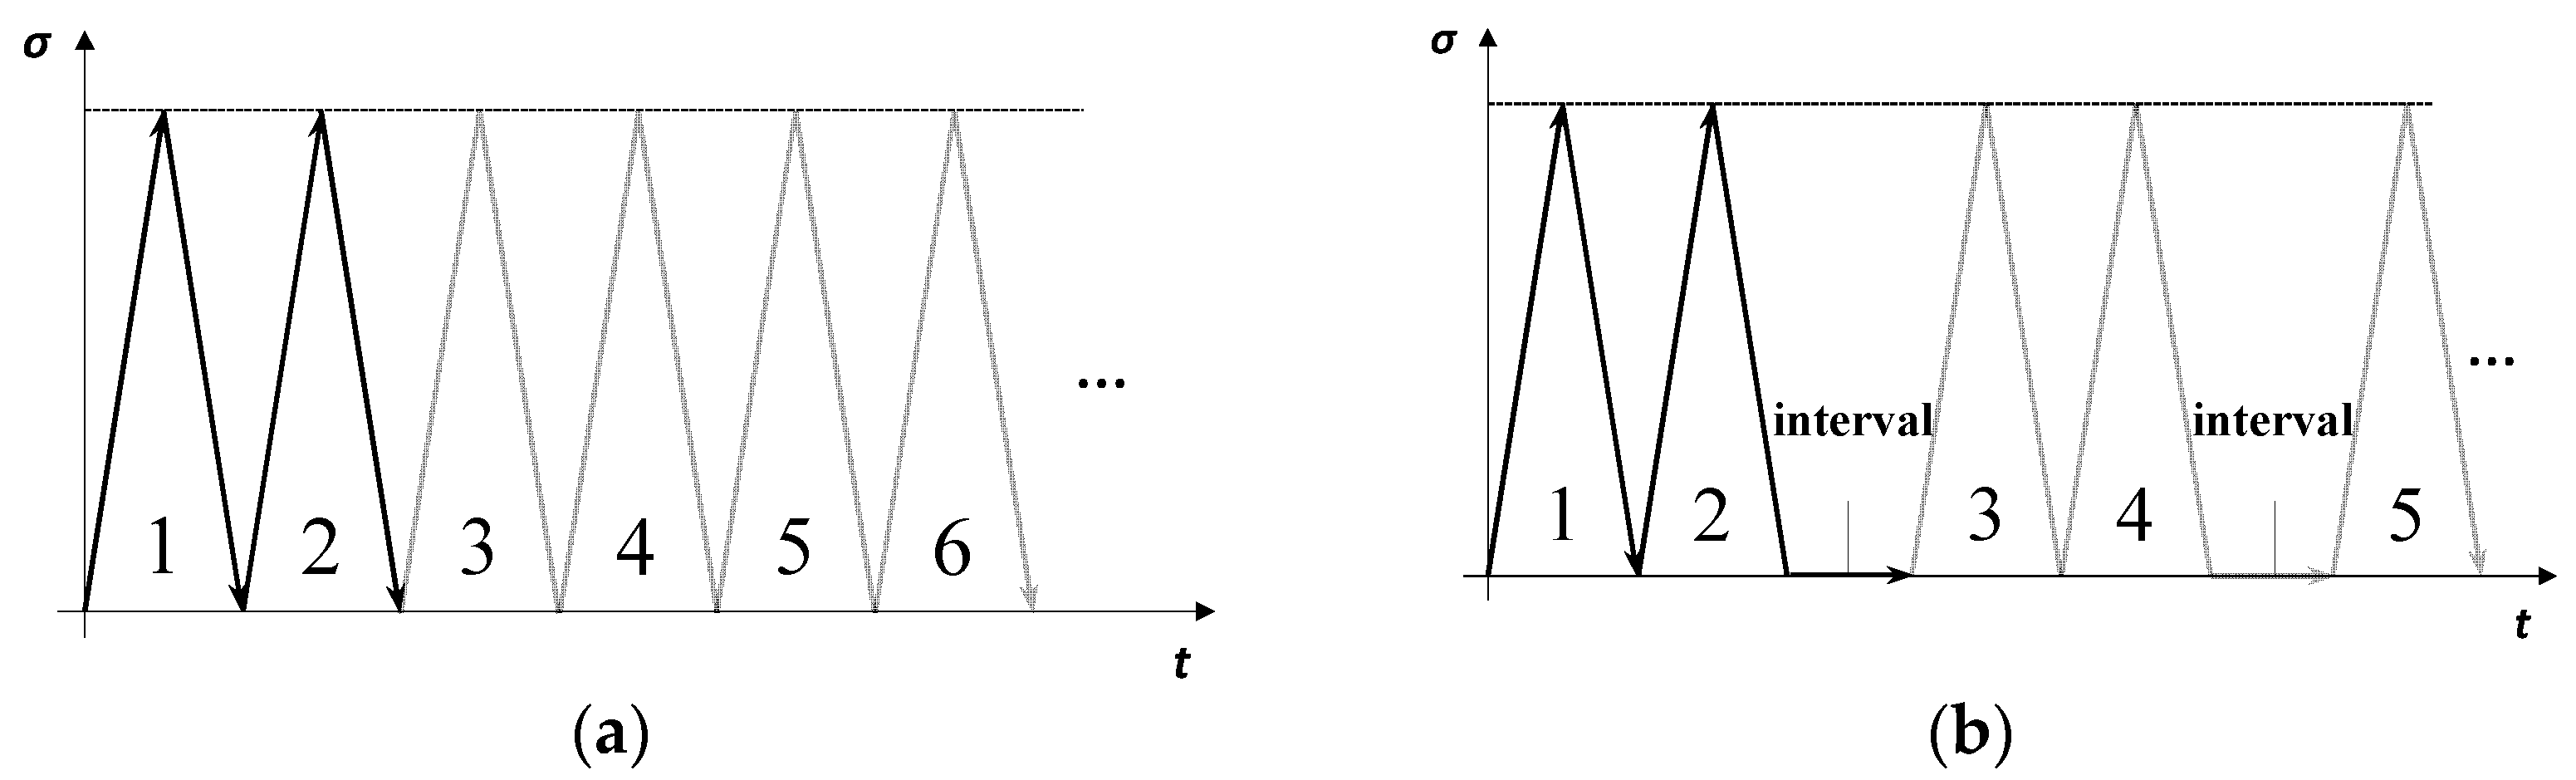
The experiments were conducted using a high-temperature triaxial loading test system, developed in a laboratory, operated under uniaxial compression by monotonous or cyclic loading (Figure 1a,b). The maximum axial force used was 400 kN, the highest confining pressure applied was 30 MPa, and the highest temperature used was 100 °C. During the loading process, AE data were collected and analyzed using an analysis system manufactured by Physical Acoustic Corporation (Princeton Junction, West Windsor Township, NJ, USA) (Figure 1c). The monitoring positions of the AE sensors are shown in Figure 2.
The rock salt samples were collected from the Khewra salt mine in Pakistan and were cut into standard cylindrical blocks with a diameter of 50 mm and length of 100 mm. The real samples and the mineral contents of the salt are listed in Figure 3a,b.

3. Methodology

At the beginning of each experiment, the uniaxial compressive strength (σucs) of this rock salt was measured as 41.22 MPa. The cyclic loading speed, upper stress, and lower stress were set as 2 kN/s, 35.04 MPa (85% of σucs), and almost 0 MPa, respectively. The stress paths of classic fatigue and fatigue as a function of time interval are shown in Figure 4. Criteria and control groups were established as a function of tested time intervals. The classic fatigue experiment was conducted in the criteria group. The stress paths of the control groups as a function of time interval are shown in Figure 4b, in which a defined time interval followed every two adjacent loading periods. The durations of the time interval were set as constant values of 5, 10, 15, 30, 60, 120, 600, 900, and 1200 s. To improve the precision of the data and reliability of the results, each experiment was carried out in triplicate.

4. Results and Discussion

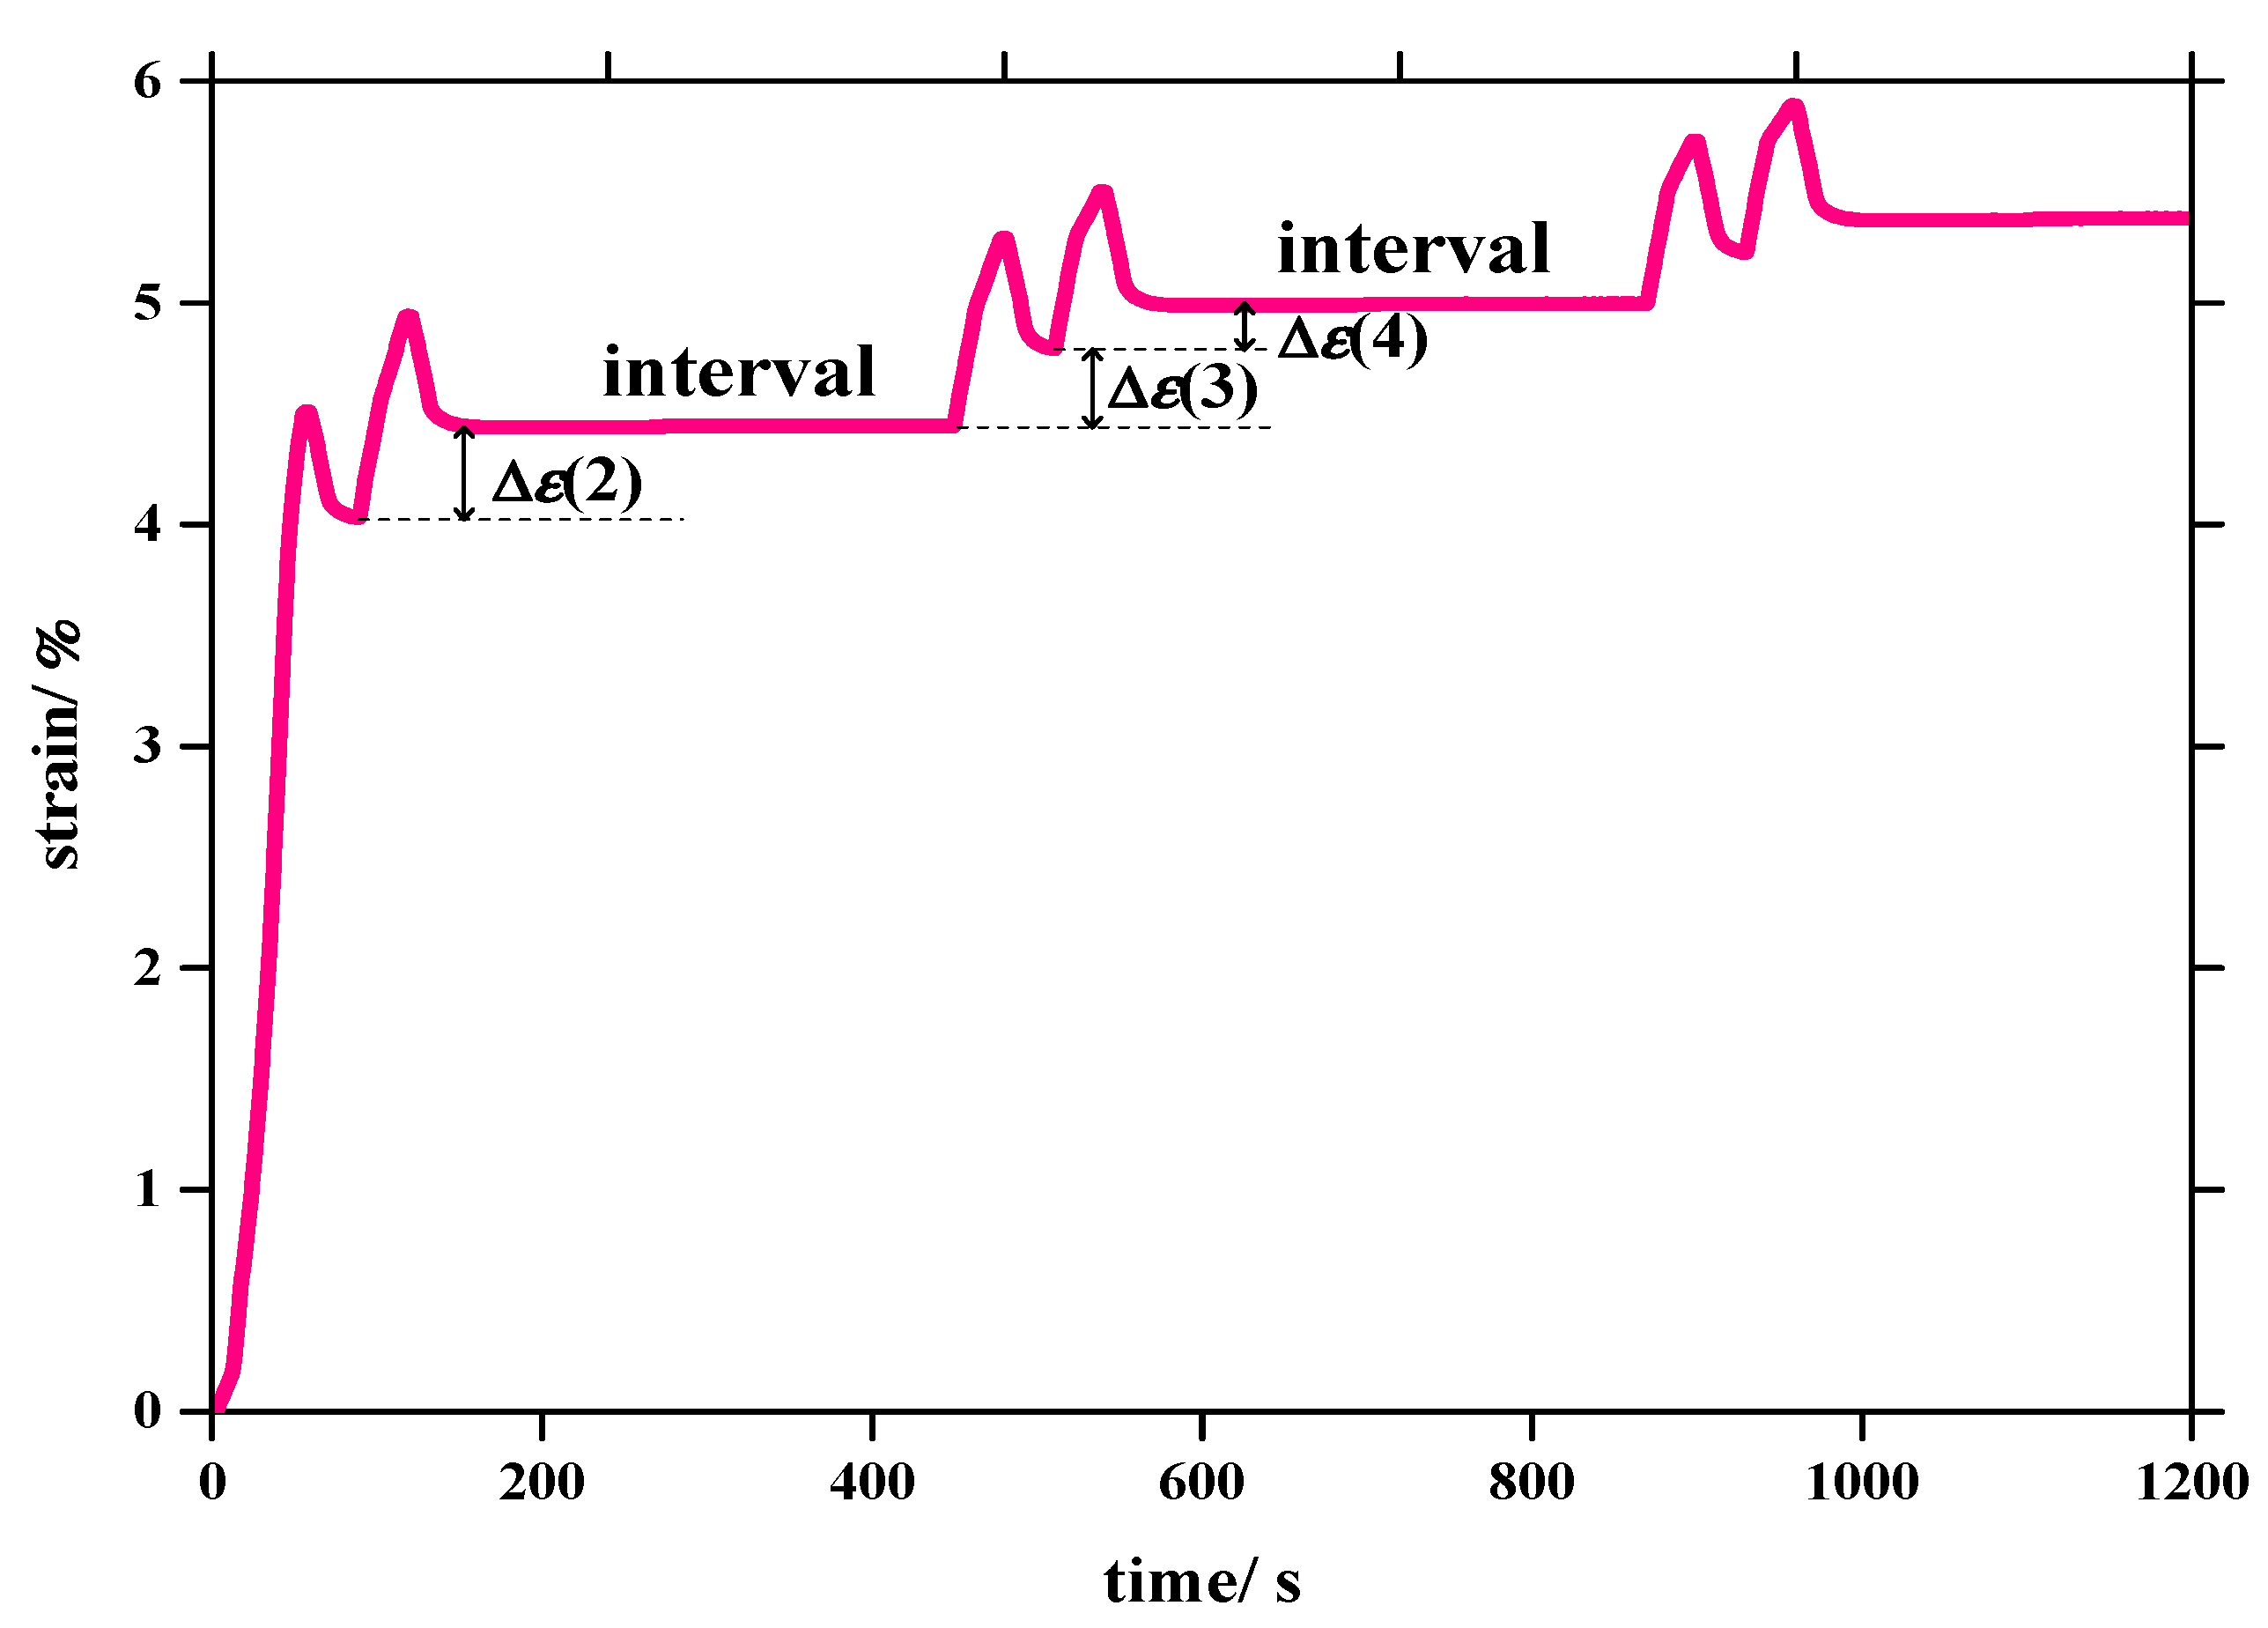
4.1. Characteristics of Residual Deformation

Figure 5 shows the strain paths of the first six cycles for the control experiments. Δε(i) is the residual strain produced by the ith cycle; Δε(2), Δε(4), … are defined as the residual strains before the interval produced by even cycles; Δε(3), Δε(5), … are defined as the residual strains after the interval produced by odd cycles. The cycle before an interval is recorded as a β circle, and the cycle after an interval is recorded as an α circle.
This approach was used to understand the development of residual strain in the material (Figure 5). Figure 6 shows the difference in behavior when an interval is inserted into the classic fatigue test: in Figure 6a, the development of the odd and even circles is coincident in the classic fatigue test but are offset when an interval of 5 s is inserted (Figure 6b).
An exponential function y = a e b x + C was chosen to fit the data of Figure 6b, with y = C as the horizontal asymptote of the function when x + , which represents the average steady residual strain. In these experiments, fatigue life is defined as the number of completed loading cycles attained when the sample breaks. The fatigue lives of samples subjected to the interval fatigue tests and the C values of the fitted curves of residual strain are listed in Table 1. The value of (Codd − Ceven) is always greater than zero, which means that the residual strain of an α circle is always larger than that of the adjacent preceding β circle in the interval fatigue tests. The values of Codd and Ceven increase with the duration of time interval, which means that the time interval accelerates the accumulation of residual strain caused by fatigue. The value of (Codd − Ceven) also increases as the interval duration increases. The mathematical manifestation of this phenomenon is that the gap between the fitted curves of residual strain for α and β circles (Figure 6) increases; physically, this means that the longer the interval, the faster the residual strain accumulates. The most important aspect of Table 1 is that a strong correlation between fatigue life and interval duration is demonstrated: the fatigue life decreases as the interval grows. From a macroscopic point of view, the main reason for fatigue fracture of a rock is the accumulation of residual strain [21]. The inclusion of a time interval with no stress accelerates the accumulation of residual strain, which leads to the decrease in fatigue life.
Another noticeable phenomenon as shown in Table 1 is that when the time interval exceeds approximately 900 s, the fatigue life of the salt no longer decreases, but, conversely, increases with further extension of the interval duration because of the particular self-healing capability of this salt [3,4,5,6,7].

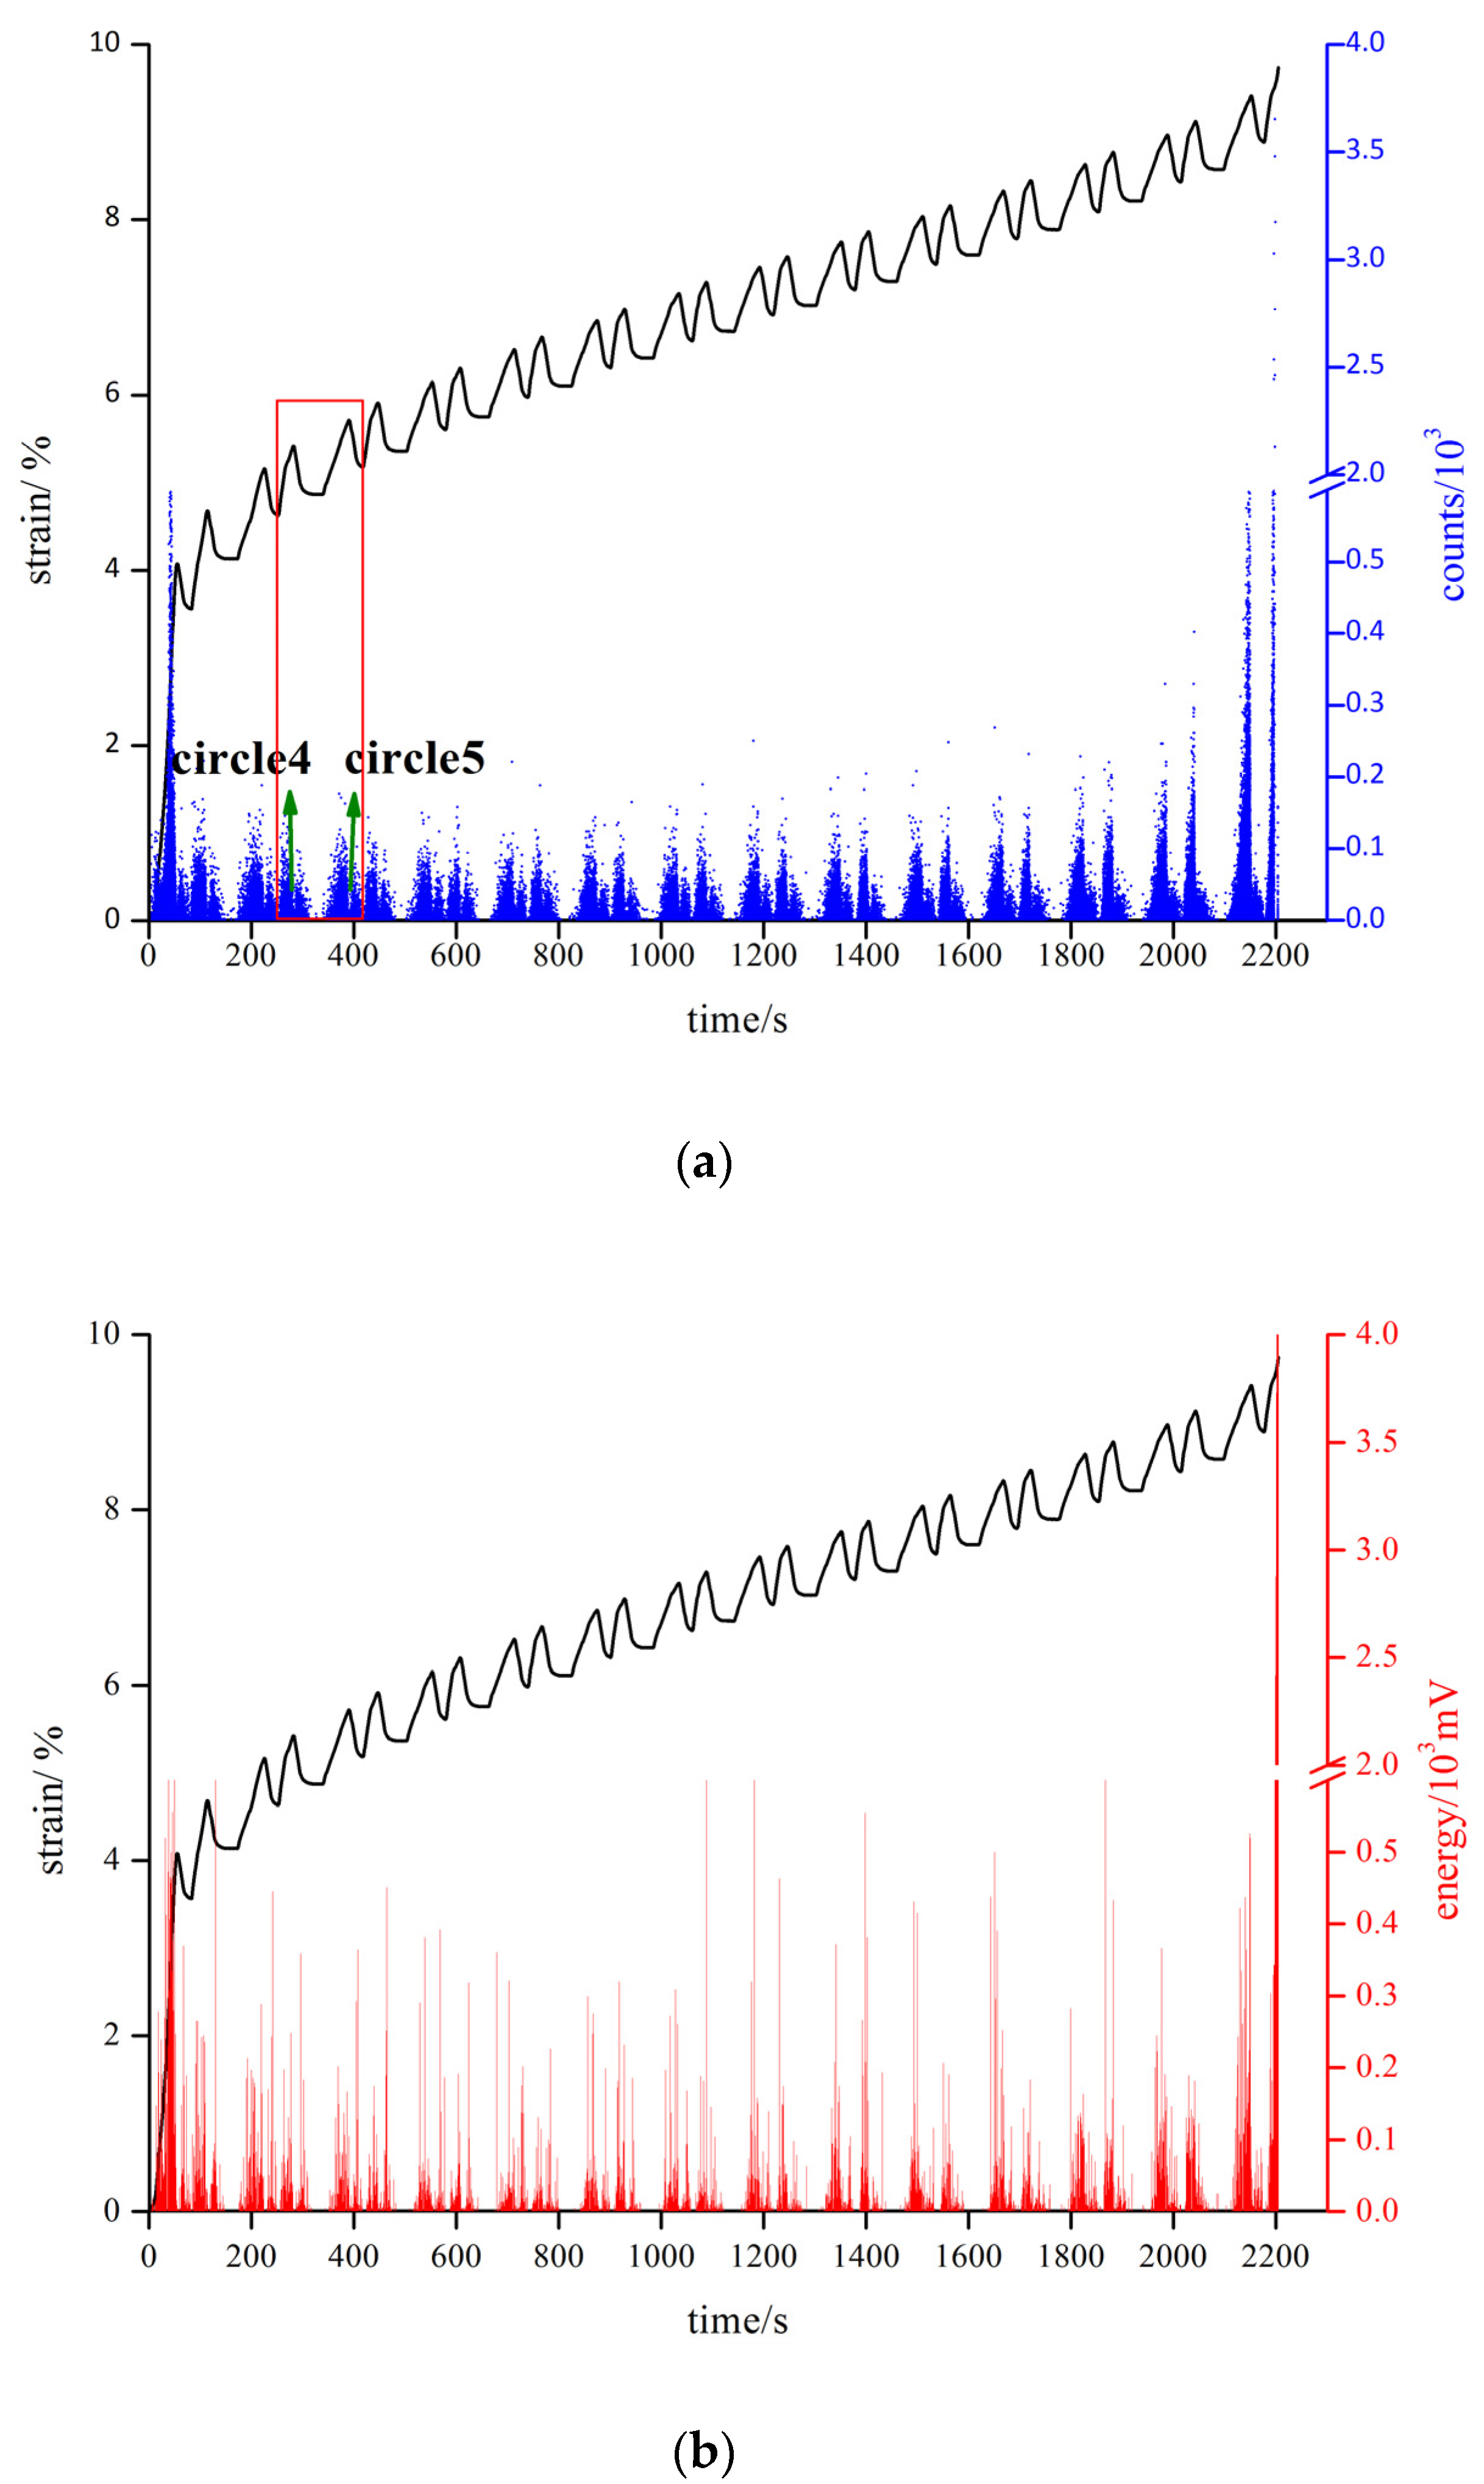
4.2. General Features of Acoustic Emission

Macro-scale rock performance is largely influenced by complex topological geometric defects [22,23,24]. The progress of non-equilibrium kinetics directly affects the macroscopic characteristics of the rock. Figure 7 shows the number of AE counts, AE energy, and the strain curve for tests carried out using an interval of 30 s. The trends of the AE counts and energy correlate strongly with the strain curve during fatigue.
The number of AE counts produced by the first circle is greater than that produced by the stable fatigue circle. The reason is that the original complete internal crack in the rock expands after the compaction stage arising from the initial damage [25]. The crystals begin to shear, moving along grain boundaries, and transcrystalline cracks emerge as the atoms in the crystals begin to migrate [26]. A representative scanning electron microscope (SEM) image of the first circle is presented in Figure 8b, during which the AE phenomenon is very active. The permanent migration of atoms in crystals symbolizes the rock salt’s plastic deformation, which predicts the formation of residual strain. During the final phase of fatigue, the AE phenomenon is more active than that during stationary fatigue, and maximum AE counts and energy release are recorded. Initial cracks and a large number of transcrystalline cracks produced by fatigue converge to penetrate into the cracks in this phase [25]. Figure 8c shows that a large number of cracks develop within a short time, which crush the internal structure of the rock salt. This total internal instability leads to ultimate failure of the rock salt, during which large amounts of energy are released and the AE phenomenon is abnormally active. Figure 9 shows the AE features of tests carried out at other time intervals: the behavior is similar to that shown in Figure 7.
The red box area in Figure 7 is defined as a group for the purpose of comparing the AE features of intervals before and after this period. Circle 4 produced the AE counts before the interval and circle 5 produced the AE counts after the interval. Figure 10 shows enlarged detail of the period between 650 and 900 s in Figure 7. The AE counts corresponding to the peak strain in each circle decreased sharply to zero and then gradually increased as the strain decreases (shown by the red dotted lines in Figure 10). The reason for this phenomenon is that there is always a certain delay (about 0.3 s) between the computer instruction and the response of the hydraulic system in the electro-hydraulic servo system: AE counts are not generated during this delay because of the Kaiser effect [12], and a gap manifests during the development of AE counts, although this does not influence the test results.
The sum of the AE counts produced by the α circle is larger than that of the β circle, and the AE phenomenon is more active (according to Figure 7, Figure 9 and Figure 10), which sustains the entire process except at the beginning and end of fatigue. The same contrast exists for tests carried out at other intervals: the longer the interval, the more obvious the contrast, which means that same types of active forces take part in the microstructural adjustment of rock salt during the non-stressed phase. In dislocation theory, slippage between crystals is encouraged by the movement of dislocations [27]. Partial dislocations are restrained and delayed in moving crystals, which leads to a difference in slip distance at each end of the slip plane, thereby producing residual stress. Irani et al. [28] postulated that residual stress caused by the interaction between grains exists universally in strain hardening of rock salt. The residual stress may be the direct cause of grain movement and self-adjustment in rock salt during the non-stressed intervals.

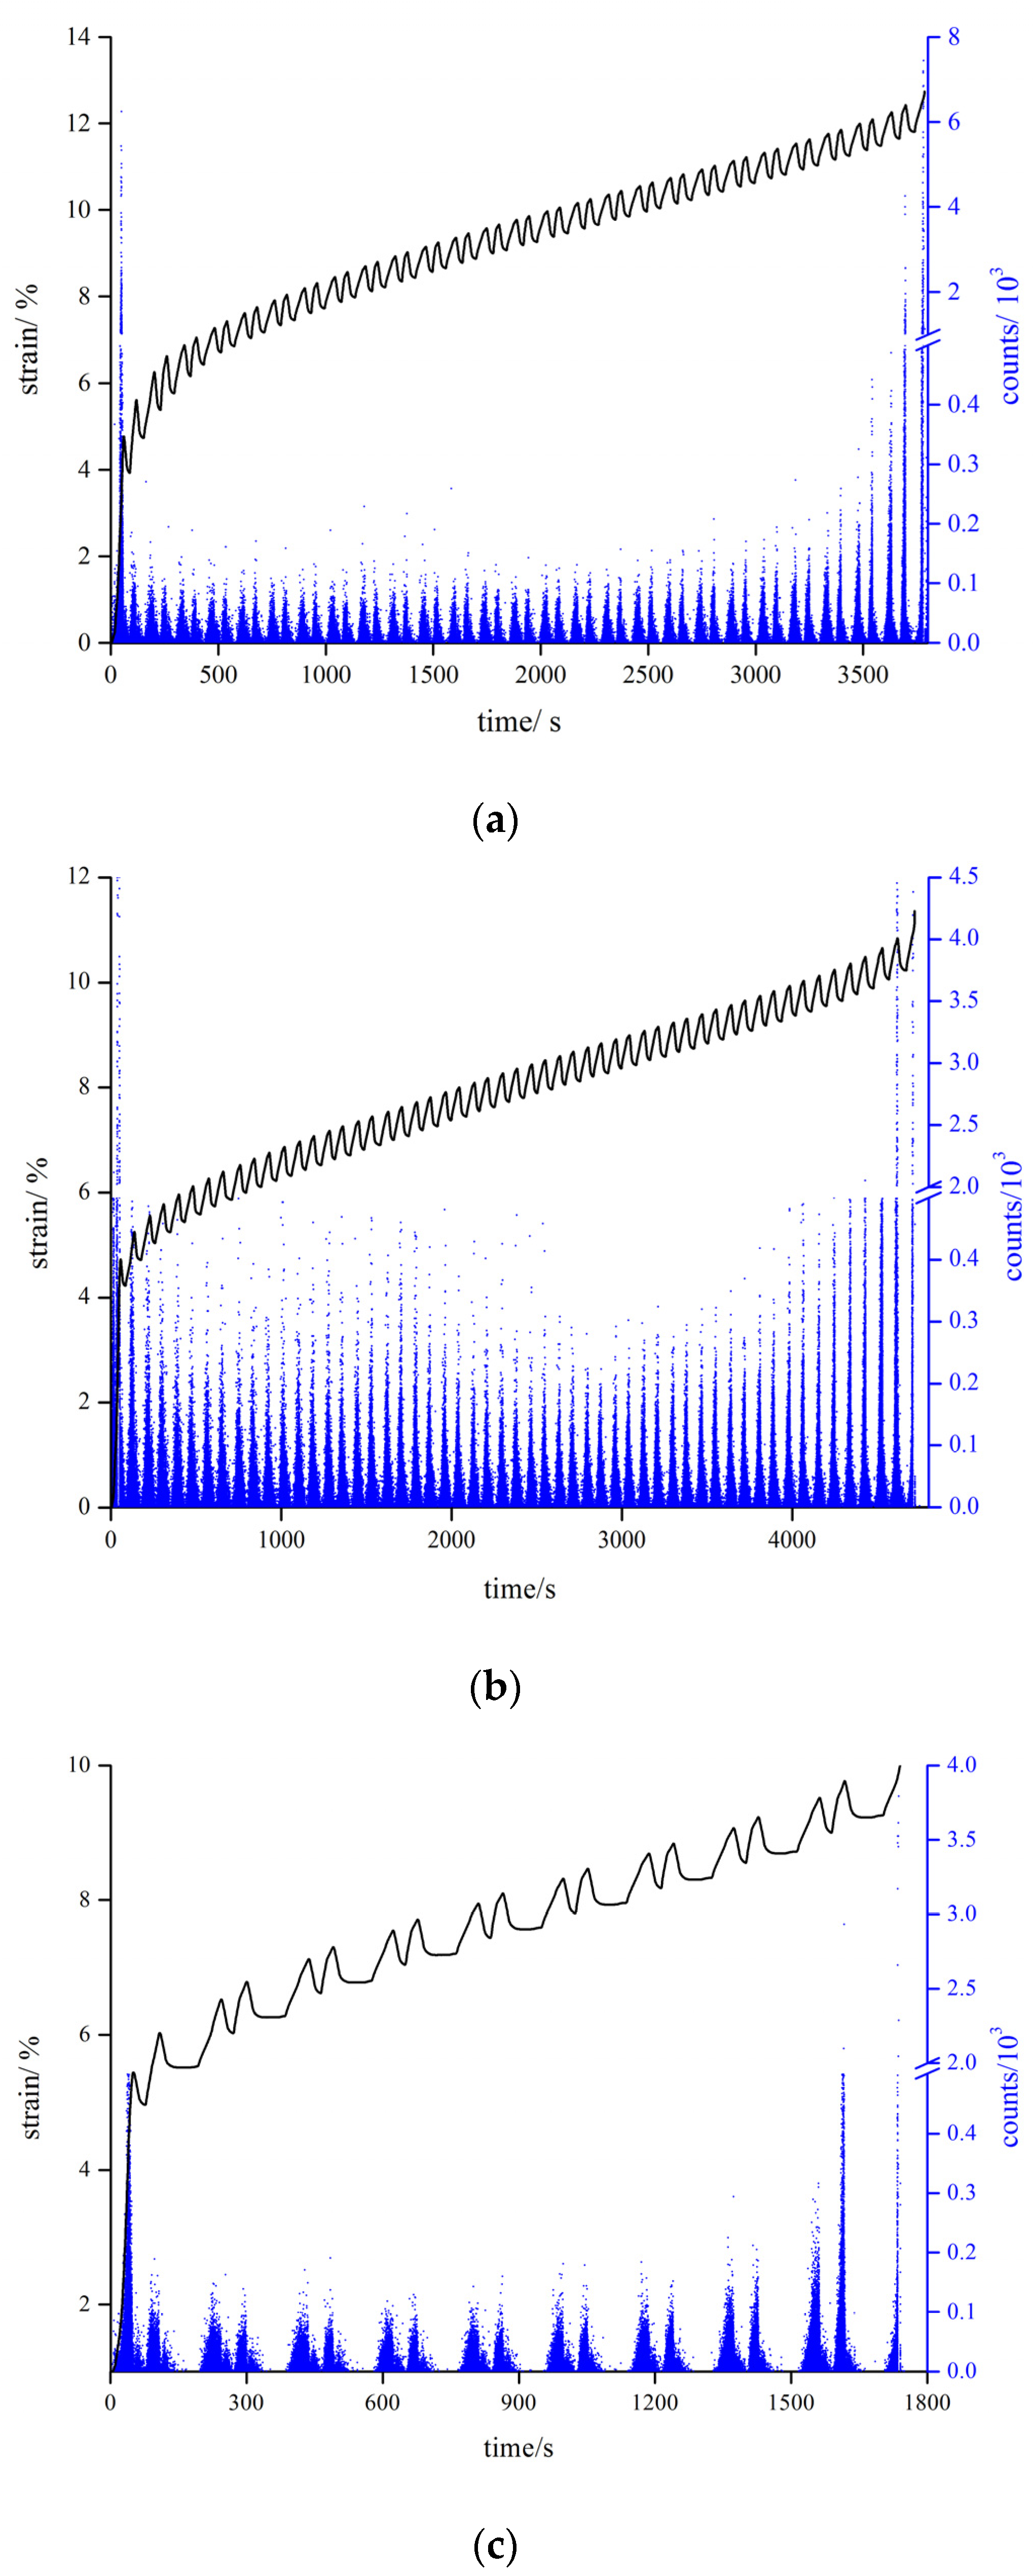
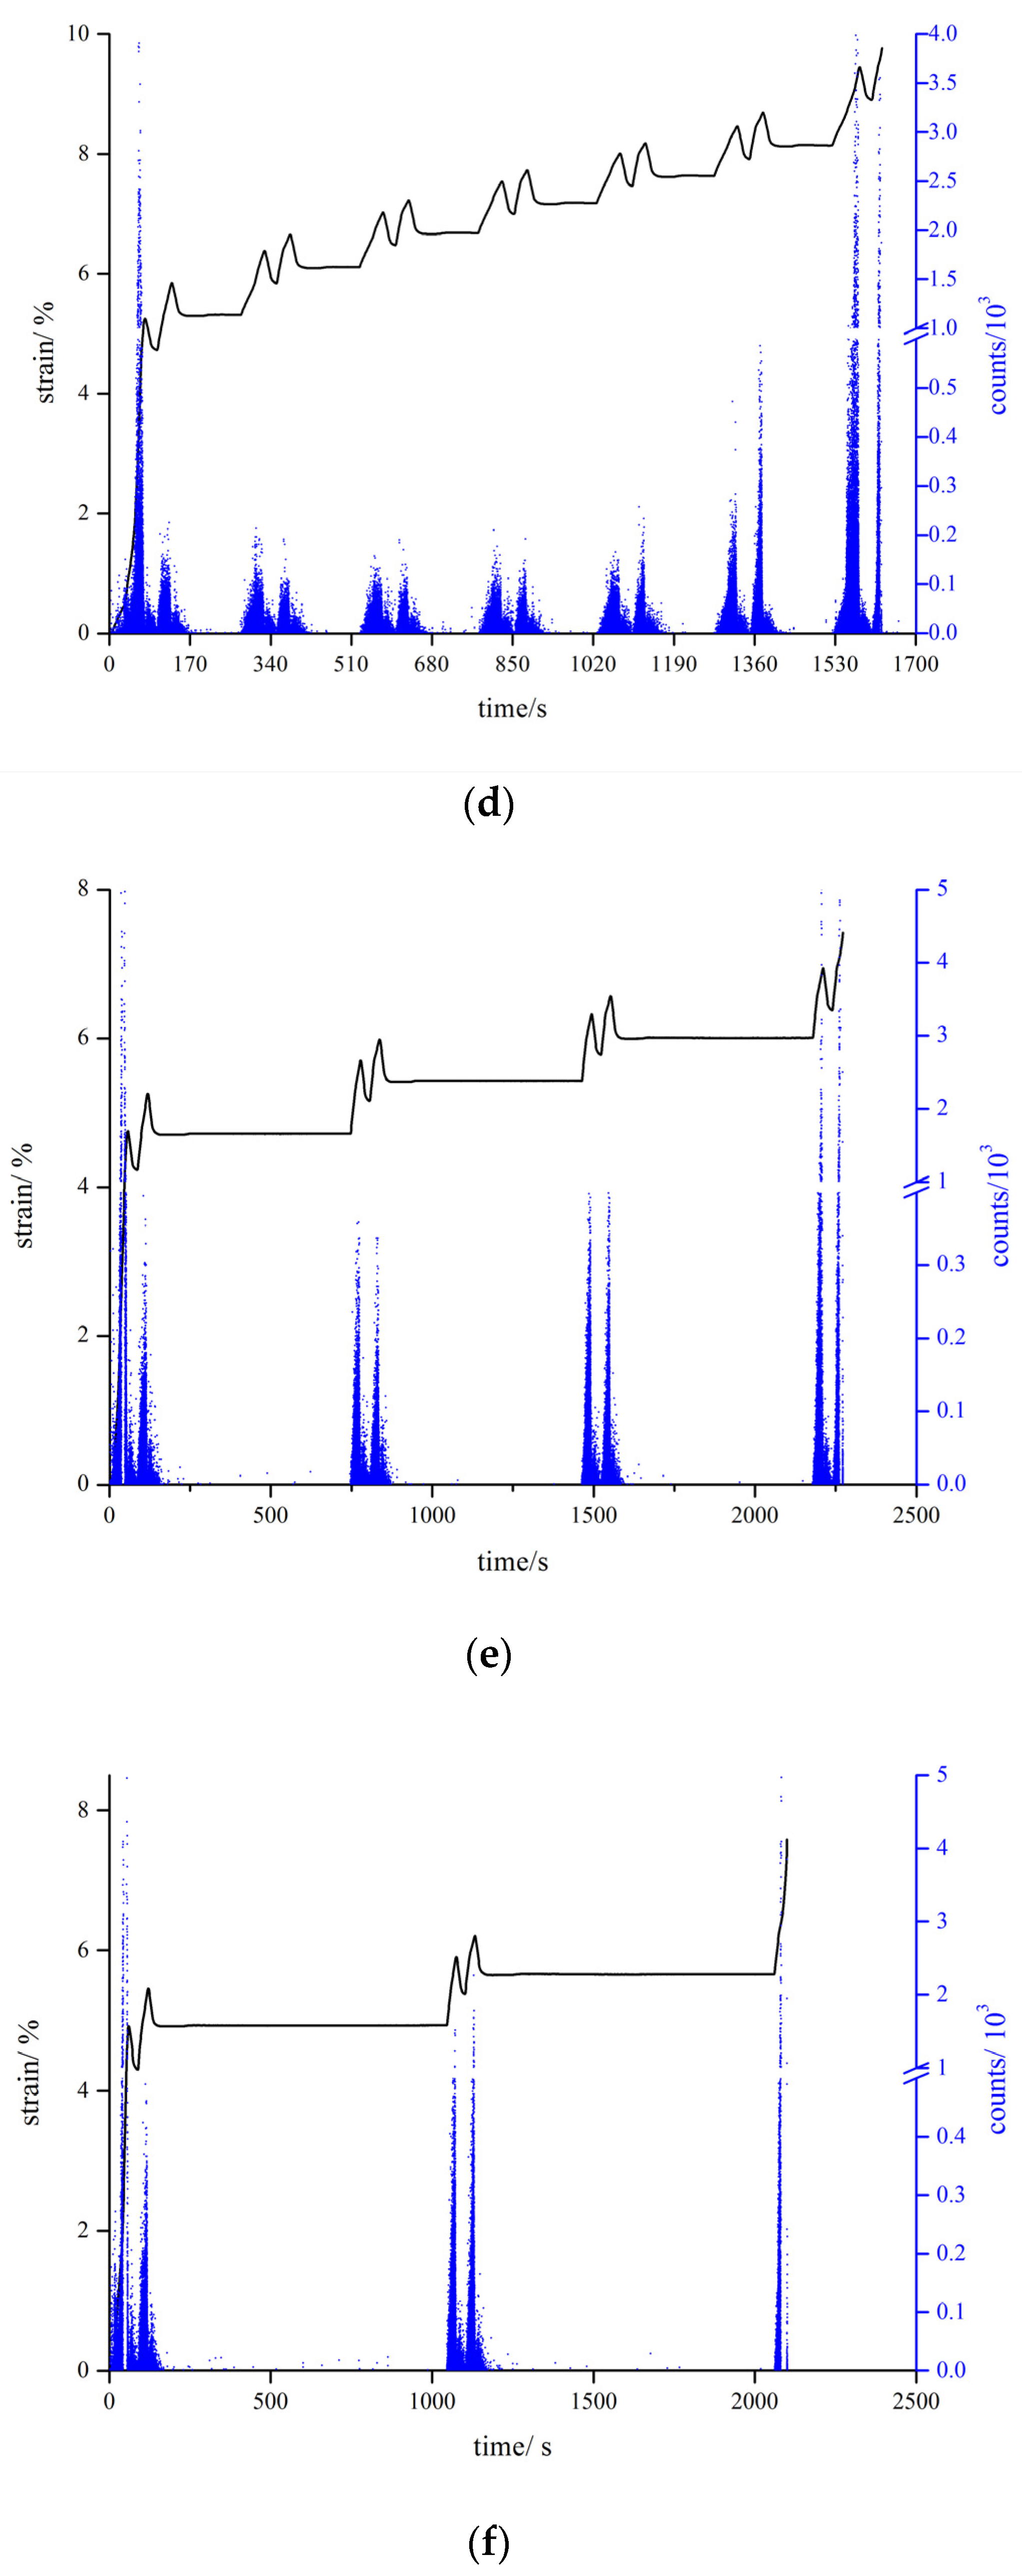
4.3. Influence of Time Intervals

AE counts produced by each unique circle is summed and the data for the different fatigue intervals are shown in Figure 11. It is important to note that the first and the last circles of each process are not included because of their different mechanisms. The discrepancies between the accumulated AE counts produced by α and β circles are quantitatively shown in Figure 11. The sum of the AE counts in α circles is always larger than that in β circles during the stationary phase of fatigue, which means that the AE phenomenon in the α circles is more active.
Using dislocation theory, the dynamic proliferative mechanism proposed by Read and Frank [29] can explain the effect of residual stress on grains. The dislocations move very fast during the unloading of an external force and have a lot of kinetic energy, which could manifest as residual stress in the rock salt. This situation can be described by elastic energy Wela inside a volume V, as shown in Equation (1). The elastic energy component drives the internal structural shape restoration of rock salt during the time intervals without the applied force:
W e l a = W e l a ( σ ) = i ,   j V σ i ,   j d e i ,   j
The adverse movement of the initial dislocations is conducted under the effect of residual strain. A reverse dislocation is generated when the dislocation arrives at a crystalline surface, which is known as reflection of the dislocation on the crystalline surface. Ideally, this reflection would proceed until Wela is consumed to zero, the dislocations are propagated constantly, large slippages occur on an atomic plane, and the number of microscopic fractures increases constantly during the time intervals. This kind of propagation comes from new cores and growth [30]. It is necessary to note that the AE images during the time intervals are quiet because of the small scale of variation, even though the change occurs in the intervals of the non-stressed phase. The dislocations move back and forth as a result of external stresses along both the original and palingenetic paths. These dislocations move to consume less energy along the original path: most of the energy is used to generate new fractures and is consumed by frictional loss between the lattices. This explains why the total number of AE counts in the α circles is greater than that in the β circles (as shown in Figure 11).
In order to discuss the influence of the fatigue intervals in more detail, we define:
Ni(X) = N2i+1 + N2i (i = 1, 2, 3, …)
where N2i+1 is the total number of AE counts produced by the odd-numbered circles (β circles), N2i is the total number of AE counts produced by the even-numbered circles (α circles), i is the ordinal, and X is the fatigue interval (in seconds). Figure 12 shows the effect of the fatigue interval on the computed values of Ni(X).
The number of AE counts can represent the energy change of the structural transformation inside rock because this phenomenon is closely related to the microscopic damage to the rock [31]. Ni(X), the difference between the total counts produced by one β circle and the adjacent β circle, can therefore reflect the variation of energy inside the rock salt during the non-stressed phase. Figure 12 shows that the longer the interval, the higher the value of Ni(X). Once the interval extends beyond the threshold (900 s), however, the longer time interval leads to more work required for the residual strain and greater energy release, so the internal structure of the rock salt adjusts more easily. As greater amounts of elastic energy shown in Equation (1) are consumed, more palingenetic glide planes are generated, and the internal structure of rock salt becomes more petroclastic. This phenomenon is explained by the Bauschinger effect, in which the strength of a material on forward loading is reduced upon reverse loading; the essence of the Bauschinger effect is that the dislocations can easily move (slide or climb) reversely to their previous initial movement [32]. Residual stress drags dislocations back to their original positions, in a direction of motion opposite to that of their movement under loading conditions. The resistance capability of dislocations therefore decreases under subsequent loadings compared with the previous loading, thereby accelerating the accumulation of residual strain on a macroscopic level. Ultimately, the longer the time interval, the faster the residual strain accumulates, so the rock salt fractures more easily, and the fatigue lives shown in Table 1 decrease.

4.4. Intermittent Fatigue Life Model for Rock Salt Based on Damage

Damage variable D represents the status of material degradation, defined by Kachanov [33] as the ratio of Ad (area of micro-defects on an instantaneous load-bearing surface) and A (sectional area of the initial undamaged condition):
D = A d A
We assume that the samples of rock salt have no initial damage. The sum of the accumulated AE counts is then Ntotal when the entire section A fails. The AE rate for infinitesimal failures per unit area is then given by:
υ b = N t o t a l A
If we ignore the magnitude of each AE count, then when the failed (damaged) area of the section reaches Ad, the number of accumulated AE counts is given by
N = υ b A d = N t o t a l A d A
Equations (3) and (5) are simultaneous, so we have a relationship between the number of AE counts and damage variable D:
D = N N t o t a l
Equation (6) indicates that there is a theoretical consistency between the number of AE counts and material damage. According to the relevant descriptions of the Kaiser effect [34,35,36] and considering the opportunities of the AE to re-emerge, the number of AE counts Ni for the ith re-loading is
N N t o t a l = D D i 1
In Equation (7), Di−1 represents the damage variable generated by the last loading, and x is defined as
x = { x ,   x 0 x ,   x < 0
We then introduce the damage law expressed by strain ε [37]:
dD = { f ( ε ) d ε ,   ε = ζ   a n d   d ε > 0 0 ,   d ε < 0
In Equation (9), f(ε) is a continuous positive definite function of ε and represents the damage evolution function under the ideal state, and ζ is the threshold value of variable damage strain. dε > 0 is always correct under monotonic once-off loading. We assume that there is no initial damage, which means that D = ε = ζ = 0. Equations (6) and (9) are simultaneously based on this boundary condition, so we then have
N N t o t a l = D = F ( ε ) = 0 ε f ( x ) d x
Using the constitutive modeling method established by Desai [38,39], Katti [40], Shao [41], and Liu [42], we obtain the accumulative damage function as
D i = i = 1 n N i N t o t a l = 1 ( 1 i a ) b
In Equation (11), Di is the accumulative damage of the ith circle, and a and b are constants. Figure 13 shows the accumulated damage curves of tests carried out at the various fatigue intervals calculated from Equation (11).
Figure 13 shows that the damage experience comprises three sequential phases: deceleration–stabilization–acceleration. Most important is the stable damage phase because of its guiding role during the entire damage process. The black lines in Figure 13 represent the stable damage phase, the endings of which direct the trends of the accelerated damage phases. The stable damage phases are fitted by a linear function of the form y = k d x + c , and the relationship between kd and the fatigue time intervals is presented in Figure 14.
The development of kd can be divided into two periods. In the first period, kd increases as the duration of the intervals extends to 900 s and the accelerating effect of the time interval on fatigue damage takes place: the existence of the interval obviously influences the progression of the fatigue.

5. Conclusions

Surrounding rock of salt cavern would be certainly subjected to periodic load because of chronic gas injection and production, then fatigue damage occurs. In a real-world situation, gas injection occurs periodically, and production is not continuous; time intervals with non-stress exist among the circles during the operation of gas storage cavern, which reflects a more realistic state of fatigue—this phenomenon exists in not only the operation of gas storage cavern, but also the construction and operation of other projects. On the basis of the obtained results, the conclusions are as follows:
(1)
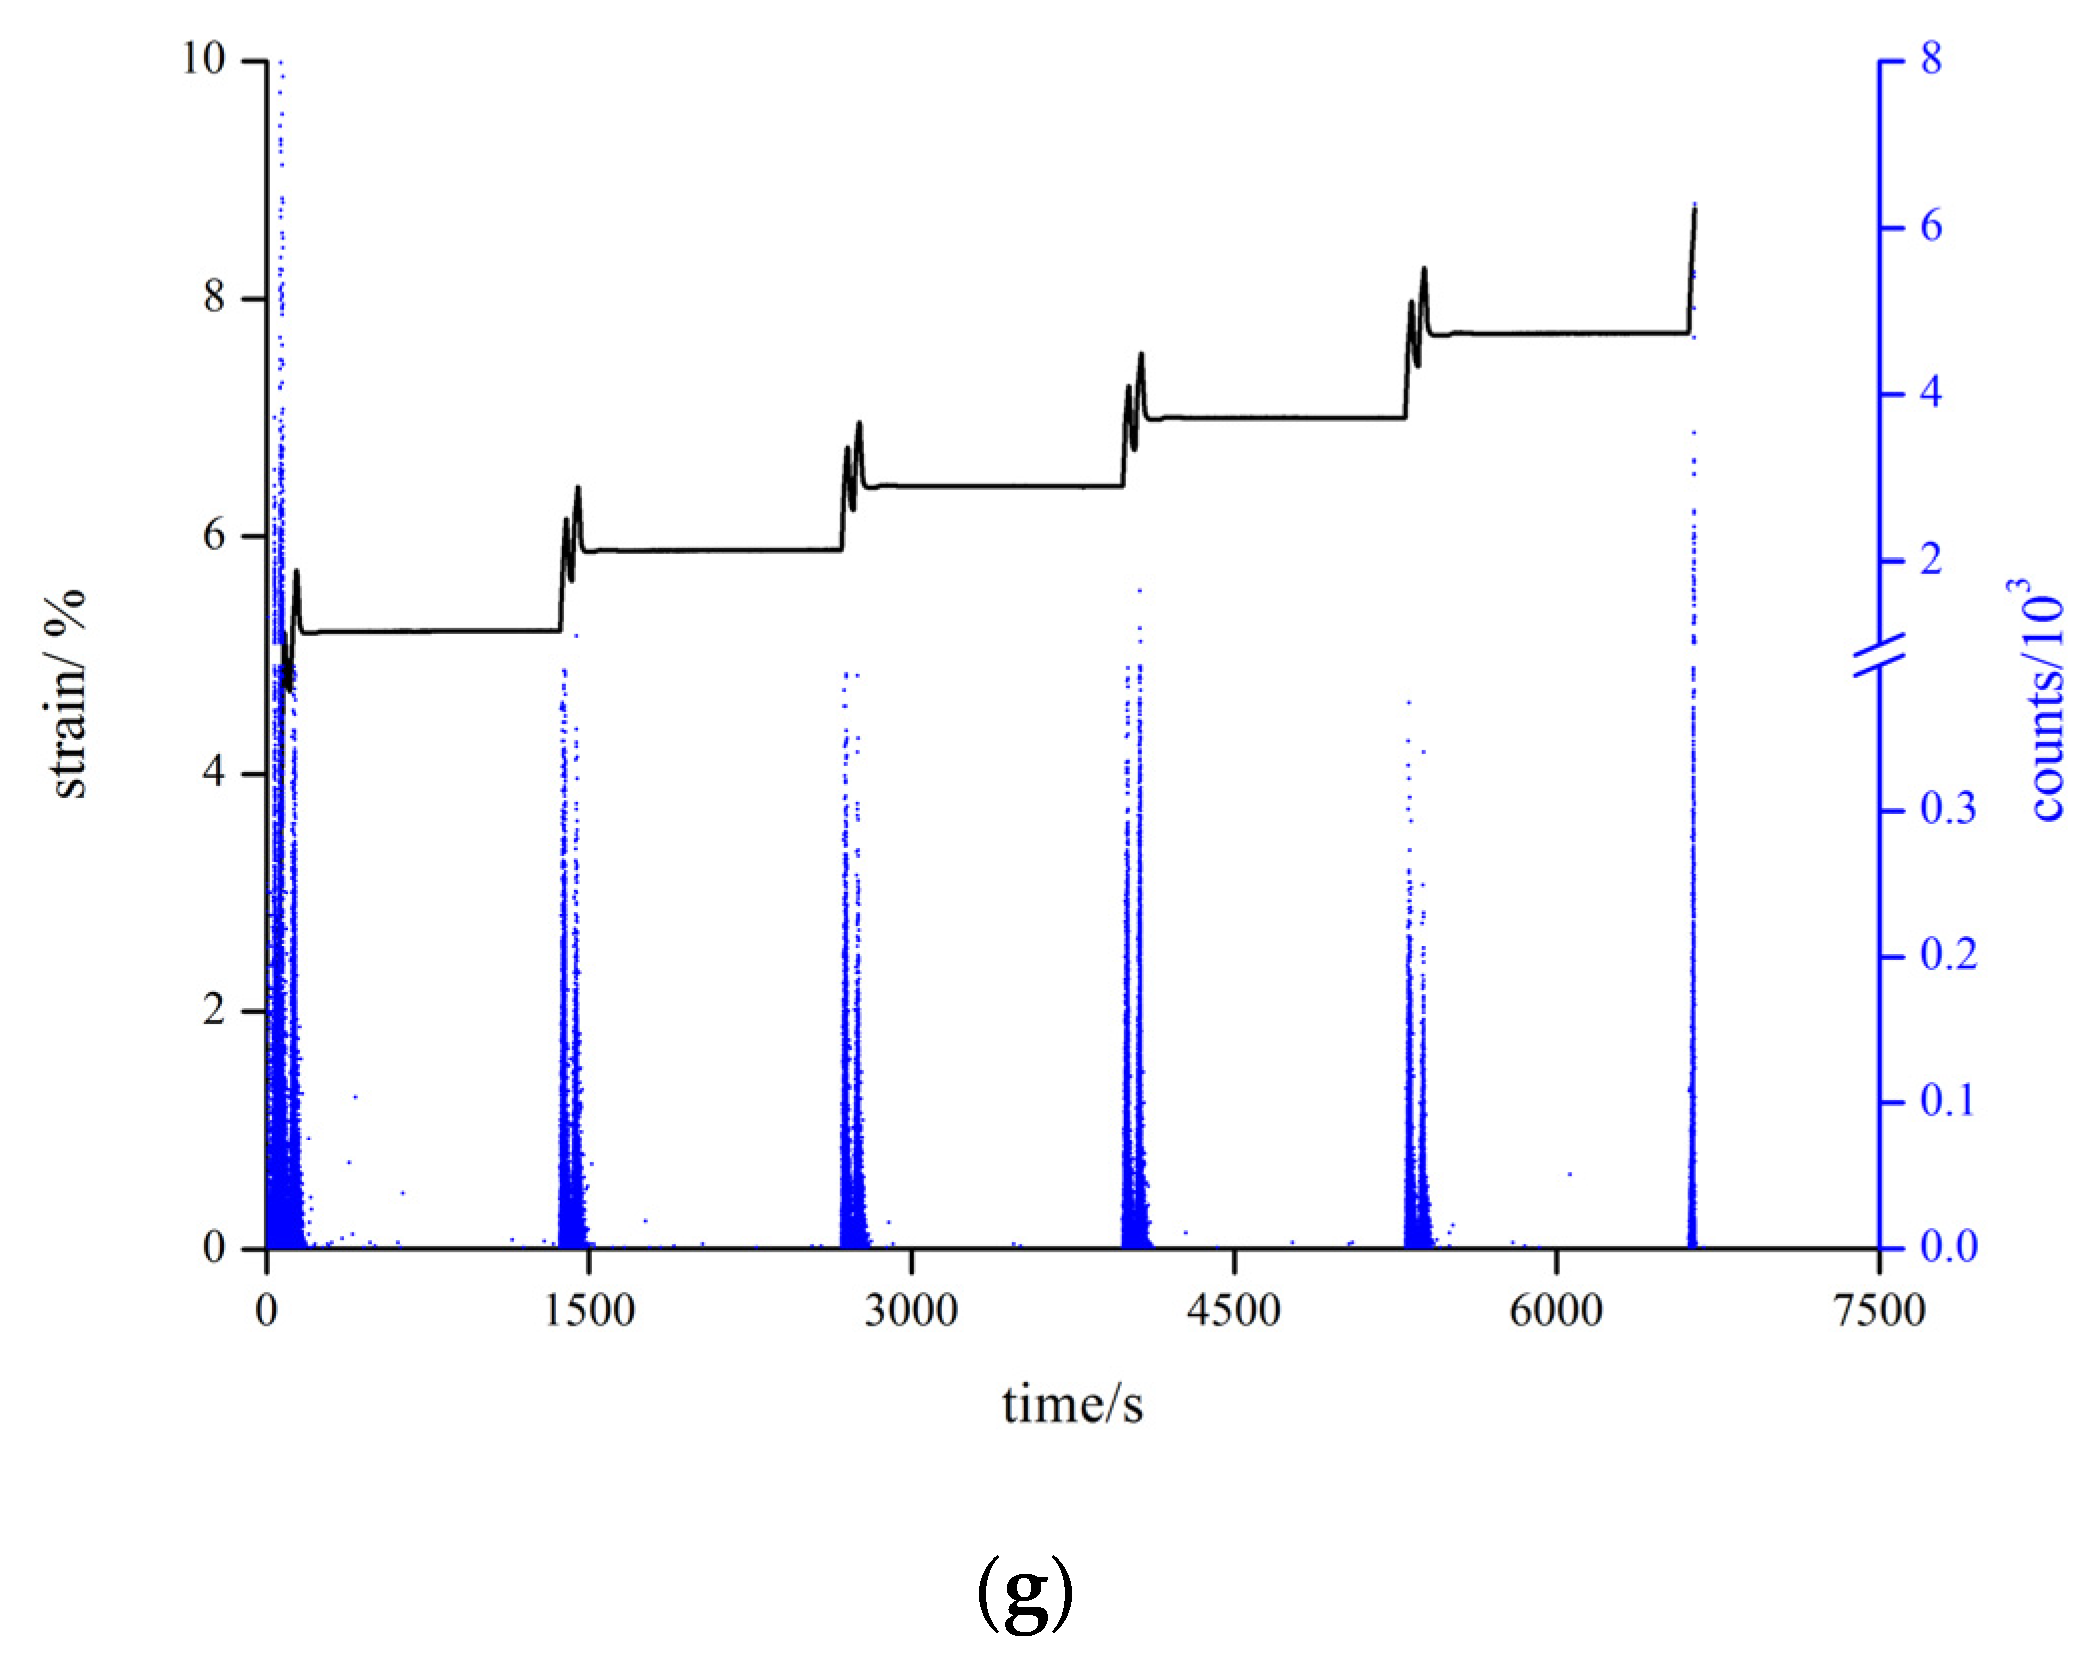
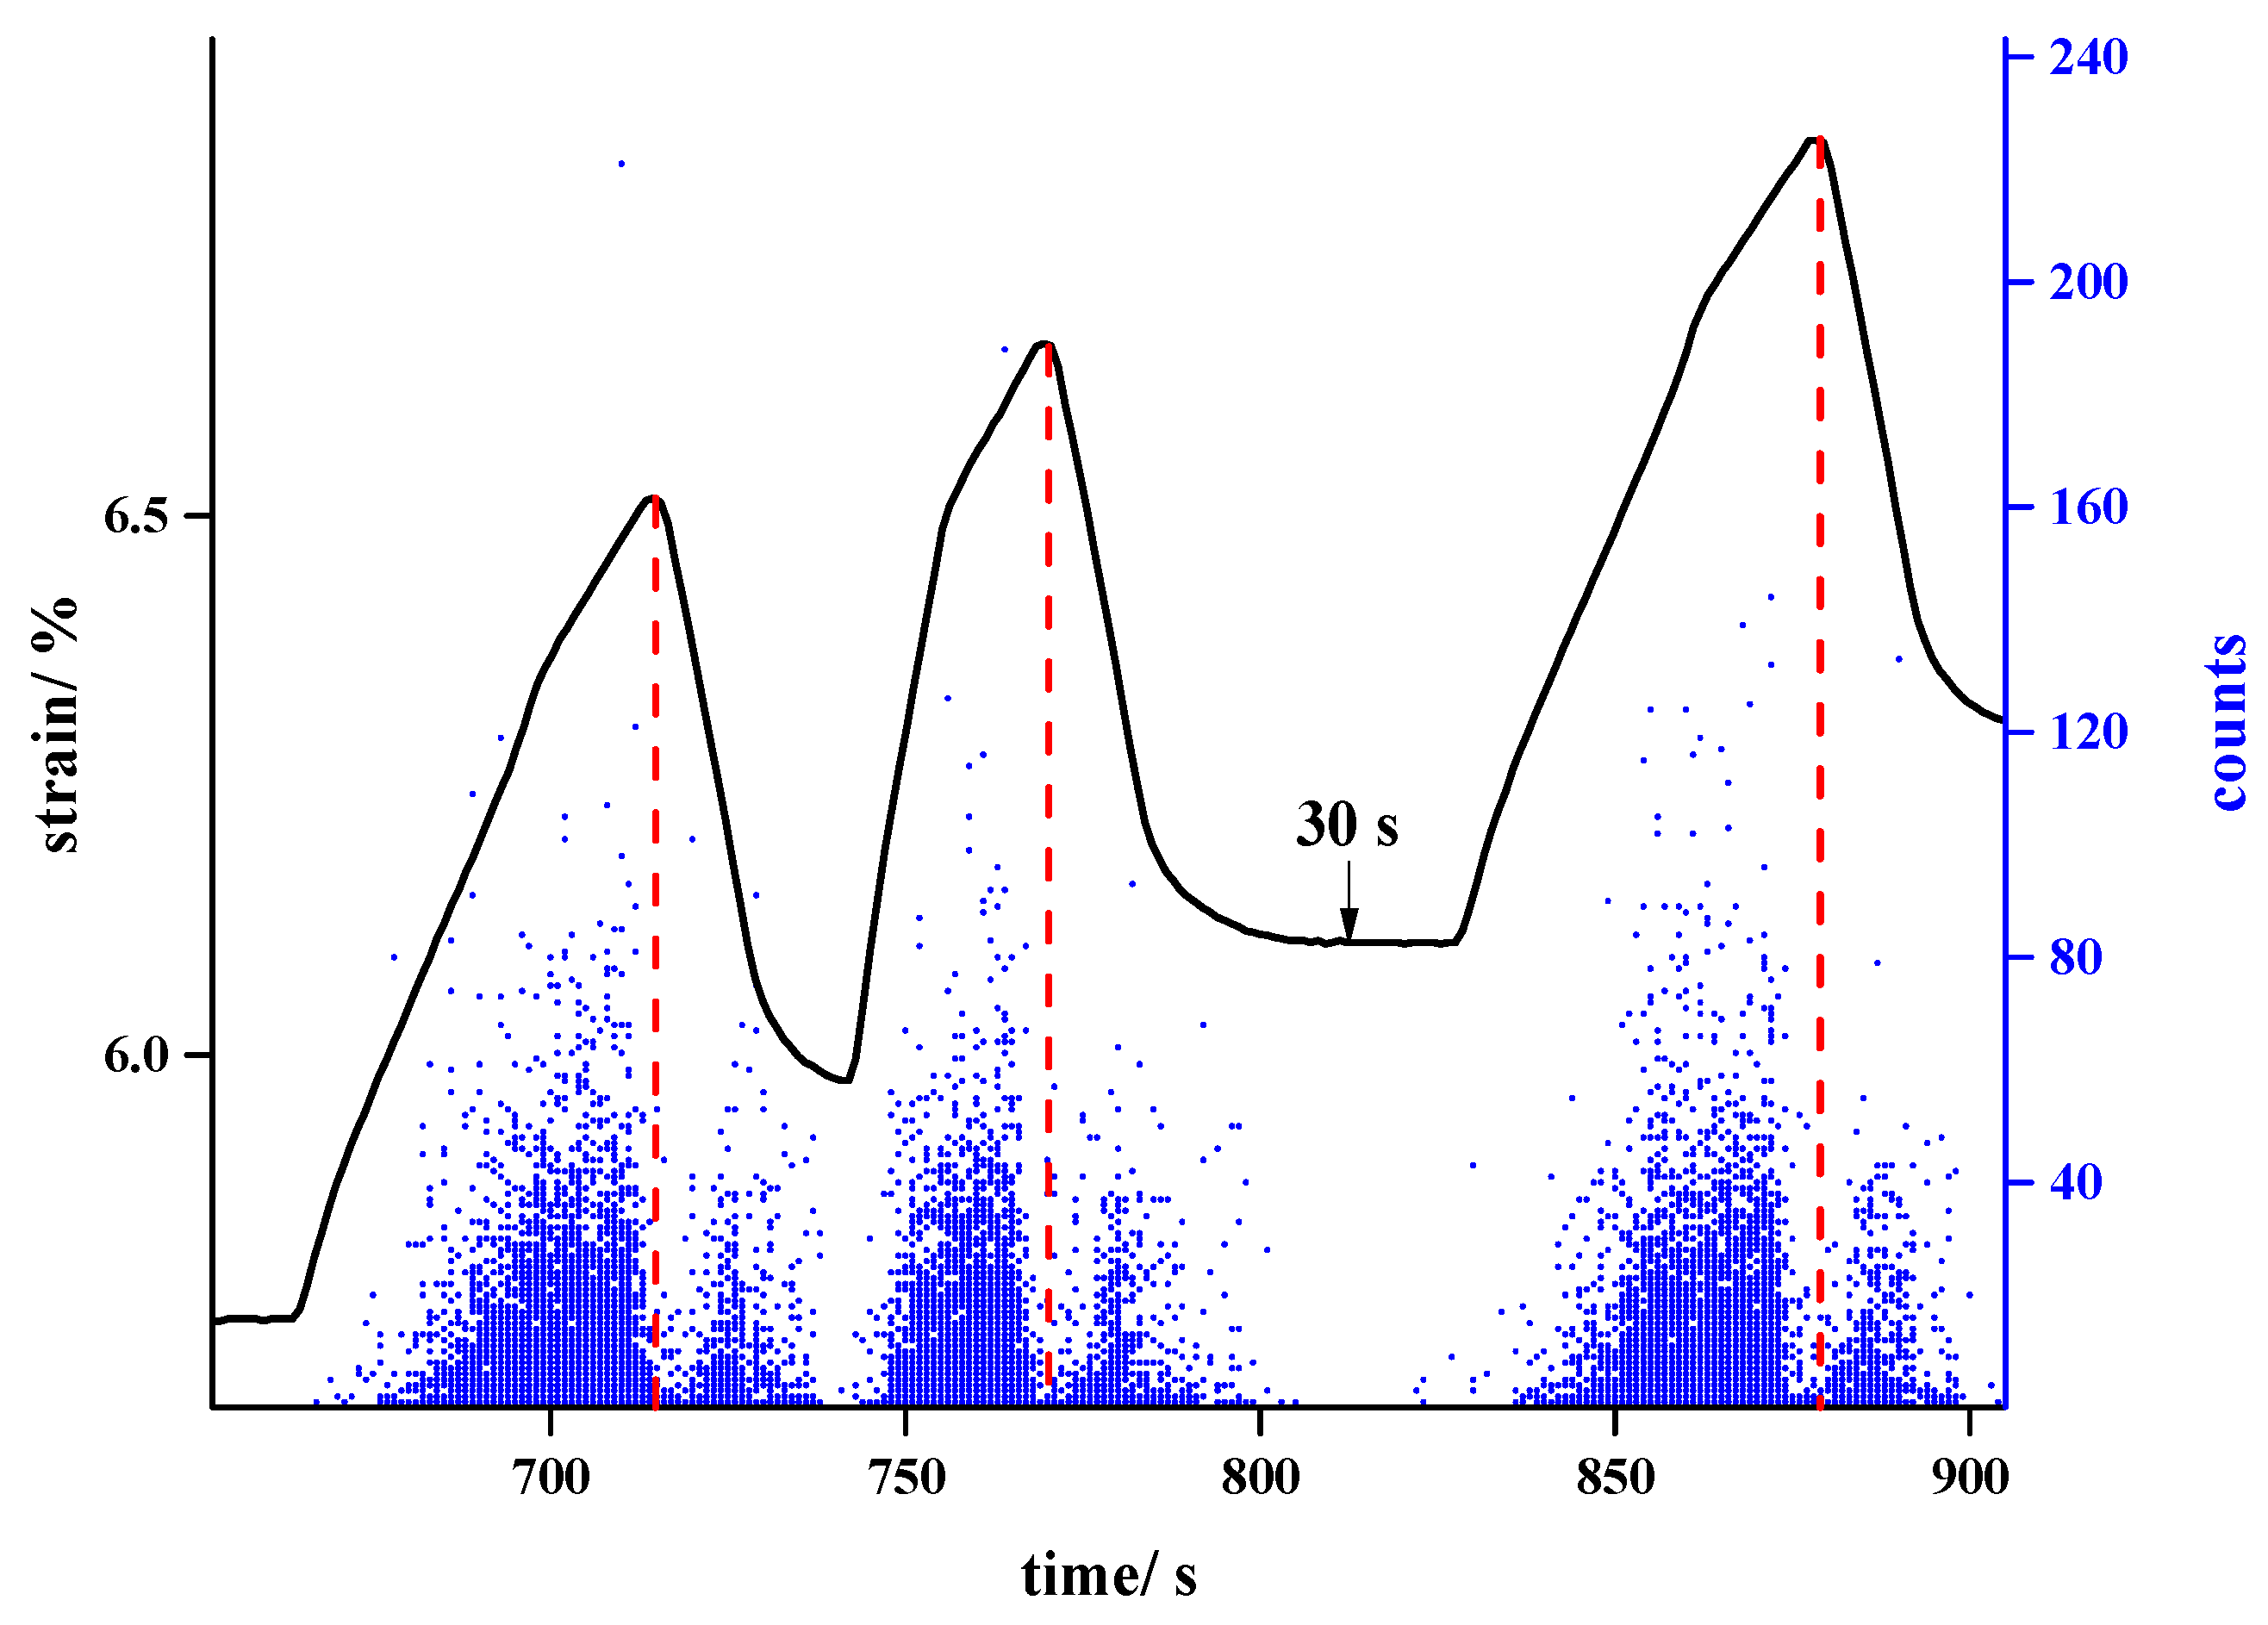
The count method of fatigue circles, named ‘β-α’, was proposed, which makes research of time intervals during fatigue in one same sample possible. Insertion of time interval separates the original continuous development tendency of residual strain, and the residual strain in circles following an interval (α circles) is generally larger than that in circles before the intervals (β circles).
(2)
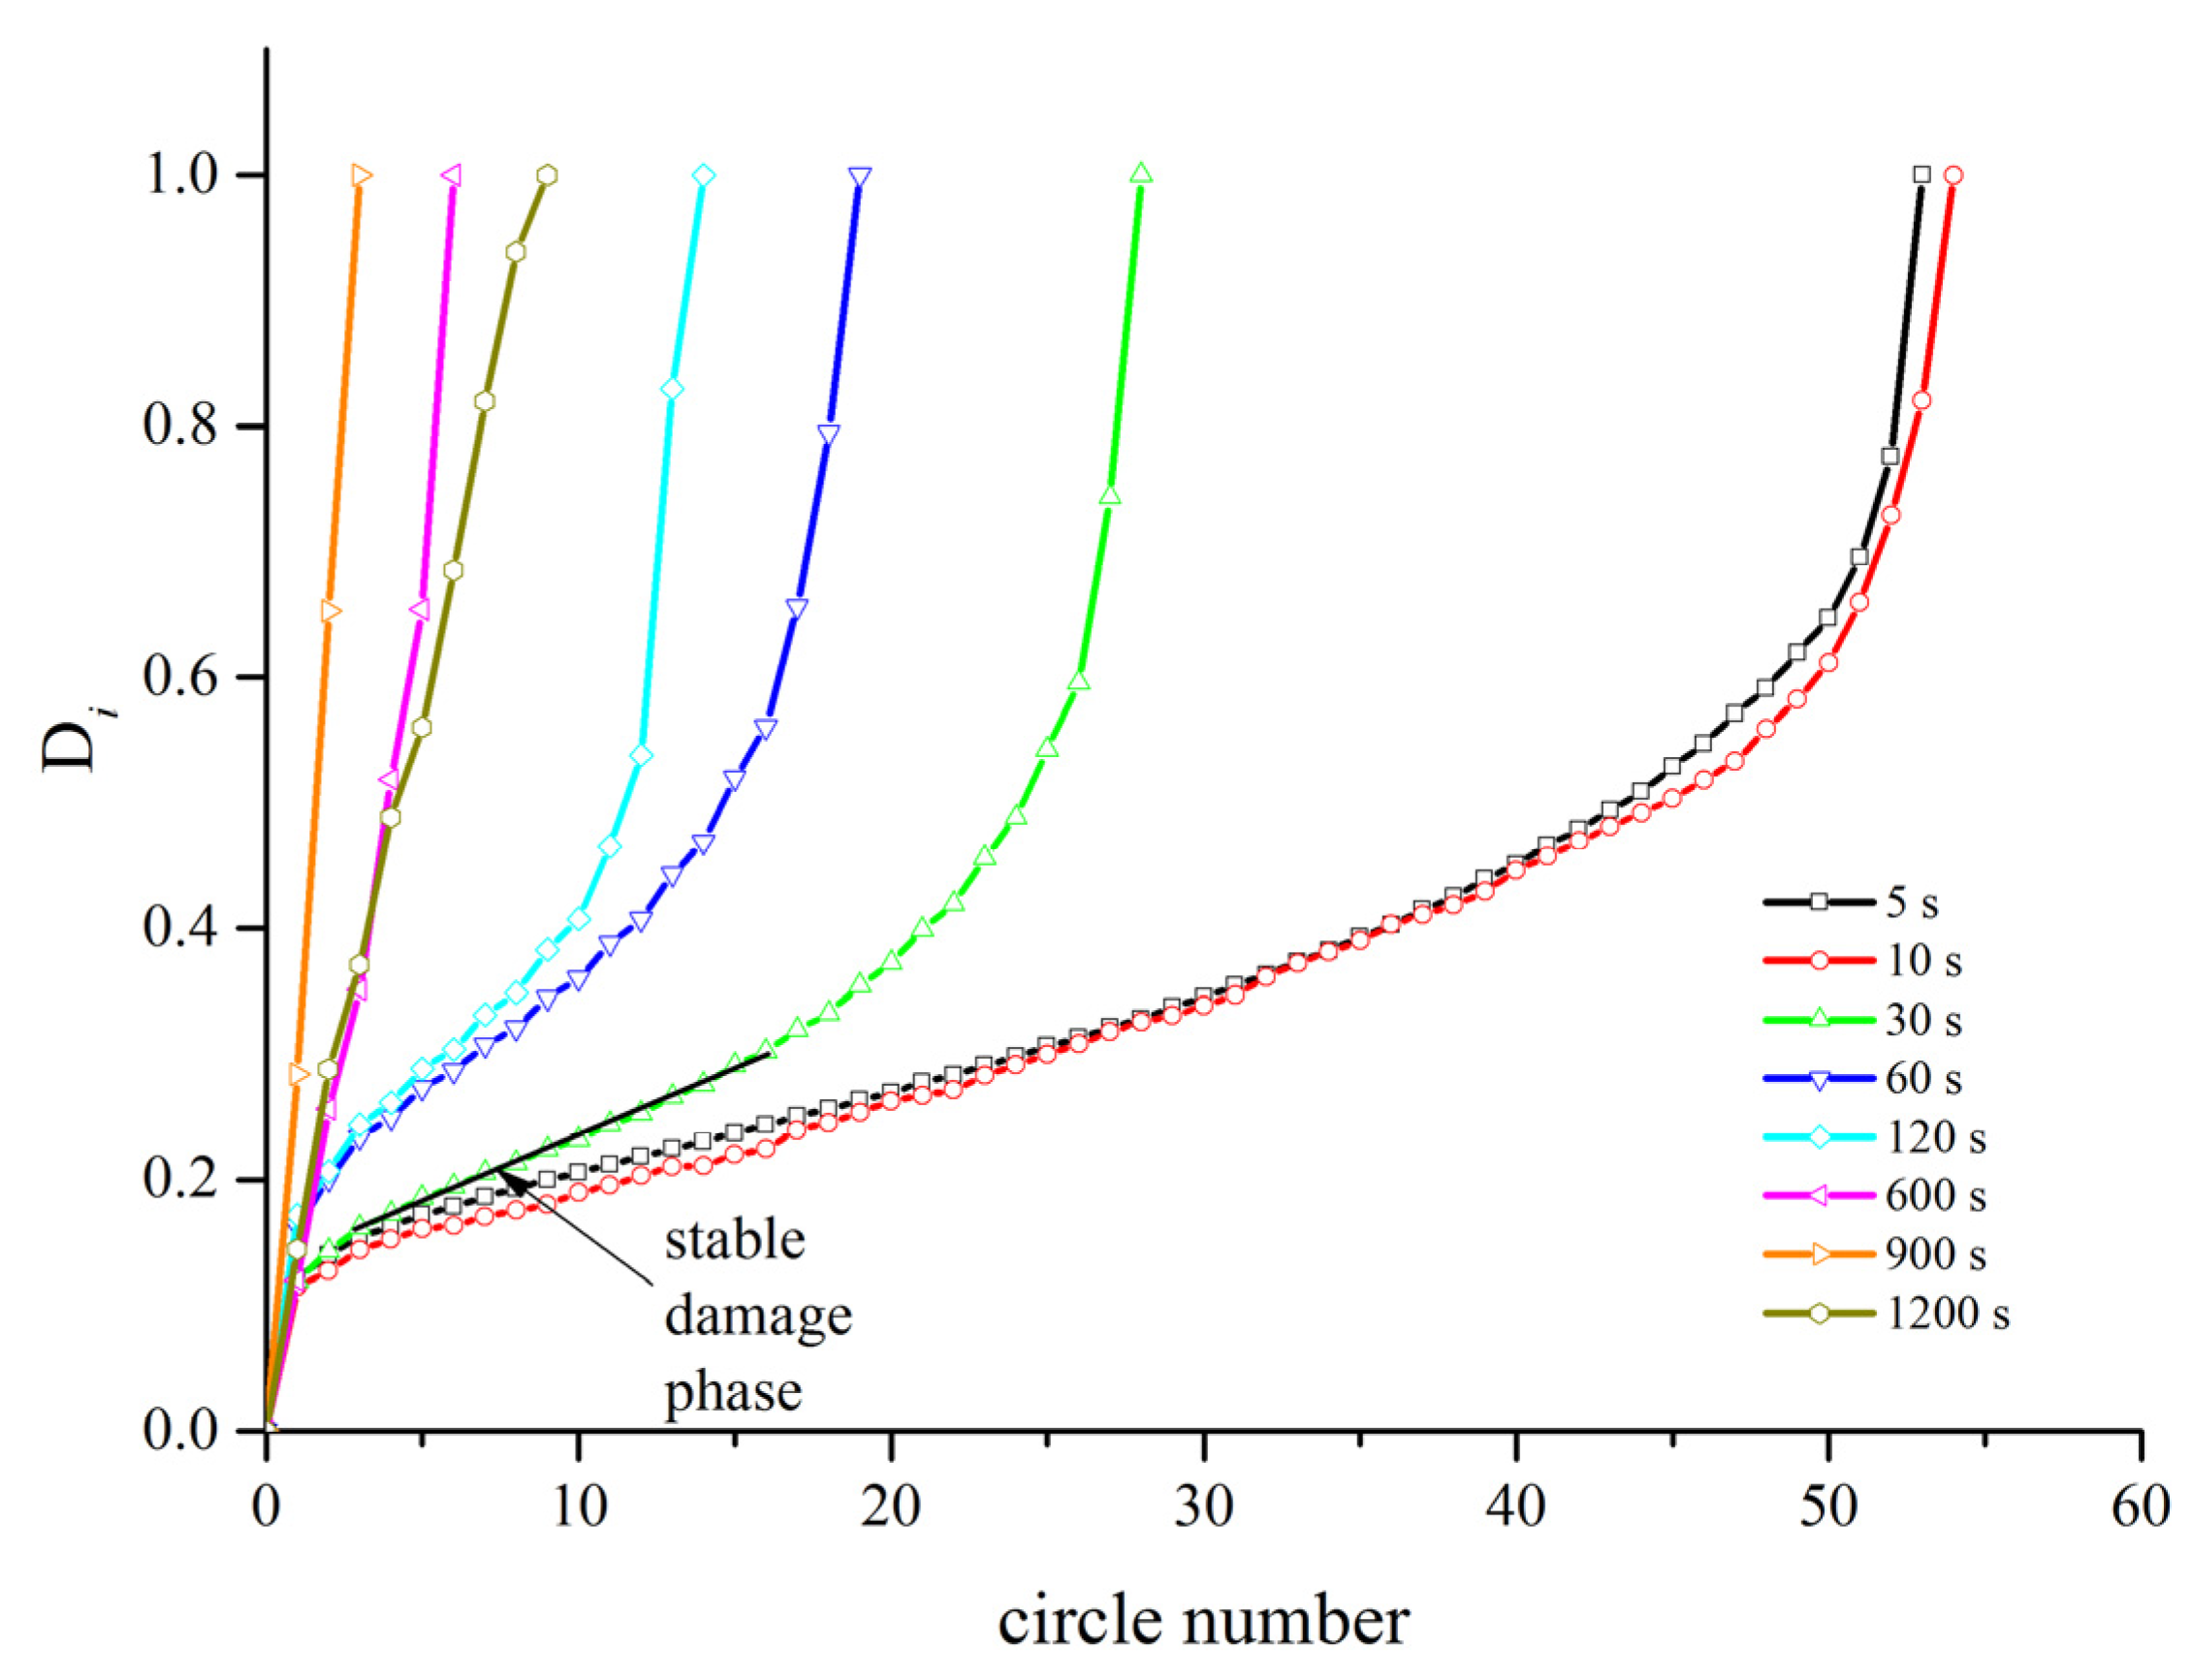
Insertion of a time interval into the fatigue process significantly accelerates the accumulation of residual strain produced by fatigue activity and reduces the fatigue life of the salt. The longer the interval, the faster the residual deformation accumulates and the shorter the fatigue life of the salt.
(3)
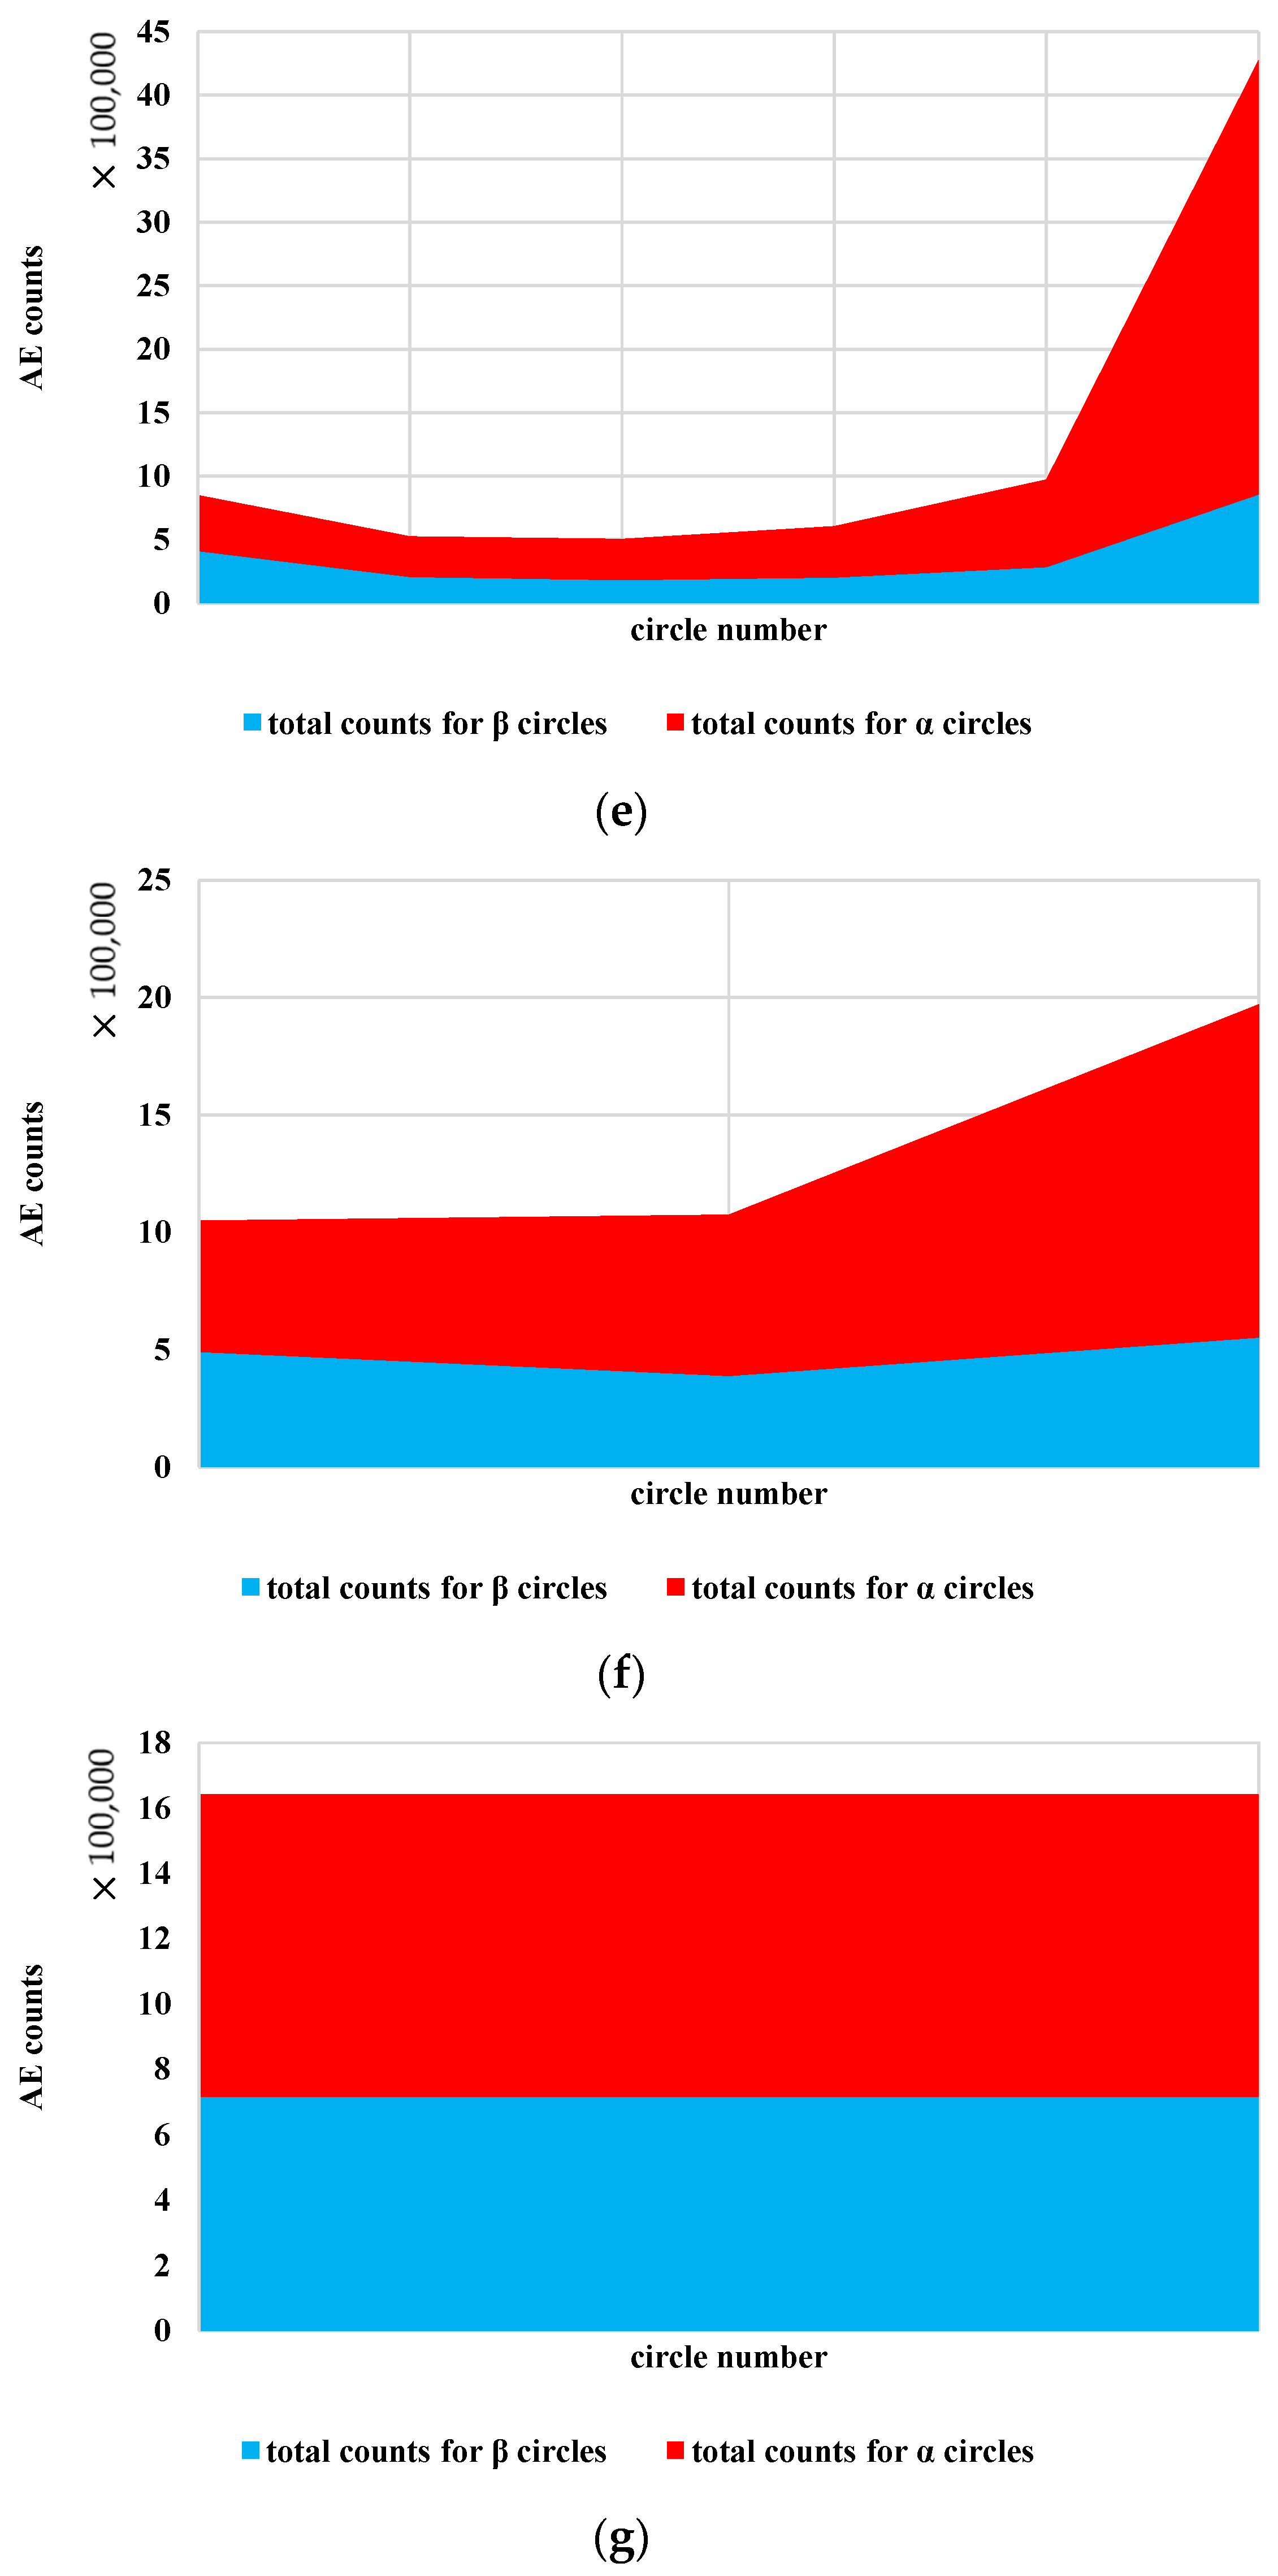
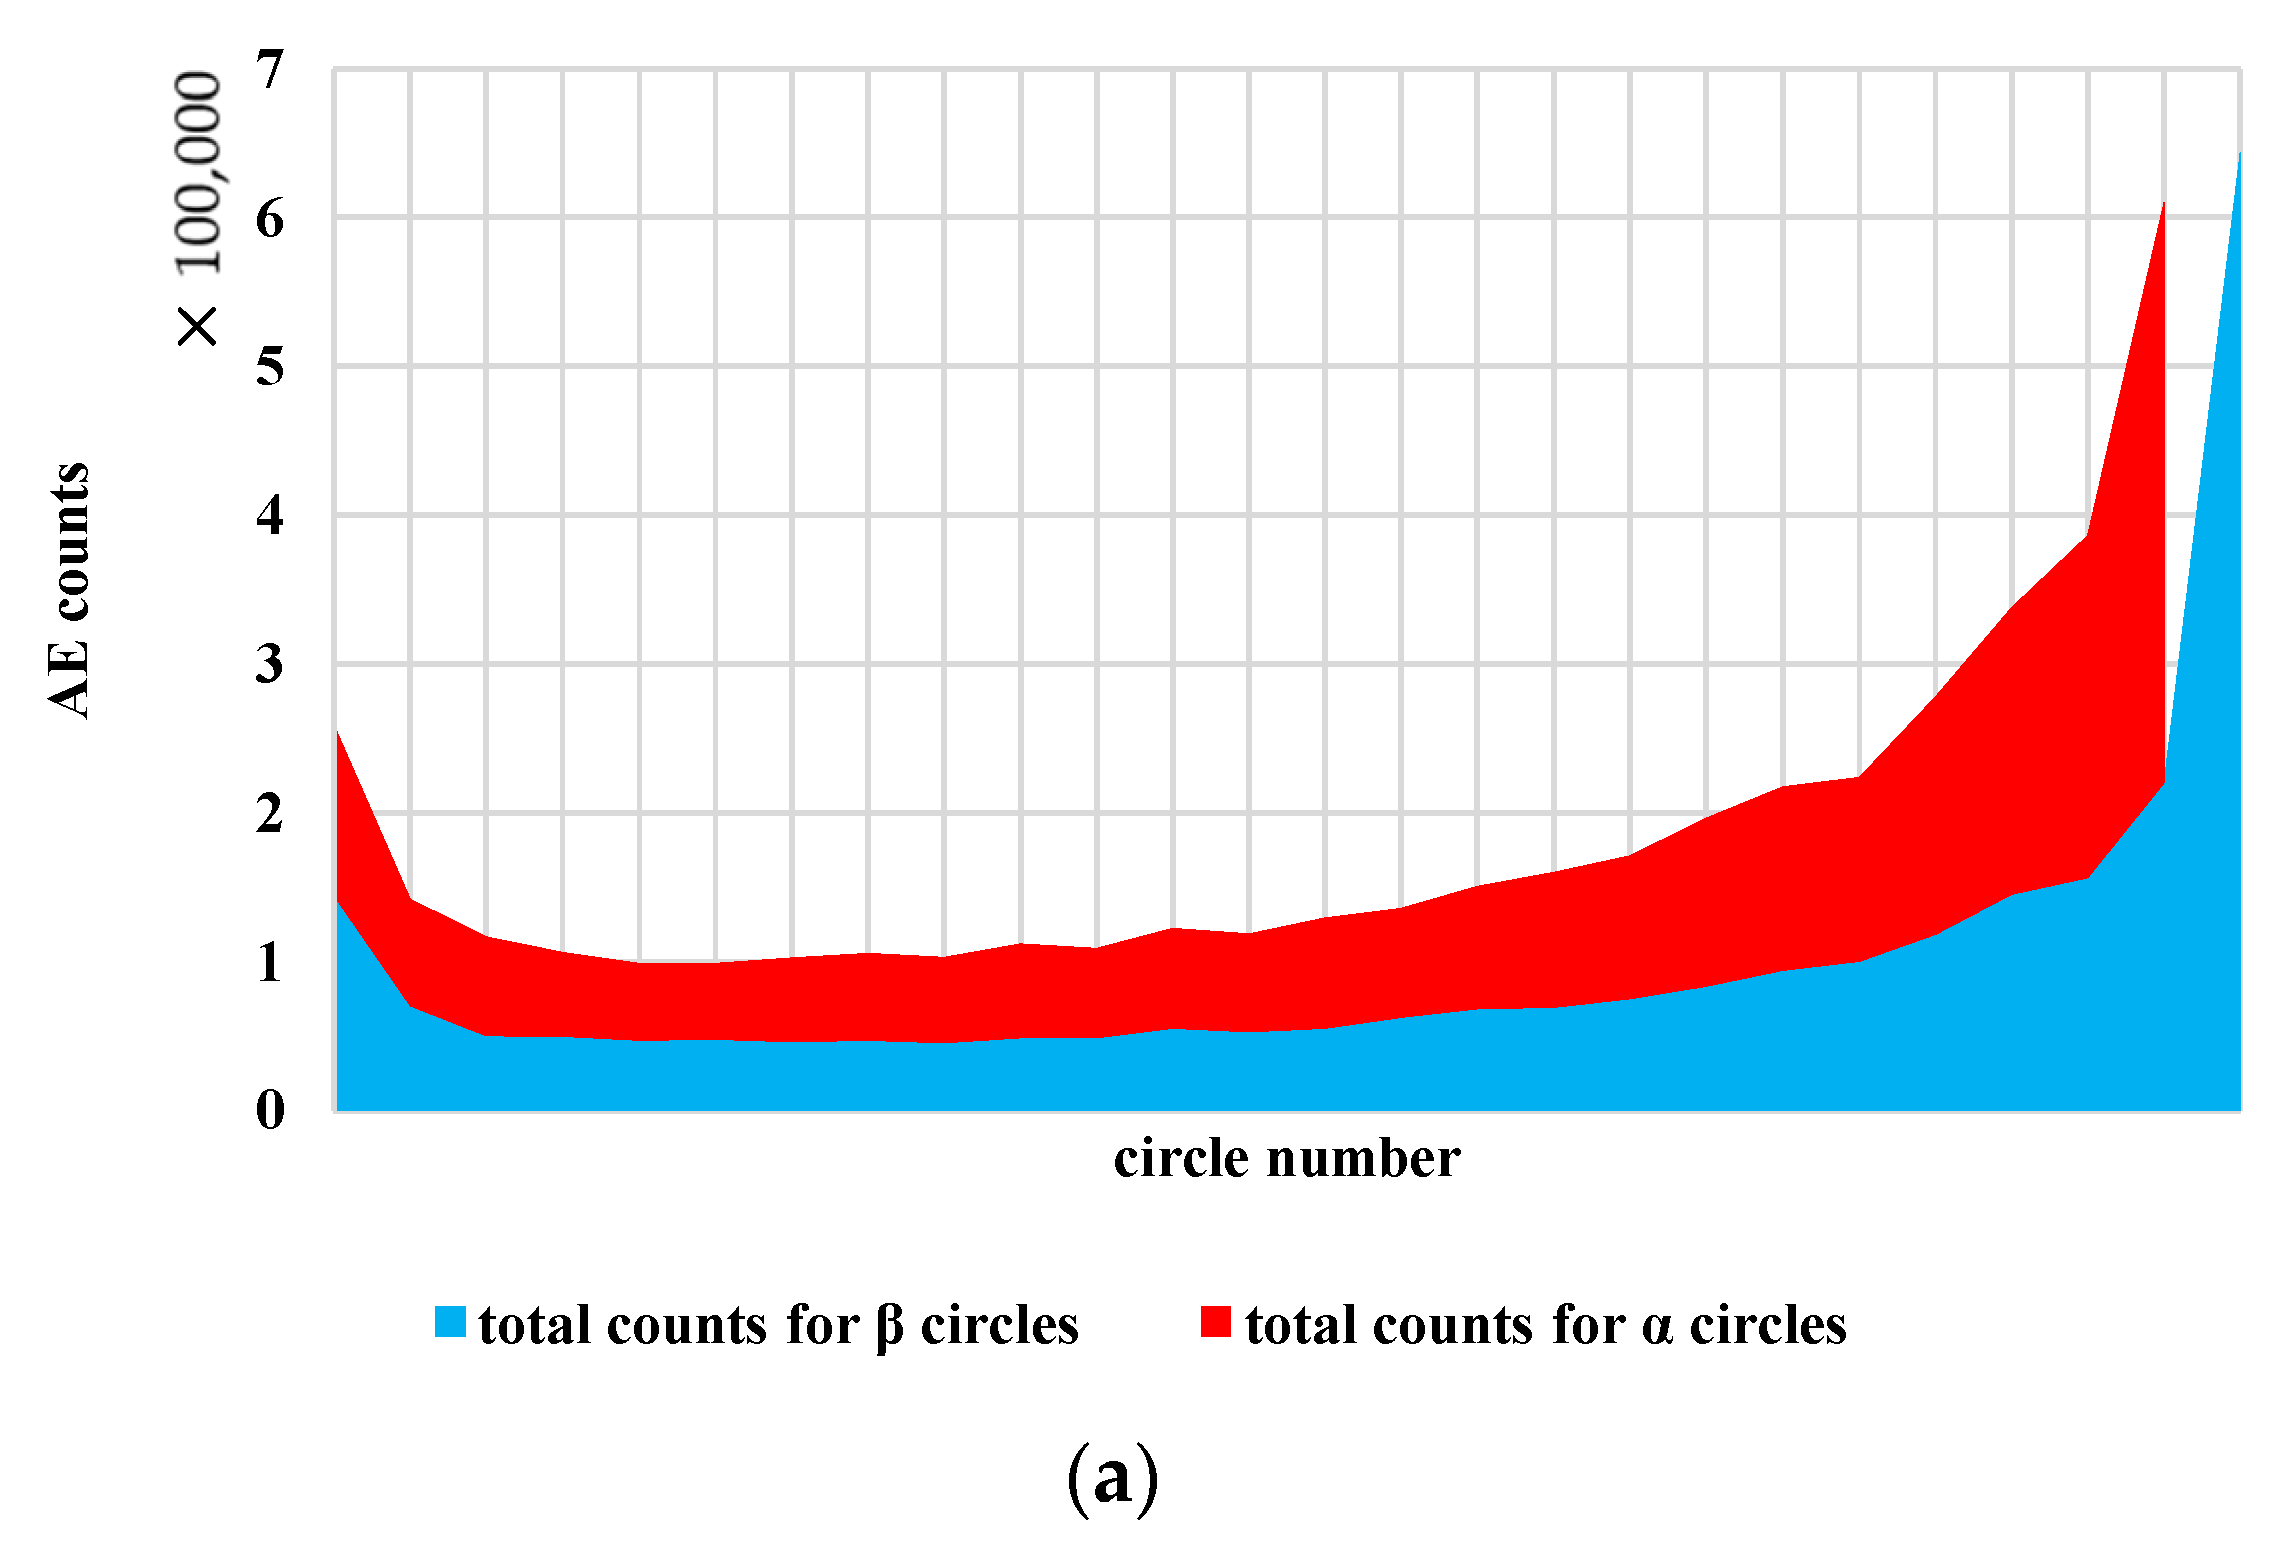
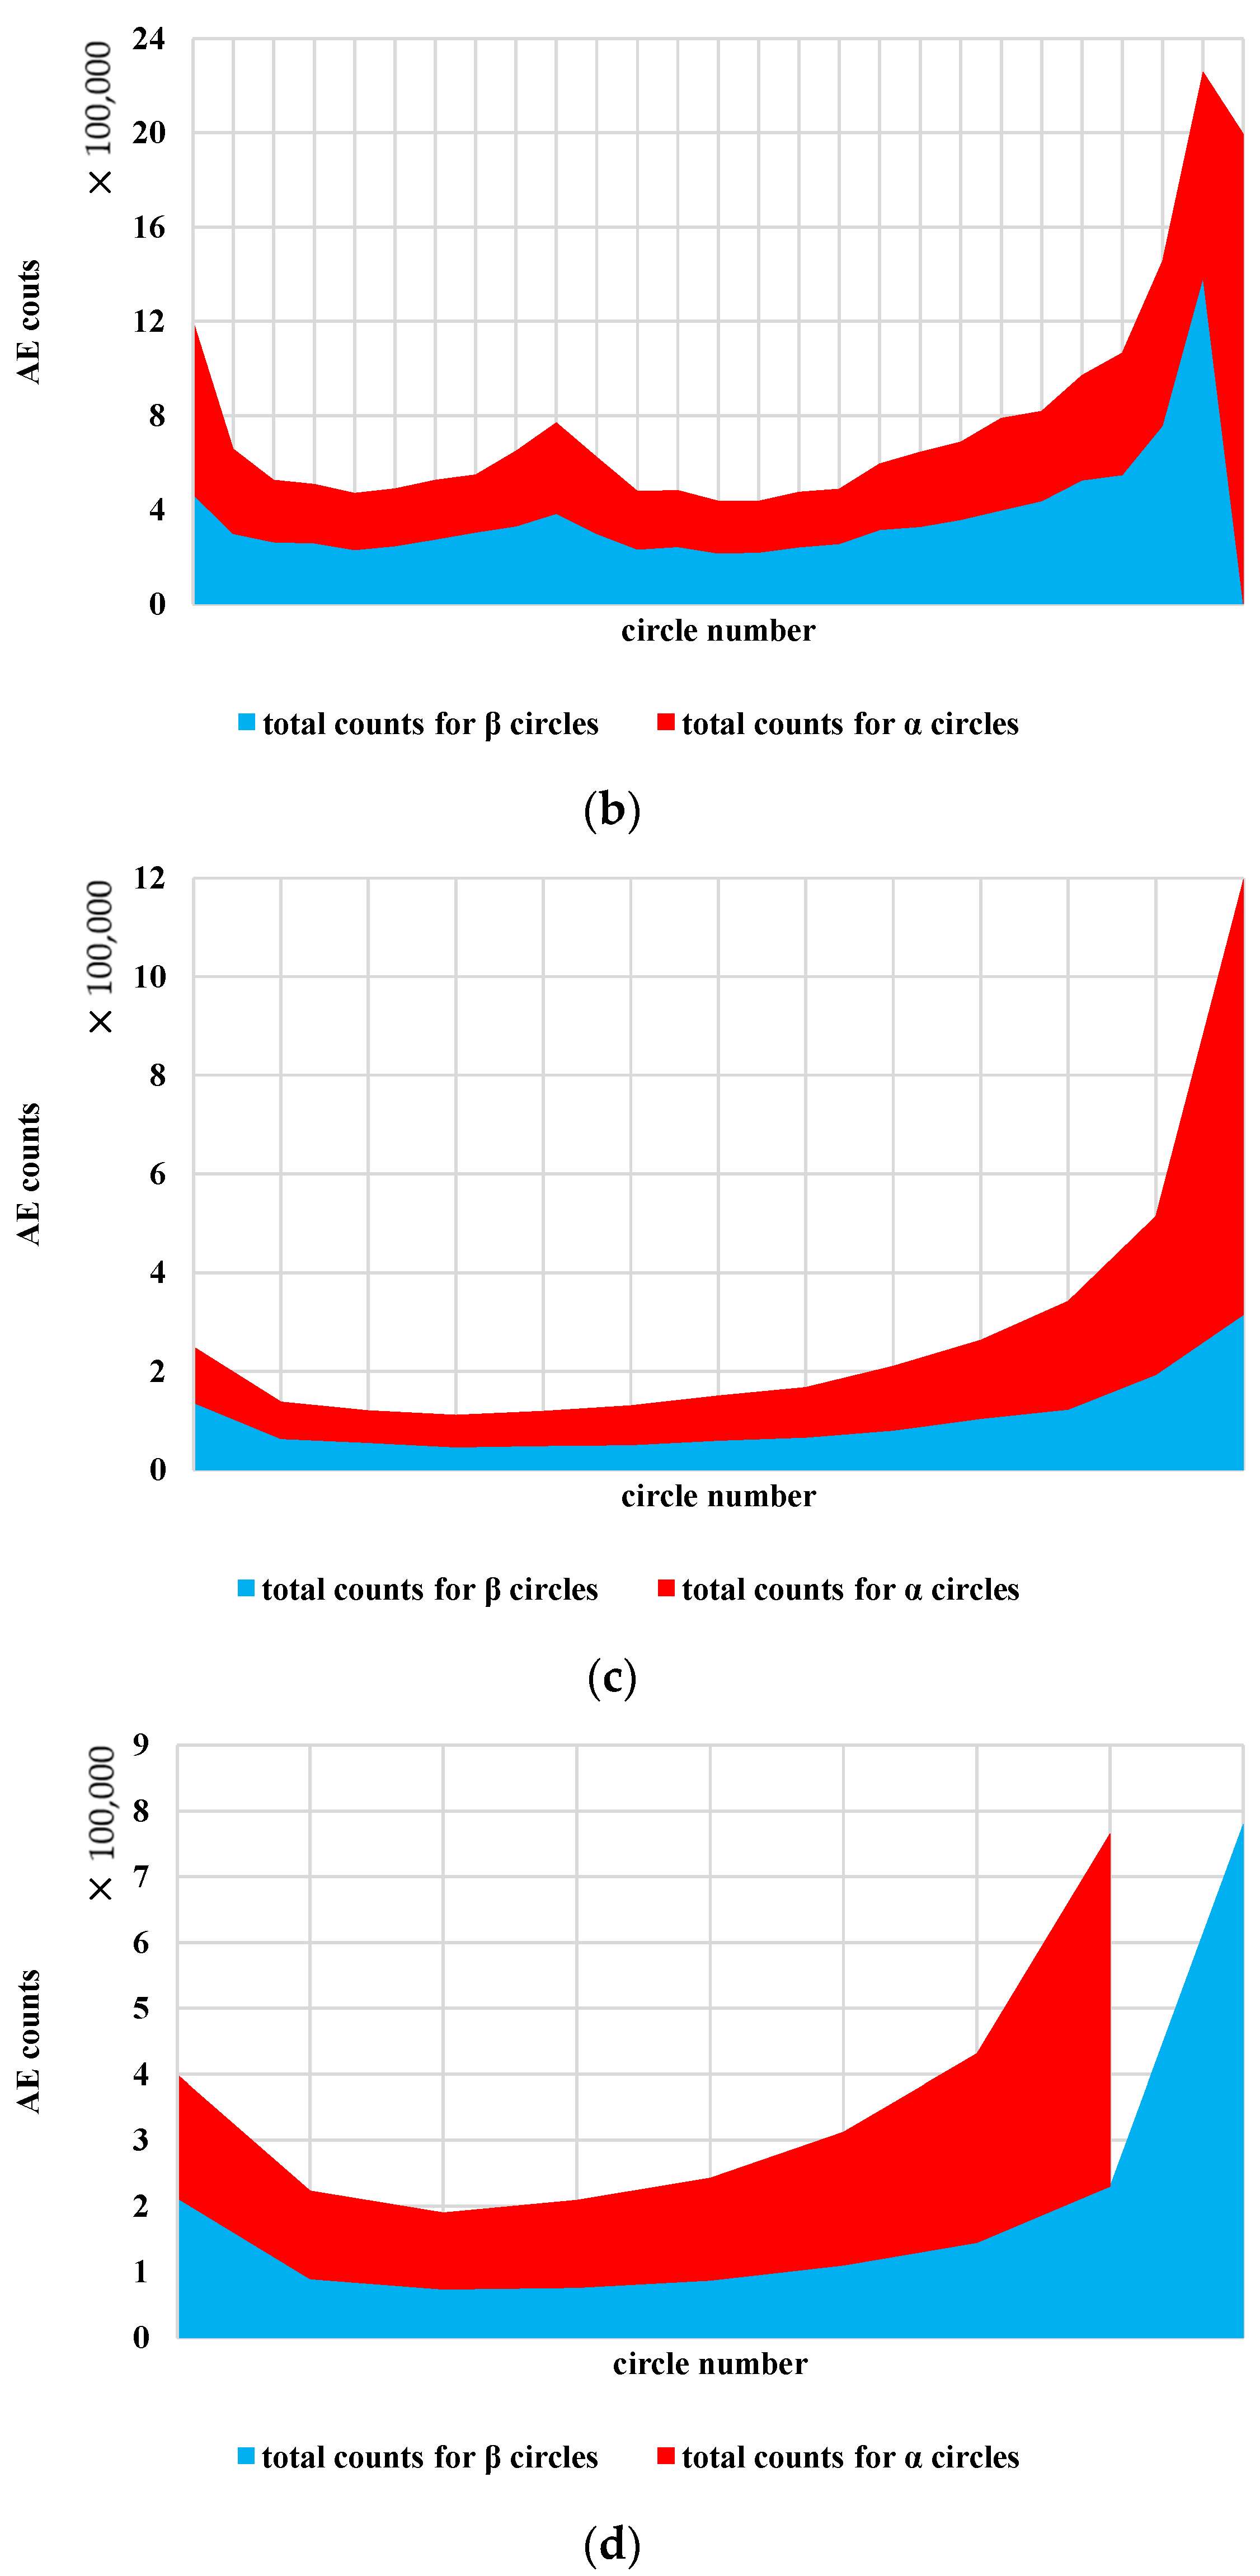
α circles obviously produce a greater number of acoustic emission counts than β circles. Acoustic emission activity becomes more active in α circles during intervals of no stress, and the longer the interval, the more obvious this phenomenon is.
(4)
The residual stress urges the inverse movement of dislocation during intervals, which is beneficial to the regression of dislocation and the generation of new glide plane. The reverse softening caused by the Bauschinger effect makes the inner structure of salt more unconsolidated, which accelerates the accumulation of plastic deformation.
(5)
A qualitative relationship between the accumulated damage variable and the time interval is established, and an acceleration effect conclusion of time interval is obtained. A prediction model of salt’s fatigue life is proposed on the basis of time interval.
(6)
The phenomenon of AE activity demonstrates that residual stress leads to internal structural adjustment of rock salt on a mesoscopic scale during the interval when no stress is applied. Reverse softening caused by the Bauschinger effect accelerates the accumulation of plastic deformation. A relationship between fatigue life and the length of the time interval with no stress is established on the basis of AE variables, and the mechanism of the time interval on fatigue activity is explained.
(7)
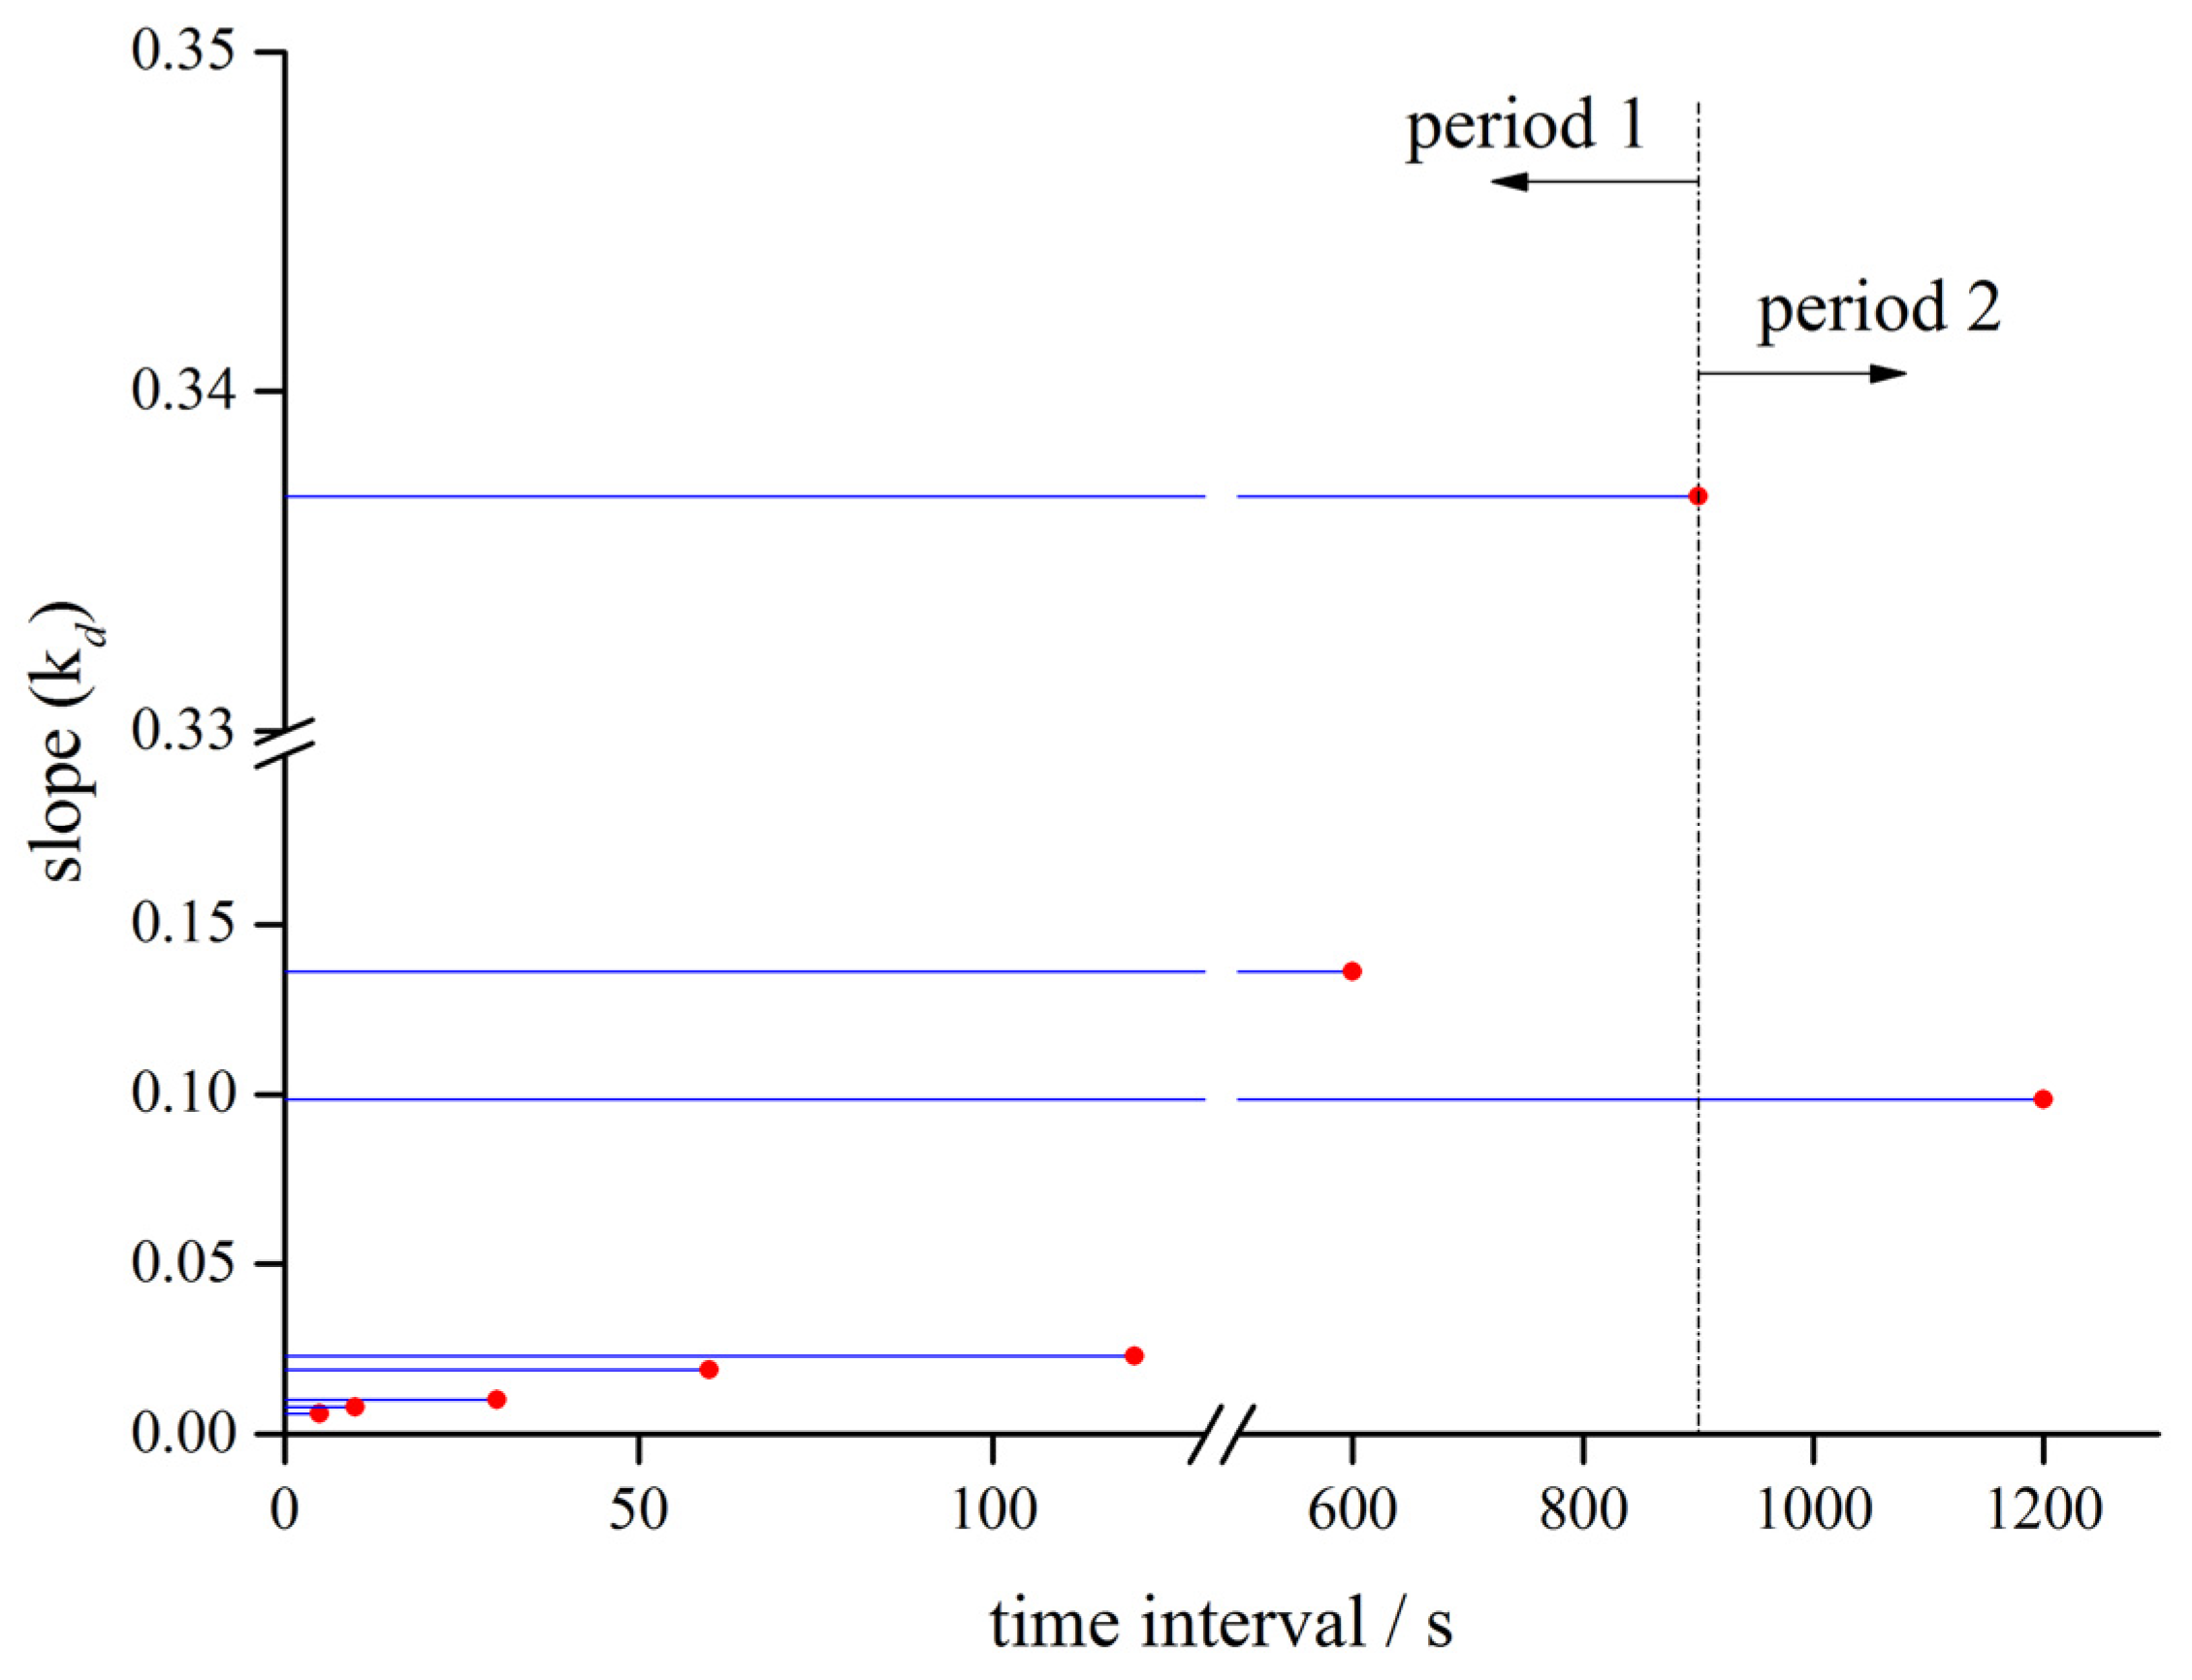
Our observation holds for time intervals extending in duration to 900 s; for longer time periods, the fatigue life of the salt increases slightly.

Author Contributions

Conceptualization, Y.C.; methodology, Y.C. and P.Z.; funding acquisition, Y.F.; writing—review and editing, Y.C. and N.Q.; visualization, Y.C. and C.L.; supervision, Y.C. and N.Q.; resources, S.Q. and X.C. All authors have read and agreed to the published version of the manuscript.

Funding

This research was funded by “Construction Science and Technology Project of Chongqing, grant No. CK2021 2-10” and “Science Foundation of Chongqing (General Program), grant no. cstc2021jcyj- msxmX1137”.

Institutional Review Board Statement

Not applicable.

Informed Consent Statement

Not applicable.

Conflicts of Interest

The authors declare no conflict of interest.

References

  1. Hunsche, U. Fracture experiments on cubic rock salt samples. In Proceedings of the First International Mechanical Behavior of Salt Conference, State College, PA, USA, 9–11 November 1981; pp. 169–179. [Google Scholar]
  2. Spiers, C.J.; Peach, C.J.; Brzesowsky, R.H.; Schutjens, P.M.; Liezenberg, J.L.; Zwart, H.J. Long term rheological and transport properties of dry and wet salt rocks. In Nuclear Science and Technology; Final Report; Commission of the European Communities: Utrecht, The Netherlands, 1988. [Google Scholar]
  3. Chan, K.S.; Bodner, S.R.; Fossum, A.F.; Munson, D.E. A damage mechanics treatment of creep failure in rock salt. Int. J. Damage Mech. 1997, 6, 121–152. [Google Scholar] [CrossRef]
  4. Chan, K.S.; Bodner, S.R.; Munson, D.E. Recovery and healing of damage in WIPP salt. Int. J. Damage Mech. 1998, 7, 143–166. [Google Scholar] [CrossRef]
  5. Spiers, C.J.; Peach, C.J.; Koelemeijer, P.J. Surface diffusivity of cleaved NaCl crystals as a function of humidity: Impedance spectroscopy measurements and implications for crack healing in rock salt. J. Geophys. Res. 2012, 117, B1201–B1205. [Google Scholar]
  6. Takeuchi, S.; Argon, A.S. Steady-state creep of single-phase crystalline matter at high temperature. J. Mater. Sci. 1976, 11, 1542–1566. [Google Scholar] [CrossRef]
  7. Fuenkajorn, K.; Phueakphum, D. Laboratory assessment of healing of fractures in rock salt. Bull. Eng. Geol. Environ. 2011, 70, 665–672. [Google Scholar] [CrossRef]
  8. Stormont, J.C.; Daemen, J.J.K. Laboratory study of gas permeability changes in rock salt during deformation. Int. J. Rock Mech. Min. Sci. Geomech. Abstr. 1992, 29, 325–342. [Google Scholar] [CrossRef]
  9. Alkan, H.; Cinar, Y.; Pusch, G. Rock salt dilatancy boundary from combined acoustic emission and triaxial compression tests. Int. J. Rock Mech. Min. 2007, 44, 108–119. [Google Scholar] [CrossRef]
  10. VeziroAlu, T.N.; Sahin, S. 21st Century’s energy: Hydrogen energy system. Energy Convers. Manag. 2008, 49, 1820. [Google Scholar] [CrossRef]
  11. Ozarslan, A. Large-scale hydrogen energy storage in salt caverns. Int. J. Hydrogen Energy 2012, 37, 14265. [Google Scholar] [CrossRef]
  12. Goodman, R.E. Subaudible noise during compression of rocks. Geol. Soc. Am. Bull. 1963, 74, 487–490. [Google Scholar] [CrossRef]
  13. Antonaci, P.; Bocca, P.; Masera, D. Fatigue crack propagation monitoring by Acoustic Emission signal analysis. Eng. Fract. Mech. 2012, 81, 26–32. [Google Scholar] [CrossRef]
  14. Wang, J.; Zhang, Q.; Song, Z.; Liu, X.; Wang, X.; Zhang, Y. Microstructural variations and damage evolvement of salt rock under cyclic loading. Int. J. Rock Mech. Min. 2022, 152, 105078. [Google Scholar] [CrossRef]
  15. Li, Z.; Tian, H.; Niu, Y.; Wang, E.; Zhang, X.; He, S.; Wang, F.; Zheng, A. Study on the acoustic and thermal response characteristics of coal samples with various prefabricated crack angles during loaded failure under uniaxial compression. J. Appl. Geophys. 2022, 200, 104618. [Google Scholar] [CrossRef]
  16. Čtvrtlík, R.; Čech, J.; Tomáštík, J.; Václavek, L.; Haušild, P. Plastic instabilities explored via acoustic emission during spherical nanoindentation. Mater. Sci. Eng. A 2022, 841, 143019. [Google Scholar] [CrossRef]
  17. Loukidis, A.; Triantis, D.; Stavrakas, I.; Pasiou, E.D.; Kourkoulis, S.K. Detecting Criticality by Exploring the Acoustic Activity in Terms of the “Natural-Time” Concept. Appl. Sci. 2021, 12, 231. [Google Scholar] [CrossRef]
  18. Maji, V.; Murton, J.B. Experimental Observations and Statistical Modeling of Crack Propagation Dynamics in Limestone by Acoustic Emission Analysis during Freezing and Thawing. J. Geophys. Res. Earth Surf. 2021, 126, e2021JF006127. [Google Scholar] [CrossRef]
  19. Dimos, T.; Ilias, S.; Ermioni, D.P.; Stavros, K.K. Assessing the acoustic activity in marble specimens under stepwise compressive loading. Mater. Des. Process. Commun. 2020, 2, e100. [Google Scholar]
  20. Md, N.N.; Abdullah, S.; Mat, S.S.N. On the need to determine the acoustic emission trend for reinforced concrete beam fatigue damage. Int. J. Fatigue 2021, 152, 106421. [Google Scholar]
  21. Bagde, M.N.; Petroš, V. Fatigue properties of intact sandstone samples subjected to dynamic uniaxial cyclical loading. Int. J. Rock Mech. Min. 2005, 42, 237–250. [Google Scholar] [CrossRef]
  22. Ovid’Ko, I.A.; Skiba, N.V. Enhanced dislocation emission from grain boundaries in nanocrystalline materials. Scr. Mater. 2012, 67, 13. [Google Scholar] [CrossRef]
  23. Bobylev, S.V.; Ovid’Ko, I.A. Transformations of faceted grain boundaries in high-Tc superconductors. Phys. Rev. B 2003, 67, 132506. [Google Scholar] [CrossRef]
  24. Berhardt, E.; Stead, D.; Stimpson, B. Quantifying progressive pre-peak brittle fracture damage in rock during uniaxial compression. Int. J. Rock Mech. Min. 1999, 36, 361–380. [Google Scholar] [CrossRef]
  25. Eberhardt, E.; Stead, D.; Stimpson, B.; Read, R.S. Identifying crack initiation and propagation thresholds in brittle rock. Can. Geotech. J. 1998, 35, 222–233. [Google Scholar] [CrossRef]
  26. Bassett, G.A.; Menter, J.W.; Pashley, D.W. Moire Patterns on Electron Micrographs, and their Application to the Study of Dislocations in Metals. Proc. R. Soc. London. Ser. A Math. Phys. Sci. 1958, 246, 345–368. [Google Scholar]
  27. Elder, K.R.; Grant, M. Modeling elastic and plastic deformations in nonequilibrium processing using phase field crystals. Phys. Rev. E Stat. Nonlin. Soft Matter. Phys. 2004, 70, 51605. [Google Scholar] [CrossRef] [Green Version]
  28. Irani, N.; Remmers, J.J.C.; Deshpande, V.S. Finite strain discrete dislocation plasticity in a total Lagrangian setting. J. Mech. Phys. Solids 2015, 83, 160–178. [Google Scholar] [CrossRef]
  29. Read, W.T.; Frank, F.C. Multiplication Processes for Slow Moving Dislocations. Phys. Rev. 1950, 79, 722–723. [Google Scholar]
  30. Cottrell, A.H. Dislocations and the Mechanical Properties of Crystals. Nature 1956, 178, 1090–1092. [Google Scholar] [CrossRef] [Green Version]
  31. Sethna, J.P.; Dahmen, K.A.; Myers, C.R. Crackling noise. Nature 2001, 410, 242–250. [Google Scholar] [CrossRef] [Green Version]
  32. Bauschinger; Belk, W.; Bomches, F.; Dyce Cay, W.; Cay, W.; Colson, C.; Dyke, T.; Gostling, W.; Heintzel, C.; Higgin, G.; et al. CORRESPONDENCE. PORTLAND CEMENT. In Minutes of the Proceedings of the Institution of Civil Engineers; Thomas Telford-ICE Virtual Library: London, UK, 1880; Volume 62. [Google Scholar]
  33. Kachanov, M.L. A microcrack model of rock inelasticity part I: Frictional sliding on microcracks. Mech. Mater. 1982, 1, 19–27. [Google Scholar] [CrossRef]
  34. Lavrov, A. Kaiser effect observation in brittle rock cyclically loaded with different loading rates. Mech. Mater. 2001, 33, 669–677. [Google Scholar] [CrossRef]
  35. Lavrov, A.; Vervoort, A.; Wevers, M.; Napier, J.A.L. Experimental and numerical study of the Kaiser effect in cyclic Brazilian tests with disk rotation. Int. J. Rock Mech. Min. 2002, 39, 287–302. [Google Scholar] [CrossRef] [Green Version]
  36. Lavrov, A. The Kaiser effect in rocks: Principles and stress estimation techniques. Int. J. Rock Mech. Min. 2003, 40, 151–171. [Google Scholar] [CrossRef]
  37. Mazars, J. A description of micro- and macroscale damage of concrete structures. Eng. Fract. Mech. 1986, 25, 729–737. [Google Scholar] [CrossRef]
  38. Desai, C.S.; Woo, L. Damage model and implementation in nonlinear dynamic problems. Comput. Mech. 1993, 11, 189–206. [Google Scholar]
  39. Desai, C.S.; Sherif, S.A. Mechanics of Materials and Interfaces: The Disturbed State Concept. Appl. Mech. Rev. 2001, 54, B57. [Google Scholar] [CrossRef]
  40. Katti, D.R.; Desai, C.S. Modeling and testing of cohesive soil using disturbed-state concept. J. Eng. Mech. 1995, 121, 648–658. [Google Scholar] [CrossRef]
  41. Shao, C.; Desai, C.S. Implementation of DSC model and application for analysis of field pile tests under cyclic loading. Int. J. Numer. Anal. Met. 2000, 24, 601–624. [Google Scholar] [CrossRef]
  42. Liu, M.D.; Carter, J.P.; Desai, C.S.; Xu, K.J. Analysis of the compression of structured soils using the disturbed state concept. Int. J. Numer. Anal. Met. 2000, 24, 723–735. [Google Scholar] [CrossRef]
Figure 1. (a) The triaxial loading system.1—salt rock sample; 2—limber; 3—compression plate; 4—compression plate; 5—engine base; 6—strut; 7—cylinder; 8—servo hydraulic station; 9—confining pressure chamber; 10—axial compression; 11—dissolved liquid cylinder; 12—brine pump; 13—flow meter; 14—relief valve; 15—dissolved liquid container; 16—heat tape; 17—temperature sensor; 18—temperature controller. (b) The actual triaxial loading apparatus. (c) Acoustic emission test and analysis system.
Applsci 12 05528 g001aApplsci 12 05528 g001b
Figure 2. 1,2,3,4 are positions of AE sensors with respect to the rock salt specimens: (a) top view and (b) side view.
Applsci 12 05528 g002
Figure 3. (a) The real rock salt samples. (b) Components of rock salt used in the tests.
Applsci 12 05528 g003
Figure 4. Stress paths of (a) classic fatigue and (b) fatigue as a function of time interval.
Applsci 12 05528 g004
Figure 5. Fatigue strain path as a function of time interval.
Applsci 12 05528 g005
Figure 6. Residual axial strain for each loading circle for (a) the classic fatigue experiment and (b) the control group experiment with a time interval of 5 s.
Applsci 12 05528 g006
Figure 7. Strain curves and (a) AE counts, (b) AE energy features for the fatigue tests carried out with a 30 s interval.
Applsci 12 05528 g007
Figure 8. (a) Failure condition of rock salt after experiment. SEM images of micro cracks for (b) the first circle and (c) the complete circle.
Applsci 12 05528 g008
Figure 9. Features of AE counts for tests carried out with fatigue intervals of (a) 5 s, (b) 10 s, (c) 60 s, (d) 120 s, (e) 600 s, (f) 900 s, and (g) 1200 s.
Applsci 12 05528 g009aApplsci 12 05528 g009bApplsci 12 05528 g009c
Figure 10. Partial enlarged detail of Figure 7a for test carried out with a 30 s fatigue interval.
Applsci 12 05528 g010
Figure 11. Area graphs showing the accumulated AE counts produced in each circle for fatigue tests with intervals of (a) 5 s, (b) 10 s, (c) 30 s, (d) 60 s, (e) 120 s, (f) 600 s, (g) 900 s, and (h) 1200 s.
Applsci 12 05528 g011aApplsci 12 05528 g011bApplsci 12 05528 g011cApplsci 12 05528 g011d
Figure 12. Trends of Ni(X) as a function of fatigue interval duration.
Applsci 12 05528 g012
Figure 13. Accumulated damage curves-Di.
Applsci 12 05528 g013
Figure 14. Relationship between the slope of the linear equation (kd) and the time intervals during the stable damage phases.
Applsci 12 05528 g014
Table 1. C values of the exponential fit of the residual strain and fatigue life of samples subjected to different fatigue interval durations.
Interval Duration
(s)
C/y = aebx + CAverage Fatigue Life
Ceven/‰Codd/‰(Codd − Ceven)/‰
0 (classic fatigue)0.480.490.0188
50.81.040.2452
100.870.990.1254
301.292.050.7627
602.052.560.5118
1201.972.900.9313
6002.373.591.227
9004.414.501.094
12002.483.230.7510
Publisher’s Note: MDPI stays neutral with regard to jurisdictional claims in published maps and institutional affiliations.

