Article

On-Site Full-Scale Load Test and Reliability Evaluation of Prefabricated Bridge Substructure for “Pile–Column Integration”

1
Bridge Engineering Research Institute, Guangxi Transportation Science and Technology Group Co., Ltd., Nanning 530007, China
2
Guangxi Beibu Gulf Investment Group Co., Ltd., Nanning 530029, China
3
School of Civil Engineering, Southeast University, Nanjing 211189, China
4
College of Transportation, Jilin University, Changchun 130025, China
*
Author to whom correspondence should be addressed.
These authors contributed equally to this work.
Appl. Sci. 2022, 12(11), 5520; https://doi.org/10.3390/app12115520
Submission received: 19 April 2022 / Revised: 27 May 2022 / Accepted: 27 May 2022 / Published: 29 May 2022

Abstract

:
The application of prefabricated bridge structures is of great significance to building industrialization, which can realize the green construction and maintenance process of low energy consumption and low emission as well as the normal operation of transportation in time, and effectively realize the green development requirements. However, the substructure of a conventional prefabricated bridge usually needs to cast a bearing platform between pier and column, and may not give full play to the advantages of prefabricated bridge construction. Given the engineering characteristics that most of the pile foundations in the bridge design of this engineering project are end-bearing piles, in which the pile foundation is not deep and the pile column is not high, the assembly process of “pile–column integration” has been proposed in this study. Aiming at the reconstruction and expansion project of the Qinzhou–Beihai section in the Lanzhou–Haikou expressway, the test site with representative geological conditions was firstly selected. The pile–column structure of the bridge can be completed by prefabricated pile foundation, pier, and cap beam based on the integral assembly installation method. The vertical compressive static load test, horizontal static load test, and reliability test of pile–column connection were introduced in detail to analyze whether the bearing capacity and connection effect of pile–column can meet the requirements. Test results showed that the limit value and corresponding characteristic value of the vertical compressive bearing capacity and horizontal critical load of a single pile could meet the design requirements. The displacement curve of single pile No. 5 at the flange connection position under various loads of the test pile does not have an obvious angle break, and there is no sudden change in the slope, indicating that the flange connection quality is good. Due to many interference factors and some abnormal strain measurement data, the strain data are suggested as auxiliary to the displacement results. The findings of static load testing and connection reliability in this study proved the feasibility of this prefabricated bridge substructure “pile–column integration”, which can provide a reference for the rapid construction of bridges.

1. Introduction

With the acceleration of urbanization and the rapid development of highway construction, roads and bridges, as important transportation facilities, provide a great convenience for people’s life and production [1,2,3,4]. The development model of a resource-saving and environment-friendly society puts forward more urgent requirements for the development of transportation and the construction of roads and bridges [5,6,7]. The development of prefabricated bridge structures is the way for building industrialization, which can realize the construction process of low energy consumption and low emission, and effectively realize the green development requirements of construction [8,9,10].
At present, bridge construction in China mostly adopts the cast-in-situ concrete construction method [11,12]. This construction method has a long construction period and many wet operations on-site, which will have a great impact on the surrounding environment. In addition, the consumption of supports and formwork in the construction is large, leading to a high construction cost, and it directly affects the load capacity of the construction site, which is inconsistent with the development requirements of urban and rural construction [13,14]. Especially when the highway passes through mountainous areas or environmentally sensitive areas, under the construction conditions of ecological and environmental protection, it is urgent to find a bridge construction method to reduce the environmental impact and develop China’s prefabricated bridge structure. In order to deal with the defects of cast-in-situ concrete construction, prefabricated bridges have been widely used abroad [9,15,16,17]. In 1971, the first bridge with segmental pier technology, i.e., the Corpus Christi Causeway Bridge, was completed in Texas, US [18,19]. In 1987, the pier structure of Linn Cove Viaduct used prefabrication and assembly technology to reduce the impact on the surrounding environment during the construction process, speed up the project construction progress, and complete the project construction ahead of schedule, which has become a classic engineering example in the prefabrication and assembly bridge structure [20]. In 1997, the Oresund Bridge was completed to connect Copenhagen, Denmark, and Malmo, Sweden, in which the pier body parts were prefabricated and then assembled on-site [21]. In 2011, the I/C-span precast girder bridge in Washington, US was completed, which adopted precast assembly technology and used grouting sleeves to connect the pier body and bearing platform [22]. Prefabricated bridges in China started late and are not widely used at present. Only when some sea-crossing bridges or cast-in-situ construction are difficult, the prefabricated construction method would be adopted [15,23,24]. The pier body and box girder of the Donghai Bridge built in 2006 were prefabricated on the island and installed offshore. The pier adopted reinforced concrete hollow thin-walled pier, the low pier was prefabricated and lifted integrally at sea, and the medium and high pier adopted offshore assembly technology [25]. The pier body structure of the non-navigable hole in the deep water area of the Shanghai Yangtze River bridge adopted hollow thin-wall assembly technology [26]. The approach bridge of Hangzhou Bay Cross-Sea Bridge also transported the prefabricated rectangular hollow pier to the site for assembly [27]. By using prefabricated piers in non-navigable holes, the construction difficulty of Zhoushan Jintang Bridge was reduced and the construction period was accelerated [28]. The non-navigable span bridge of the newly-built Hong Kong–Zhuhai–Macao Bridge also adopted prefabrication and assembly technology [27]. As can be seen from the above development, the prefabricated bridge structure can greatly improve the mechanized operation level through the prefabricated construction method. On the premise of ensuring the project quality, it can greatly speed up the construction progress, improve the construction production efficiency, and be conducive to environmental protection. At the same time, the prefabrication and assembly technology of bridge structure has the characteristics of high efficiency, safety, high quality, speed, and environmental protection, which has become the development trend of bridge construction [29].
At the same time, scholars at home and abroad have also carried out a lot of research work on prefabricated bridge structures. In 2004, Billington et al. proposed a segmental assembled pier system and designed and manufactured seven specimens for the quasi-static test, and test results showed that the pier in this system had good ductility, strong energy consumption, small residual displacement, and improved ultimate load [30]. Marriott et al. conducted pseudo-static and pseudo-dynamic tests through the 1:3 scale models and obtained the self-resetting performance and seismic performance of the unbonded post-tensioned prestressed segmental pier with low carbon steel viscous damper were good [31]. Hung et al. put forward several methods to improve the energy dissipation capacity of the structure for the prestressed tensioned precast segmental piers widely used all over the world [32]. Moon et al. proposed a form of a prefabricated cylindrical section with hollows, to improve the seismic performance of the column [33]. Through the numerical study of the assembled pier of Donghai Bridge, Wang et al. discussed the influence of prestress on the seismic performance of the pier and put forward a method that can not only meet the operation requirements but also enhance the seismic performance [34]. Moreover, the soil field also has a significant influence on the internal force and deformation of piles. Ma et al. studied the effects of scouring and the layered soil on the dynamic response of the single pile by numerical calculation and parameter analysis [35]. Garala et al. investigated the influence of pile spacing on the dynamic behavior of pile groups by performing experiments on pile foundations embedded in a two-layered soil profile, and considered soil-pile-structure interaction effects [36].
The application of prefabricated bridges is of great significance to the development of building industrialization. However, the substructure of a conventional prefabricated bridge needs to cast a bearing platform between pier and column. This method will not only occupy the existing road, but also affect the rapid construction, and cannot give full play to the advantages of prefabricated bridge construction. Given the engineering characteristics that most of the pile foundations in the bridge design of this project are end-bearing piles, in which the pile foundation is not deep and the pile column is not high, the assembly process by using “pile–column integration” has been proposed in this study. Aiming at the reconstruction and expansion project of the Qinzhou–Beihai section of the Lanzhou–Haikou (i.e., Lanhai) expressway, the test site with representative geological conditions was firstly selected. The pile column structure of the bridge can be completed by prefabricated pile foundation, pier, and capping beam based on the integral assembly installation method. The vertical compressive static load test, horizontal static load test, and reliability test of pile–column connection were introduced in detail to analyze whether the bearing capacity and connection effect of pile–column can meet the requirements.

2. Materials and Methods

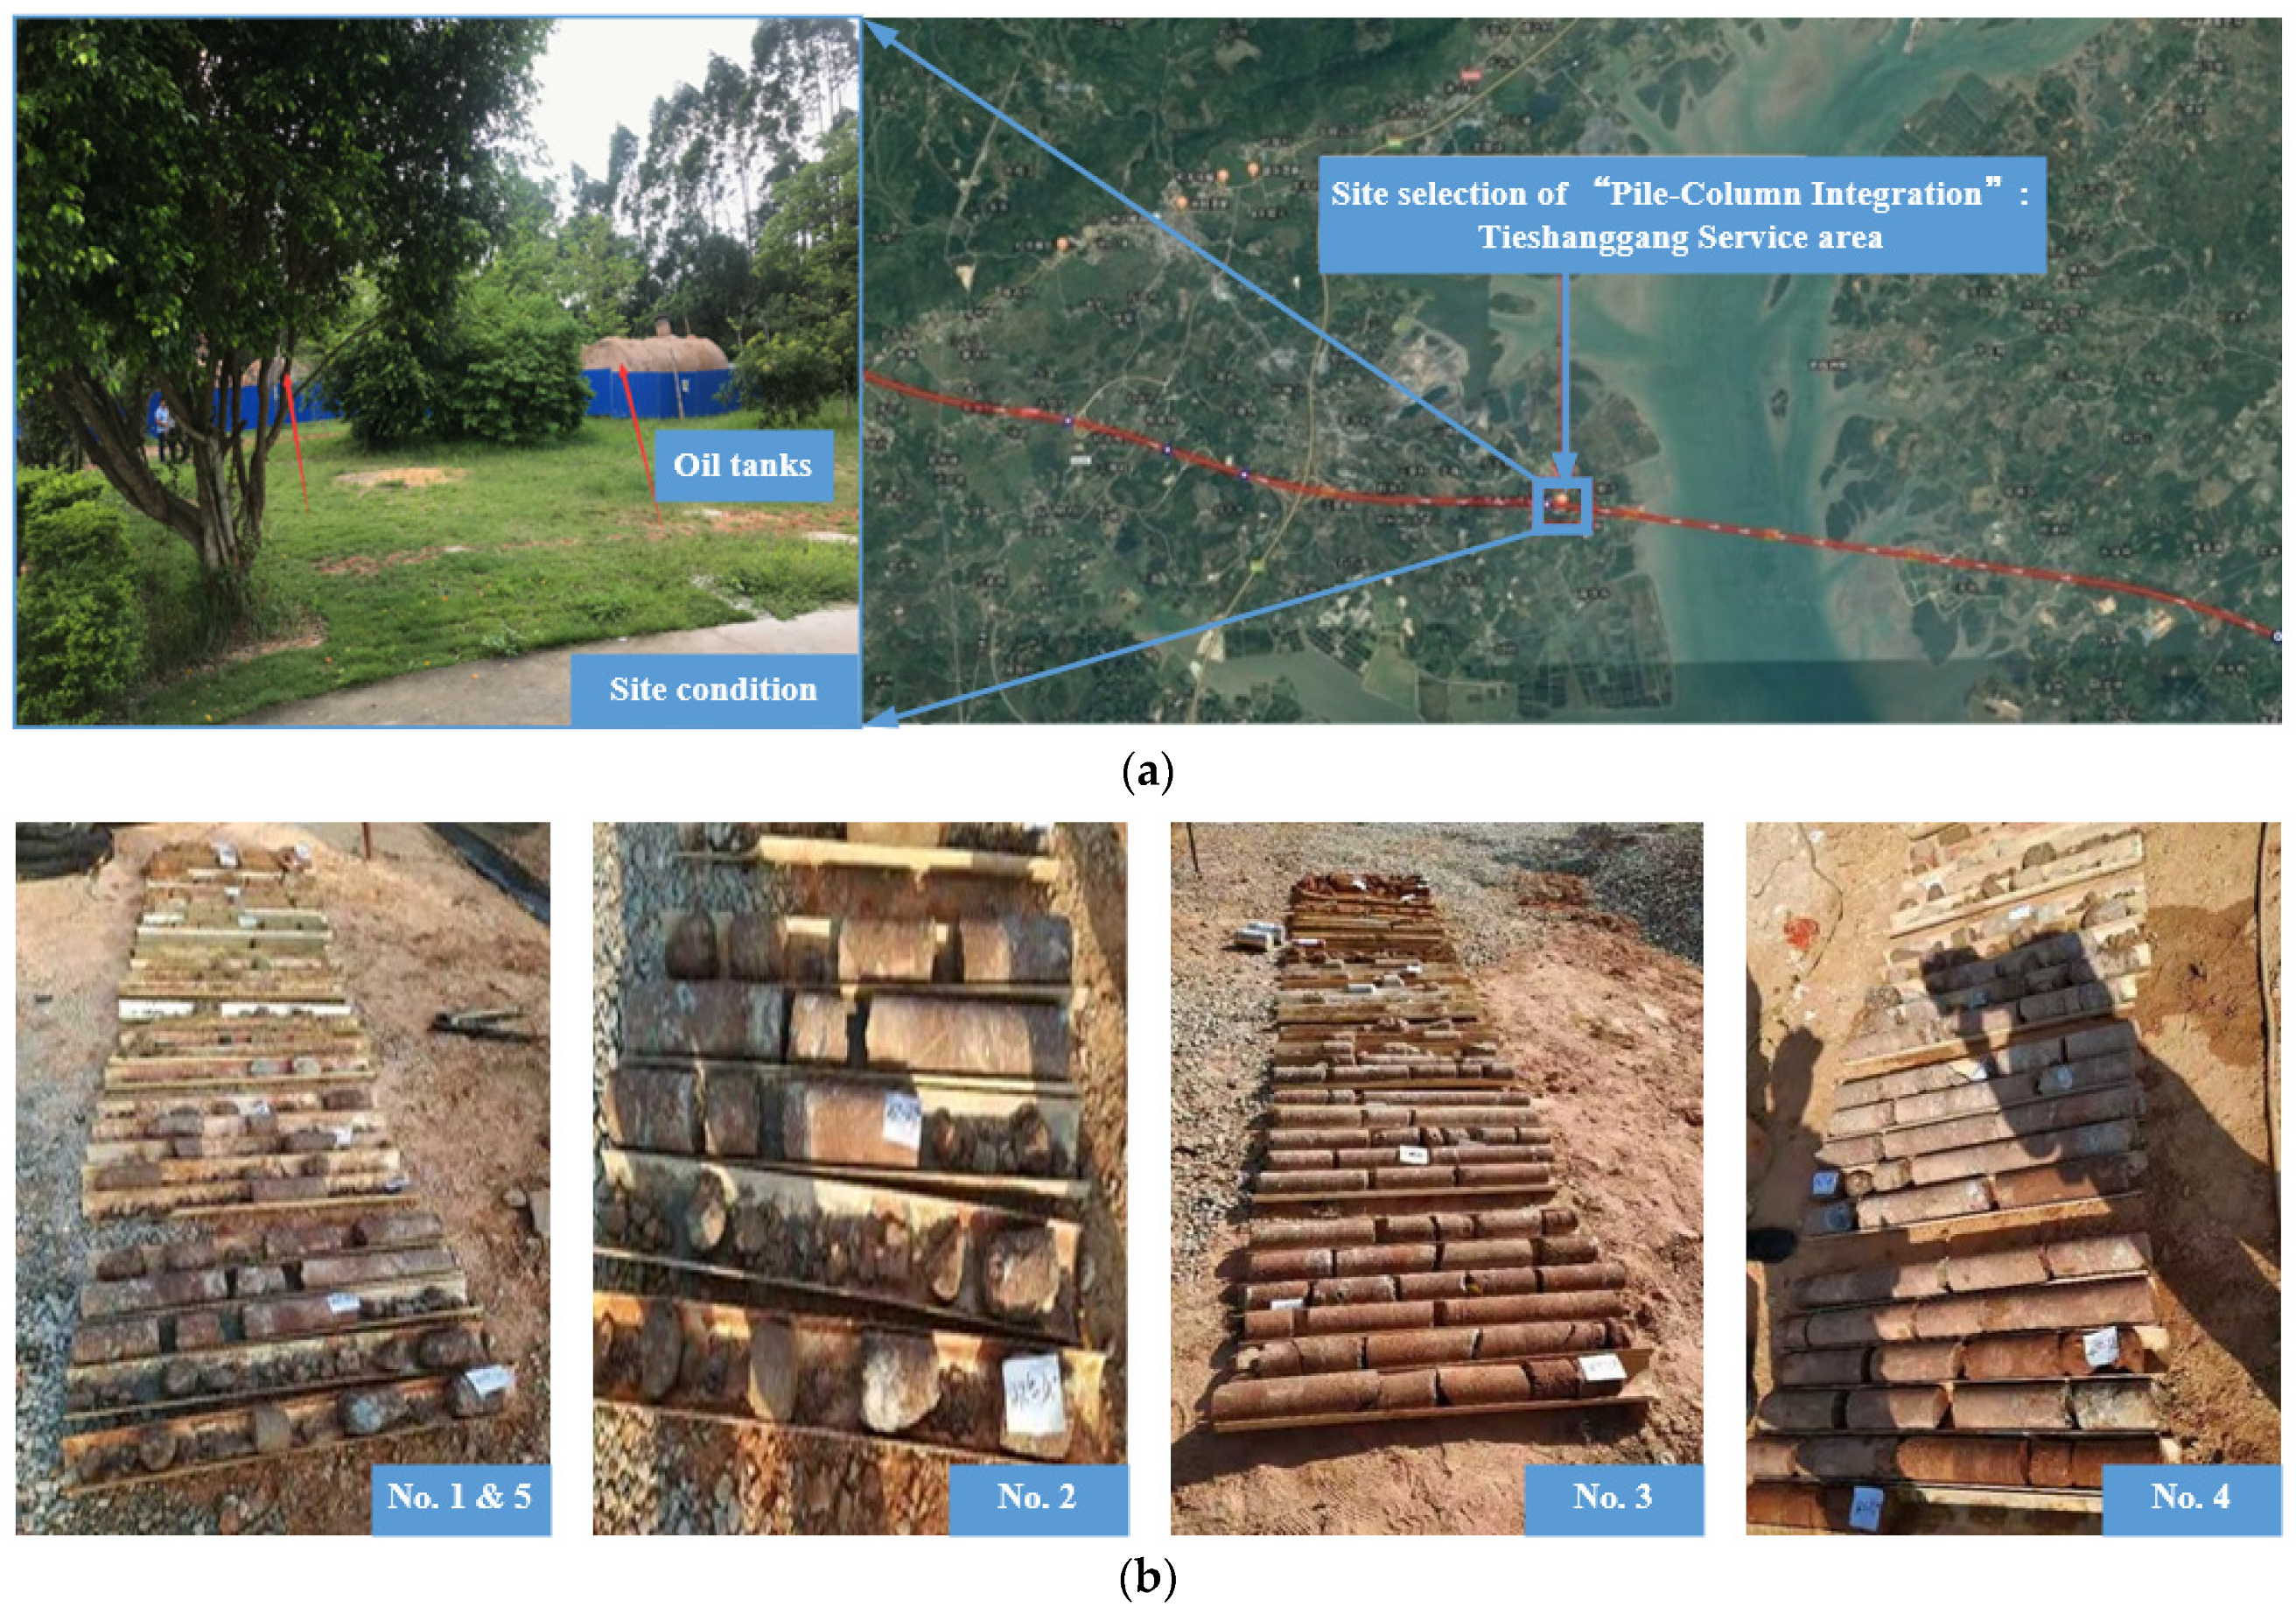
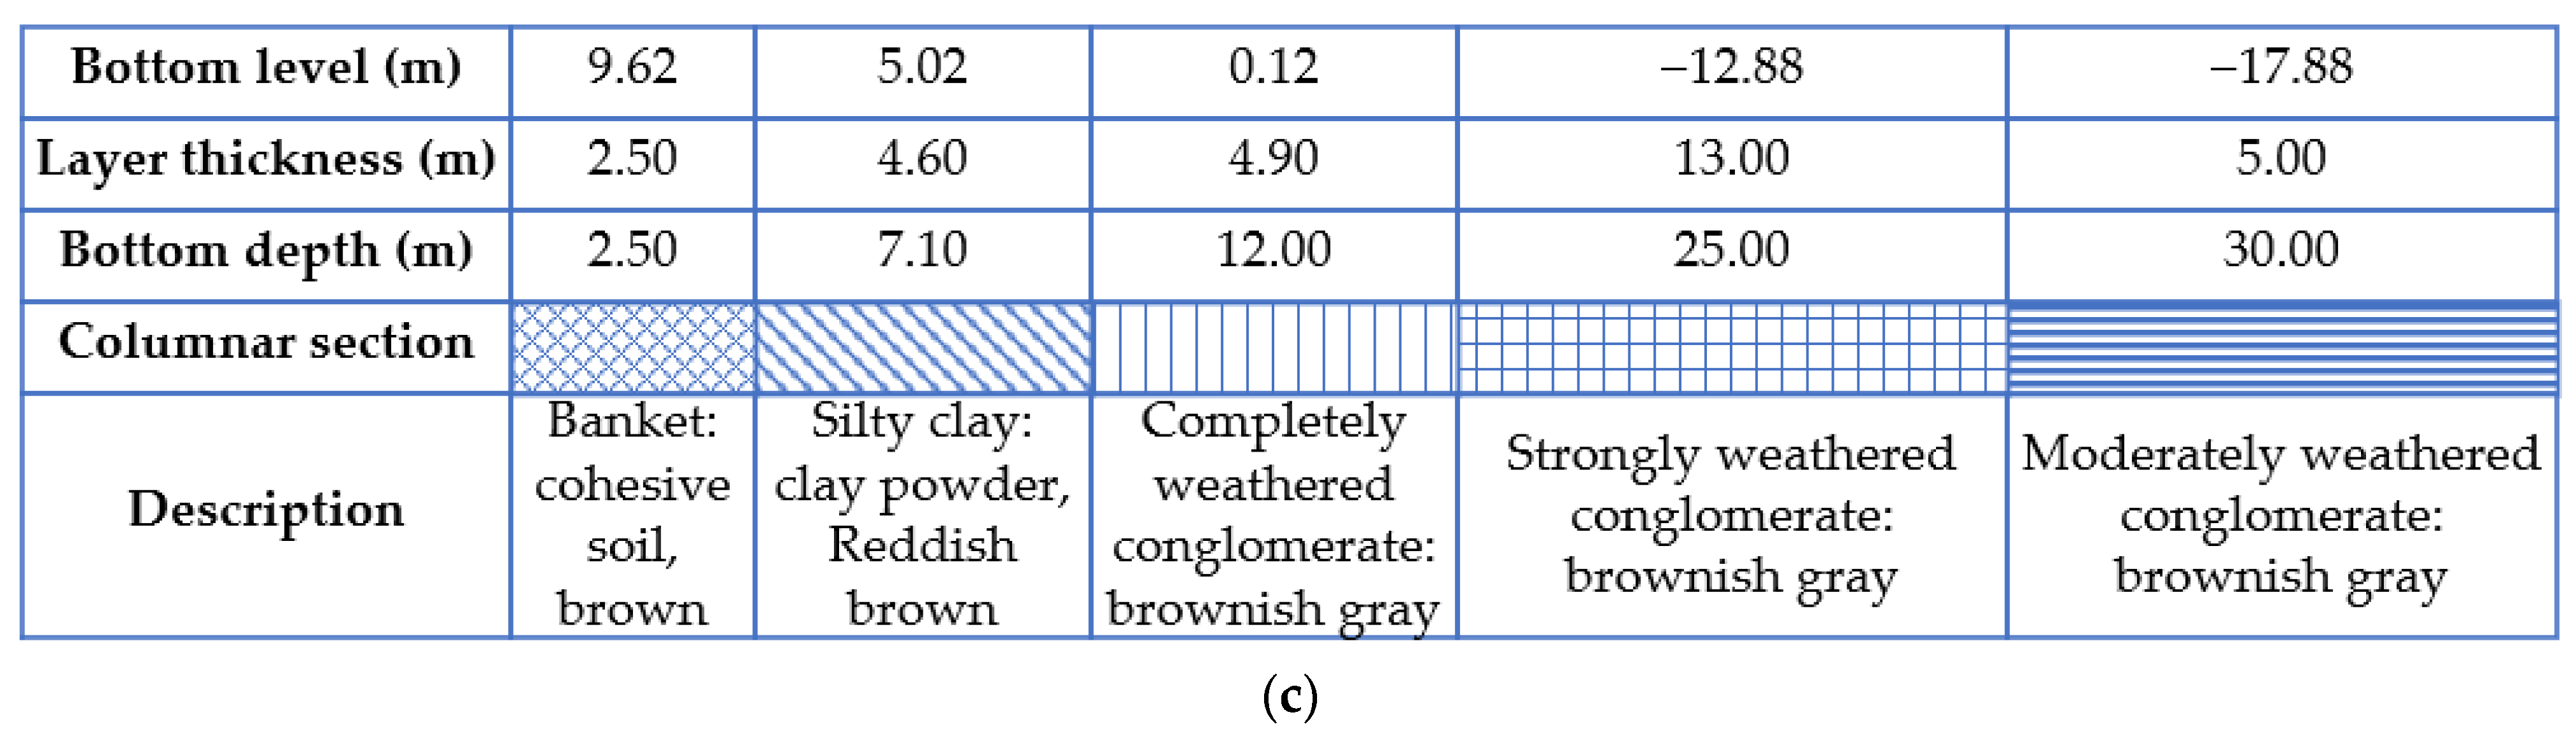
2.1. Description of Engineering Project and Geology Condition

In this study, the reconstruction and expansion project of the Qinzhou–Beihai section of the Lanzhou–Haikou (i.e., Lanhai) expressway, as the engineering project, is located in Qinzhou City and Beihai City, Guangxi. This project is divided into the Qinzhou section mainline of Lanhai Expressway and the Beihai branch line, which are important parts of the national expressway network. Qinshan section mainline (k2126+277~k2156+500) is routed from west to east, and the total length of the Qinshan section mainline is designed as 30.223 km. The Beihai branch line (lk540+000~lk550+000) is routed from north to south, and the total length of the Beihai branch line is designed as 10 km. Most of the pile foundations in the bridge design of this engineering project are end-bearing piles, in which the pile foundation is not deep and the pile column is not high. Therefore, the prefabricated construction of the bridge substructure could be easily realized. According to the field investigation and engineering geological conditions, the test site was selected as an open space on the downstream line of the Tieshangang service area. Figure 1a shows the schematic diagram of site selection and site conditions. The site is located in the northeast corner of the Tieshangang service area, which is a turf green land at present. Several oil tanks were stacked during the survey, which has little impact on the operation of the service area and has no conflict with the parking plan of the reconstructed service area, and, thus, this site can be considered used for the construction of a novel prefabricated bridge substructure “pile–column integration” [37]. In addition, the depth of the on-site geological survey is shallow and does not reach the moderately weathered or slightly weathered rock stratum, and the core samples of rock and soil are shown in Figure 1b. The basic parameters and analysis of soil behavior are presented in Figure 1c.
The original bridge adopted 3 × 20 m prestressed concrete simply supported bridge deck continuous hollow beam, the substructure abutment was column abutment and pile foundation, and the pier was column pier and expanded foundation. The original bridge deck was 28 m in width and 64.04 m in length. The abutment pile foundation at the lower part of the original bridge was designed as a rock socketed pile, embedded with weakly weathered quartz sandstone. The pier expanded the foundation, and the foundation entered strongly weathered quartz sandstone. All the superstructure of the original bridge will be removed, and a new prestressed concrete simply supported, and then a continuous box girder will be replaced. The expansion will be carried out with the same span and the same number of holes as the original bridge. After the reconstruction and expansion, the whole line will be uniformly expanded to eight lanes, that is, the reconstruction and expansion bridge is expanded from 28 m of the original bridge width to 44.5 m, 7 m on the left and 9.5 m on the right. The substructure of the new bridge could use the original pier column and foundation, and a new capping beam (abutment cap) would be built. The expansion part adopts a column pier and pile foundation with a column diameter of 1.3 m and pile diameter of 1.5 m according to the original pier and abutment structure layout and geological conditions and considering the feasibility of construction. The abutments on both banks shall be on both sides of the foundation of the original pile foundation column abutment, the conical slope shall be removed, and a 2 cm construction joint should be reserved at the connection part of the abutment cap between the existing old bridge and the widened bridge.

2.2. Raw Materials and Bridge Substructure

2.2.1. Main Materials and Properties

In this study, the materials used for the “Pile–Column Integration” technology of prefabricated bridges are mainly concrete and reinforcement. The properties of different grades of concrete and reinforcement are listed in Table 1 and Table 2, respectively.

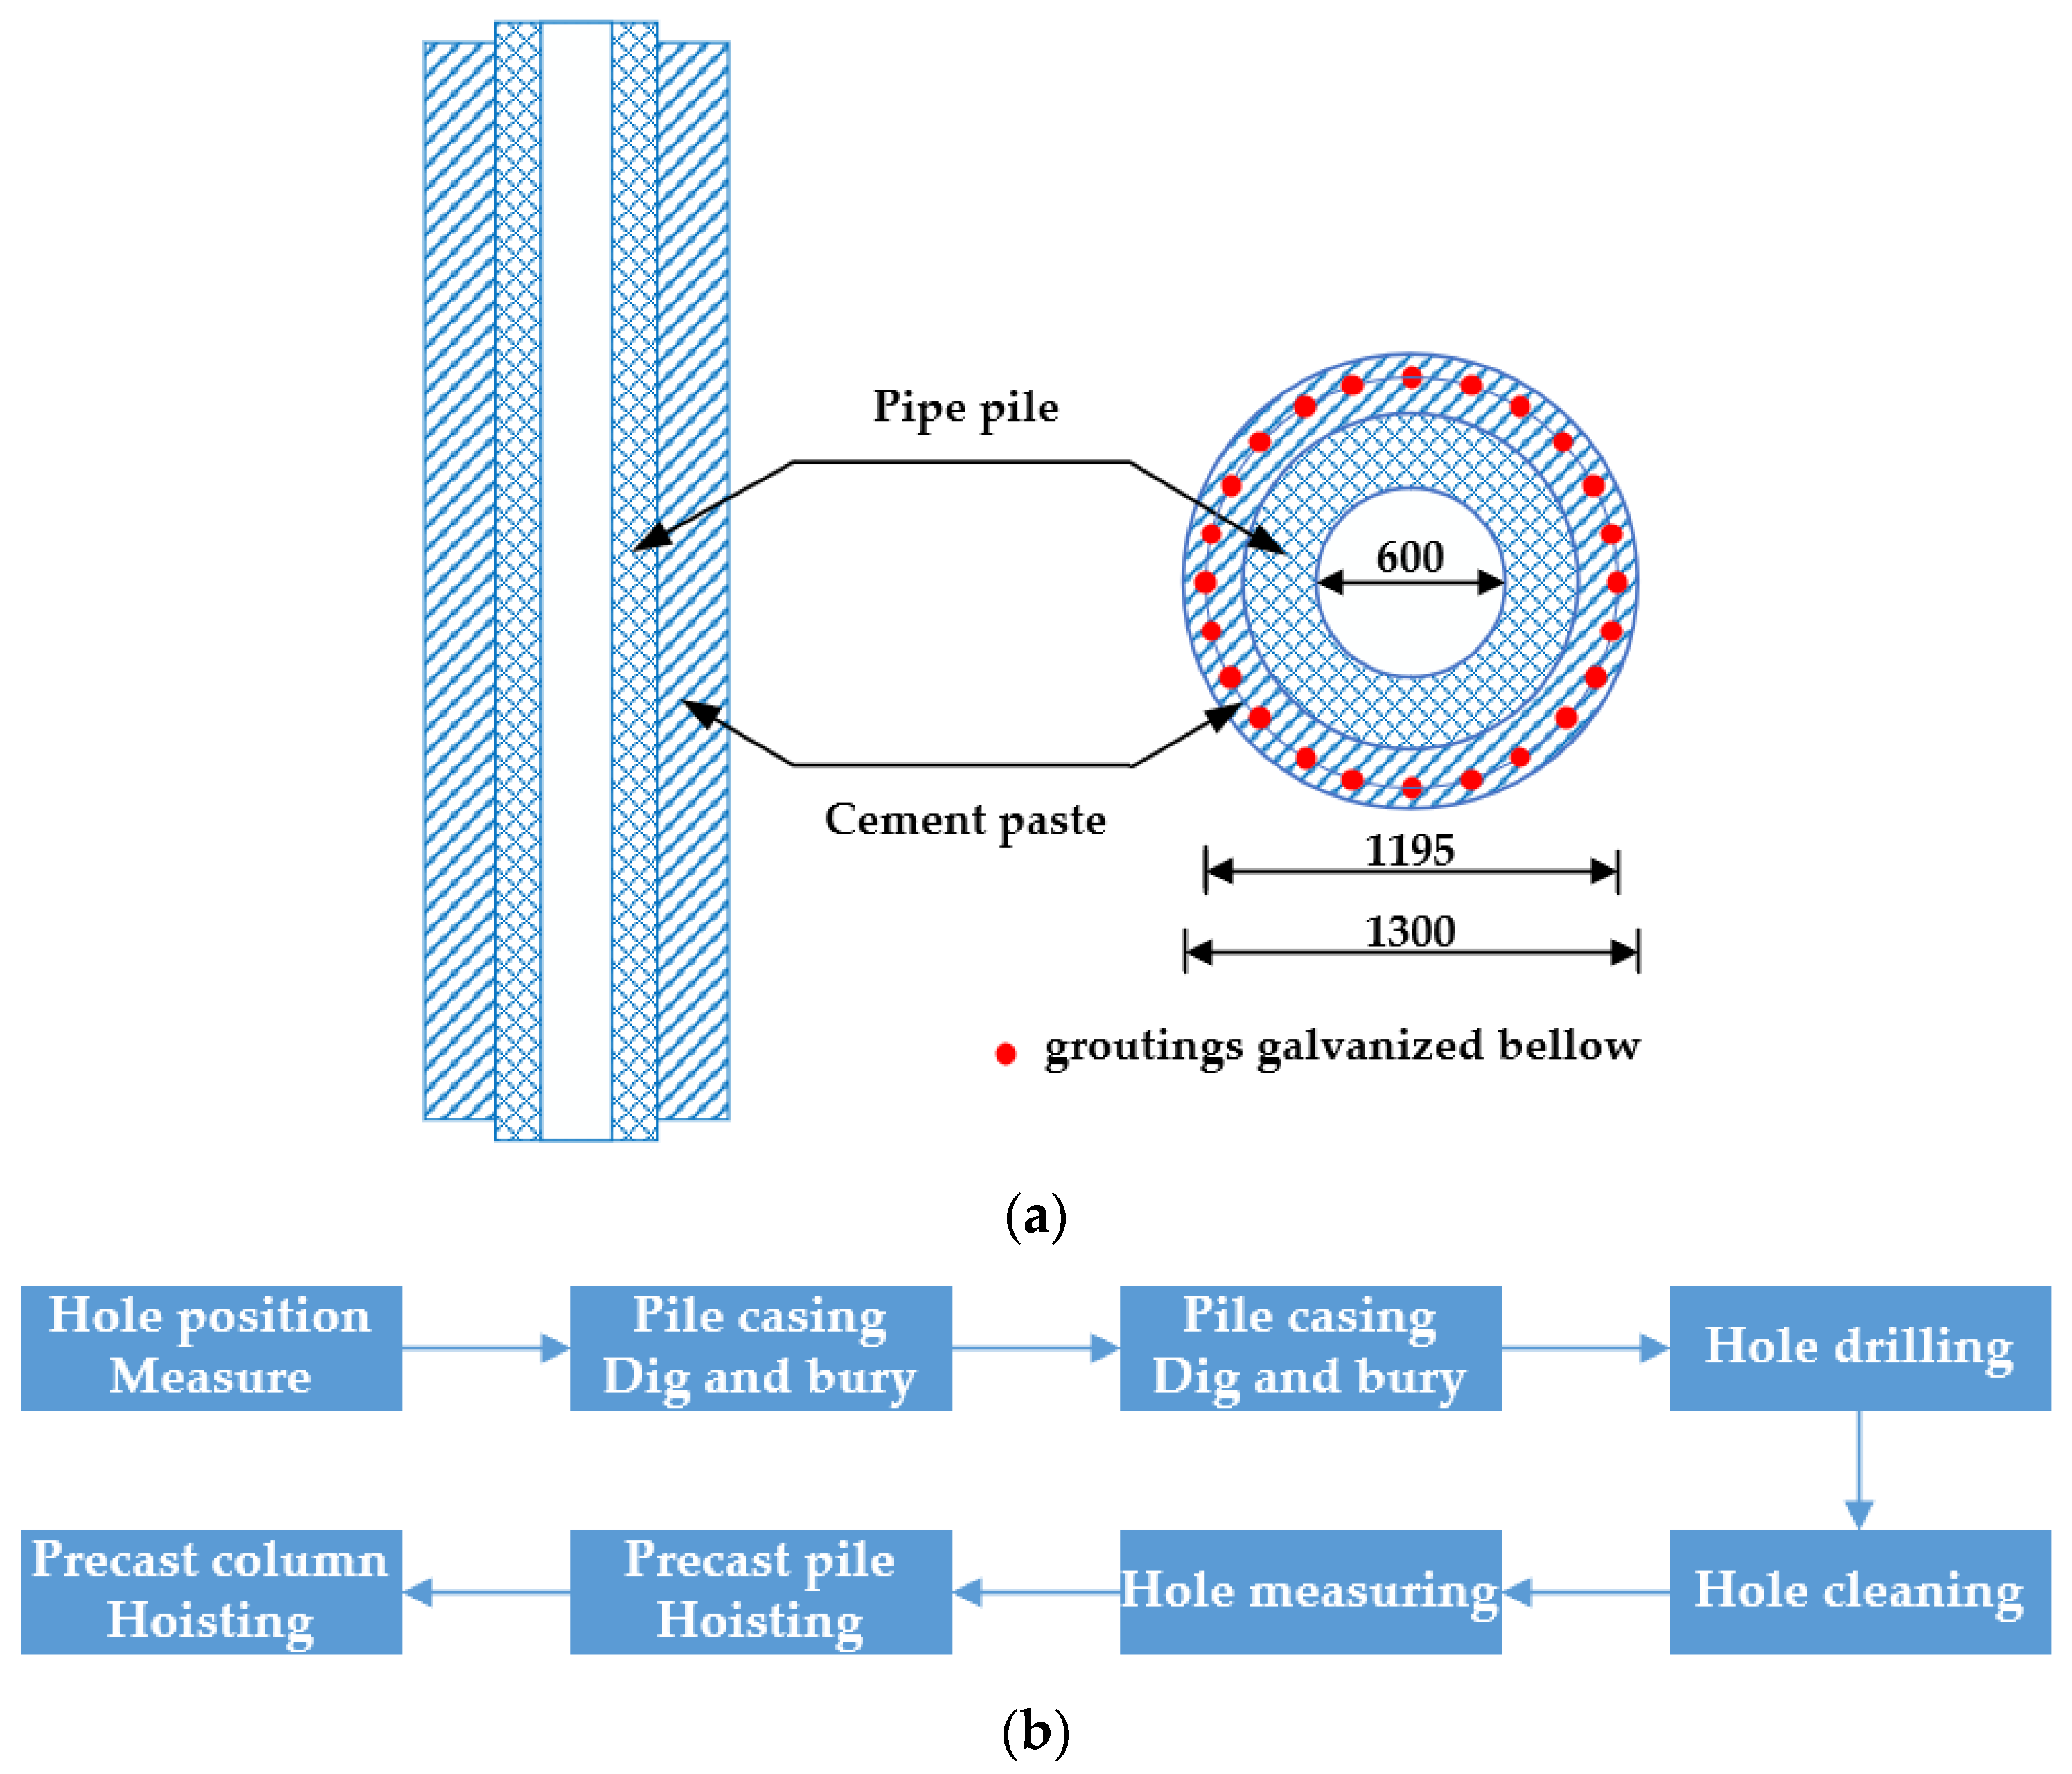
2.2.2. Model of Bridge Substructure

A novel construction technology, namely, the composite embedded pile method, was adopted in the construction of prefabrication and assembly “Pile–Column Integration”. At present, there is no complete set of construction technical data and construction experience for reference. Therefore, it is proposed to determine its process and relevant technical parameters through a pile test. Figure 2a shows the schematic diagram of the pile foundation, and the construction process of “pile–column integration” is shown in Figure 2b.
In this study, four pipe piles (No. 2–5) with a diameter of 1.3 m, a wall thickness of 0.3 m, and a wall thickness of 0.1 m of cement paste are used as duplicate tests. Two pipe piles are 24 m in total length and 10 cm above the ground for the vertical bearing capacity test, the total length of the other two pipe piles is 29 m, and the pile joint is 1 m above the ground. The horizontal bearing capacity test would be carried out after the capping beam hoisting process test. Meanwhile, the high-strength concrete labeled C70 is used for the pipe pile, the concrete mortar labeled C30 is used for the grouting of the embedded pile, and the concrete labeled C40 is used for the capping beam prefabricated in advance. In addition, 24 groutings galvanized bellows with a length of 6 cm are set at the top of the pier, and the epoxy mortar leveling layer labeled C50 with a thickness of 2 cm is set at the top of the pier.

2.3. Experimental Methods

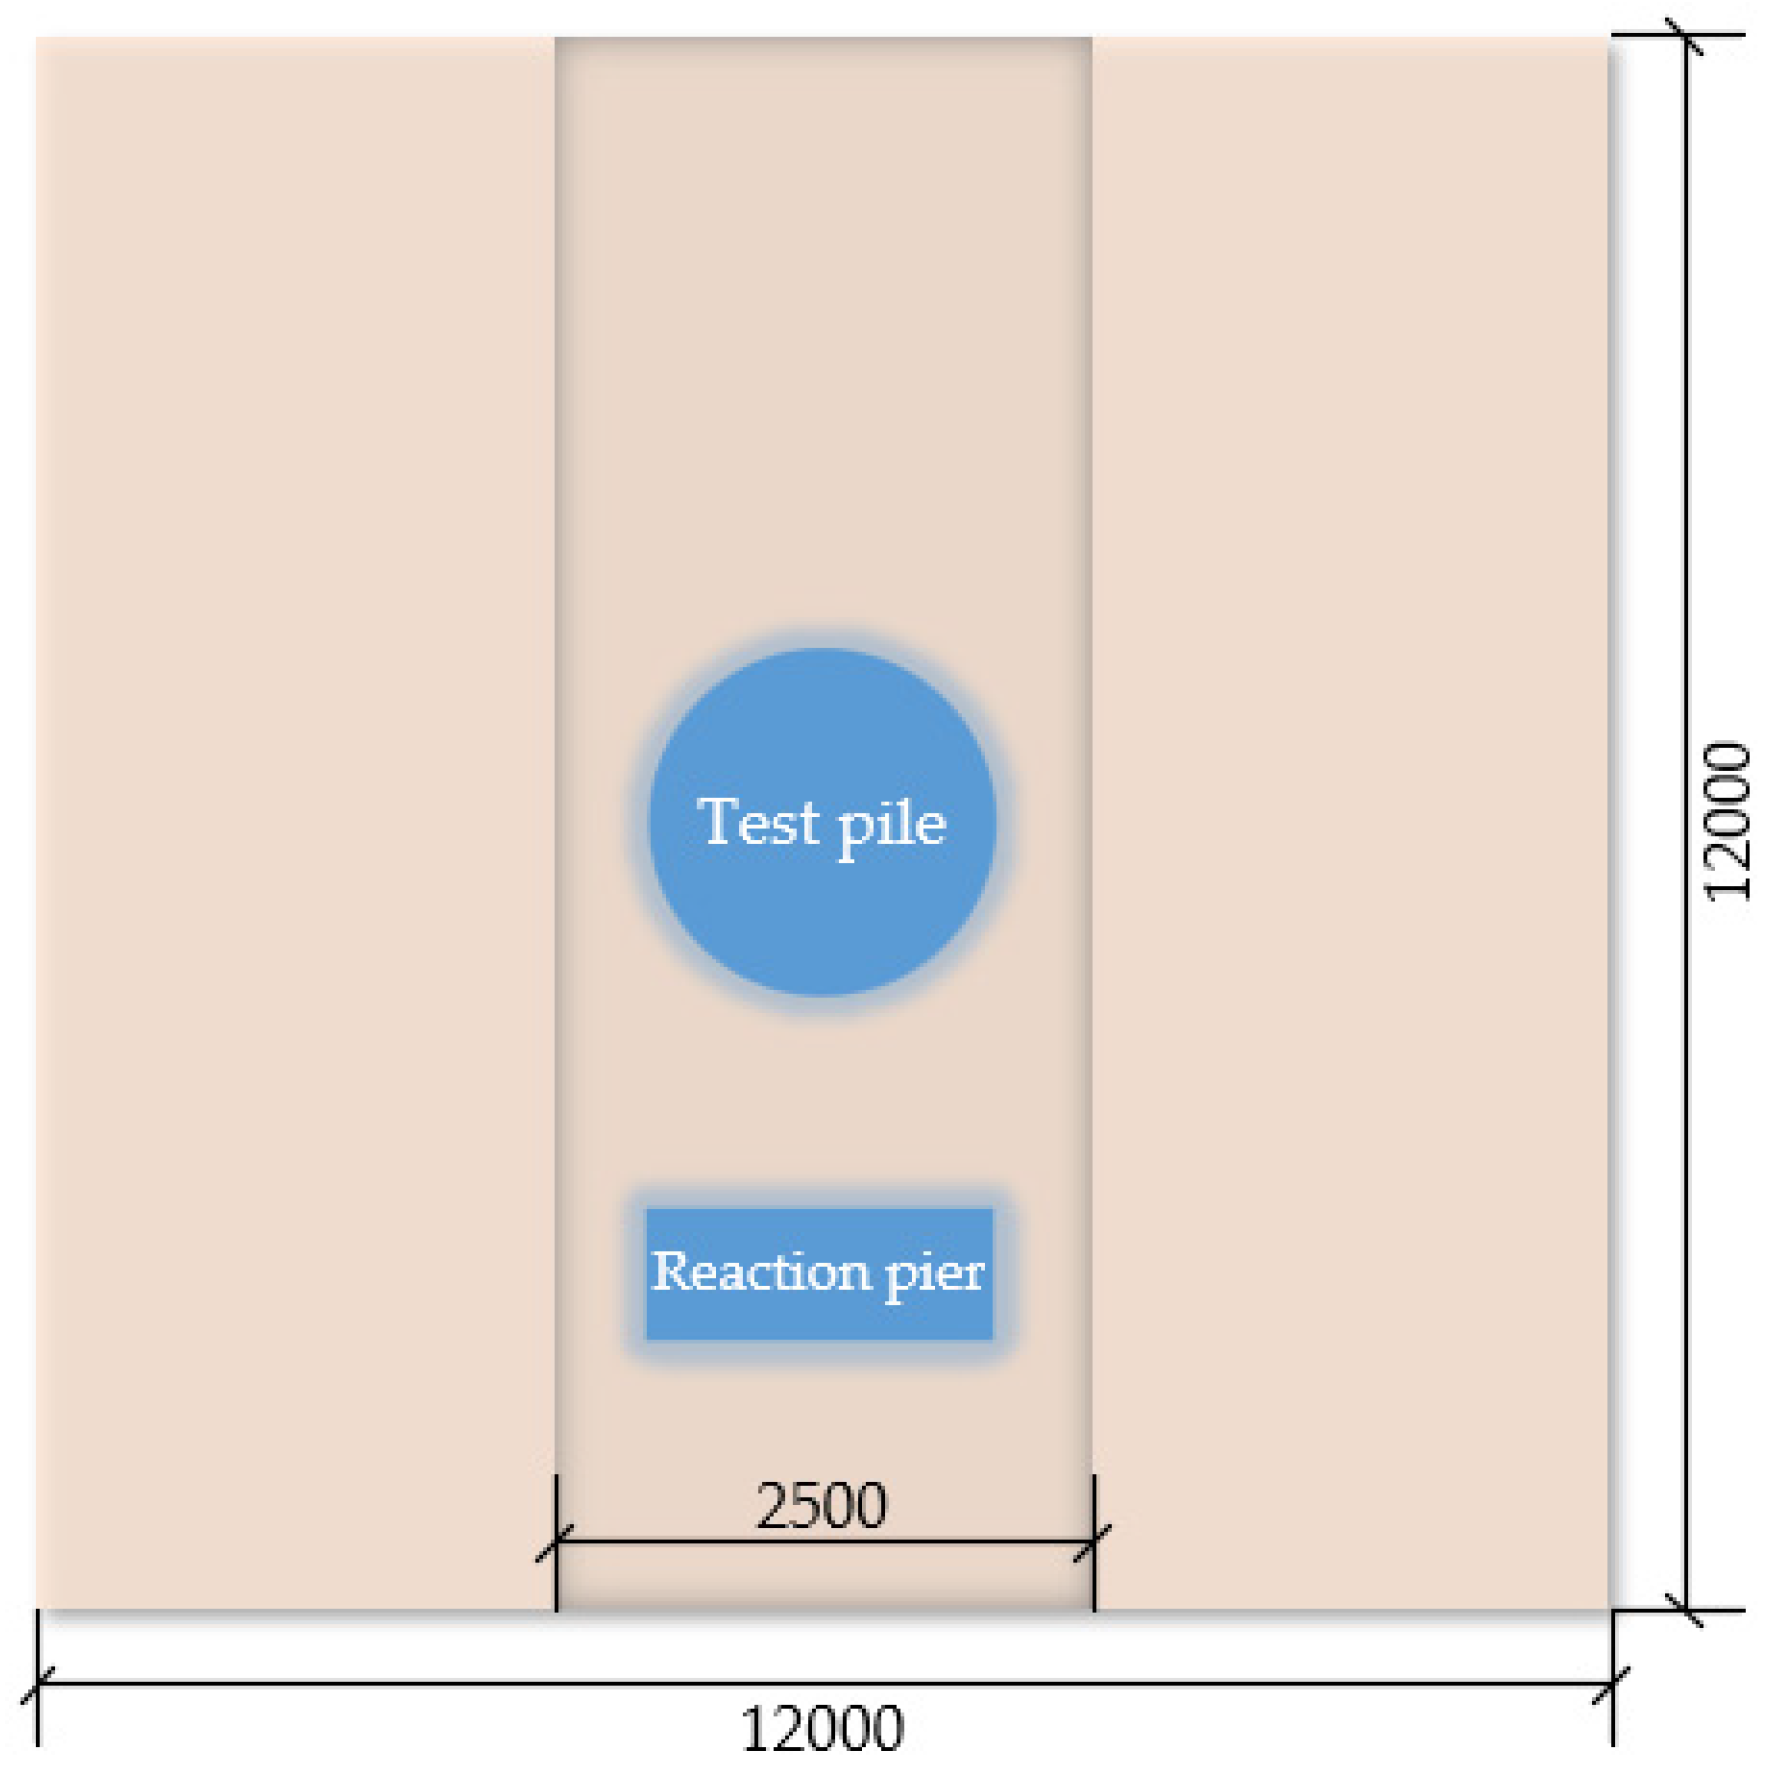
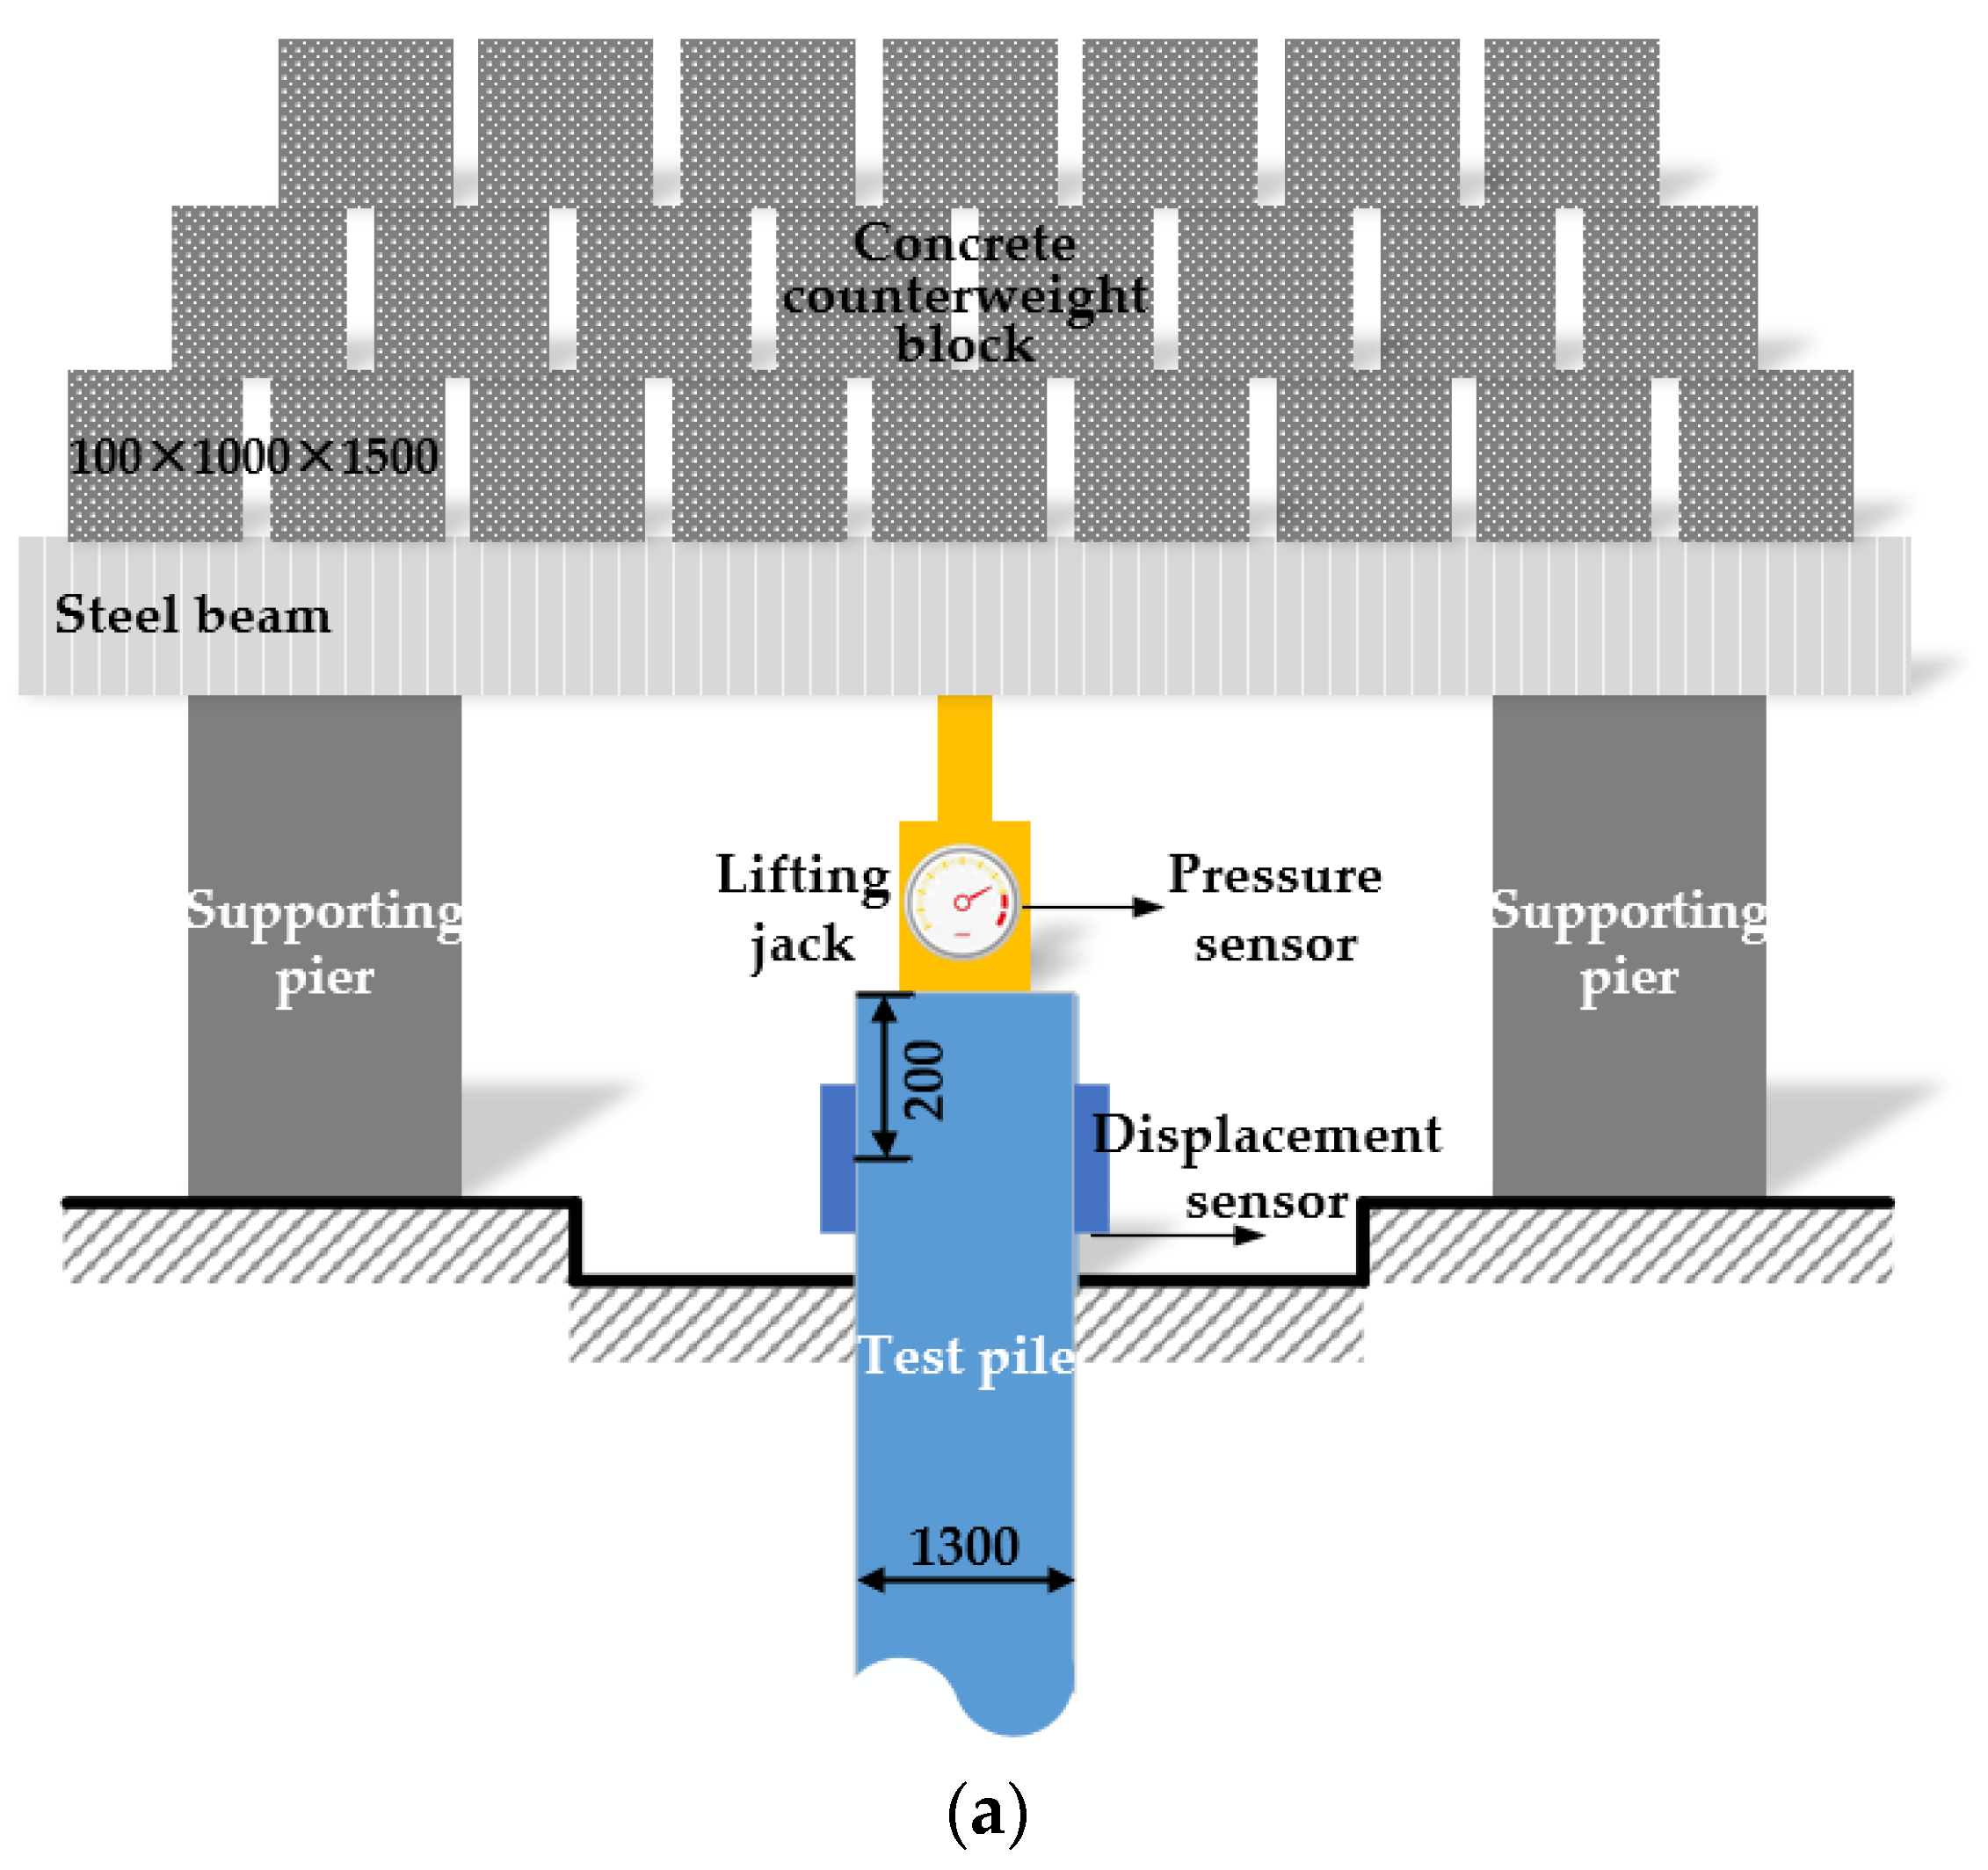
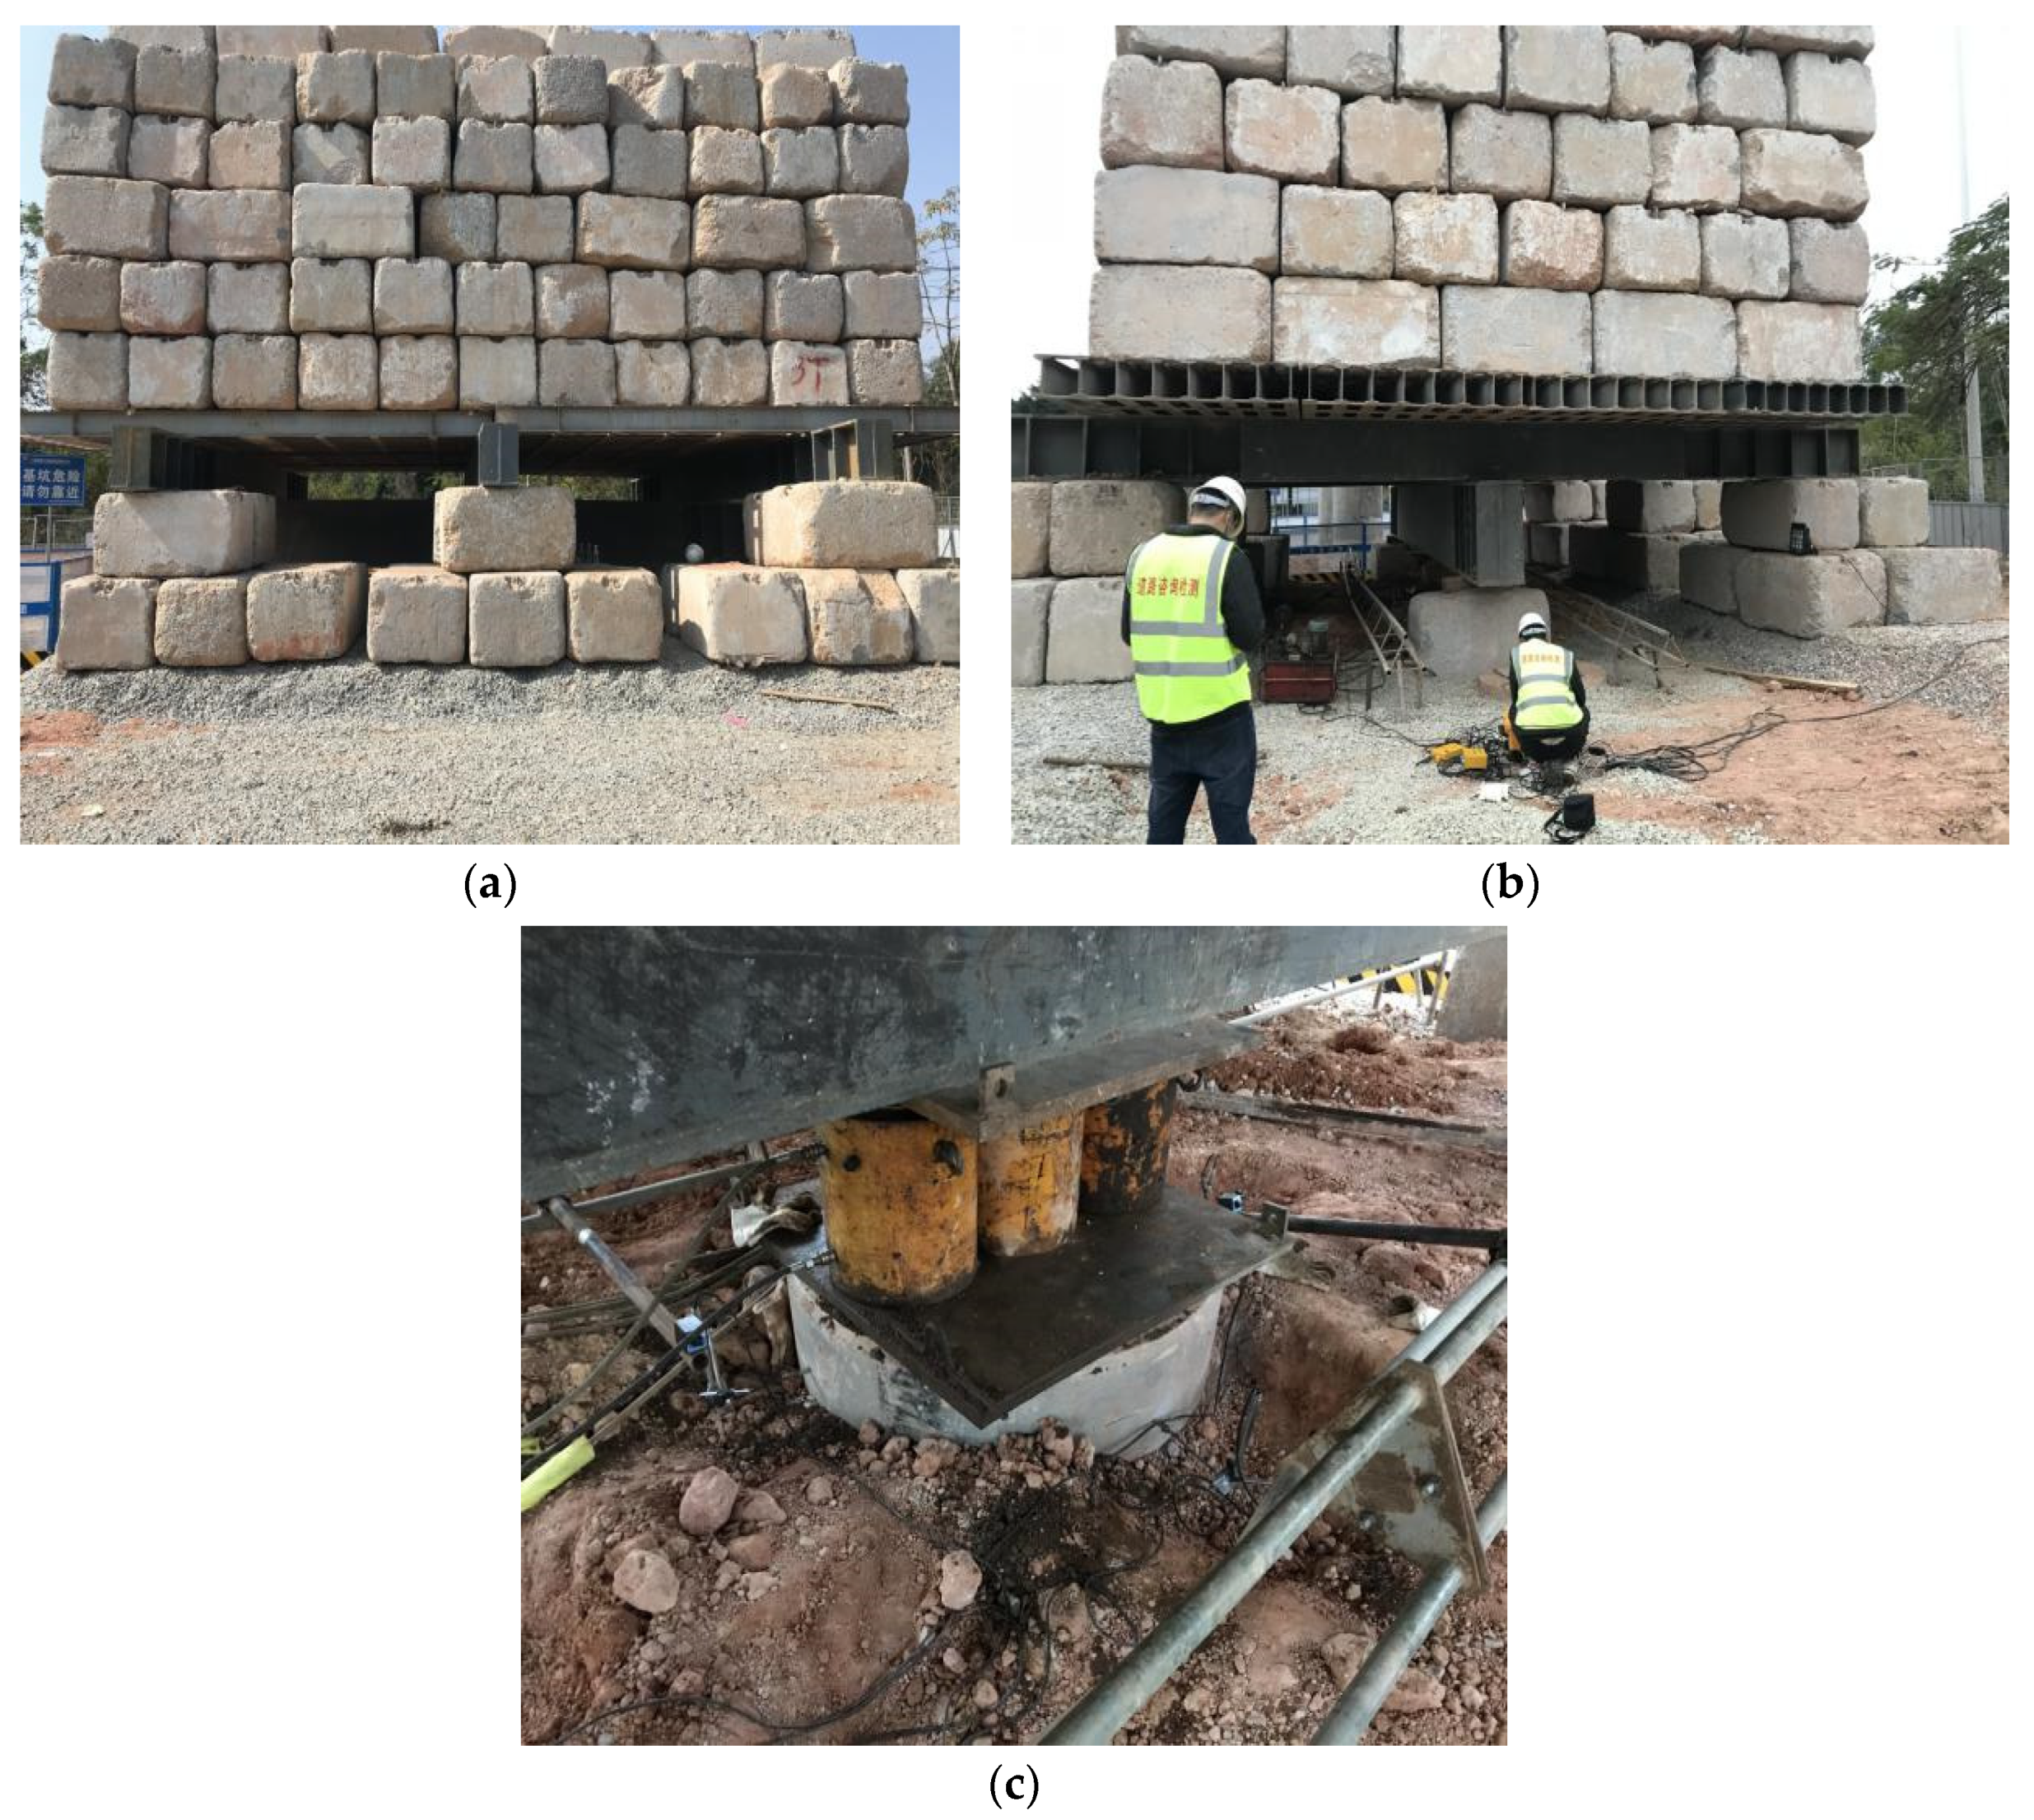
2.3.1. Vertical Compressive Static Load Test of Single Pile

The vertical compressive static load test of a single pile is recognized as the most intuitive and reliable traditional method to detect the vertical compressive bearing capacity of the foundation pile.
  • Preparation before vertical compressive static load test of single pile:
    • Soil treatment around the pile
A working plane (12 m × 12 m), as shown in Figure 3, should be reserved around the test single pile. If the bearing capacity of foundation soil on site is lower, it is usually required by the replacement treatment.
    • Construction of ballast platform
The ballast platform is composed of a concrete counterweight block, secondary beam, main beam, lifting jack, etc. The pressure weight of the pile head shall not be less than 1.2 times the estimated maximum test load, and the pressure weight shall be added once before the test and shall be evenly and firmly placed on the platform. When sufficient ballast before the test may cause damage to the foundation soil under the buttress, a small part of the ballast can be added during the test, and it shall be ensured that the ballast is not less than 1.2 times the test load. Figure 4a shows the schematic diagram of the surcharge test device. It is estimated that about 1250 tons of counterweight is required for the ballast platform in this test. The counterweight, steel beam, and other equipment required to build the platform are as follows: 2 steel main beams (0.5 m × 1.2 m × 10 m), 5 steel secondary beams (0.5 m × 0.6 m × 8 m), 410 concrete counterweight blocks (0.8 m × 1.0 m × 1.5 m/3 t), 2 lifting jacks, datum beam, and datum pile (as shown in Figure 4b).
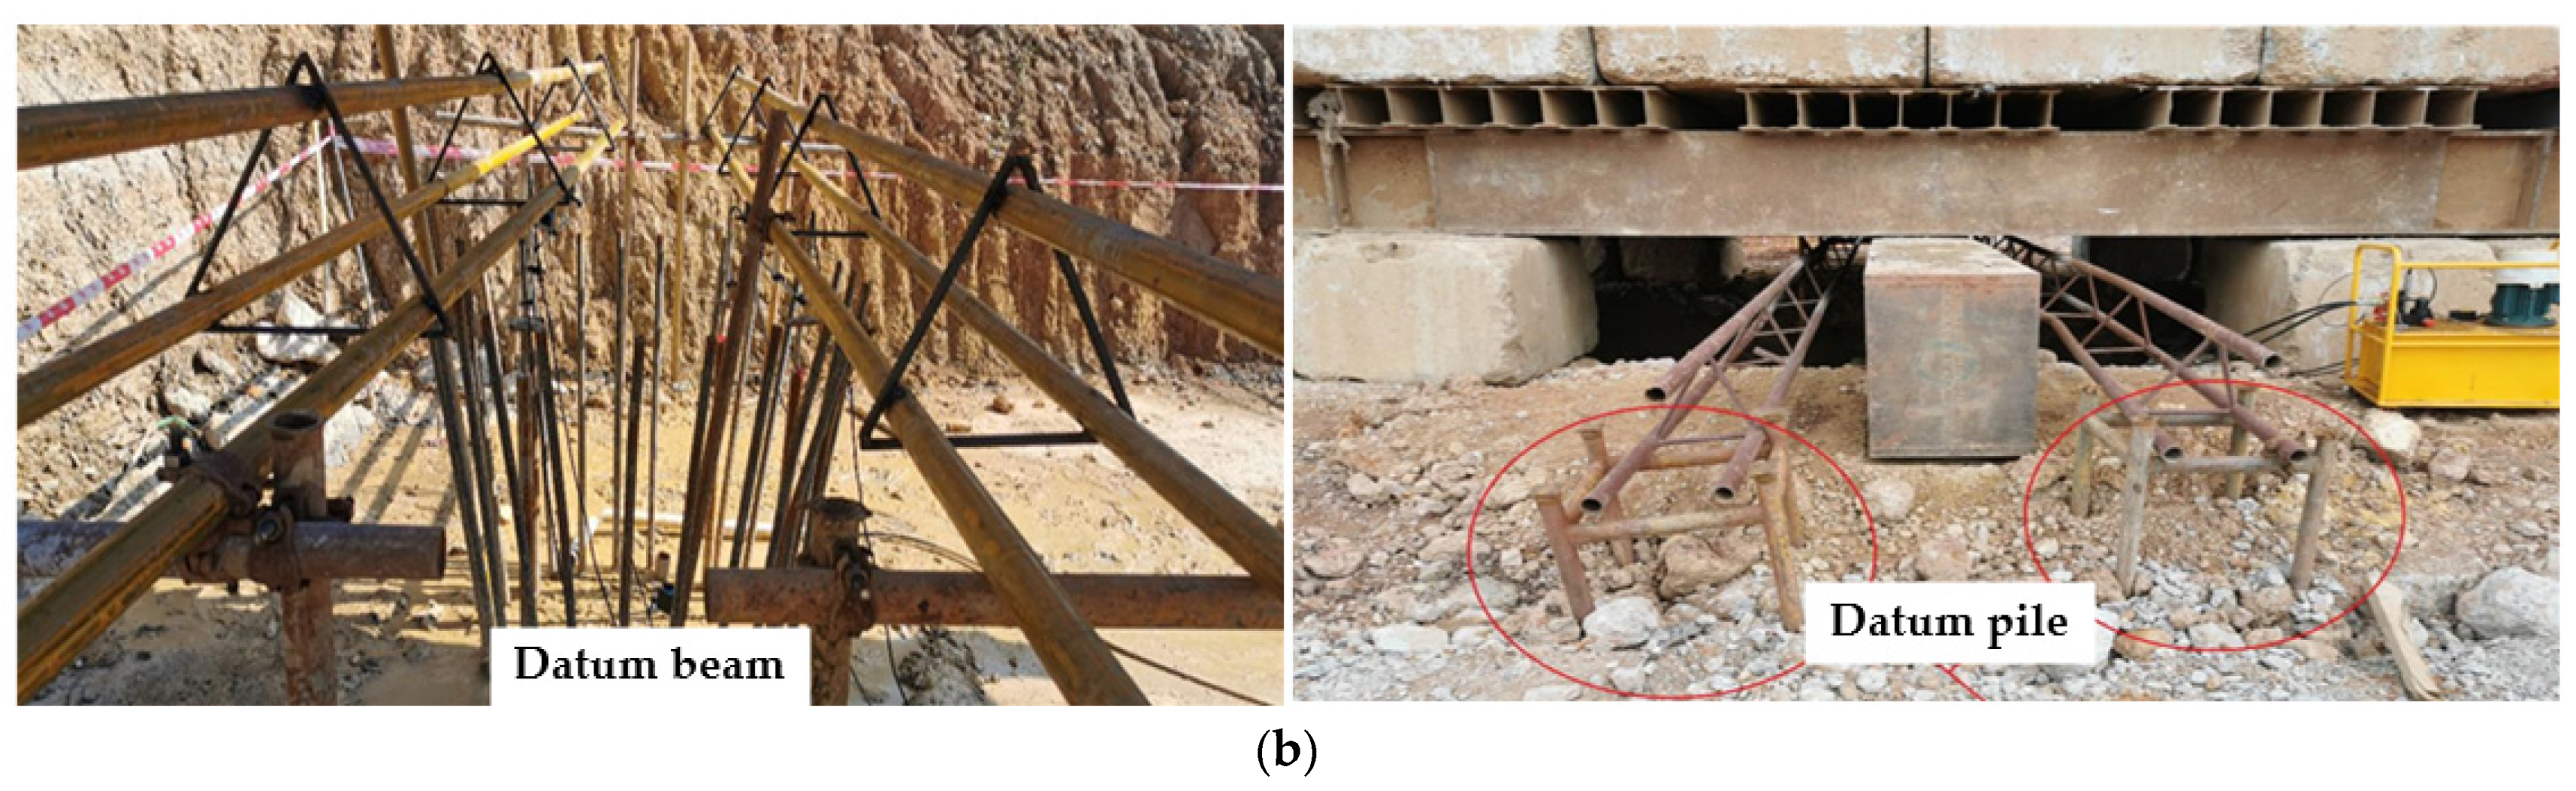
    • Sensor installation and system detection.
The static load test adopts the form that the lifting jack is connected with the oil pump, and the load is applied by the lifting jack, as shown in Figure 4a. The oil pressure can be measured by the pressure sensor parallel to the lifting jack oil circuit, and the load is converted according to the lifting jack calibration curve. In order to ensure the measurement accuracy of the static load test, the accuracy grade of the pressure sensor shall be better than or equal to grade 0.5. When two or more lifting jacks are used for loading, to avoid eccentric loading of the tested pile, the lifting jack type should be the same and work synchronously in parallel. The pressure of the pressure sensor, oil pump, and oil pipe for test under maximum loading shall not exceed 80% of the specified working pressure. In addition, the pile diameter of the test pile is 1300 mm. According to the specification requirements, four displacement sensors are symmetrically arranged in two directions.
After the installation of all test equipment, a system inspection should be carried out. The detailed detection procedure is to preload the test pile with a small load (about 5% of the maximum test load) to eliminate the non-pile settlement caused by the gap between the whole measurement system and the tested pile itself due to installation, pile head treatment, and other factors. The air from the lifting jack and pipeline needs to be removed, the displacement sensors are preheated. Then there must be a check of whether the pipeline joints and valves leak oil. If everything is normal, unload to zero, and start the formal test loading after the reading displayed by the displacement sensor is stable.
2.
Test loading method and displacement observation
  • Test loading method
The slow maintenance load method is adopted for the test, which is also called progressive loading, and the graded load of the test is 1/10 of the maximum load or the estimated ultimate bearing capacity. Among them, the loading amount at the first level is 2 times the graded load, and then each level is loaded with the same amount step by step. Unloading should be also carried out in stages. The unloading amount of each stage should be twice the graded load at the time of loading and would be unloaded by the same amount step by step. During loading and unloading, the load should be transmitted uniformly, continuously, and without impact, and the variation range of load at each level during maintenance should not exceed ±10% of the graded load.
    • Displacement observation
After each level of load is applied, the settlement of the pile top shall be measured and read at 0 min, 5 min, 15 min, 30 min, 45 min, and 60 min, and then every 30 min until the settlement of the test pile is relatively stable. During unloading, the settlement of the pile top is measured and read at 0 min, 15 min, 30 min, and 60 min, respectively, and then the load of the next class can be unloaded. After unloading to zero, the residual settlement of the pile top shall be measured and read for 3 h. The measurement and reading time shall be 15 min and 30 min, and then every 30 min. The settlement of pile top within each hour shall not exceed 0.1 mm and occur twice in a row from the 30 min after applying the graded load (according to the settlement observation value every 30 min for three consecutive times in 1.5 h). When the settlement rate of the pile top reaches the relatively stable standard, the next level of load can be applied.

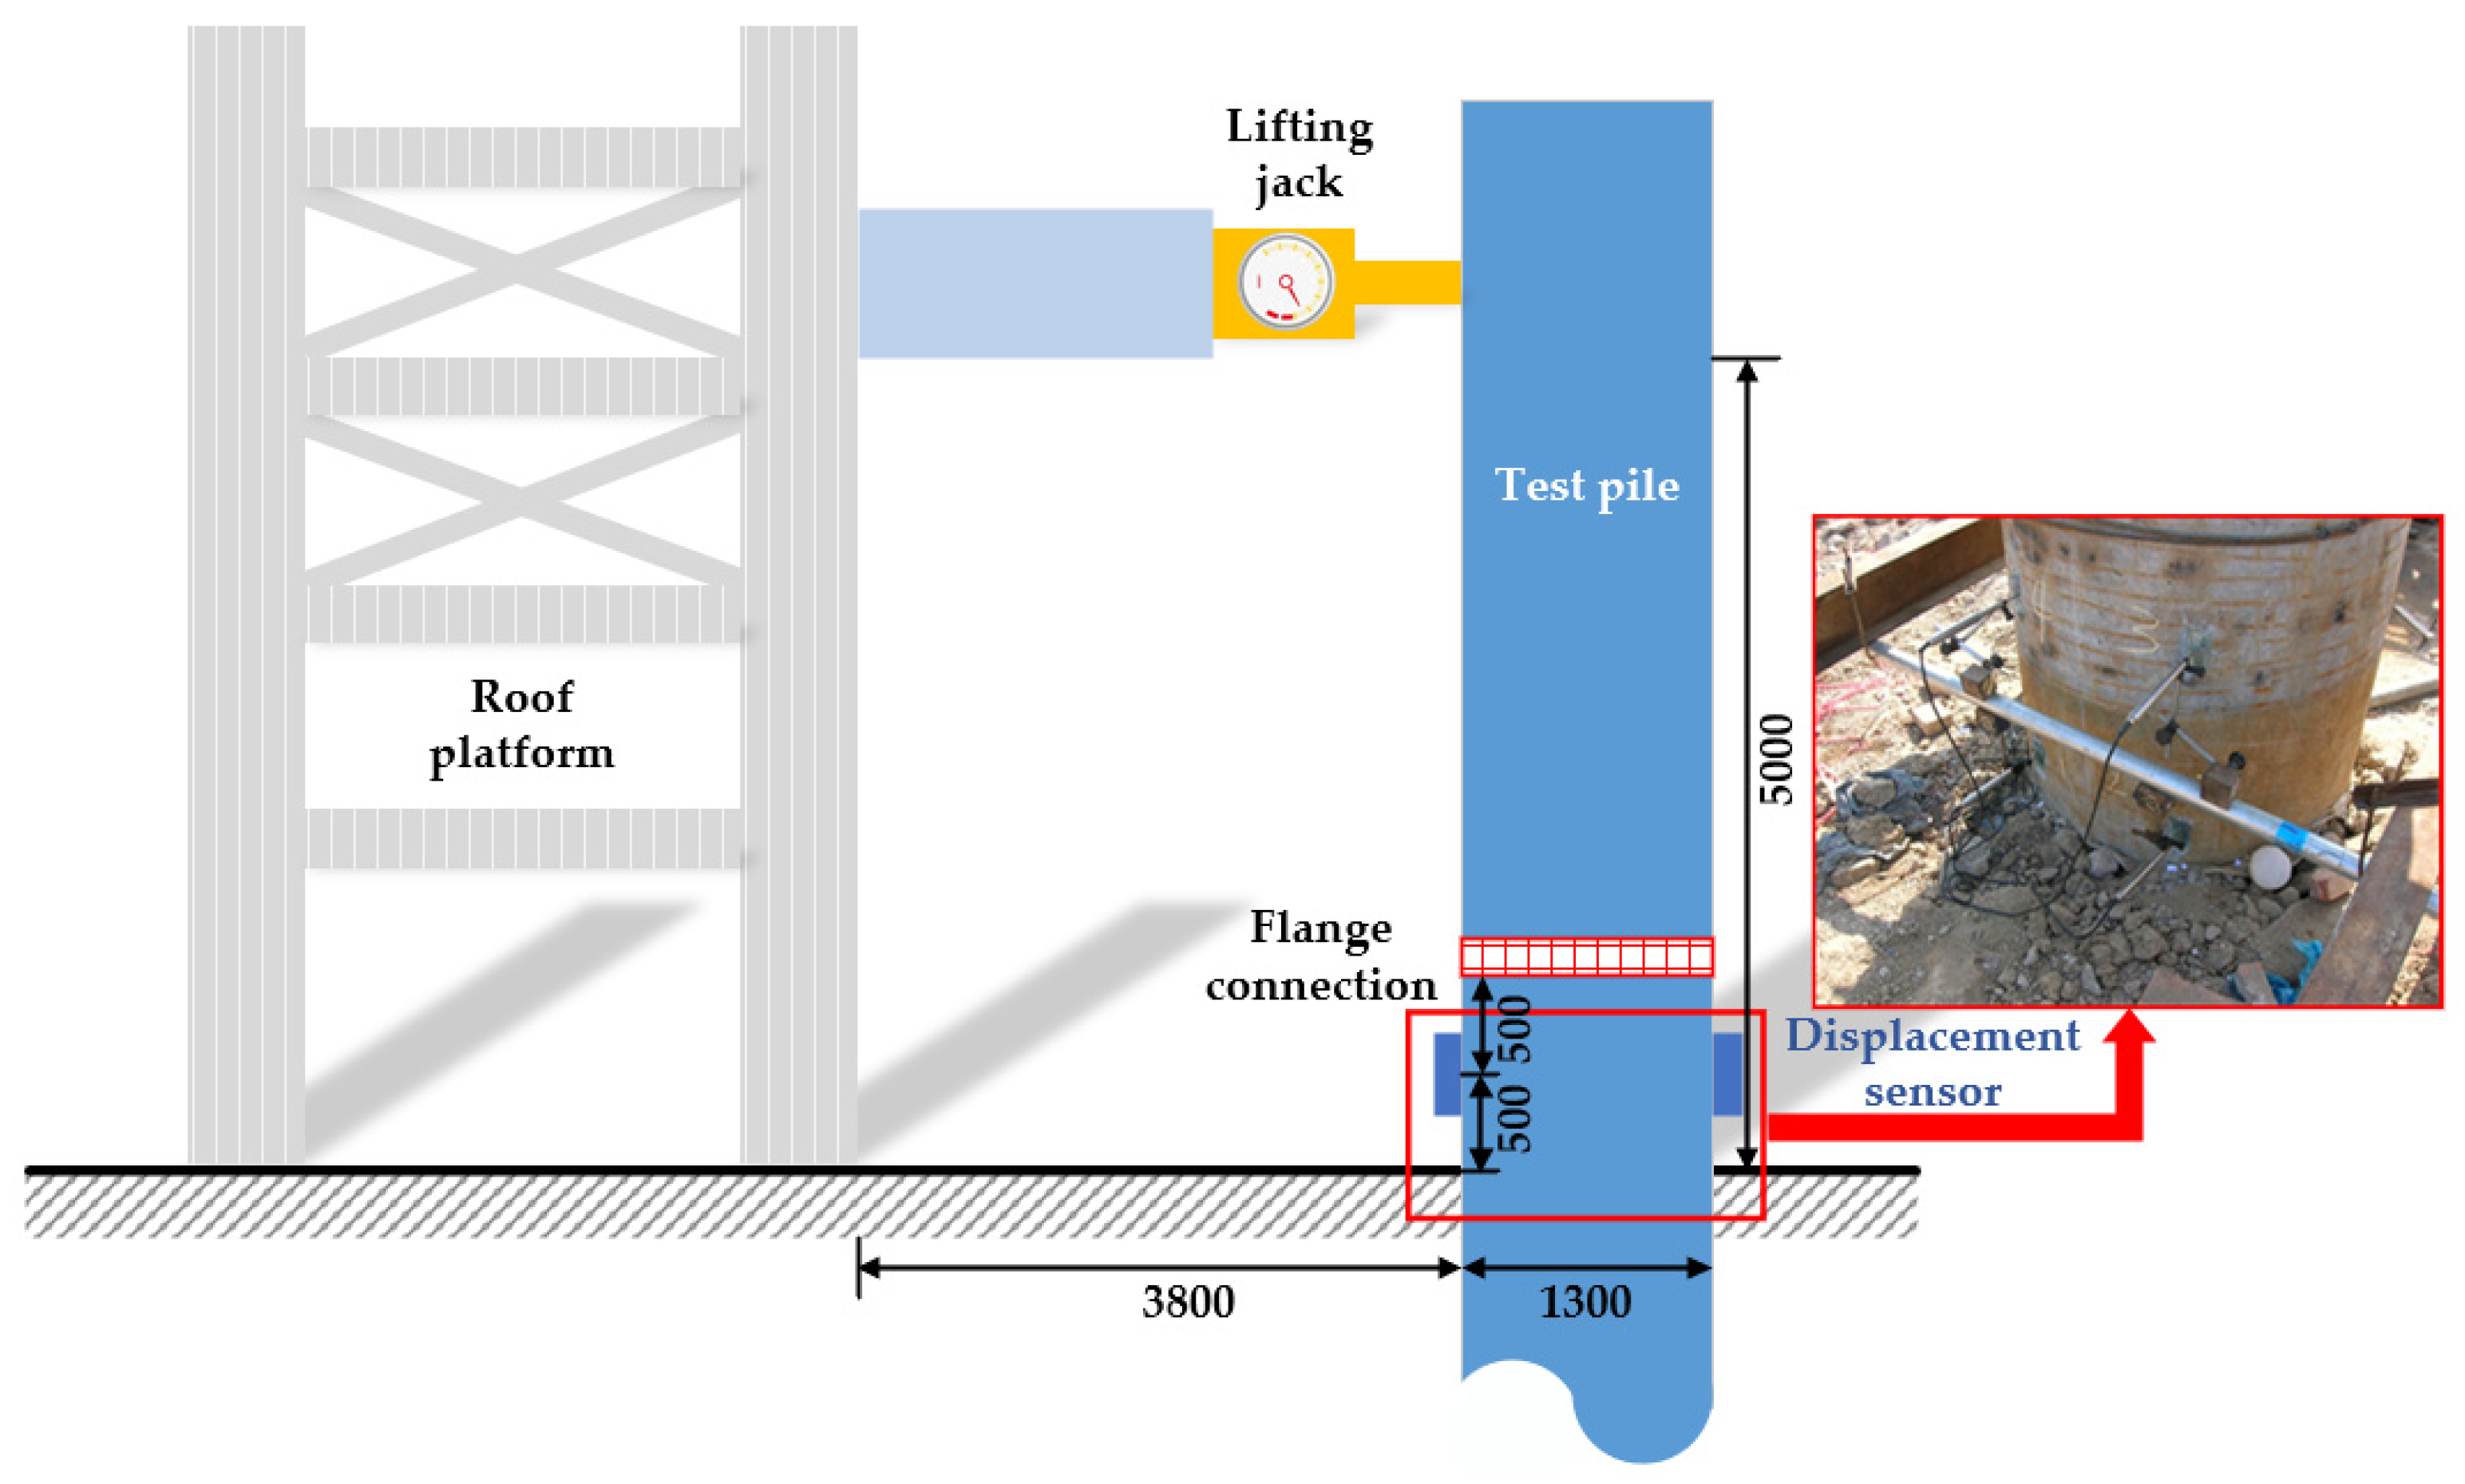
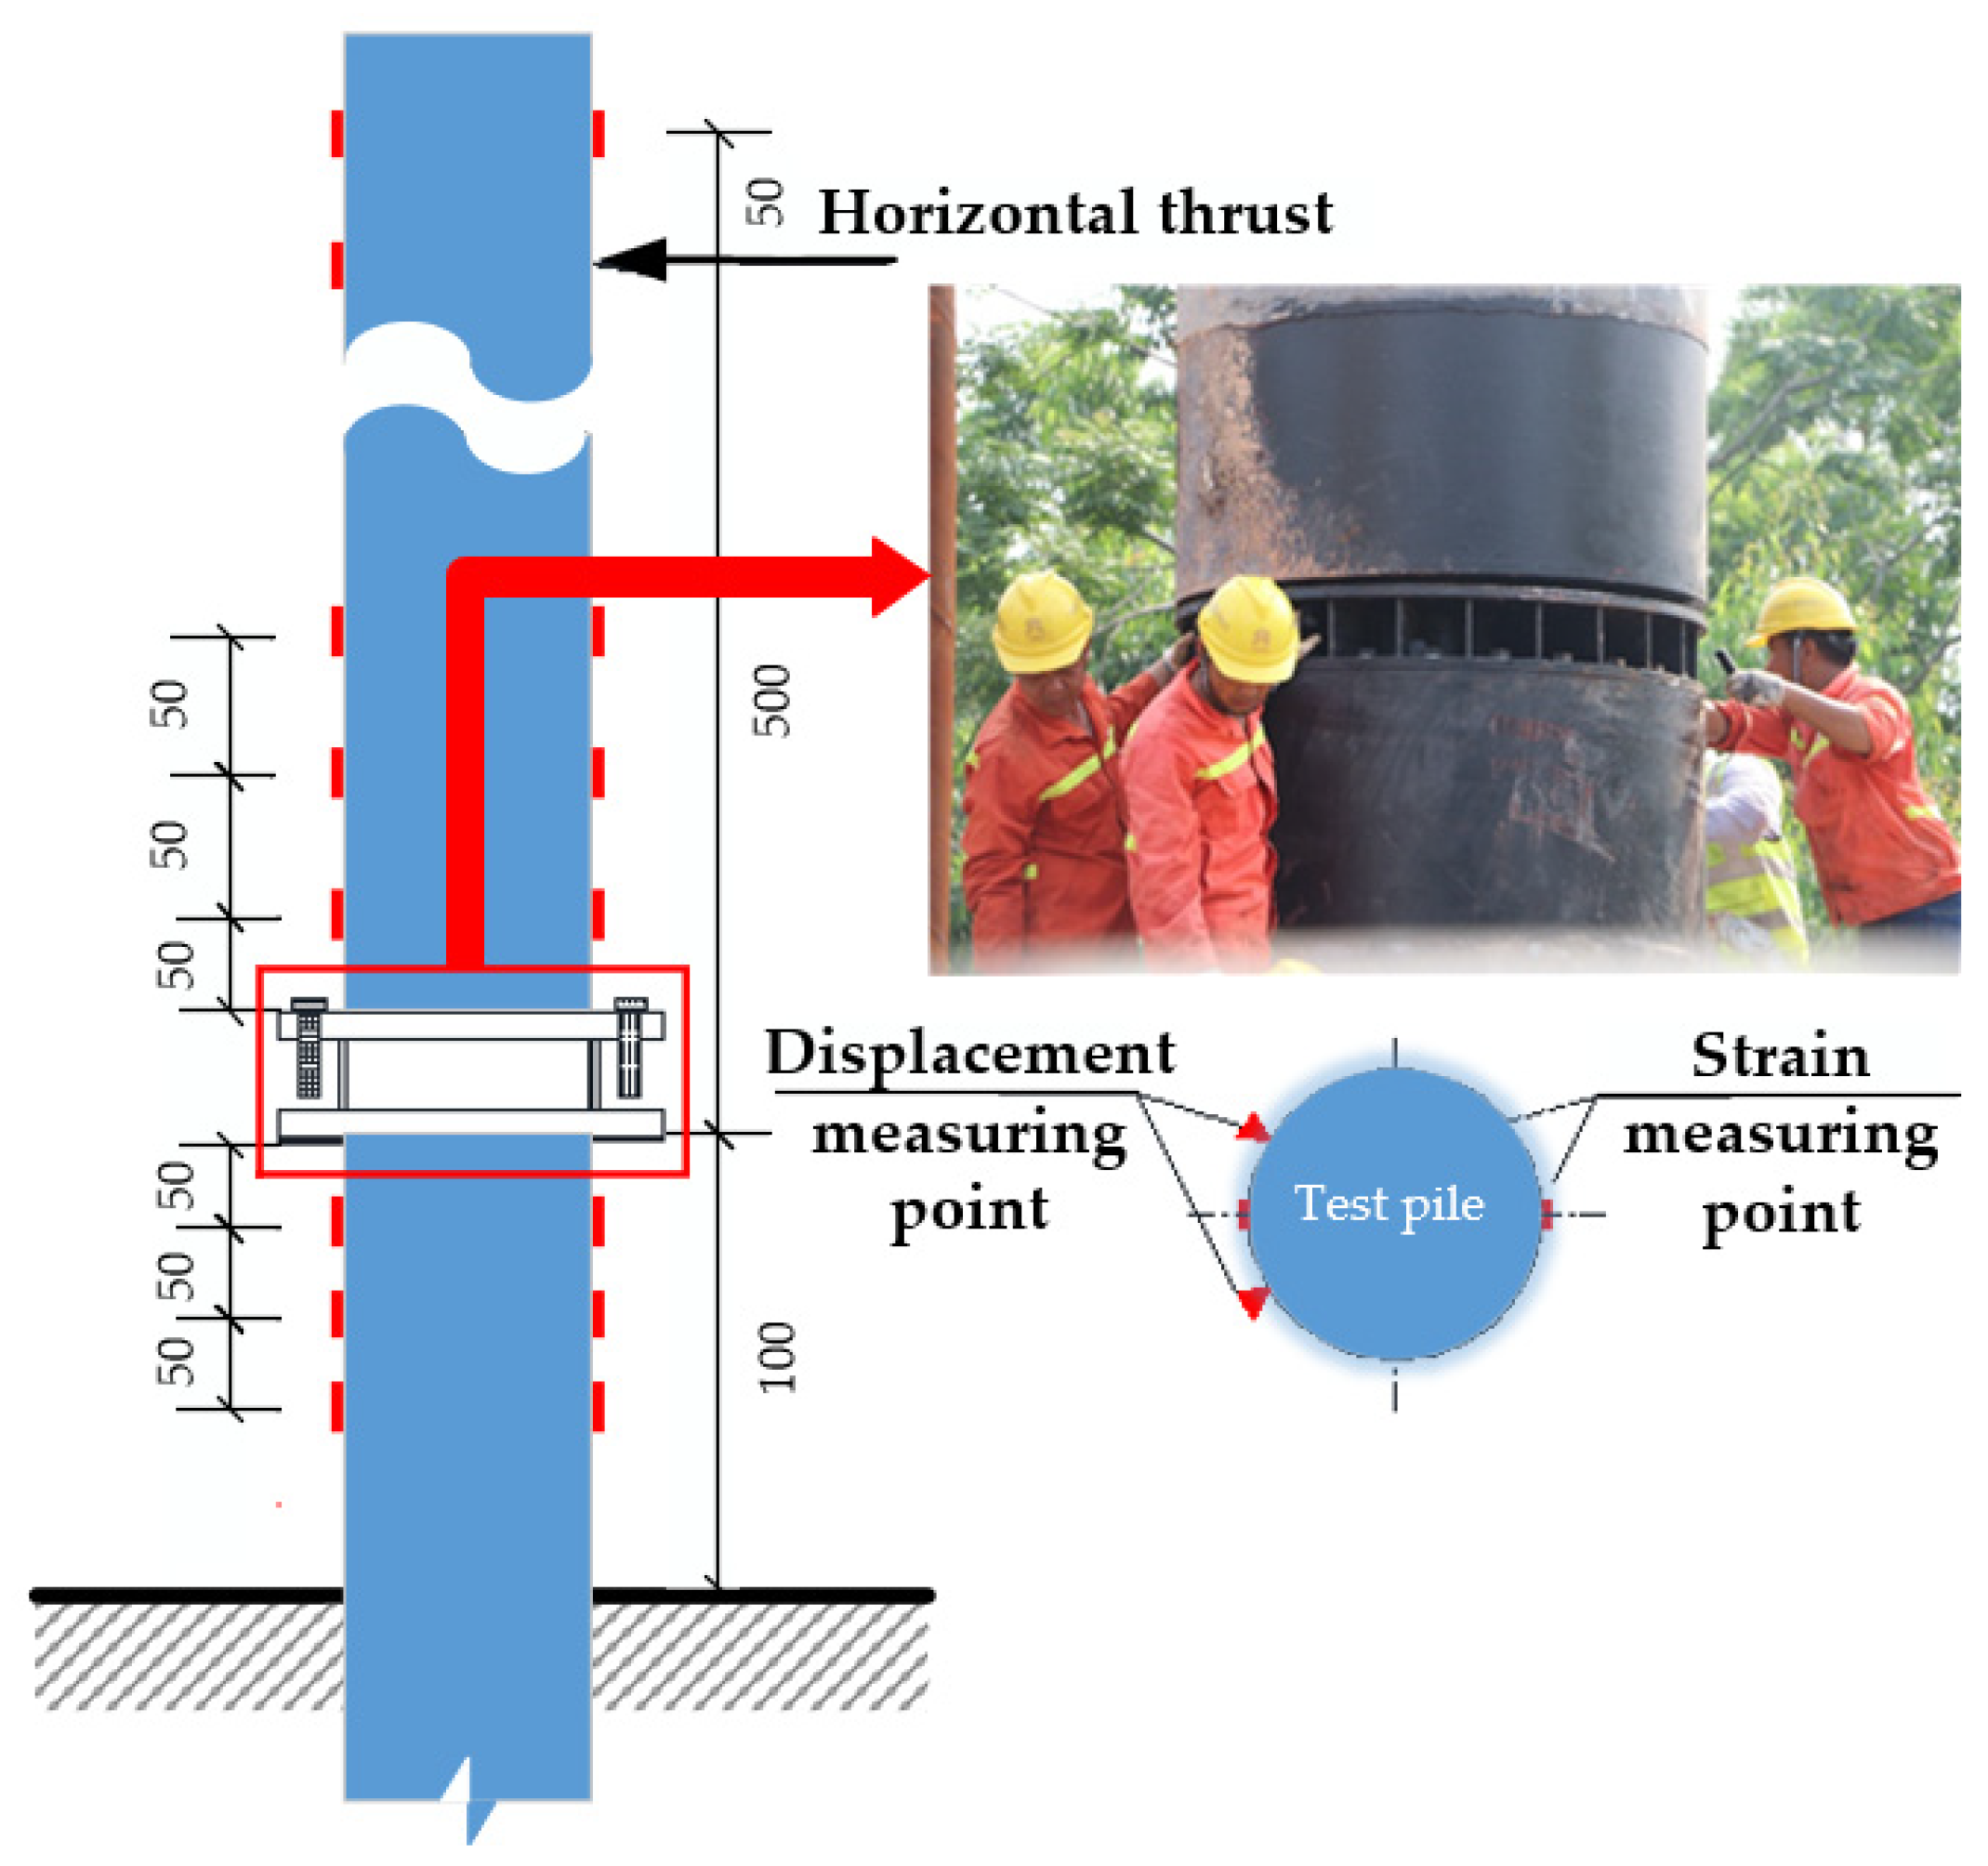
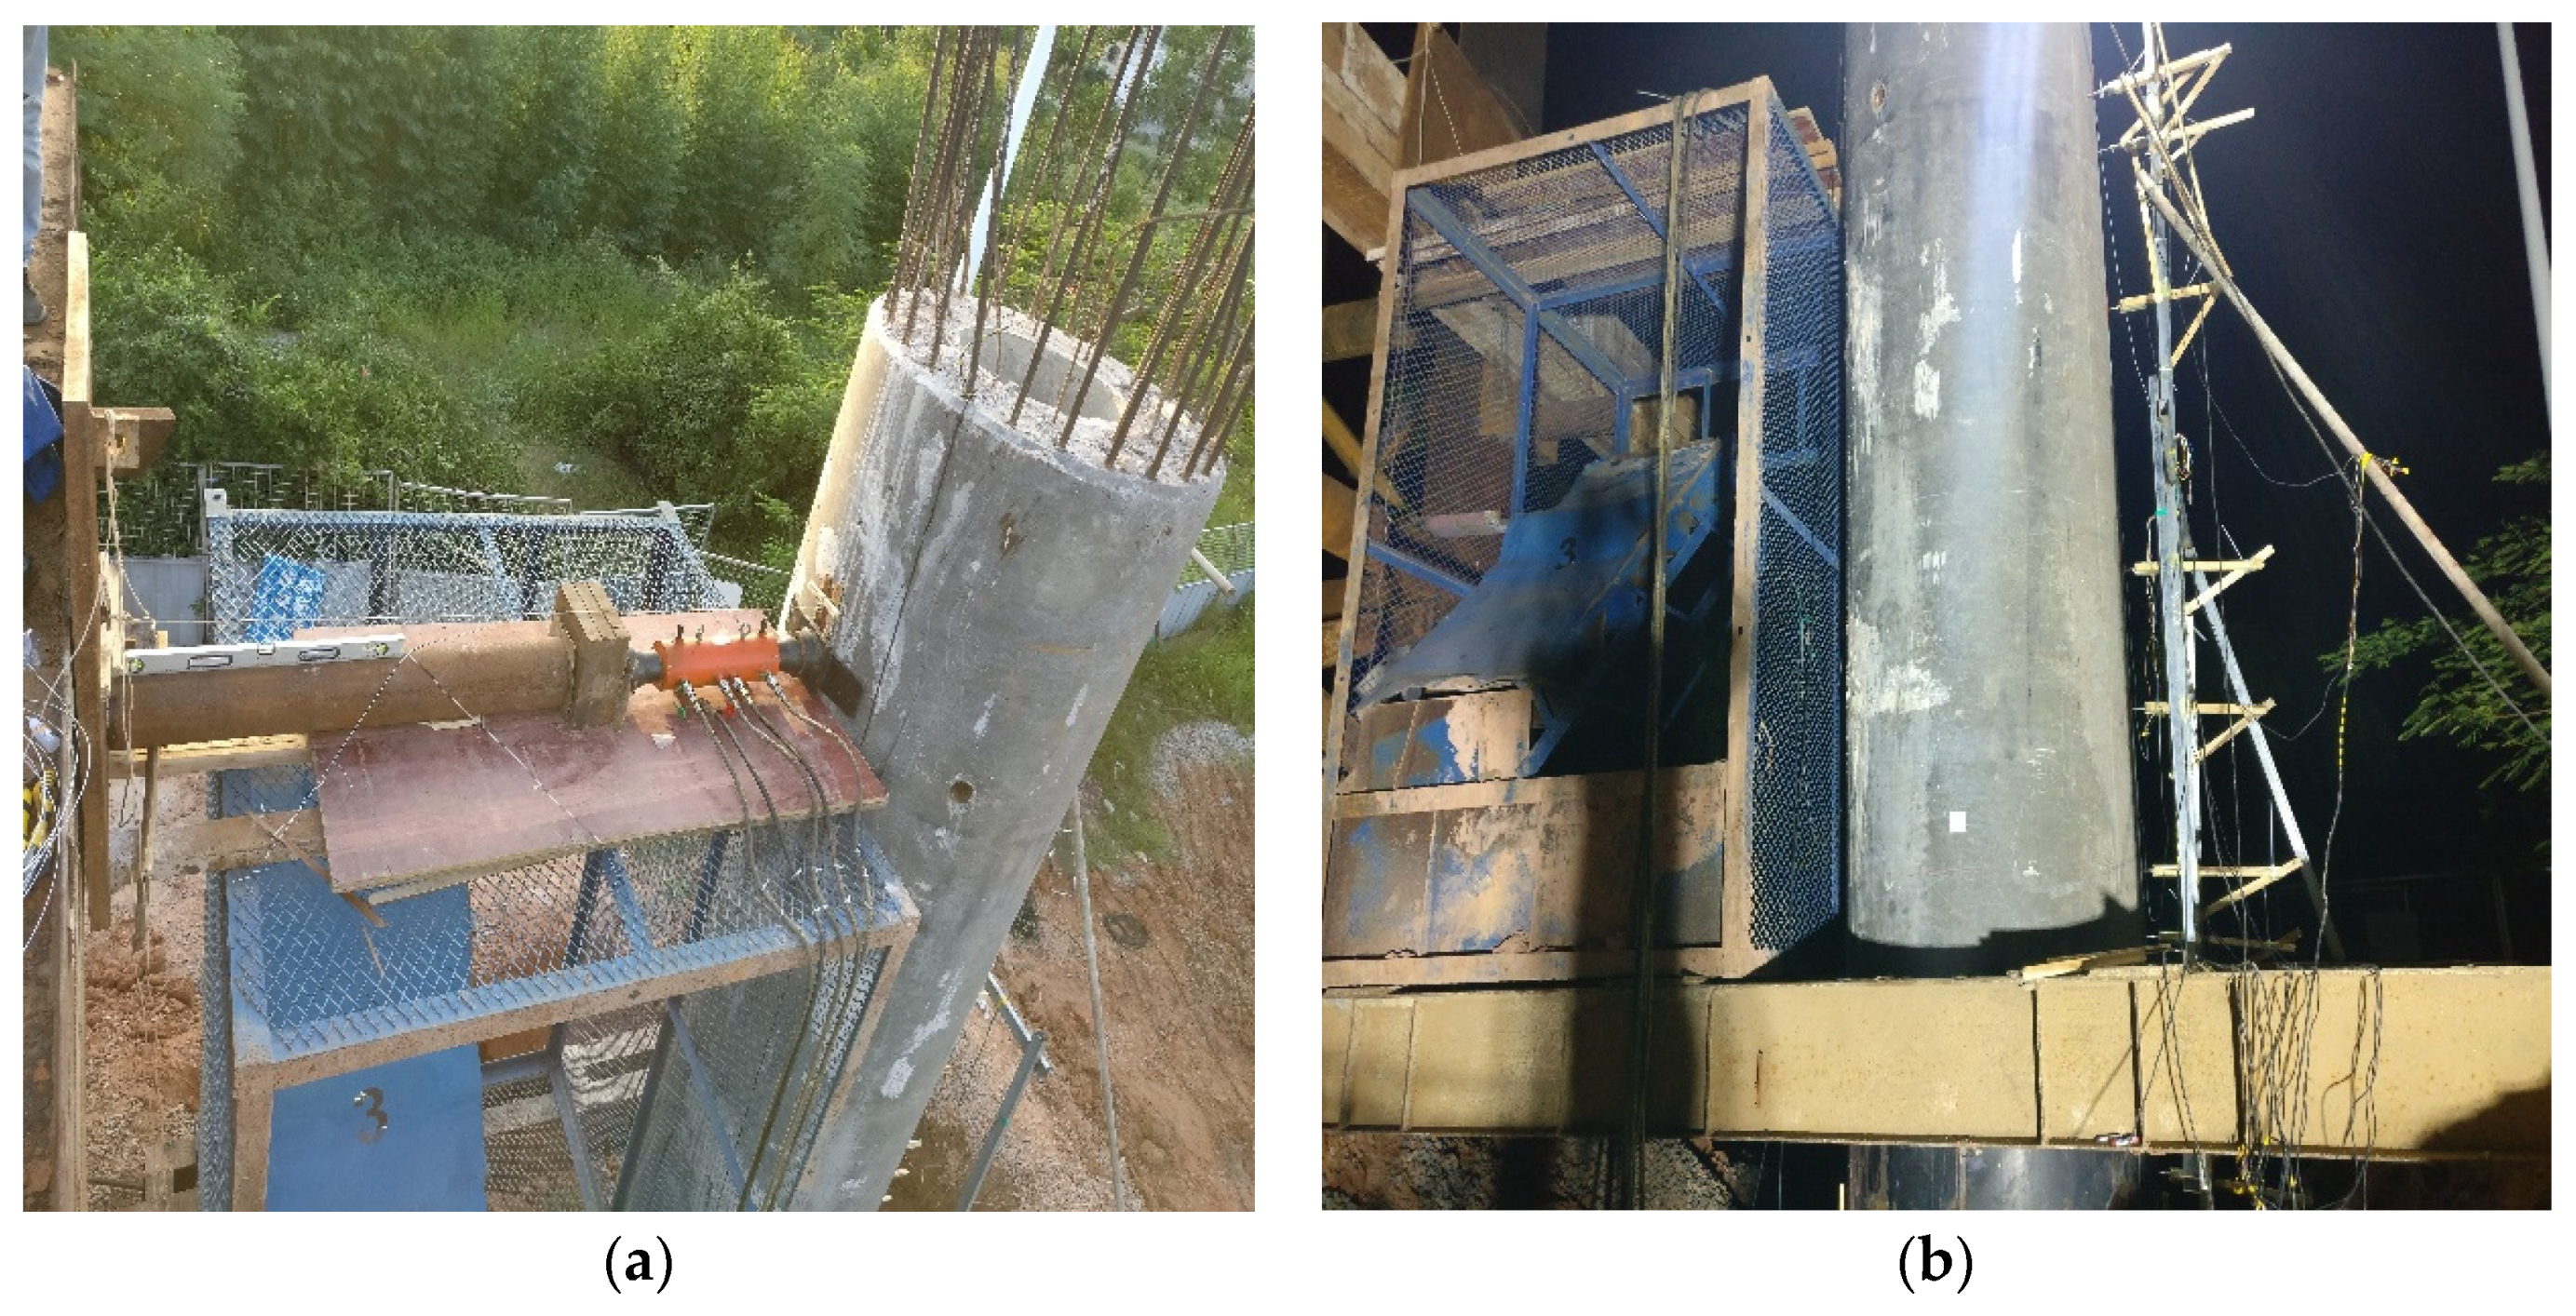
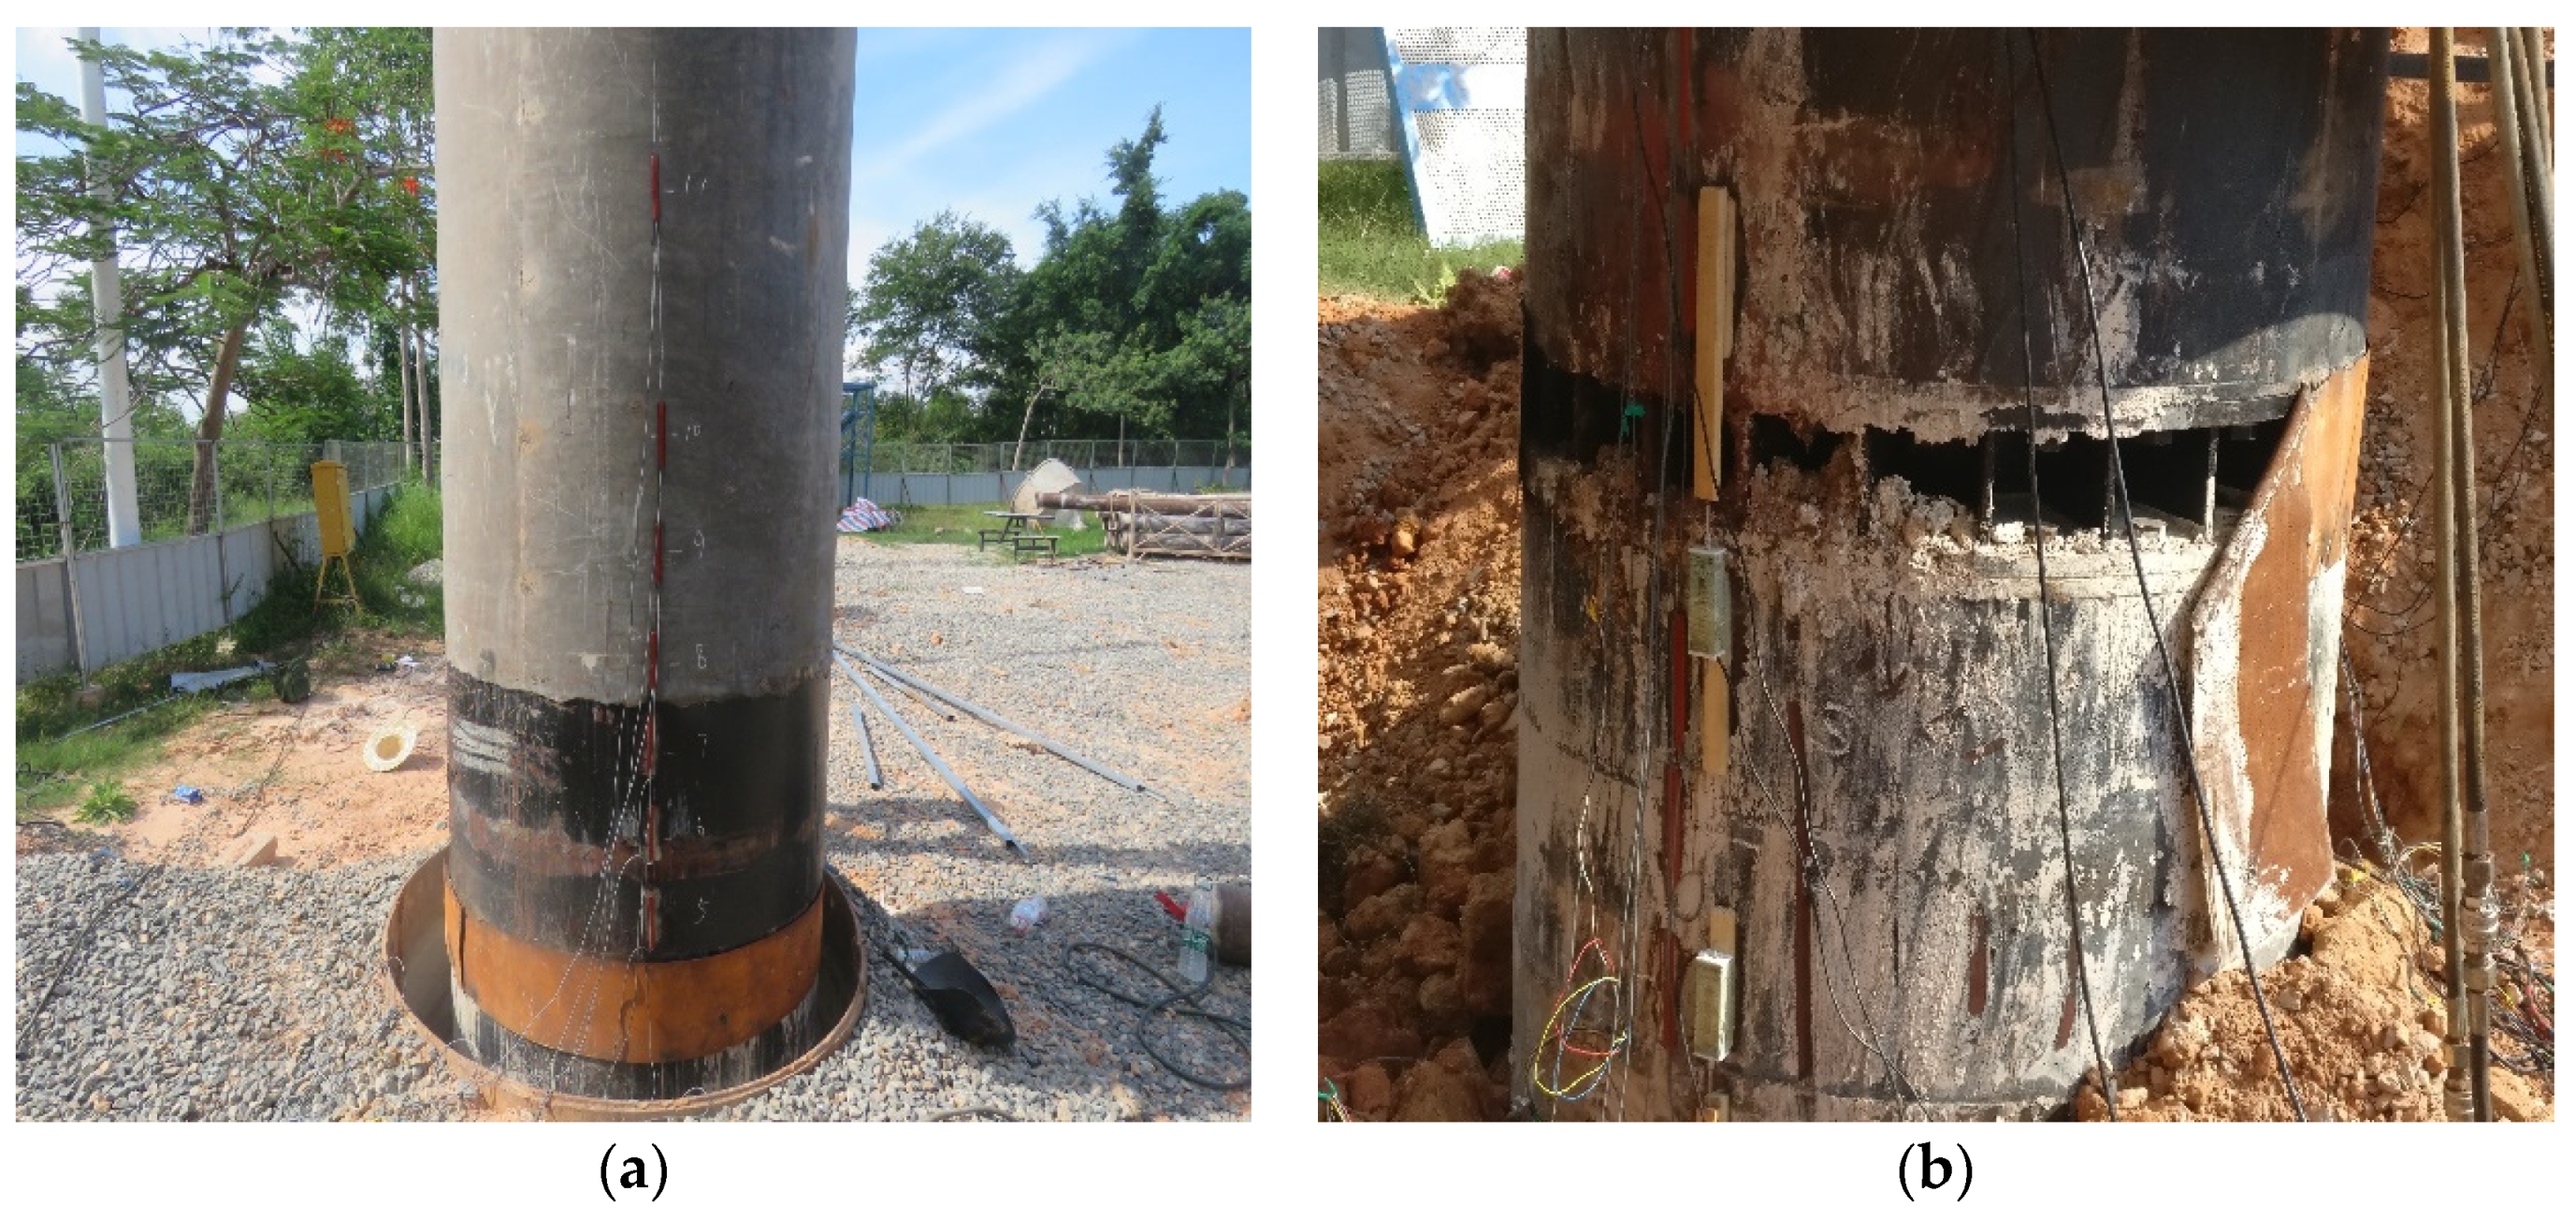
2.3.2. Horizontal Static Load Test of Single Pile

Figure 5 shows the horizontal static load test of a single pile. In this test, the action point of horizontal force should be consistent with the elevation of the bottom surface of the pile foundation bearing platform for the actual project. The bottom surface of the bearing platform of the two test piles in the horizontal static load test is about 5 m higher above the ground. The counterweight in the vertical compression test is used to build a working platform between the two test piles. The test loading method and displacement observation are the same as the vertical compressive static load test of a single pile.

2.3.3. Reliability Test of Pile–Column Connection

In order to verify whether the pile–column connection is reliable, the influence of the connection joint on the force transmission mode of the pile–column is analyzed, and the actual working performance differences of the two connection modes of flange connection and steel plate welding are compared. The reliability test of pile–column connection is carried out at the same time as the horizontal static load test. The reliability test of pile–column connection is the same as the single pile horizontal static load test, in which the horizontal reaction provided by the reaction frame is used for detection, and the two tests are carried out simultaneously. The maximum test load of the project during the test is 300 kN, and the test device is also shown in Figure 5.
Figure 6 shows the detail of the connection between the pile and the pier and the measuring points in the reliability test of pile–column connection. The sections above and below the flange connection are selected to arrange strain and displacement measuring points, respectively. Three test sections are selected for the lower connecting pipe-pile of flange connection, and five test sections are selected for the upper connecting pile–column of flange connection. The distribution principle of the steel plate welding connection is consistent with that of the flange connection test section. The same number of test sections are arranged on the connected upper and lower members, respectively. A total of 8 test sections are arranged on the test pile, and a total of 15 strain measuring points and 14 displacement measuring points. By arranging the section at the upper and lower parts of the connecting node and densifying near the connecting node, the stress of the column and pile near the connecting node could be known, but also the stress from the pier top to the ground is analyzed.

3. Results and Discussion

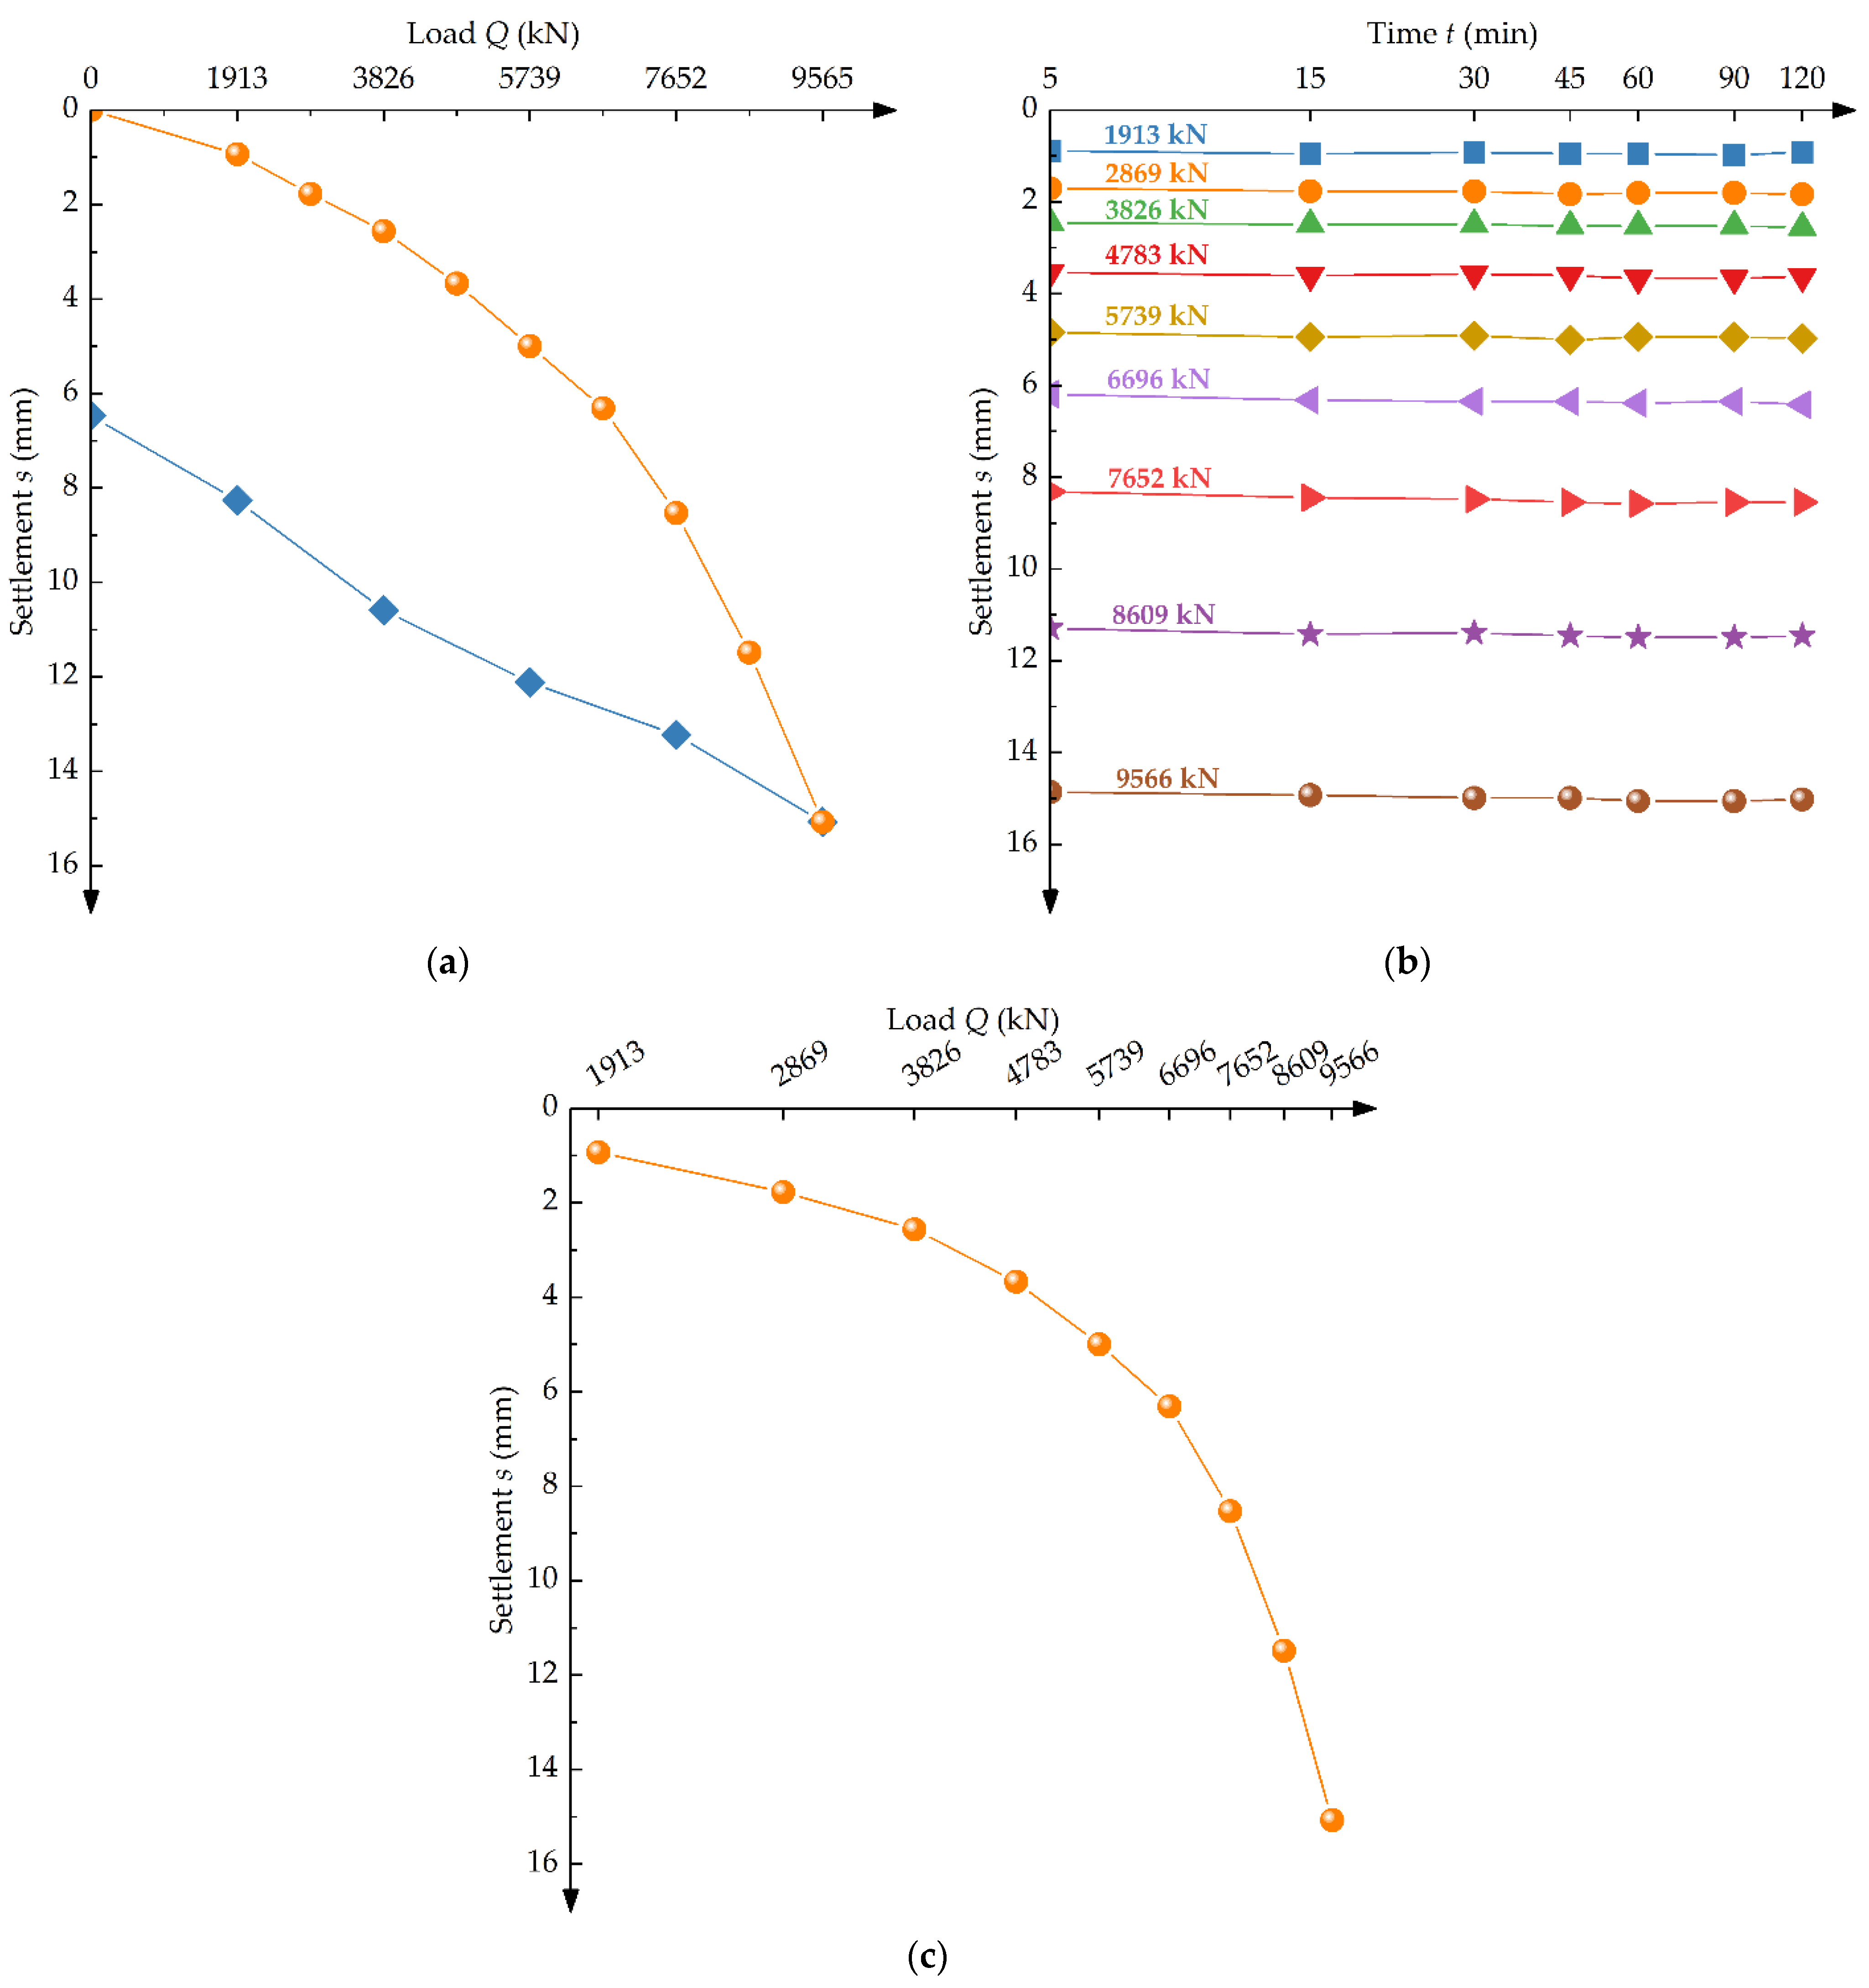
3.1. Analysis of Vertical Compressive Static Load Test of Single Pile

3.1.1. Load Classification of Vertical Compressive Static Load Test of Single Pile

Figure 7 shows the field test of a vertical compressive static load of a single pile by using displacement sensors arranged with datum beam in the vertical direction. Table 3 lists the detailed loading and unloading loads at all levels in this test. In case of any of the following conditions, the loading can be terminated: (1) under the action of a certain level of load, the settlement of the pile top is five times greater than that of the previous level of load, and the total settlement of pile top exceeds 40 mm; (2) under a certain level of load, the settlement of pile top is more than twice that of the previous level of load, and it has not reached the relative stability standard within 24 h; (3) the maximum loading value required by the design has been reached, and the settlement of pile top has reached the relatively stable standard; (4) when the engineering pile is used as anchor pile, the uplift of anchor pile has reached the allowable value; and (5) when the load-settlement curve is in a slow change type, it can be loaded to the total settlement of pile top of 60 mm~80 mm. When the pile end resistance has not been brought into full play, it can be loaded to the pile top, and the cumulative settlement exceeds 80 mm.

3.1.2. Analysis and Judgment of Test Data

The vertical compressive ultimate bearing capacity of a single pile shall be analyzed and determined according to the following methods: (1) according to the characteristics of settlement changing with load, for steep drop curve of load-settlement (Q-S), the load value corresponding to the starting point of obvious steep drop shall be taken; (2) according to the characteristics of settlement changing with time, the load value of the previous level with obvious downward bending at the end of settlement-time logarithm curve (S-lgt) should be taken; (3) when the settlement of pile top under a certain level of load is greater than twice the settlement under the previous level of load, and the relative stability standard has not been reached within 24 h, the load value of the previous level should be taken; (4) for the slowly varying Q-S curve, the corresponding load value of (s = 40 mm) should be taken according to the total settlement of pile top. For the pile with D (D is the pile end diameter) greater than or equal to 800 mm, s can be taken as the load value corresponding to 0.05D. When the pile length is greater than 40 m, the elastic compression of the pile body should be considered; and (5) If the above conditions are not met, the maximum loading value should be taken as the vertical compressive ultimate bearing capacity of the pile. Thus, the characteristic value of the vertical compressive bearing capacity of a single pile shall be taken as 50% of the vertical compressive ultimate bearing capacity of a single pile.
According to the test results of the vertical compressive static load test of a single pile, the curves of load–settlement (Q-S), settlement–time logarithm (S-lgt), and settlement–load logarithm (S-lgQ) are drawn for the selected single piles (No. 3 and No. 4), as shown in Figure 8 and Figure 9.
From Figure 8 and Figure 9, when the test load is added to 9566 kN, it takes 120 min to observe, and could be found that the settlement is relatively stable, and the loading has reached the maximum test load, so the loading is terminated. According to the technical requirements of the Chinese standard (JGJ 106-2014), the measured data are sorted and summarized. Table 4 summarizes the vertical static load test results of a single pile. The maximum loading value of the test single pile (No. 3) test is 9566 kN, the cumulative total settlement is 15.01 mm, and there is no obvious steep drop section of the load–settlement (Q-S) curve. For single pile No. 4, the maximum loading value is 9566 kN, and the cumulative total settlement is 4.27 mm. The test result of the limit value of the vertical compressive bearing capacity of a single pile is 9566 kN, and the test result of the characteristic value of the vertical compressive bearing capacity of a single pile is 4783 kN. There are some differences in the vertical compressive static load test. The main reasons are as follows: (1) the completely weathered, strongly weathered, and moderately weathered layers were artificially divided according to the field boreholes, and the differences may be large; (2) moderately weathered parts may exist in completely weathered and strongly weathered layers, resulting in great differences in bearing capacity; and (3) the drilling process, the specific gravity and consistency of the mud would all affect the bearing capacity of the pile. The deeper the pile end enters the strongly weathered layer, the smaller the impact.

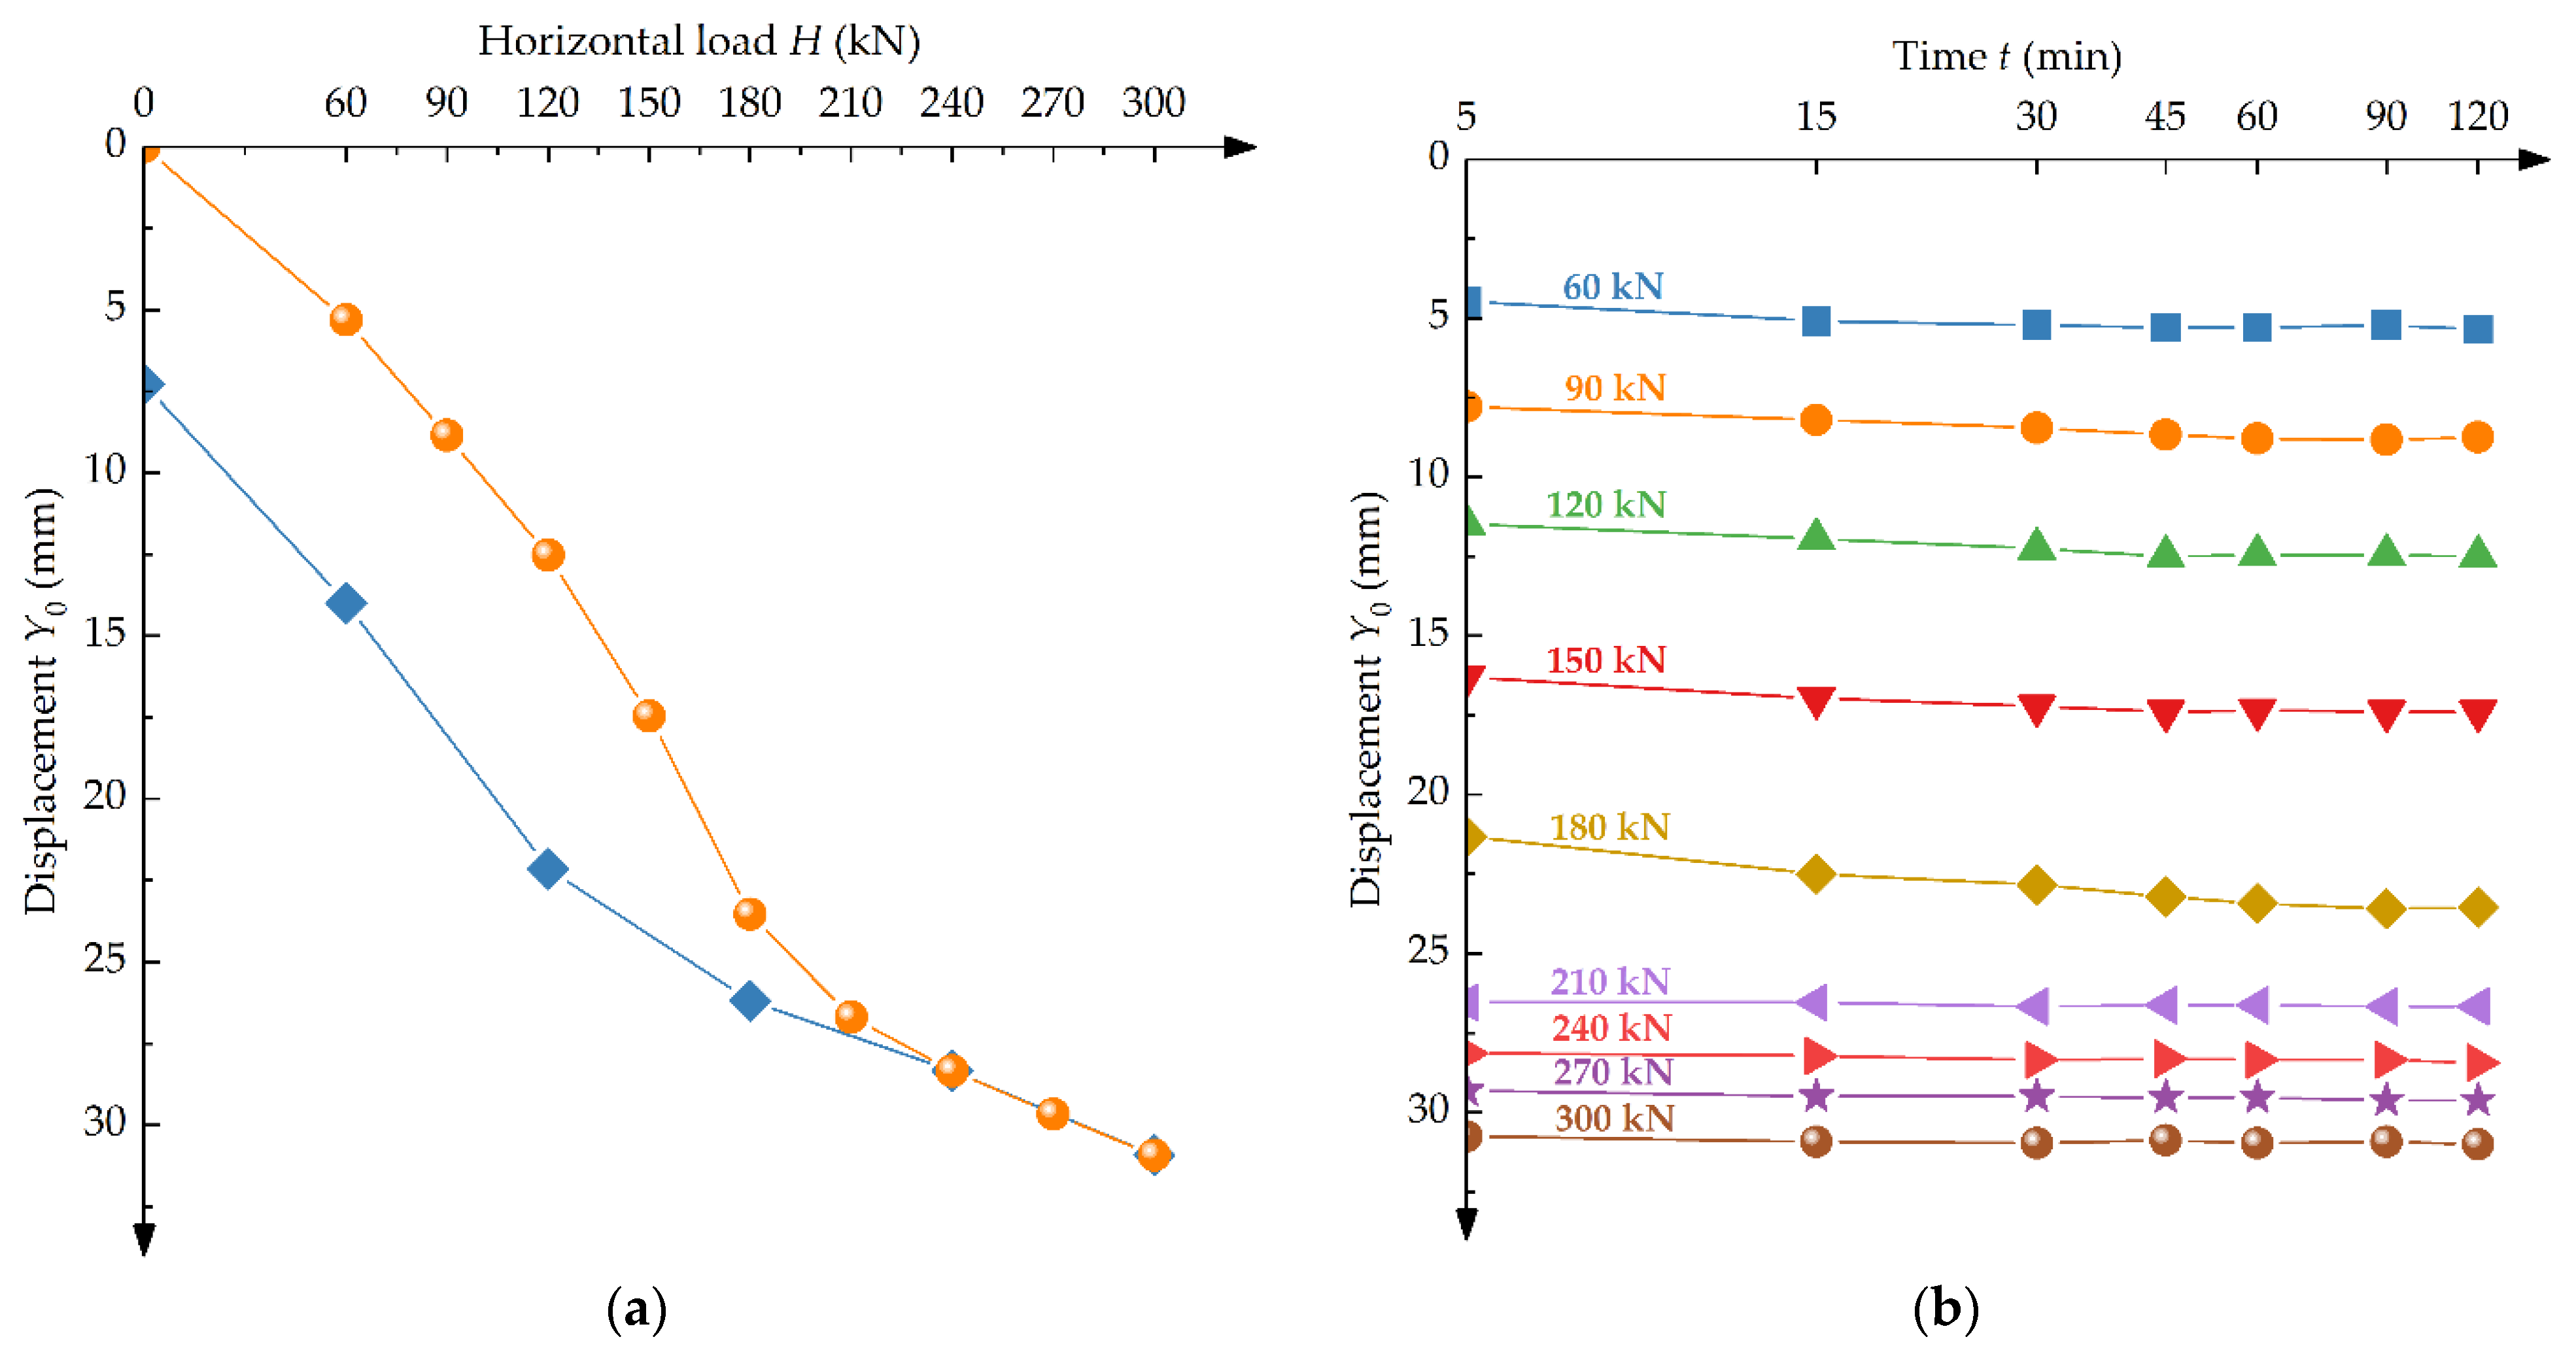
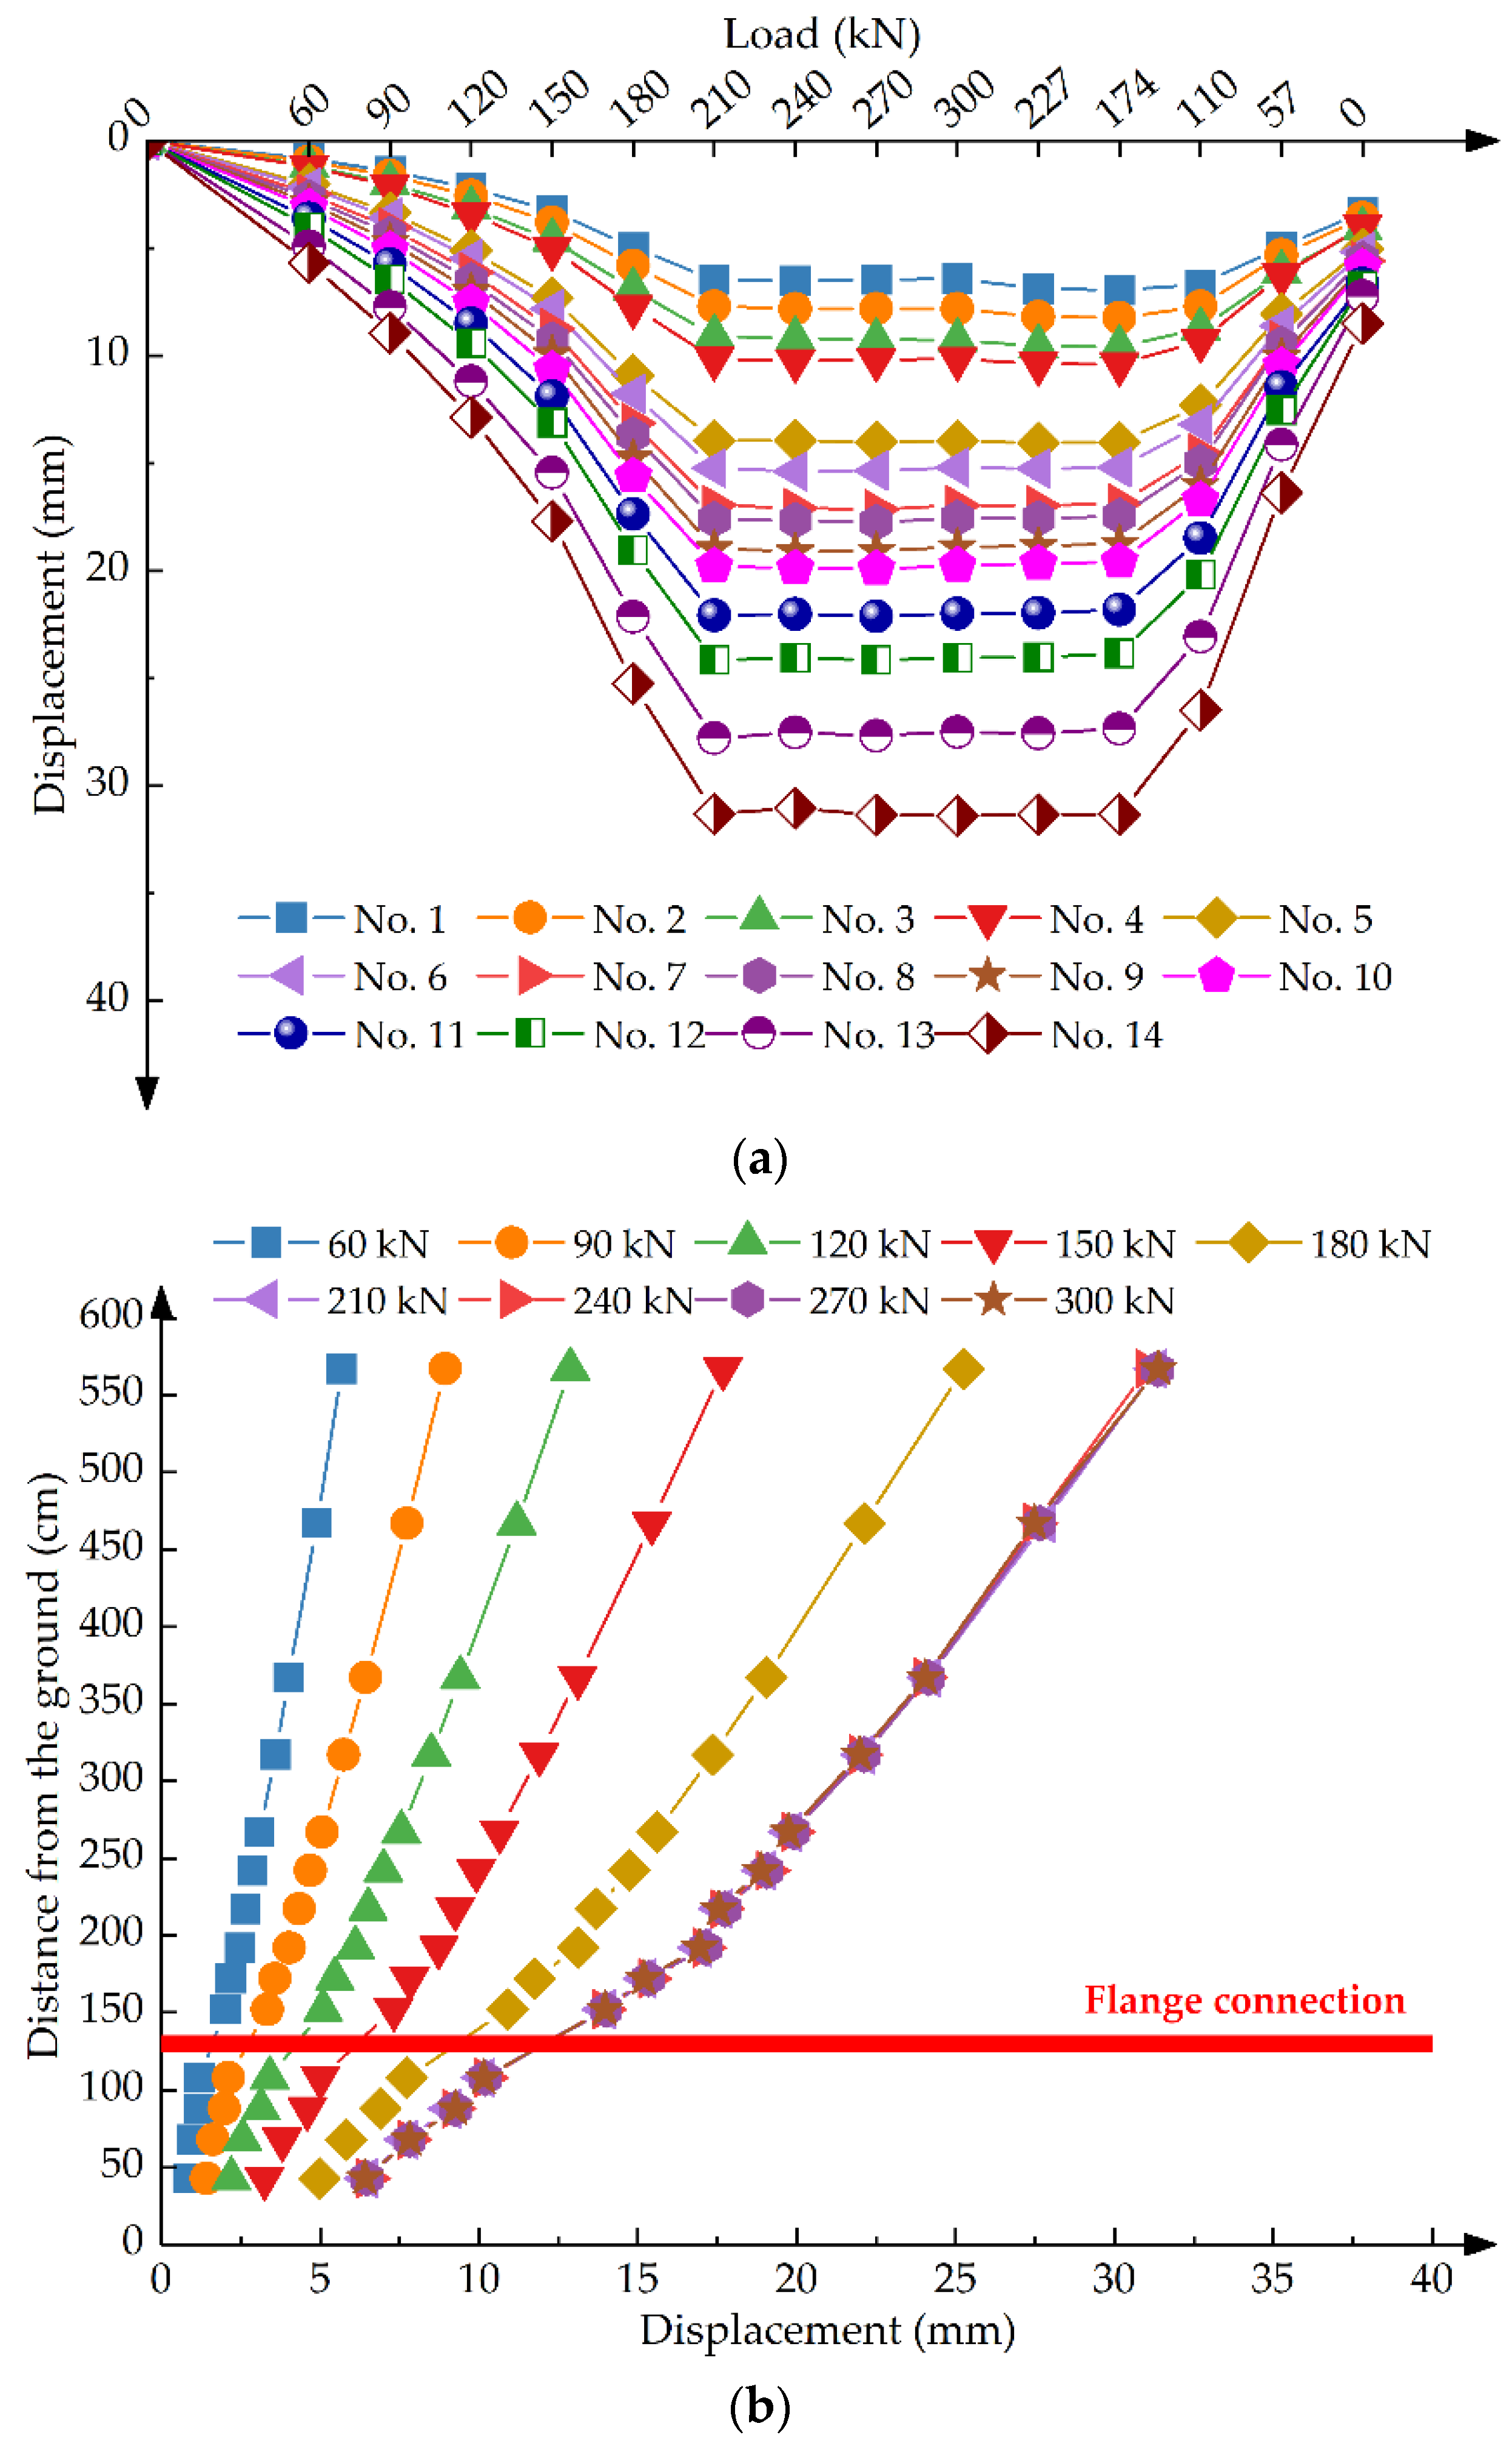
3.2. Analysis of Horizontal Static Load Test of Single Pile

3.2.1. Load Classification of Vertical Compressive Static Load Test of Single Pile

Figure 10 shows the field test of the horizontal static load test of a single pile. Table 5 lists the detailed loading and unloading loads at all levels in this test. In case of any of the following conditions, the loading can be terminated: (1) broken pile body; (2) when the horizontal displacement exceeds 40 mm; (3) the applied horizontal load has exceeded the ultimate load determined by the horizontal load-time-horizontal displacement at pile top (H-t-Y0) curve or horizontal load-displacement gradient (HY0H); or (4) the horizontal displacement reaches the allowable value of horizontal displacement required by the design.

3.2.2. Analysis and Judgment of Test Data

The horizontal ultimate bearing capacity of a single pile shall be comprehensively analyzed and determined according to the following methods: (1) take the horizontal load value corresponding to the starting point of an obvious steep drop of H-Y0 curve; (2) take the horizontal load value of the previous level with obvious bending at the tail of Y0-lgt curve; (3) take the horizontal load value corresponding to the second inflection point on HY0H curve or lgH-lgY0 curve; and (4) the load value of the previous level of pile shaft breaking. After that, according to the specification requirements, the characteristic value of the horizontal bearing capacity of a single pile shall comply with the following provisions: (1) when the pile body is not allowed to crack or the reinforcement ratio of the cast-in-place pile body is less than 0.65%, and then 0.75 times of the horizontal critical load can be taken as the characteristic value of the horizontal bearing capacity of a single pile. (2) For reinforced concrete precast pile, the characteristic value of horizontal compressive bearing capacity of a single pile is 0.75 times the load corresponding to the horizontal displacement at the design elevation as the characteristic value of horizontal bearing capacity of the single pile, and the horizontal displacement shall be taken as follows: (1) 6 mm for buildings sensitive to horizontal displacement and (2) 10 mm for buildings insensitive to horizontal displacement. (3) The load corresponding to the horizontal allowable displacement required by the design is taken as the characteristic value of the horizontal bearing capacity of a single pile.
According to the test results of the horizontal static load test of a single pile, the curves of horizontal load–displacement (H-Y0) and displacement–time logarithm curve (Y0-lgt) are drawn for the selected single pile No. 5, as shown in Figure 11.
From Figure 11, when the test load is increased to 300 kN, the observation at this level lasts 120 min and the displacement is relatively stable, and the loading has reached the maximum test load value, so the loading is terminated. According to the technical requirements, the measured data are sorted and summarized, and the horizontal force–displacement (H-Y0) curve and displacement–time logarithm curve (Y0-lgt) curve are analyzed. The maximum loading value of the tested pile test is 300 kN, the cumulative total displacement of a force action point is 31.89 mm, there is no obvious steep drop section in the horizontal force–displacement (H-Y0) curve, the detection result of horizontal critical load of the single pile is 300 kN, and the detection result of the characteristic value of horizontal bearing capacity of the single pile is 225 kN, which meets the design requirements. With the increase of horizontal load, the horizontal displacement also increases gradually, but due to the large pile diameter, the increase of horizontal displacement under each level of load is not very large. In the whole loading process, the horizontal displacement and horizontal load change in a nonlinear relationship. The measured results are related to many factors, such as the stiffness of the pile, the depth of the pile into the soil, the size and shape of the pile section, the size of the horizontal load and the engineering properties of the soil around the pile.

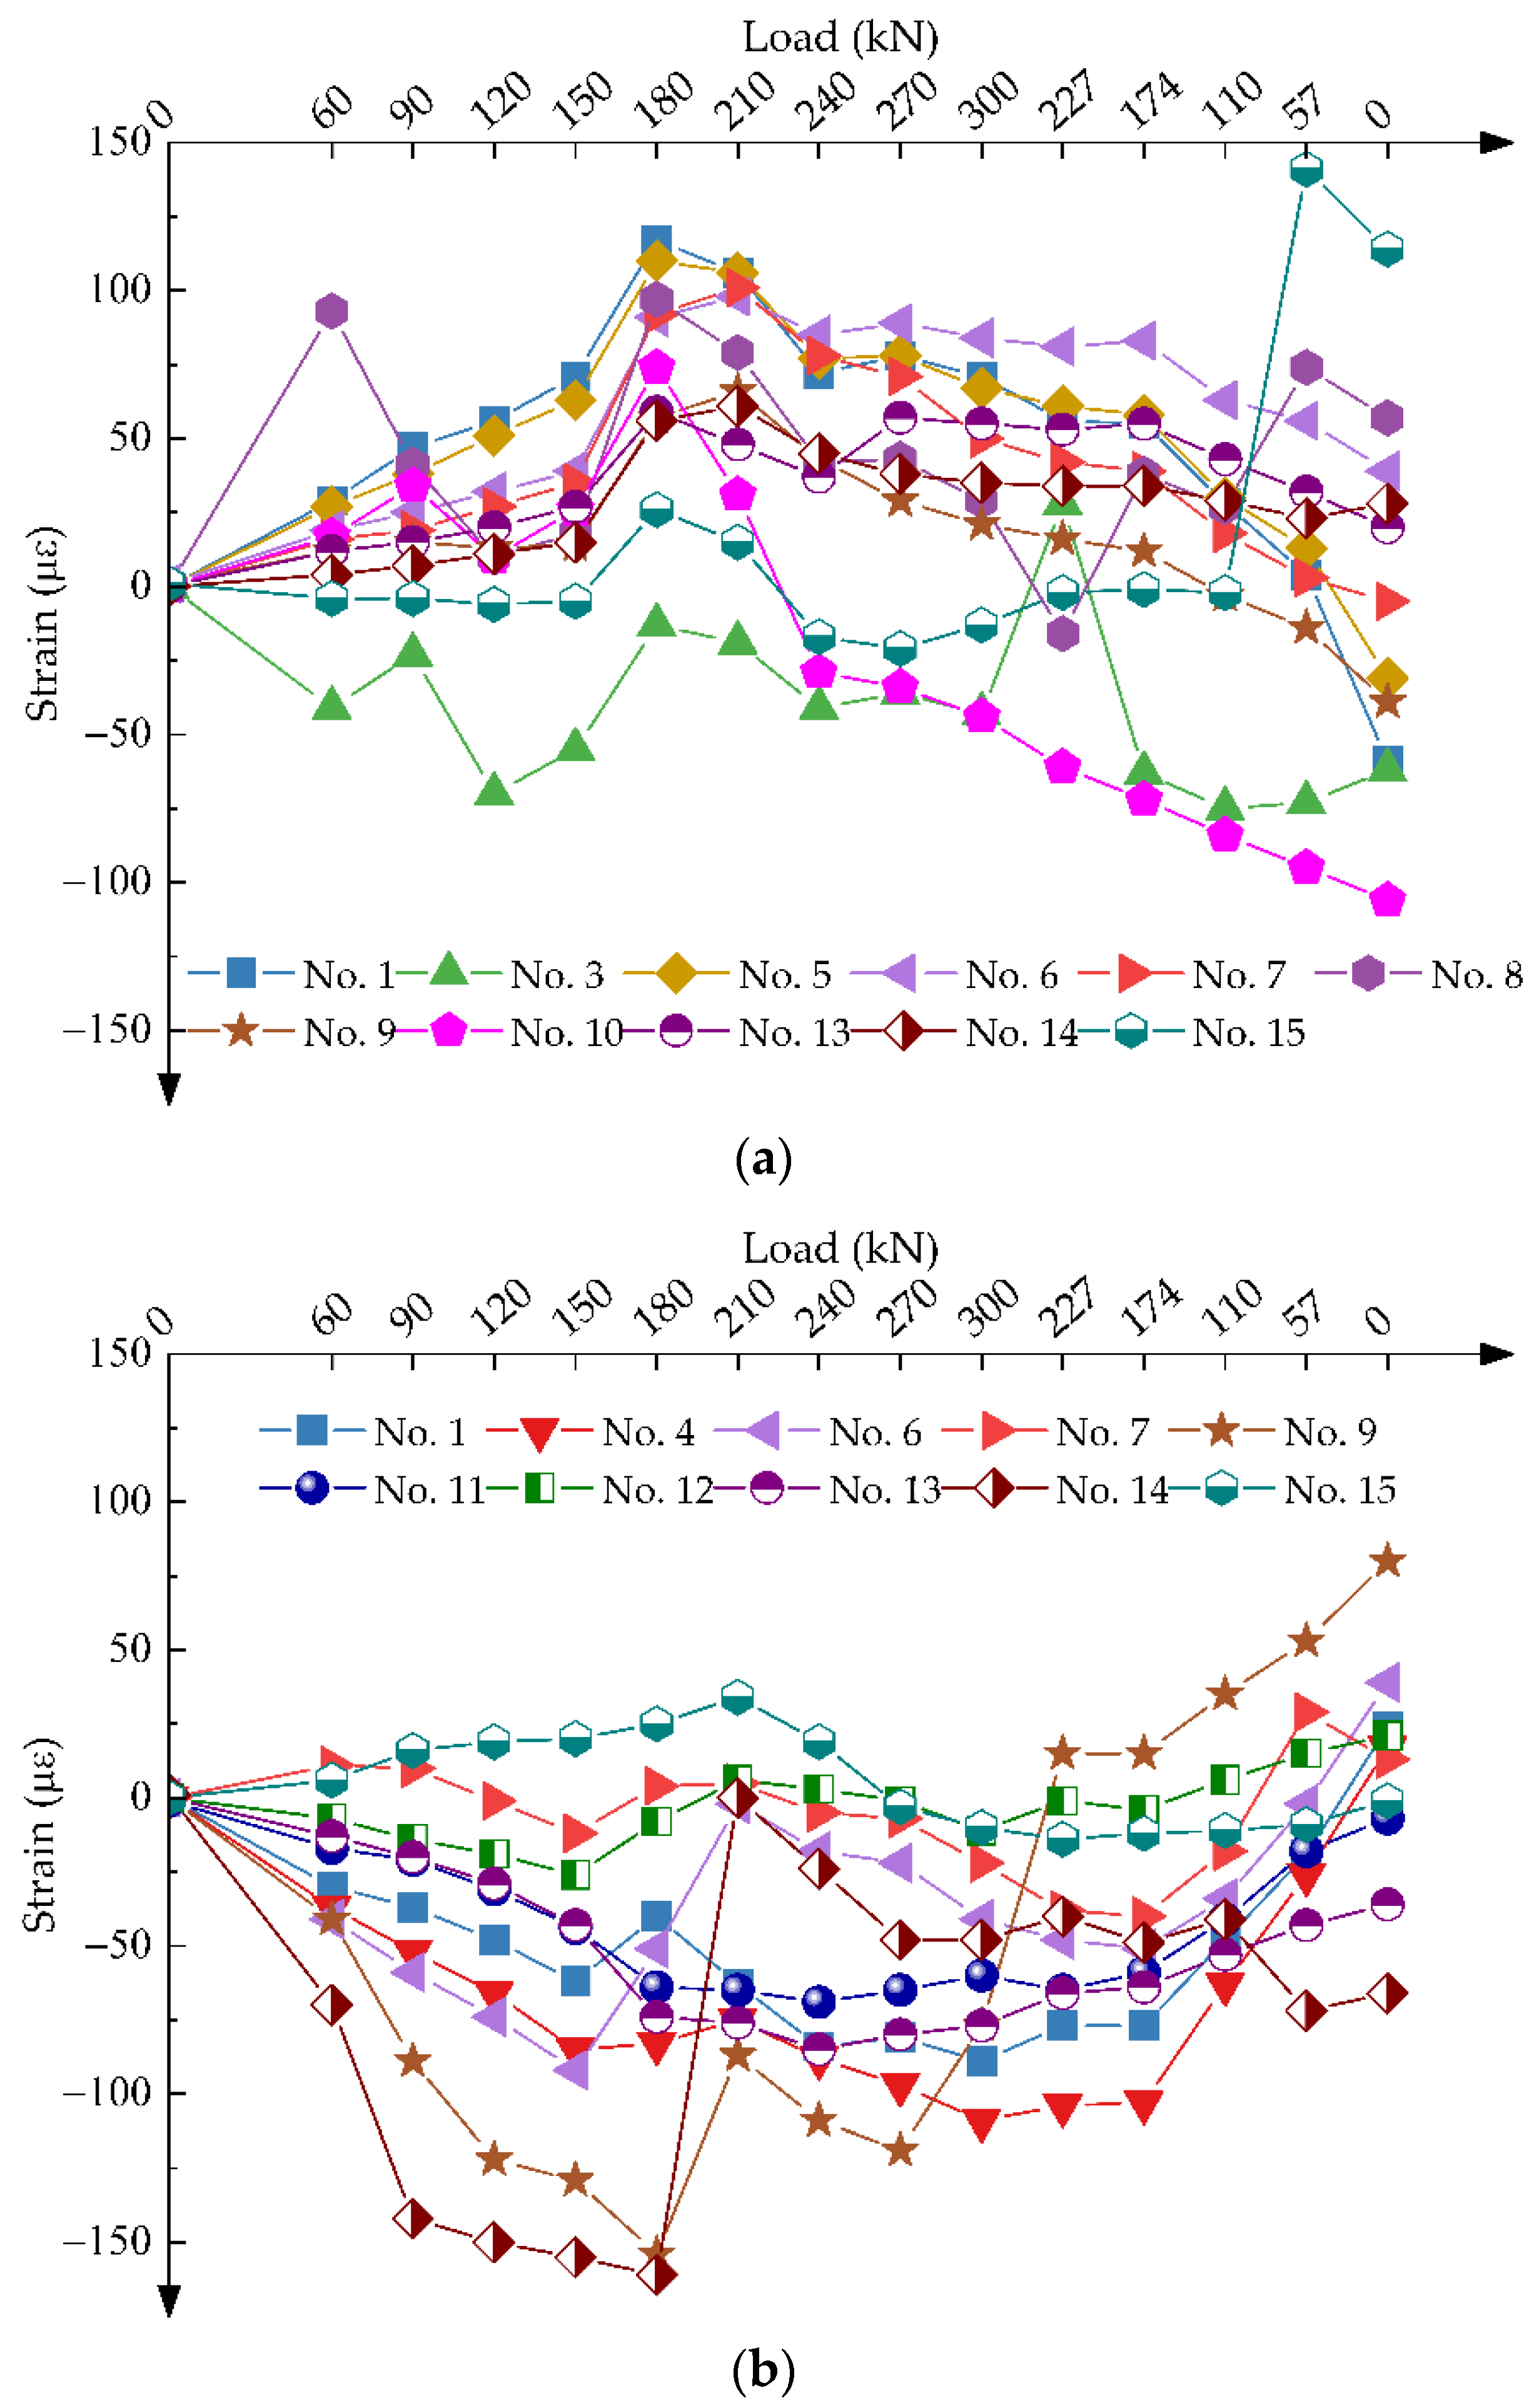
3.3. Analysis of Reliability Test of Pile–Column Connection

Figure 12 shows the field reliability test of pile–column connection. After the loads at all levels are loaded and the displacement data is stable, the displacement value of each measuring point could be read and the displacement curves with a load of each transverse displacement measuring point on the selected test pile No. 5 are shown in Figure 13.
It can be seen from Figure 13a that when a load of single pile No. 5 is loaded to 300 kN, the displacement of each measuring point is relatively stable, and the maximum horizontal displacement is 31.38 mm. There are no problems found through the appearance inspection of the flange connection. From the results in Figure 13b, it can be seen that the displacement of single pile No. 5 at different distances from the ground changes smoothly, indicating that the flange connection is relatively intact. Moreover, through Figure 13b, according to the results, the displacement curve of single pile No. 5 at the flange connection position under various loads of the test pile does not have an obvious angle break, and there is no sudden change in the slope, indicating that the flange connection quality is good.
The variation curve of strain with load at each measuring point of single pile No. 5 is shown in Figure 14. Through the strain test results in Figure 14, it can be seen that the strain results are subject to many interference factors, and some strain measurement point data are abnormal, so the strain data can only be used as an aid to the displacement results. Therefore, the quality of the connection cannot be directly judged by the strain distribution curve in Figure 14.
According to the above analysis of the reliability test of pile–column connection, when a load of single pile No. 5 reaches 300 kN, the displacement of each measuring point is relatively stable, and the maximum horizontal displacement is 31.38 mm. Meanwhile, there are no problems found through the appearance inspection of the connection, and the displacement of single pile No. 5 at different heights changes smoothly, indicating that the connection is relatively intact. On the other hand, because the strain results are subject to many interference factors and some strain measurement point data are abnormal, the strain data can only be used as an auxiliary to the displacement results.

4. Conclusions

In this study, the assembly process of “pile–column integration” has been proposed. The pile column structure of the bridge can be completed by prefabricated pile foundation, pier, and cap beam based on the integral assembly installation method. The vertical compressive static load test, horizontal static load test, and reliability test of pile–column connection were conducted. From the test results, the following conclusion could be drawn:
(1) Through the vertical and horizontal static load tests of single pile, the vertical and horizontal bearing capacity limit values of single pile can be accurately determined, which can meet the requirements. In the design of pile foundation in practical engineering, the pile end bearing layer, pile length, pile diameter, concrete strength grade, and other designs could be determined to give full play to the inherent ultimate bearing capacity of the pile;
(2) The displacement curve of single pile No. 5 at the flange connection position under various loads of the pile does not have an obvious angle break, and there is no sudden change in the slope, indicating that the flange connection quality is good. The strain data are suggested as auxiliary to the displacement results;
(3) The findings of vertical and horizontal static load tests and connection reliability in this study proved the feasibility of this prefabricated bridge substructure “pile–column integration”, which can provide a reference for the rapid construction of bridges.

Author Contributions

Conceptualization, H.W., L.W. and K.Y.; methodology, H.W., L.W. and W.W.; validation, S.X., G.W. and R.L.; formal analysis, H.W., L.W. and W.W.; investigation, K.Y., S.X., G.W. and R.L.; writing—original draft preparation, H.W. and L.W.; writing—review and editing, K.Y. and W.W.; project administration, H.W. and W.W.; funding acquisition, H.W. and W.W. All authors have read and agreed to the published version of the manuscript.

Funding

This research was funded by the Science and Technology Base and Talent Special Project of Guangxi Province (grant number: AD19245152), Science and Technology Key R&D Project of Guangxi (grant number: AB22035074), “Yongjiang Plan” of Nanning Leading Talents in Innovation and Entrepreneurship (grant number: 2018-01-04), National Key R&D Program of China (grant number: 2021YFB2600604), High-Level Entrepreneurship and Innovation Talents Project of Nanning High Tech Zone (grant number: 2020008), China Postdoctoral Science Foundation (grant number: 2021T140262), Scientific and Technological Project of Science and Technology Department of Jilin Province (grant number: 20210508028RQ), Scientific Research Project of Department of Education of Jilin Province (grant number: JJKH20221019KJ).

Institutional Review Board Statement

Not applicable.

Informed Consent Statement

Not applicable.

Data Availability Statement

Not applicable.

Conflicts of Interest

The authors declare no conflict of interest.

References

  1. Serra, M.; Festa, G.; Vassallo, M.; Zollo, A.; Quattrone, A.; Ceravolo, R. Damage detection in elastic properties of masonry bridges using coda wave interferometry. Struct. Control Health Monit. 2017, 24, e1976. [Google Scholar] [CrossRef]
  2. Liu, H.B.; Wang, H.; Tan, G.J.; Wang, W.S.; Liu, Z.Y. Effect of temperature and spring-mass systems on modal properties of timoshenko concrete beam. Struct. Eng. Mech. 2018, 65, 389–400. [Google Scholar]
  3. Jiang, G.; Liang, Q.; Wang, H.; Ju, Y.; Wang, H.; Wang, X.; Wang, L.; Wang, W. Study on Evaluation Theory of Bridge Damage State and Methodology on Early Warning of Danger. Adv. Mater. Sci. Eng. 2022, 2022, 6636959. [Google Scholar] [CrossRef]
  4. Yi, T.; Wang, H.; Xie, J.; Wang, W. Flexural Strength and Acoustic Damage Characteristics of Steel Bar Reactive Powder Concrete. Appl. Sci. 2021, 11, 7017. [Google Scholar] [CrossRef]
  5. Wang, X.; Wang, L.; Wang, H.; Ning, Y.; Huang, K.; Wang, W. Performance Evaluation of a Long-Span Cable-Stayed Bridge Using Non-Destructive Field Loading Tests. Appl. Sci. 2022, 12, 2367. [Google Scholar] [CrossRef]
  6. Wang, H.; Wang, L.; Zhuo, X.; Huang, K.; Wang, X.; Wang, W. Study on the Precise Displacement Controlling Method for a Suspended Deck in the Hanger Replacement Process of an Arch Bridge. Appl. Sci. 2021, 11, 9607. [Google Scholar] [CrossRef]
  7. Saleem, M.A.; Zafar, M.N.; Saleem, M.M.; Xia, J. Recent developments in the prefabricated bridge deck systems. Case Stud. Constr. Mater. 2021, 15, e00750. [Google Scholar] [CrossRef]
  8. Xia, L.; Hu, Z.; Shah, Y.I. Longitudinal load distribution of a weakly connected prefabricated bridge abutment. Arch. Appl. Mech. 2021, 91, 4121–4140. [Google Scholar] [CrossRef]
  9. Shim, C.-S.; Dang, S.N.; Park, S. Three-Dimensional Information Delivery for Design and Construction of Prefabricated Bridge Piers. Struct. Eng. Int. 2018, 28, 6–12. [Google Scholar] [CrossRef]
  10. Ryu, H.-K.; Kim, Y.-J.; Chang, S.-P. Crack control of a continuous composite two-girder bridge with prefabricated slabs under static and fatigue loads. Eng. Struct. 2007, 29, 851–864. [Google Scholar] [CrossRef]
  11. Haider, M.A.; Batikha, M.; Elhag, T. Precast versus cast in-situ concrete in the construction of post-tensioned box-girder bridges: Span effect. Struct. Concr. 2020, 21, 56–64. [Google Scholar] [CrossRef]
  12. Moyo, P.; Sibanda, B.; Beushausen, H. Modelling and integrity assessment of shear connectors in precast cast-in-situ concrete bridges. Struct. Eng. Mech. 2012, 42, 55–72. [Google Scholar] [CrossRef]
  13. Kuryłowicz-Cudowska, A. Determination of Thermophysical Parameters Involved in The Numerical Model to Predict the Temperature Field of Cast-In-Place Concrete Bridge Deck. Materials 2019, 12, 3089. [Google Scholar] [CrossRef] [Green Version]
  14. Jensen, T.W.; Poulsen, P.N.; Hoang, L.C. Limit analysis of reinforced concrete slabs with construction joints. Eng. Struct. 2020, 205, 110062. [Google Scholar] [CrossRef]
  15. Fasching, S.; Huber, T.; Rath, M.; Kollegger, J. Semi-precast segmental bridges: Development of a new construction method using thin-walled prefabricated concrete elements. Struct. Concr. 2021, 22, 1561–1573. [Google Scholar] [CrossRef]
  16. Suffner, A.; Schulze, T. Green bridges from prefabricated arch-segments. Bautechnik 2016, 93, 98–101. [Google Scholar] [CrossRef]
  17. Chandara, K.; Chang-Su, S.; Sung-Jun, P. Seismic performance of prefabricated bridge columns with combination of continuous mild reinforcements and partially unbonded tendons. Smart Struct. Syst. 2016, 17, 541–557. [Google Scholar]
  18. Billington, S.L.; Barnes, R.W.; Breen, J.E. A Precast Segmental Substructure System for Standard Bridges. PCI J. 1999, 44, 56–73. [Google Scholar] [CrossRef]
  19. Zhuo, W.; Tong, T.; Liu, Z. Analytical Pushover Method and Hysteretic Modeling of Precast Segmental Bridge Piers with High-Strength Bars Based on Cyclic Loading Test. J. Struct. Eng. 2019, 145, 04019050. [Google Scholar] [CrossRef]
  20. ElGawady, M.A.; Dawood, H.M. Analysis of segmental piers consisted of concrete filled FRP tubes. Eng. Struct. 2012, 38, 142–152. [Google Scholar] [CrossRef]
  21. Peeters, B.; Couvreur, G.; Razinkov, O.; Kündig, C.; Van Der Auweraer, H.; De Roeck, G. Continuous monitoring of the Øresund Bridge: System and data analysis. Struct. Infrastruct. Eng. 2009, 5, 395–405. [Google Scholar] [CrossRef]
  22. Park, J.; Choi, J.; Jang, Y.; Park, S.-K.; Hong, S. An Experimental and Analytical Study on the Deflection Behavior of Precast Concrete Beams with Joints. Appl. Sci. 2017, 7, 1198. [Google Scholar] [CrossRef] [Green Version]
  23. Hong, J.; Shen, G.Q.; Li, Z.; Zhang, B.; Zhang, W. Barriers to promoting prefabricated construction in China: A cost–benefit analysis. J. Clean. Prod. 2018, 172, 649–660. [Google Scholar] [CrossRef]
  24. Jiang, L.; Li, Z.; Li, L.; Gao, Y. Constraints on the Promotion of Prefabricated Construction in China. Sustainability 2018, 10, 2516. [Google Scholar] [CrossRef] [Green Version]
  25. Wu, Q.H.; Qiu, Z.Z.; Niu, Z. Study on the Factory Prefabrication Technology of Large-Span Bridges Pier. In Applied Mechanics and Materials; Trans Tech Publications Ltd.: Stafa-Zurich, Switzerland, 2014; Volume 501, pp. 1413–1417. [Google Scholar] [CrossRef]
  26. Li, F.; Shen, Y. Full-scale test of the hydration heat and the curing method of the wet joints of a precast segmental pier of a bridge. Eur. J. Environ. Civ. Eng. 2017, 21, 348–370. [Google Scholar] [CrossRef]
  27. Chen, R.; Tan, Y.; Zhang, B.; Shen, W.; Liu, G.; Wang, Z. Installation of Integral Prefabricated Bridge Abutment and Pier with Flexible Water Stop Curtain. J. Constr. Eng. Manag. 2018, 144, 04018087. [Google Scholar] [CrossRef]
  28. Wu, D.; Xiong, W.; Guo, J. Establishment and Repetition Survey of Primary GNSS Control Network of Hong Kong–Zhuhai–Macao Bridge. J. Surv. Eng. 2022, 148, 05021006. [Google Scholar] [CrossRef]
  29. Fan, J.-J.; Feng, D.-C.; Wu, G.; Hou, S.; Lu, Y. Experimental study of prefabricated RC column-foundation assemblies with two different connection methods and using large-diameter reinforcing bars. Eng. Struct. 2020, 205, 110075. [Google Scholar] [CrossRef]
  30. Billington, S.L.; Yoon, J.K. Cyclic Response of Unbonded Posttensioned Precast Columns with Ductile Fiber-Reinforced Concrete. J. Bridge Eng. 2004, 9, 353–363. [Google Scholar] [CrossRef]
  31. Marriott, D.; Pampanin, S.; Palermo, A. Quasi-static and pseudo-dynamic testing of unbonded post-tensioned rocking bridge piers with external replaceable dissipaters. Earthq. Eng. Struct. Dyn. 2009, 38, 331–354. [Google Scholar] [CrossRef]
  32. Roh, H.; Reinhorn, A.M. Hysteretic behavior of precast segmental bridge piers with superelastic shape memory alloy bars. Eng. Struct. 2010, 32, 3394–3403. [Google Scholar] [CrossRef]
  33. Kim, D.H.; Moon, D.Y.; Kim, M.K.; Zi, G.; Roh, H. Experimental test and seismic performance of partial precast concrete segmental bridge column with cast-in-place base. Eng. Struct. 2015, 100, 178–188. [Google Scholar] [CrossRef]
  34. Wang, Z.Q.; Ge, J.P.; Wei, H.Y. Seismic performance of prestressed concrete bridge column of east sea bridge. J. Tongji Univ. 2008, 32, 1462–1466. [Google Scholar]
  35. Ma, J.; Han, S.; Gao, X.; Li, D.; Guo, Y.; Liu, Q. Dynamic Lateral Response of the Partially-Embedded Single Piles in Layered Soil. Appl. Sci. 2022, 12, 1504. [Google Scholar] [CrossRef]
  36. Garala, T.K.; Madabhushi, G.S.P. Role of Pile Spacing on Dynamic Behavior of Pile Groups in Layered Soils. J. Geotech. Geoenviron. Eng. 2021, 147, 04021005. [Google Scholar] [CrossRef]
  37. Wang, L.; Wang, H.; Yang, K.; Xie, S.; Wei, G.; Li, R.; Wang, W. Full-Scale Prefabrication and Non-Destructive Quality Monitoring of Novel Bridge Substructure for “Pile-Column Integration”. Buildings 2022, 12, 715. [Google Scholar] [CrossRef]
Figure 1. Application project for “Pile–Column Integration”: (a) schematic diagram of site selection and site conditions; (b) core samples of rock and soil; and (c) the basic parameters of soil.
Applsci 12 05520 g001aApplsci 12 05520 g001b
Figure 2. “Pile–Column Integration”: (a) schematic diagram of composite embedded pile method (unit: mm) and (b) construction process.
Applsci 12 05520 g002
Figure 3. Schematic diagram of static load test site of the test pile. (Unit: mm).
Applsci 12 05520 g003
Figure 4. Construction of ballast platform: (a) schematic diagram of surcharge test device and (b) datum beam and datum pile.
Applsci 12 05520 g004aApplsci 12 05520 g004b
Figure 5. Construction of ballast platform for a horizontal static load test (unit: mm).
Applsci 12 05520 g005
Figure 6. Layout diagram of measuring points in the reliability test of pile–column connection.
Applsci 12 05520 g006
Figure 7. Field test of a vertical compressive static load of the single pile: (a) ballast platform; (b) field test; and (c) lifting jack and displacement sensor installation.
Applsci 12 05520 g007
Figure 8. Vertical compressive static load test results of single pile No. 3: (a) load–settlement curve (Q-S); (b) settlement–time logarithm curve (S-lgt), and (c) settlement–load logarithm curve (S-lgQ).
Applsci 12 05520 g008
Figure 9. Vertical compressive static load test results of single pile No. 4: (a) load–settlement curve (Q-S); (b) settlement–time logarithm curve (S-lgt), and (c) settlement–load logarithm curve (S-lgQ).
Applsci 12 05520 g009
Figure 10. Field test of horizontal static load test of the single pile: (a) ballast platform and lifting jack and (b) displacement sensor installation.
Applsci 12 05520 g010
Figure 11. Vertical compressive static load test results of single pile No. 5: (a) horizontal load–displacement (H-Y0) and (b) displacement–time logarithm curve (Y0-lgt).
Applsci 12 05520 g011
Figure 12. Field reliability test of pile–column connection: (a) arrangement of strain measuring points and (b) arrangement of displacement measuring points at flange connection.
Applsci 12 05520 g012
Figure 13. Displacement test results of single pile No. 5: (a) displacement–load curve of each transverse displacement measuring point and (b) displacement curves under various loads.
Applsci 12 05520 g013
Figure 14. Strain test results of single pile No. 5: (a) strain–load curve of strain measuring point on the left side and (b) strain–load curve of strain measuring point on the right side.
Applsci 12 05520 g014
Table 1. Properties of concrete used in this study.
ParametersElastic
Modulus
(MPa)
Bulk
Density
(kN/m3)
Axial Compression
Strength Design
fcd (MPa)
Axial Tension
Strength Design
ftd (MPa)
Poisson’s
Ratio
Linear
Expansion
Coefficient (°C)
C703.75 × 1042630.52.100.21.0×10−5
C503.45 × 1042622.41.830.21.0×10−5
C403.25 × 1042618.41.650.21.0×10−5
C303.00 × 1042613.81.390.21.0×10−5
Table 2. Properties of reinforcement used in this study.
ParametersElastic Modulus
Es (MPa)
Tensile Design Strength
fsd (MPa)
Standard Strength
fsk (MPa)
HPB3002.1 × 105195300
HPB4002.0 × 105280400
Table 3. Loading and unloading capacity at all levels and oil pressure of lifting jack in a vertical compressive static load test.
ParametersLevel 2Level 3Level 4Level 5Level 6Level 7Level 8
Load (kN)1913.22869.83826.44783.05739.66696.27652.8
Pressure (MPa)7.98211.87015.75819.64623.53427.42131.309
ParametersLevel 9Level 10Level 8Level 6Level 4Level 2Unload to 0
Load (kN)8609.49566.07652.85739.63826.41913.20
Pressure (MPa)35.19739.08531.30923.53415.7587.9820
Table 4. Summary of vertical static load test results of a single pile.
No.Pile Diameter (mm)Pile Length (m)Maximum
Settlement (mm)
Maximum Rebound (mm)Rebound Rate (%)Ultimate Bearing
Capacity (kN)
313002415.018.5356.89566
41300244.273.6683.89566
Table 5. Loading and unloading capacity at all levels and oil pressure of lifting jack in horizontal static load test.
ParametersLevel 2Level 3Level 4Level 5Level 6Level 7Level 8
Load (kN)6090120150180210240
Pressure (MPa)0.4500.5720.6940.8160.9381.0601.182
ParametersLevel 9Level 10Level 8Level 6Level 4Level 2Unload to 0
Load (kN)270300240180120600
Pressure (MPa)1.3041.4261.1820.9380.6940.4500
Publisher’s Note: MDPI stays neutral with regard to jurisdictional claims in published maps and institutional affiliations.

