Article

A Single Wearable Sensor for Gait Analysis in Parkinson’s Disease: A Preliminary Study

1
Department of Information Engineering (DII), Università Politecnica delle Marche, 60131 Ancona, Italy
2
Rehabilitation Center S. Stefano, 62018 Potenza Picena, Italy
3
Department of Electrical and Computer Engineering, Texas Tech University, Lubbock, TX 79409, USA
*
Author to whom correspondence should be addressed.
Appl. Sci. 2022, 12(11), 5486; https://doi.org/10.3390/app12115486
Submission received: 14 April 2022 / Revised: 19 May 2022 / Accepted: 26 May 2022 / Published: 28 May 2022
(This article belongs to the Special Issue Advances in Data Analysis for Wearable Sensors)

Abstract

:
Movement monitoring in patients with Parkinson’s disease (PD) is critical for quantifying disease progression and assessing how a subject responds to medication administration over time. In this work, we propose a continuous monitoring system based on a single wearable sensor placed on the lower back and an algorithm for gait parameters evaluation. In order to preliminarily validate the proposed system, seven PD subjects took part in an experimental protocol in preparation for a larger randomized controlled study. We validated the feasibility of our algorithm in a constrained environment through a laboratory scenario. Successively, it was tested in an unsupervised environment, such as the home scenario, for a total of almost 12 h of daily living activity data. During all phases of the experimental protocol, videos were shot to document the tasks. The obtained results showed a good accuracy of the proposed algorithm. For all PD subjects in the laboratory scenario, the algorithm for step identification reached a percentage error low of 2%, 99.13% of sensitivity and 100% of specificity. In the home scenario the Bland–Altman plot showed a mean difference of −3.29 and −1 between the algorithm and the video recording for walking bout detection and steps identification, respectively.

1. Introduction

Parkinson’s disease (PD) is the second most common progressive neurodegenerative disorder of the central nervous system after Alzheimer’s disease [1]. PD is characterized by deterioration and successive death of the dopaminergic neurons located in the substantia nigra of the basal ganglia in the midbrain [2]. Major PD signs can be divided into motor symptoms and non-motor symptoms. Generally, they appear gradually and with the worsening of the disease and contribute to a significant reduction of the patient’s quality of life. Among the non-motor symptoms there are cognitive impairment, depression, sleep disorders, and other behavioural and psychiatric problems. The most recognisable symptoms of PD related to the motor degeneration are bradykinesia, postural instability, rigidity, and tremor at rest [3].
Although PD is an irreversible disorder, adequate medical treatment can temporarily improve the patient’s quality of life with Parkinson’s Disease. In fact, medications based on Levodopa can give relief to patients by reducing for a period of time the effect of the motor manifestations. In this period, also called the “on” state, the symptoms are well managed by the patient. When the Levodopa starts to lose its effect, motor symptoms deteriorate, and movement becomes more difficult (“off” state) [4]. The alternation throughout the day between “on” and “off” states is known as motor fluctuations. An accurate reporting of PD motor states and symptoms will enable doctors to personalize medication intakes and, therefore, improve the response to treatment. For these purposes, a widespread medical method for a better overview of the patient’s motor symptoms over a long-lasting period consists of a diary self-reported by the patient during his daily life at home.
Motion analysis provides objective information about human locomotion and it is frequently used for treatment planning. Several methods have been successfully utilized to extract objective gait parameters; among them, stereophotogrammetry, dynamometric force platforms, treadmills, and electromyography are frequently adopted. Despite these instruments ensuring the highest performances in terms of accuracy and reliability, they are expensive, uncomfortable for patients, restricted to specialized laboratories and cannot be applied in large populations [5]. Moreover, such equipment cannot be applied in home environments which represent the most appropriate scenario for the monitoring of patient’s activities of daily living (ADL) [6,7].
In [8], the authors showed that conventional measures in a laboratory environment do not reflect the daily-living activities of PD patients. In fact, daily-living measures provide important information that is not captured in a conventional one-time laboratory assessment of gait, balance or the Unified Parkinson’s Disease Rating Scale (MDS-UPDRS). With the advanced growth in technologies, the use of wearable sensors for an objective long-term monitoring of PD patients in the home scenario can play an important role [9,10]. The wearable sensors are better suited to quantify gait in unsupervised and free-living environments, such as in a home scenario, providing a more comprehensive overview of the continuous walking monitoring. Several validation studies in controlled settings exist, but only a few of them have examined the validity of wearable and associated algorithms in uncontrolled environments [11]. Various works have focused on the detection of tremor episodes in constrained and unsupervised environments [12,13,14], on the PD turning analysis in patients suffering from freezing [15] and fall risk [16,17], and on the detection of on/off states [18]. Other works have carried out a walking analysis in laboratory and home scenarios, providing gait quantity (i.e., number of steps and number of walking bouts) or gait quality (i.e., step length (m), step regularity, and the amplitude of dominant frequency) [8,19,20,21,22]. Furthermore, in the literature, walking activity is not always correctly detected during free living [8,20] and therefore it is necessary to develop reliable algorithms able to correctly identify walks and distinguish them from non-walking activities. Conversely, other recent papers have analyzed walking only in clinical environments, obtaining only time domain parameters [23,24,25]. Recent studies propose wearable sensor networks that are able to monitor the level of activity and the motor fluctuations of a PD subject during the day [26,27]. However, the use of a single inertial measurement unit able to provide a complete analysis of quantity and quality gait in time and frequency domains has not yet been studied.
In this work we propose a simple, non-invasive and low-cost system for home monitoring that does not involve changes in the common lives of the subjects, especially of the PD patients. Starting from data acquired by a wearable sensor placed at the lower back, we present an algorithm able to provide a complete gait analysis in terms of both qualitative and quantitative parameters of walking in the time and frequency domains. The goal of this study is to propose an algorithm to objectively assess various gait parameters, investigate treatment effects, and quantify the disease state in PD. With this aim we validated the proposed algorithm and tested it with PD subjects in an unsupervised environment.

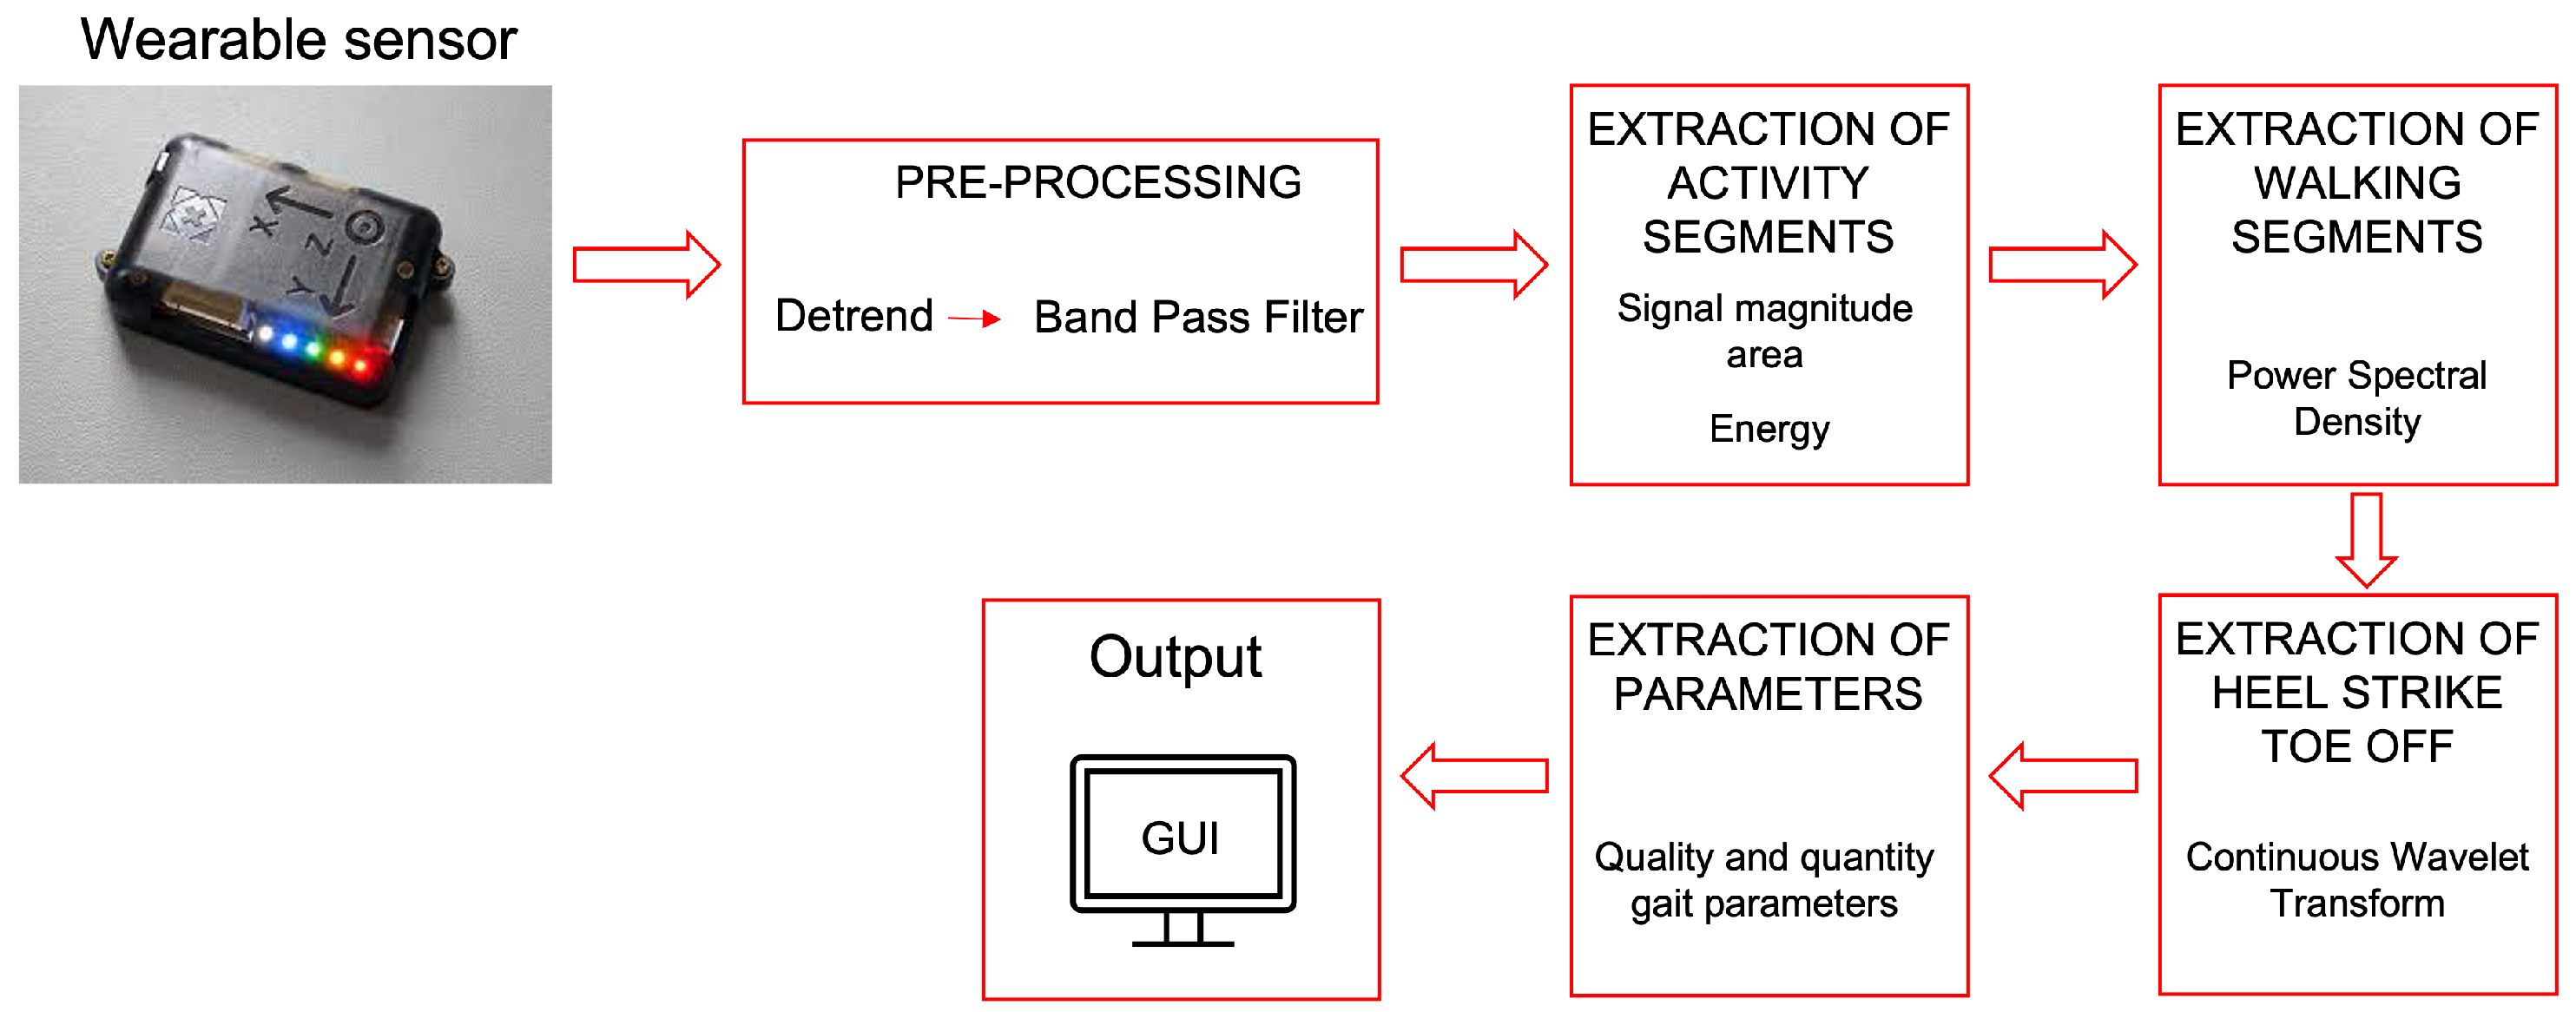
2. Design of the Proposed System

The system proposed in this work consists of an inertial wearable sensor placed on a subject’s lower back and an algorithm specifically developed for the estimation of gait analysis parameters. The inertial wearable sensor used in this study is an NGIMU (Next Generation Inertial Measurement Unit) from X-Io Technologies Limited (Bristol, UK). It is a wireless, small and non-invasive MARG (Magnetic Angular Rate and Gravity) sensor embedding a tri-axial accelerometer, a tri-axial gyroscope, and a tri-axial magnetometer. A velcro band was positioned on the lower back of the subject and the sensor was placed on it, as shown in Figure 1. The NGIMU was positioned following specific orientations: the x-axis of the NGIMU was used as the medial lateral (ML)-axis and pointed laterally, the y-axis as the vertical-axis and pointed upward, and the z-axis as the anterior posterior (AP)-axis and pointed forward. Starting from the data acquired by the inertial wearable sensor, an algorithm for the home assessment of gait parameter was developed for monitoring the PD subjects’ responses to medication administration over time. The block diagram of the proposed algorithm is shown in Figure 2 and each step of it is described in the following.

2.1. Pre-Processing

The raw tri-axial accelerometer data were pre-processed by linear de-trending and by a second-order Butterworth band pass filter [21,28]. The cut-off frequency of the implemented filter was from 0.5 to 5 Hz, which included the variability and consistency of the gait pattern [29].

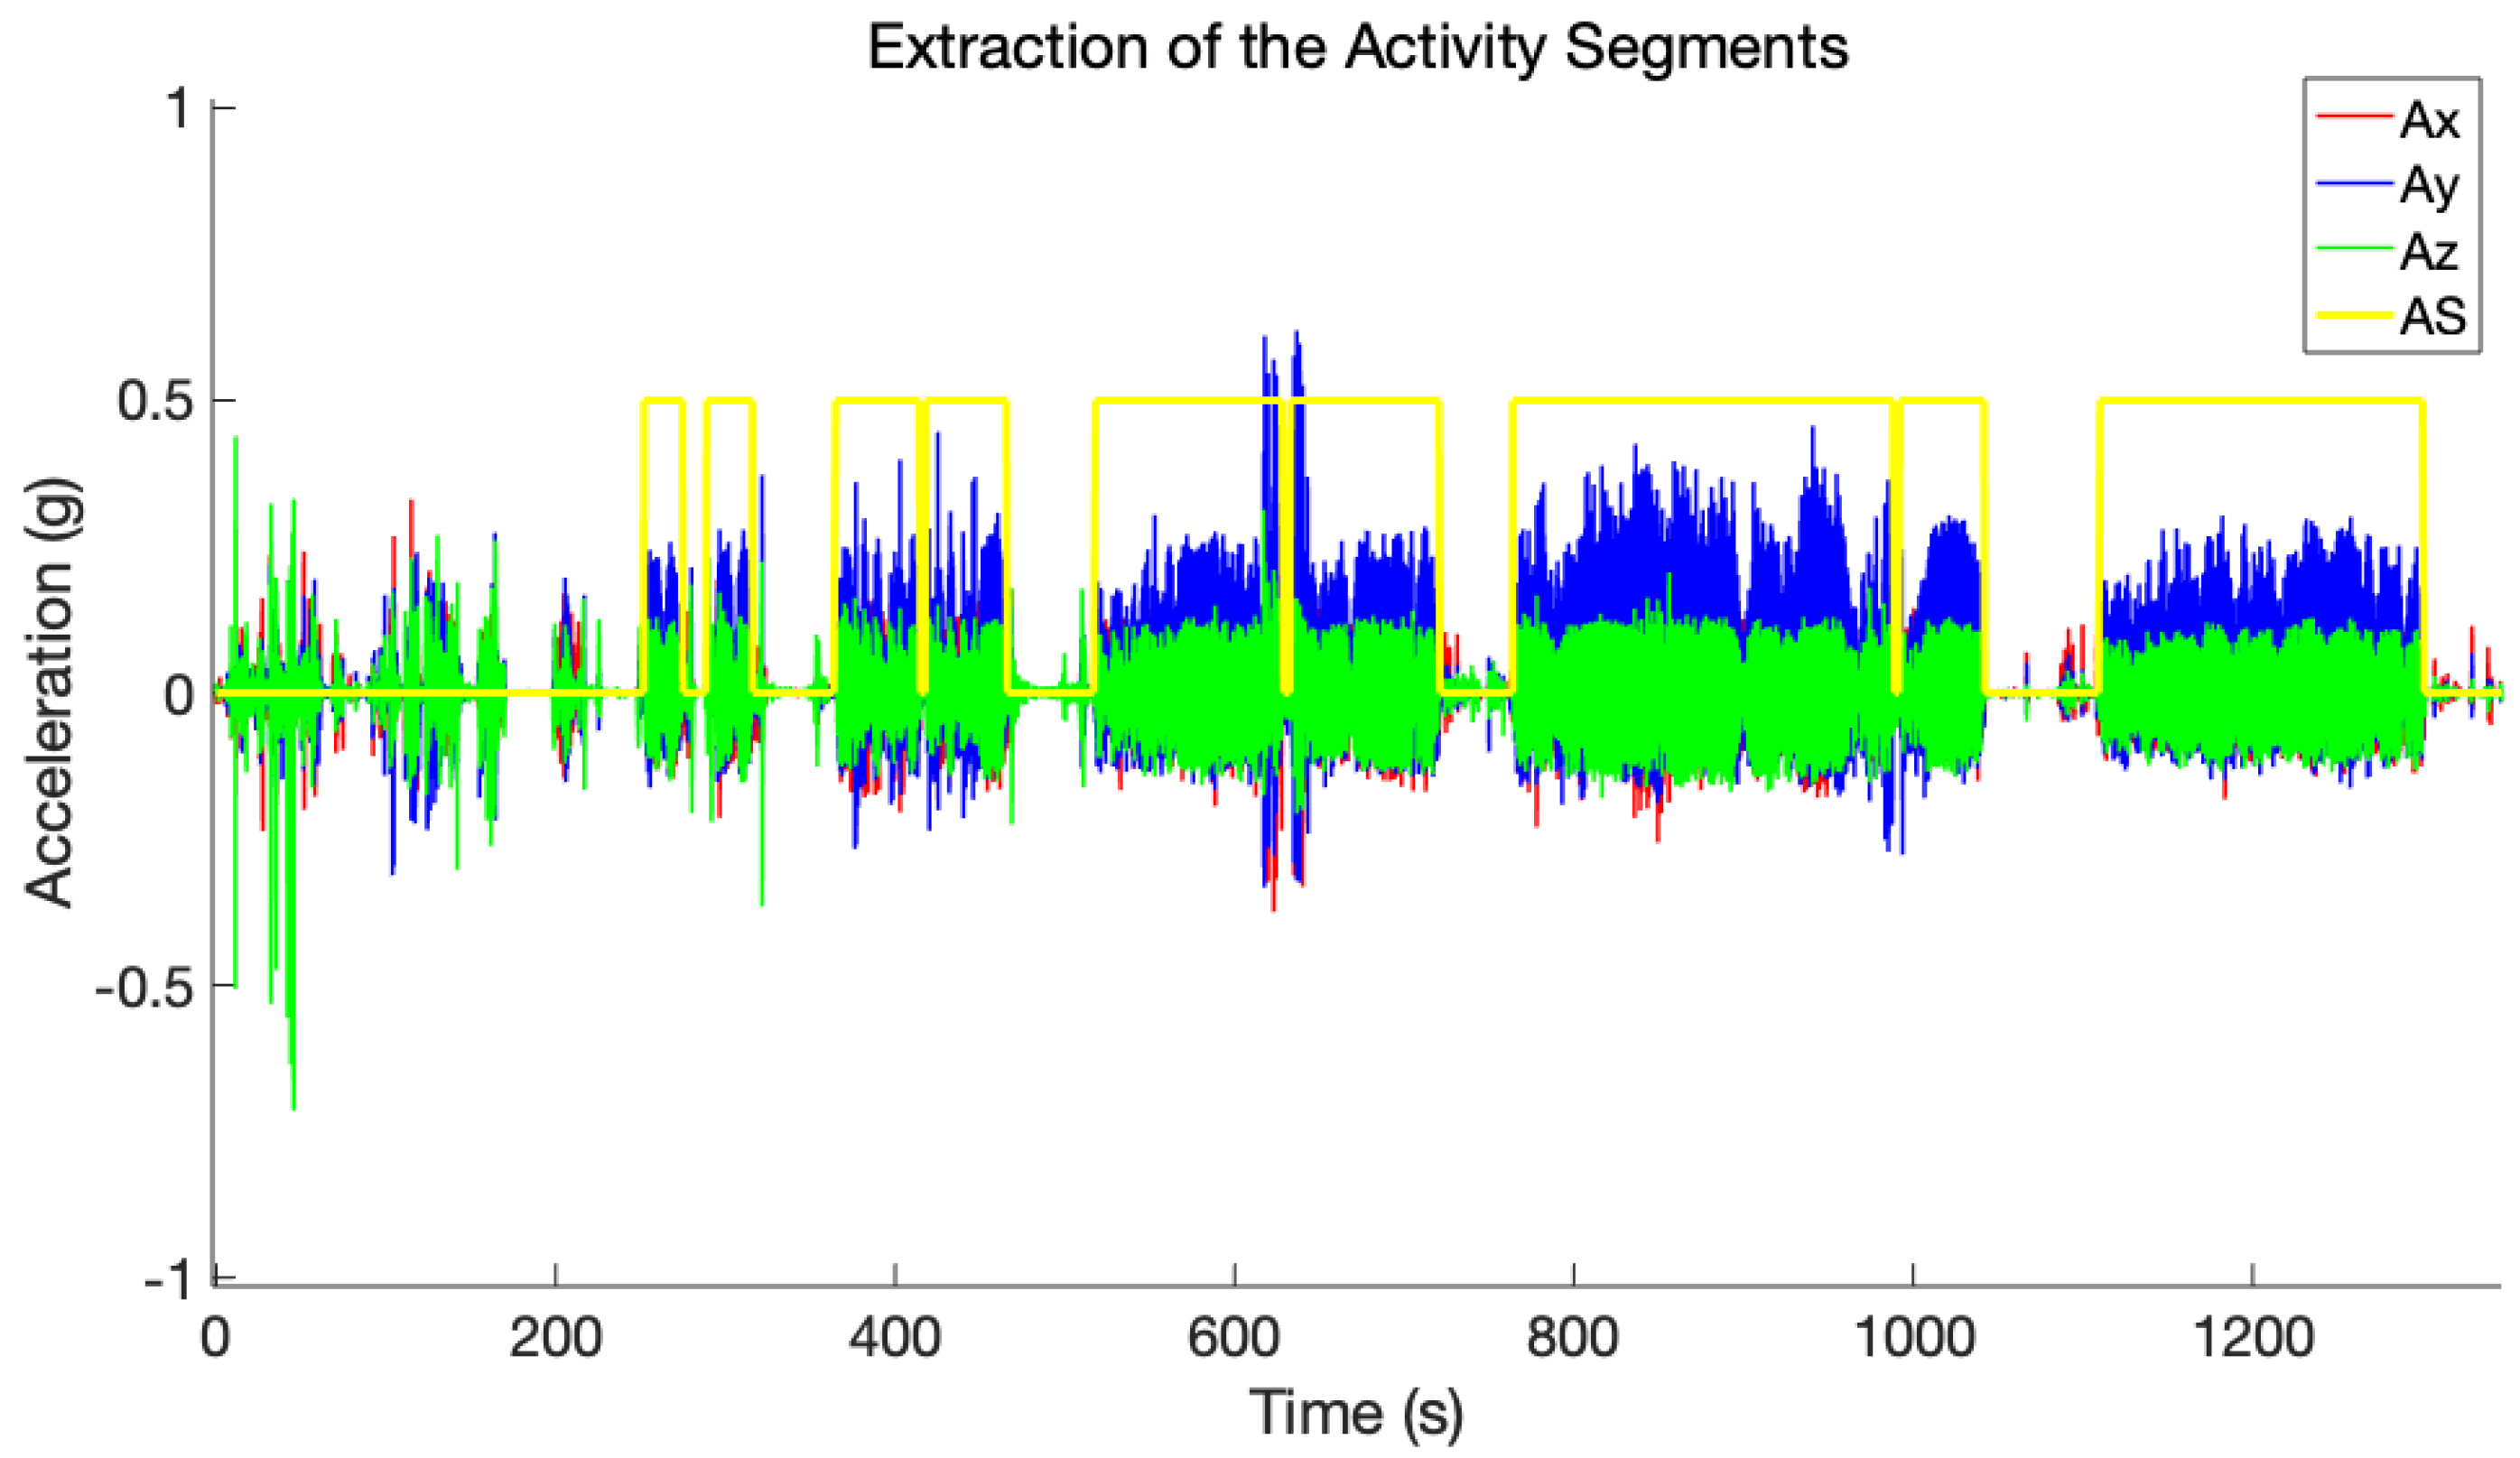
2.2. Extraction of the Activity Segments

The pre-processed signals were filtered to extract the activity segments. An activity is defined as a movement of the wearable device associated with an ADL performed by the subject. In order to identify the activity segments, accelerometer data were segmented using a two-second sliding window with 50% overlap [30]. The sliding window was used to segment time series for activity segments extraction. We selected a window size of two seconds to ensure the capture of an activity and to exclude any type of pause performed by the subject. To distinguish between periods of user activity and rest, a measure that includes the effect of signal variations in all three axes was required. To extract the activity segments, the signal magnitude area (SMA) and the energy (EN) are defined by equations:
S M A = i = 1 N A x ( t ) 2 + A y ( t ) 2 + A z ( t ) 2
E N = i = 1 N | f f t ( A x ( t ) ) | 2 + | f f t ( A y ( t ) ) | 2 + | f f t ( A z ( t ) ) | 2 ,
where i is the current sliding window, N is the total number of sliding windows, A x ( t ) , A y ( t ) , and A z ( t ) denote accelerations along x, y, and z axes in time domain, and fft is the fast Fourier transform. If the SMA and EN values of the current sliding window exceed the 75% of the mean of the SMA and EN, respectively, for at least three consecutive windows, activity is considered to have occurred. Conversely, values below the threshold mean the user is in a resting state. Subsequently, only activity with a duration higher than 10 s was used for further processing. Figure 3 shows the output of this step of the algorithm.

2.3. Extraction of Walking Segments

To better focus on walking segments and so to remove activity windows that did not include walks, the periodicity of the signal was analyzed. Rapid movements of the wearable sensors, sitting and standing up and other kinds of activities were excluded from further process. On the contrary, activities such as walks, walks while turning, walks while ascending or descending stairs were considered.
The activity segments computed in the previous step were divided into consecutive five-seconds windows and were analyzed in the frequency domain. The Power Spectral Density (PSD) derived from anterior posterior acceleration reflects the variability and regularity of the gait pattern. The extraction of walking segments were based on the characteristics of the dominant peak of the main frequency in the PSD of the 0.5 to 3 Hz band [29]. In detail, for each five-seconds sliding window, the local maxima were found. If three or more of these maxima exceeded a threshold set at 75% of the absolute maxima, the window was not considered for the walking extraction. If more than 60% of number of sliding windows, in which the original activity segment was divided, were not recognized as walking bouts, the entire activity segment was discarded. Moreover, the Attitude and Heading Reference System (AHRS) was adopted to provide a unique measure of body segment orientation on which the wearable sensor was positioned [31]. Therefore, the quaternions and the raw data measured by the inertial wearable sensor were used to compute the acceleration rotated providing acceleration components in the Earth’s reference system [32].

2.4. Extraction of Heel Strike and Toe Off

For Heel Strike (HS) and Toe Off (TO) extraction, previous studies have shown the correspondence between the local minima and maxima of the Continuous Wavelet Transform (CWT) with the HS and TO events in healthy adults and PD patients [28,33]. According to such studies, the proposed algorithm is based on the CWT approach [21] for the HS and TO extraction. The anterior posterior acceleration was integrated and differentiated by CWT, using an estimated wavelet scale and Daubechies first-order ( d b 1 ) wavelet. The estimated scale parameter ( a 1 ) was computed as follows:
a 1 = C E N 1 D F T s ,
where C E N 1 is the center frequency of the d b 1 wavelet, D F is the most dominant frequency of the spectrum of the AP acceleration, Ts is the sampling period. The local minima of the differentiated signal are the detected HS events. Subsequently, the first-order differentiated signal is differentiated again by using CWT with estimated wavelet scale and Daubechies second-order ( d b 2 ) wavelet. The estimated scale parameter ( a 2 ) was computed as follows:
a 2 = C E N 2 D F T s ,
where the C E N 2 is the center frequency of the d b 2 wavelet. The local maxima of the latter signal are the detected TO events. Figure 4 shows an example of step detection from a walking segment where HS and TO events are identified.

2.5. Extraction of Parameters

Walking windows detected from the previous step were used for the extraction of gait parameters related to the motion analysis. These parameters were extracted from each walking window and could be divided into two main groups: metrics related to the quantity of walking (show in Table 1) and metrics related to the quality of walking in frequency and time domains (shown in Table 2).
Parameters illustrated in Table 1 were directly considered for the final report on the subject’s state of health. Instead, all frequency and temporal measures shown in Table 2 were computed as weighted means before inserting into the final report on the subject’s state of health. They were extracted from each walking window and then averaged, assigning weights proportional to the duration of the walking bout to which they belong. Therefore, a longer bout is more significant than a shorter one and has a greater influence on the final values of the parameters calculated in that window. At the end of this operation, all metrics were collected in the final report that represents a summary of the subjects’ gait characteristics (in terms of quantity and quality of walking) related to motion analysis for the entire recording. As shown in Figure 5, the final report illustrates all the extracted parameters from the proposed algorithm and a histogram for the visualization of the patient status with respect to his standard status condition.

3. Experimental Protocol

The proposed system was tested in an experimental protocol in order to evaluate its performance. A total of seven volunteers PD subjects (aged over 70 years) took part in the experimental protocol of this study. All the PD subjects gave their informed consent before participating in the experimental protocol. In particular, the tests were carried out in both home and laboratory scenarios, and each subject was recruited for both trials. While the tasks of the laboratory scenario aimed to assess the developed algorithm performance in gait parameters detection, the data acquired over 12 h during tasks of the home scenario were used to test the proposed algorithm in a home environment. In each scenario, the tasks were video recorded through a GoPro to verify the correct functioning of the proposed algorithm. Subjects wore the camera attached to the lower abdomen through the velcro band used for the sensor and it was directed at the participant’s feet. The tasks of the laboratory scenario were performed in the private clinic “Villa dei Pini” (Civitanova Marche, Italy) where, as shown in Figure 6, the subjects were invited to perform three different tasks as follows:
  • Timed Up and Go (TUG) task: subject started from sitting on a chair, then walked straight on for some meters, completed a turn of 180° around an obstacle, moved straight on for some meters again, and finally sat again on the chair. This activity was performed twice;
  • Stair task: subject started from sitting on a chair, then walked straight on for some meters, ascended and descended the stairs four times, walked straight on for some meters again, and finally sat again on the chair;
  • Free walking task: subject walked “freely” inside and outside the clinic for 15 min (so experiencing several straight walks, turns, stair ascending and descending activities, and pauses).
In the task of the home scenario the subjects were asked to switch on the device and to wear it while performing their common ADLs during the day. At the same time, they annotated these activities in a diary which could also include additional information about problems with the device (improper device positioning or switching off due to the battery discharging) and the description of subject’s health status during the day.

Statistical Analysis

In order to evaluate the performance of the proposed algorithm, a statistical analysis of the tasks carried out in laboratory and home scenarios was performed. In the tasks of the laboratory scenario the performance of the proposed algorithm was evaluated in terms of absolute Percentage error, Sensitivity and Specificity. These metrics were computed as follows:
P e r c e n t a g e e r r o r = | N A N V | N V 100
S e n s i t i v i t y = T P T P + F N
S p e c i f i c i t y = T N F P + T N ,
where N A is the value count estimated by the algorithm, N V is the total count number of Step (S) or Bout (B) obtained by the video recording, T P is the True Positives, T N is the True Negatives, F P is the False Positives, and F N is the False Negatives.
Subsequently, we tested the algorithm in the home scenario, during the daily living activity in an unsupervised environment. In this scenario, Bland–Altman plots were adopted to check for nonlinear distributions of error between the video recording and the proposed algorithm. In particular, Bland–Altman plots were used to assess the agreement between the measures obtained from algorithm and the videos, where the difference (D) and the average (M) were computed as [34]:
D = N A N V
M = N A + N V 2 .

4. Results

The evaluation of the proposed system was performed through a comparison in terms of walking bout and step between the results obtained with the developed algorithm and the video recording. Seven PD subjects were involved in the tasks of the experimental protocol both in the laboratory scenario and in the home scenario.
In the laboratory scenario, the algorithm was validated through a comparison with the video recordings in terms of percentage error, sensitivity and specificity. From each walking bout the steps performed during the tasks carried out by the seven PD subjects were extracted. The results obtained by the algorithm were compared with those extracted from the recordings. Table 3 reported the results obtained for a subject during the task of the laboratory scenario. In this case we have individuated nine walking bouts for this PD subject and we compared the number of steps extracted by video with that obtained through the algorithm. For each walking bout we computed the percentage error and the sensitivity and specificity overall.
Taking into account all seven PD subjects, we obtained a high accuracy of the proposed algorithm in terms of sensitivity and specificity, with values of 99.13% and 100%, respectively.
To test and verify the algorithm outside a constrained environment, data on PD subjects were acquired in a domestic context, through continuous monitoring over 12 h. The subjects were equipped with the wearable device placed on their lower back and a GoPro for video recording the daily living activity, for a long-term evaluation of the proposed algorithm. The experimental results of the home scenario are shown in Figure 7. Bland–Altman plots showed agreement between the algorithm and video for bout (Figure 7a) and step (Figure 7b) count values. Figure 7 shows an average ± Limits of Agreement (1.96*SD) of −3.29 ± 14.03 and −1 ± 24.74 for bout and step, respectively. Included in both plots is a point incorrectly identified by the algorithm.

5. Discussion

Real life studies reflect how treatments/medications administered to PD subjects during a clinical visit are effective. In order to provide continuous monitoring of the motor activity of the PD subject during daily life, we propose a system based on a single wearable device and an algorithm specifically developed for the estimation of gait analysis parameters. The existing research is not able to provide a complete analysis of the quantity and quality gait in time and frequency domains through a single inertial measurement unit [20,22]. In fact, Del Din et al. [19] extracts some gait parameters related to the quality of walking only in the time domain. The performance of the proposed system was tested in an experimental protocol composed of tasks both in a laboratory scenario and in a home scenario. In consideration of the results obtained from the laboratory scenario a comparison with video recordings was performed to verify the correct functioning of the algorithm in the extraction of walking windows, in the identification of steps, and in the computation of parameters. Table 3 shows the performance of the algorithm in the identification of steps for each walking bout of a single subject. The percentage error of the algorithm was computed for each walking bout and revealed the good functioning of the algorithm. In fact, the error was 0% in short and simple walking tasks, while it ranged between 1.35% and 1.73% in longer and more complex walking bouts. The error remained low, at 2%, for all walking bouts. The sensitivity and specificity over all subjects was computed. We obtained a high sensitivity (99.13%), a small number of false negatives (93 steps out of 10,675 steps), and a high specificity (100%) with zero false positives. The proposed algorithm generated mistakes for a subject that could not walk autonomously (needed crutches support). In fact, a number of false negatives were obtained for the subject that required a medical walker so the algorithm’s performance was lower. Although a small sample size group was examined, it was inclusive of 12 h of data acquisition during a task in a home scenario. As shown in Figure 7, the results of the laboratory scenario were also confirmed in the home scenario. The visual examination of the agreement using the Bland–Altman plots showed no systematic error in the measures. The distribution of the errors indicates that there are no systematic differences between the values obtained using the proposed algorithm and the video recordings, and the difference is within the 95% confidence interval.

6. Conclusions

The aim of this study is to propose a system for monitoring PD subjects during daily life, in order to evaluate how responses to medication change over time and to allow doctors to optimize medical therapy for each patient, improving his/her quality of life. This work presents a system composed of a single wearable sensor placed on the lower back and an algorithm for real-time gait parameters monitoring in PD subjects. In order to evaluate the performance of the proposed system, the developed algorithm was tested in an experimental protocol in which PD subjects performed tasks in constrained and unconstrained environments. In the laboratory scenario, several tasks in a constrained environment were carried out by seven PD subjects and a comparison between the steps detected by the algorithm and steps detected by video recording was performed. Considering every walking bout performed by each subject, we obtained a percentage error low of 2% and high accuracy in terms of sensitivity and specificity, 99.13% and 100%, respectively. Moreover, the proposed algorithm was tested in an unsupervised environment such as the home scenario where the same seven PD subjects have carried out their common ADLs during the day. In the home scenario, the results revealed high reliability, usability and accordance with the video recordings and diaries. In fact, the algorithm successfully detected walking bouts and their respective step counts during daily life. These results confirm the accuracy in the use of a single wearable sensor placed on the lower back, and the accuracy of the proposed algorithm for free-living gait analysis. In fact, the algorithm presented in this work has achieved good results for successfully detecting the walking bouts and the steps both in constrained and unsupervised environments. Although a small group was examined in the experimental protocol, the preliminary results obtained in this work allow us to verify the reliability of the parameters extracted from the proposed algorithm. The analysis of these extracted parameters as a function of time allows us to evaluate how the subject responds to the medication administered by the doctor and to detect the on/off states. Therefore, this work is the beginning of a wide study to develop a processing algorithm for the creation of a clinical and home tool for ADL monitoring in PD subjects but is essential before proceeding with the identification of the subject’s on/off states. In fact, future work will focus on tracking how motor symptoms and their responses to medication change over time for on/off states identification.

Author Contributions

Conceptualization, P.P., L.P., A.B. and S.R.; methodology, P.P. and A.B.; software, L.P. and S.R.; validation, P.P., L.P., A.B., O.B. and S.R.; formal analysis, A.B. and L.P.; investigation, P.P. and L.P.; data curation, S.R., L.P. and M.P.; writing—original draft preparation, S.R.; writing—review and editing, S.R., A.B., M.P. and O.B.; visualization, A.B., O.B. and L.P.; supervision, P.P., M.P., O.B. and L.P.; project administration, P.P. and L.P.; funding acquisition, P.P. All authors have read and agreed to the published version of the manuscript.

Funding

This research received no external funding.

Institutional Review Board Statement

Ethics review and approval were waived for this study because the retrospective analysis of the recorded data was conducted using completely anonymous data. The experimental study did not involve any invasive or medical procedures and introduced no lifestyle changes. All subjects gave their informed consent prior to the collection and acquisition of the data, which was carried out in compliance with the ethical principles of the Helsinki Declaration.

Informed Consent Statement

Informed consent was obtained from all subjects involved in the study.

Data Availability Statement

The data presented in this study are available from the corresponding author upon reasonable request.

Acknowledgments

This work is supported by Marche Region in implementation of the financial programme POR MARCHE FESR 2014–2020, project “Miracle” (Marche Innovation and Research fAcilities for Connected and sustainable Living Environments), CUP B28I19000330007.

Conflicts of Interest

The authors declare no conflict of interest.

References

  1. Botros, A.; Schütz, N.; Camenzind, M.; Urwyler, P.; Bolliger, D.; Vanbellingen, T.; Kistler, R.; Bohlhalter, S.; Müri, R.M.; Mosimann, U.P.; et al. Long-term home-monitoring sensor technology in patients with Parkinson’s disease—Acceptance and adherence. Sensors 2019, 19, 5169. [Google Scholar] [CrossRef] [PubMed] [Green Version]
  2. Schapira, A.H. Science, medicine, and the future-Parkinson’s disease. Br. Med. J. 1999, 318, 311–314. [Google Scholar] [CrossRef] [PubMed]
  3. Van Uem, J.M.; Marinus, J.; Canning, C.; van Lummel, R.; Dodel, R.; Liepelt-Scarfone, I.; Berg, D.; Morris, M.E.; Maetzler, W. Health-related quality of life in patients with Parkinson’s disease—A systematic review based on the ICF model. Neurosci. Biobehav. Rev. 2016, 61, 26–34. [Google Scholar] [CrossRef] [PubMed]
  4. Pardoel, S.; Kofman, J.; Nantel, J.; Lemaire, E.D. Wearable-sensor-based detection and prediction of freezing of gait in Parkinson’s disease: A review. Sensors 2019, 19, 5141. [Google Scholar] [CrossRef] [Green Version]
  5. Mancini, M.; Bloem, B.R.; Horak, F.B.; Lewis, S.J.; Nieuwboer, A.; Nonnekes, J. Clinical and methodological challenges for assessing freezing of gait: Future perspectives. Mov. Disord. 2019, 34, 783–790. [Google Scholar] [CrossRef]
  6. Spinsante, S.; Gambi, E. Remote health monitoring for elderly through interactive television. Biomed. Eng. Online 2012, 11, 54. [Google Scholar] [CrossRef] [Green Version]
  7. Zanela, A.; Schirinzi, T.; Mercuri, N.B.; Stefani, A.; Romagnoli, C.; Annino, G.; Bonaiuto, V.; Cerroni, R. Using a Video Device and a Deep Learning-Based Pose Estimator to Assess Gait Impairment in Neurodegenerative Related Disorders: A Pilot Study. Appl. Sci. 2022, 12, 4642. [Google Scholar] [CrossRef]
  8. Galperin, I.; Hillel, I.; Del Din, S.; Bekkers, E.M.; Nieuwboer, A.; Abbruzzese, G.; Avanzino, L.; Nieuwhof, F.; Bloem, B.R.; Rochester, L.; et al. Associations between daily-living physical activity and laboratory-based assessments of motor severity in patients with falls and Parkinson’s disease. Park. Relat. Disord. 2019, 62, 85–90. [Google Scholar] [CrossRef]
  9. Channa, A.; Popescu, N.; Ciobanu, V. Wearable solutions for patients with parkinson’s disease and neurocognitive disorder: A systematic review. Sensors 2020, 20, 2713. [Google Scholar] [CrossRef]
  10. Albán-Cadena, A.C.; Villalba-Meneses, F.; Pila-Varela, K.O.; Moreno-Calvo, A.; Villalba-Meneses, C.P.; Almeida-Galárraga, D.A. Wearable sensors in the diagnosis and study of Parkinson’s disease symptoms: A systematic review. J. Med. Eng. Technol. 2021, 45, 532–545. [Google Scholar] [CrossRef]
  11. Sica, M.; Tedesco, S.; Crowe, C.; Kenny, L.; Moore, K.; Timmons, S.; Barton, J.; O’Flynn, B.; Komaris, D.S. Continuous home monitoring of Parkinson’s disease using inertial sensors: A systematic review. PLoS ONE 2021, 16, e0246528. [Google Scholar] [CrossRef] [PubMed]
  12. Battista, L.; Romaniello, A. A novel device for continuous monitoring of tremor and other motor symptoms. Neurol. Sci. 2018, 39, 1333–1343. [Google Scholar] [CrossRef] [PubMed]
  13. Heijmans, M.; Habets, J.; Kuijf, M.; Kubben, P.; Herff, C. Evaluation of Parkinson’s disease at home: Predicting tremor from wearable sensors. In Proceedings of the 2019 41st Annual International Conference of the IEEE Engineering in Medicine and Biology Society (EMBC), Berlin, Germany, 23–27 July 2019; pp. 584–587. [Google Scholar]
  14. McNames, J.; Shah, V.V.; Mancini, M.; Curtze, C.; El-Gohary, M.; Aboy, M.; Carlson-Kuhta, P.; Nutt, J.G.; Horak, F. A two-stage tremor detection algorithm for wearable inertial sensors during normal daily activities. In Proceedings of the 2019 41st Annual International Conference of the IEEE Engineering in Medicine and Biology Society (EMBC), Berlin, Germany, 23–27 July 2019; pp. 2535–2538. [Google Scholar]
  15. Mancini, M.; Weiss, A.; Herman, T.; Hausdorff, J.M. Turn around freezing: Community-living turning behavior in people with Parkinson’s disease. Front. Neurol. 2018, 9, 18. [Google Scholar] [CrossRef] [PubMed] [Green Version]
  16. Del Din, S.; Galna, B.; Godfrey, A.; Bekkers, E.M.; Pelosin, E.; Nieuwhof, F.; Mirelman, A.; Hausdorff, J.M.; Rochester, L. Analysis of free-living gait in older adults with and without Parkinson’s disease and with and without a history of falls: Identifying generic and disease-specific characteristics. J. Gerontol. Ser. A 2019, 74, 500–506. [Google Scholar] [CrossRef]
  17. Greene, B.R.; Premoli, I.; McManus, K.; McGrath, D.; Caulfield, B. Predicting Fall Counts Using Wearable Sensors: A Novel Digital Biomarker for Parkinson’s Disease. Sensors 2021, 22, 54. [Google Scholar] [CrossRef] [PubMed]
  18. Rodríguez-Molinero, A.; Pérez-López, C.; Samà, A.; de Mingo, E.; Rodríguez-Martín, D.; Hernández-Vara, J.; Bayés, À.; Moral, A.; Álvarez, R.; Pérez-Martínez, D.A.; et al. A kinematic sensor and algorithm to detect motor fluctuations in Parkinson disease: Validation study under real conditions of use. JMIR Rehabil. Assist. Technol. 2018, 5, e8335. [Google Scholar] [CrossRef]
  19. Del Din, S.; Godfrey, A.; Galna, B.; Lord, S.; Rochester, L. Free-living gait characteristics in ageing and Parkinson’s disease: Impact of environment and ambulatory bout length. J. Neuroeng. Rehabil. 2016, 13, 1–12. [Google Scholar] [CrossRef] [Green Version]
  20. Hickey, A.; Del Din, S.; Rochester, L.; Godfrey, A. Detecting free-living steps and walking bouts: Validating an algorithm for macro gait analysis. Physiol. Meas. 2016, 38, N1. [Google Scholar] [CrossRef]
  21. Pham, M.H.; Elshehabi, M.; Haertner, L.; Del Din, S.; Srulijes, K.; Heger, T.; Synofzik, M.; Hobert, M.A.; Faber, G.S.; Hansen, C.; et al. Validation of a step detection algorithm during straight walking and turning in patients with Parkinson’s disease and older adults using an inertial measurement unit at the lower back. Front. Neurol. 2017, 8, 457. [Google Scholar] [CrossRef] [Green Version]
  22. Peraza, L.R.; Kinnunen, K.M.; McNaney, R.; Craddock, I.J.; Whone, A.L.; Morgan, C.; Joules, R.; Wolz, R. An Automatic Gait Analysis Pipeline for Wearable Sensors: A Pilot Study in Parkinson’s Disease. Sensors 2021, 21, 8286. [Google Scholar] [CrossRef]
  23. Muthukrishnan, N.; Abbas, J.J.; Krishnamurthi, N. A wearable sensor system to measure step-based gait parameters for parkinson’s disease rehabilitation. Sensors 2020, 20, 6417. [Google Scholar] [CrossRef] [PubMed]
  24. Fischer, S.; Ullrich, M.; Küderle, A.; Gaßner, H.; Klucken, J.; Eskofier, B.M.; Kluge, F. Automatic clinical gait test detection from inertial sensor data. In Proceedings of the 2020 42nd Annual International Conference of the IEEE Engineering in Medicine & Biology Society (EMBC), Montreal, QC, Canada, 20–24 July 2020; pp. 789–792. [Google Scholar]
  25. Keloth, S.M.; Arjunan, S.P.; Kumar, D.K. Variance of the gait parameters and fraction of double-support interval for determining the severity of Parkinson’s disease. Appl. Sci. 2020, 10, 577. [Google Scholar] [CrossRef] [Green Version]
  26. Adams, J.L.; Dinesh, K.; Snyder, C.W.; Xiong, M.; Tarolli, C.G.; Sharma, S.; Dorsey, E.; Sharma, G. A real-world study of wearable sensors in Parkinson’s disease. NPJ Parkinson’s Dis. 2021, 7, 1–8. [Google Scholar] [CrossRef] [PubMed]
  27. Bendig, J.; Wolf, A.S.; Mark, T.; Frank, A.; Mathiebe, J.; Scheibe, M.; Müller, G.; Stahr, M.; Schmitt, J.; Reichmann, H.; et al. Feasibility of a Multimodal Telemedical Intervention for Patients with Parkinson’s Disease—A Pilot Study. J. Clin. Med. 2022, 11, 1074. [Google Scholar] [CrossRef] [PubMed]
  28. Del Din, S.; Godfrey, A.; Rochester, L. Validation of an accelerometer to quantify a comprehensive battery of gait characteristics in healthy older adults and Parkinson’s disease: Toward clinical and at home use. IEEE J. Biomed. Health Inform. 2015, 20, 838–847. [Google Scholar] [CrossRef]
  29. Weiss, A.; Brozgol, M.; Dorfman, M.; Herman, T.; Shema, S.; Giladi, N.; Hausdorff, J.M. Does the evaluation of gait quality during daily life provide insight into fall risk? A novel approach using 3-day accelerometer recordings. Neurorehabilit. Neural Repair 2013, 27, 742–752. [Google Scholar] [CrossRef]
  30. Banos, O.; Galvez, J.M.; Damas, M.; Pomares, H.; Rojas, I. Window size impact in human activity recognition. Sensors 2014, 14, 6474–6499. [Google Scholar] [CrossRef] [Green Version]
  31. Madgwick, S.O.; Harrison, A.J.; Vaidyanathan, R. Estimation of IMU and MARG orientation using a gradient descent algorithm. In Proceedings of the 2011 IEEE International Conference on Rehabilitation Robotics, Zurich, Switzerland, 29 June–1 July 2011; pp. 1–7. [Google Scholar]
  32. Pierleoni, P.; Belli, A.; Maurizi, L.; Palma, L.; Pernini, L.; Paniccia, M.; Valenti, S. A wearable fall detector for elderly people based on AHRS and barometric sensor. IEEE Sens. J. 2016, 16, 6733–6744. [Google Scholar] [CrossRef]
  33. McCamley, J.; Donati, M.; Grimpampi, E.; Mazza, C. An enhanced estimate of initial contact and final contact instants of time using lower trunk inertial sensor data. Gait Posture 2012, 36, 316–318. [Google Scholar] [CrossRef]
  34. Doğan, N.Ö. Bland–Altman analysis: A paradigm to understand correlation and agreement. Turk. J. Emerg. Med. 2018, 18, 139–141. [Google Scholar] [CrossRef]
Figure 1. The used inertial wearable sensor and its position on the subject’s lower back.
Applsci 12 05486 g001
Figure 2. Block diagram of the proposed algorithm.
Applsci 12 05486 g002
Figure 3. The superposition of the x–axis (red), y–axis (blue), and z–axis (green) components of acceleration and the extracted activity segments (yellow) as a function of time.
Applsci 12 05486 g003
Figure 4. Temporal representation of first–order (CWT1, in red) and second–order (CWT2, in blue) Continuous Wavelet Transform from AP acceleration. The first local minima indicate the HS events (red circles), the second local maxima indicate the TO events (blue circles).
Applsci 12 05486 g004
Figure 5. Graphical User Interface of the final report on the PD subject’s health state, where the extracted parameters (in the bottom) and the histograms of the patient status (on the right) are illustrated.
Applsci 12 05486 g005
Figure 6. Laboratory trial: (a) Timed Up and Go (TUG) task; (b) Stair task; (c) Free walking task.
Applsci 12 05486 g006
Figure 7. Bland–Altman plots for: (a) bout count; (b) step count. The difference (D) between the algorithm and the video recording as the y–value, and the mean (M) between the two measurements as the x–value. While solid line in each plot represents the mean count difference between the algorithm and video, dashed lines represent 95% limits of agreement.
Applsci 12 05486 g007
Table 1. Gait parameters related to the quantity of walking.
ParameterUnitAxis
Total number of walksnAP
Total walking duration%AP
Total number of stepsnAP
Median walking bout durationsAP
Median number of steps for boutsnAP
Cadencesteps/minuteAP
Table 2. Gait parameters related to the quality of walking, in frequency and time domains.
ParametersUnitsAxes
Frequency measuresDominant frequencyHzV, AP, ML
Amplitude of dominant frequencyPSDV, AP, ML
Width of dominant frequencyHzV, AP, ML
Slope of dominant frequencyPSD/HzV, AP, ML
Harmonic ratio#V, AP, ML
Temporal measuresStep timesAP
Stride timesAP
Stance timesAP
Swing timesAP
Double support timesAP
Single support timesAP
Step time variabilitysAP
Stride time variabilitysAP
Stance time variabilitysAP
Double support time variabilitysAP
Step regularity#V, AP, ML
Stride regularity#V, AP, ML
Step time asymmetrysV, AP, ML
Stride time asymmetrysV, AP, ML
Double support time asymmetrysV, AP, ML
Table 3. Validation values for steps detection in each walking bout performed by a single subjects during the laboratory trial.
WalkingDuration of Walking [s]Number of Steps from Video RecordingNumber of Steps Extracted from the AlgorithmAlgorithm’s Percentage Error [%]Sensitivity [%]Specificity [%]
121.593737098.60100
210.7819190
321.5039390
423.6940400
581.661481461.35
675.161321300.52
7193.103463401.73
839.9668671.47
9185.463103051.61
Publisher’s Note: MDPI stays neutral with regard to jurisdictional claims in published maps and institutional affiliations.

