Abstract
Coronary artery calcification and sarcopenia may have a relevant prognostic impact in oncological and non-oncological patients. The use of freeware software is promising for quantitative evaluation of these parameters after whole-body positron emission tomography (PET)/computed tomography (CT) and might be useful for one-stop shop risk stratification without additional radiation ionizing burden and further charges to health care costs. In this study, we compared two semiautomatic freeware software tools (Horos Medical Image software and LIFEx) for the assessment of coronary artery calcium (CAC) score and muscle mass in 40 patients undergoing whole-body PET/CT. The muscle areas obtained by the two software programs were comparable, showing high correlation with Lin’s concordance coefficient (0.9997; 95% confidence intervals: 0.9995–0.9999) and very good agreement with Bland–Altman analysis (mean difference = 0.41 cm2, lower limit = −1.06 cm2, upper limit = 1.89) was also found. For CAC score, Lin’s concordance correlation coefficient was 0.9976 (95% confidence intervals: 0.9965–0.9984) and in a Bland–Altman analysis an increasing mean difference from 8 to 78 by the mean values (intercept = −0.050; slope = 0.054; p < 0.001) was observed, with a slight overestimation of Horos CAC score as compared to LIFEx, likely due to a different calculation method of the CAC score, with the ROI being equal for the two software programs. Our results demonstrated that off-line analysis performed with freeware software may allow a comprehensive evaluation of the oncological patient, making available the evaluation of parameters, such as muscle mass and calcium score, that may be relevant for the staging and prognostic stratification of these patients, beside standard data obtained by PET/CT imaging. For this purpose, the Horos and LIFEx software seem to be interchangeable.
1. Introduction
Oncological patients may require a number of computed tomography (CT) scans based on stand-alone techniques or in combination with integrated positron emission tomography (PET)/CT for diagnosis, staging and disease monitoring. Thus, there is an increasing interest in obtaining as much data as possible from each diagnostic procedure. Moreover, for patients with high probability of long-term survival, it is very important to assess cardiovascular risk, as oncological patients, in particular those undergoing radiotherapy and/or chemotherapy, are at high risk of cardiovascular events [1]. In the past, this risk was less evident because of the too short life expectancy of patients with already advanced disease at diagnosis [1]. However, with spread of early diagnosis and more efficient therapies, cardiotoxicity of cancer therapy and cardiac comorbidity are pivotal issues. Coronary artery calcification (CAC) and muscle mass evaluation have shown diagnostic and prognostic power in this context [2,3,4,5,6,7,8,9,10,11,12,13,14,15,16,17,18,19,20,21].
Coronary artery calcification (CAC) has emerged as a predictive single cardiovascular risk marker in asymptomatic persons, adding cost effectiveness information beyond traditional cardiovascular risk factors. Therefore, CAC testing represents a reasonable option to risk-stratify cardiovascular impairment without increased costs [2,3,4,5,6,7]. Because cardiovascular disease and cancer are leading causes of death, the evaluation for both with one procedure may improve the standard assessment of patients with malignancy without any additional exposure and cost.
It has been also demonstrated that patients with advanced cancer and sarcopenia, defined by severe lowering of skeletal muscle mass, are more prone to experiencing adverse oncologic, surgical, and overall survival outcomes [8,9,10,11,12,13,14,15,16,17,18,19,20,21]. Hence, quantifying abdominal muscle mass in clinical practice is important in predicting clinical outcome, as enlightened by multiple studies [22,23,24,25,26,27,28]. Sarcopenia has a role in cancer as well as in non-malignant conditions. Several imaging modalities, including dual-energy X-ray absorptiometry, CT, magnetic resonance, and ultrasound, can be used to evaluate muscle mass and quality, providing data that may help in reaching the diagnosis of sarcopenia [29]. Muscle mass can be measured on unenhanced CT scan drawing regions of interest (ROIs) and using standardized Hounsfield unit (HU) thresholds (−29/+150) to obtain the cross-sectional area of the muscle [30].
Two semiautomatic free independent software programs, Horos (Horos Medical Image software, version 3.3; https://horosproject.org; Horos Project, accessed on 26 January 2022) and LIFEx (www.lifexsoft.org, accessed on 27 January 2022), can be applied to an image set generated from any scanner to measure both CAC score and muscle mass, obtaining from a single examination different parameters in addition to those regarding the main indication. Horos is based upon OsiriXTM and other open source medical imaging libraries and is made available under the GNU Lesser General Public License, Version 3 (LGPL-3.0) [31,32]. LIFEx is a freeware for radiomic feature calculation in multimodality imaging used to characterize tumor heterogeneity [30]. LIFEx is usable on operative systems Linux, Windows, and MacOS and is applied for its native use in texture analysis [33,34,35,36], while Horos may be used in a generalized way. While this software may contribute to refining and personalizing treatment strategies, the agreement of CAC and muscle mass measurement performed via these two methods has not been previously evaluated. In this study, we compared these two approaches for the assessment of CAC score and muscle mass in patients undergoing whole-body PET/CT.
2. Materials and Methods
2.1. Patient Population
The study population included 40 patients without known coronary artery disease (CAD) randomly selected from those who underwent, from January 2019 to December 2021, unenhanced free breathing CT scans as part of whole-body co-registered PET/CT with 2-deoxy-2-[fluorine-18] fluoro-D-glucose (18F-FDG) or [fluorine-18] fluoromethylcholine (18F-FCH) PET/CT scans for oncological or non-oncological indications. Co-registered whole-body CT images were retrieved and reviewed for CAC score and muscle mass evaluation. Patients with mediastinal masses (bulky disease, myocardial masses, or thyme malignancy) or history of cardiac valve surgery were excluded due to potential artifacts.
2.2. PET/CT
All patients fasted for at least 6 h prior to 18F-FDG PET/CT imaging, and blood glucose levels were <180 mg/dL at the time of tracer injection. Both 18F-FDG and 18F-FCH PET/CT unenhanced scans were acquired using a PET/CT Ingenuity TF (Philips Healthcare, Best, The Netherlands) 60 min after tracer administration (activity range 200–300 MBq, according to body weight) [37,38]. All scans were performed in three-dimensional mode. An emission scan was performed in the caudocranial direction, from the upper thigh to the base of the skull (4 min for each bed position). Iterative image reconstruction was completed with an ordered subset expectation maximization algorithm (2 iterations, 28 subsets). A T 4-slice multi-detector helical CT scanner was used (detector row configuration, 4 × 5 mm; pitch, 1.5; gantry rotation speed, 0.8 s per revolution; table speed, 30 mm per gantry rotation; 140 kV and 80 mA). Attenuation-corrected emission data were obtained using filtered back projection CT reconstructed images (Gaussian filter with 8-mm full width at half maximum) to match the PET resolution. Transaxial, sagittal, and coronal images and co-registered images were examined using Philips IntelliSpace Portal, Image and information management softaware version 9.0 (Phillips Medical Systems, Veenpluis, Best, The Netheralands). Unenhanced co-registered CT images were retrieved and evaluated with a dedicated workstation for post-processing and analysis (Horos Free/Open source DICOM Viewer for Mac OSX, LifeX Free/Open source DICOM Viewer for Microsoft Windows). Experienced nuclear medicine physicians and radiologists in consensus analyzed the CT studies, blinded to the PET results.
2.3. CAC Score
Calcium was defined as the presence of at least 3 contiguous pixels with a density >130 HU. The total calcium burden in the coronary arteries was quantified based on the scoring algorithm proposed by Agatston et al. [39]. According to the Agatston method, this calculation is based on the weighted density score given to the highest attenuation value HU multiplied by the area (expressed in mm2) of the calcification speck. The density factor is equal to 1 for attenuation values in the range 130–199 HU; its value is 2 in the interval 200–299 HU; for values between 300 and 399 HU, the density factor is 3; and its value is 4 when attenuation is ≥400 HU. CAC scores were calculated separately for left anterior descending, left circumflex, and right coronary arteries, and summed to provide a total CAC score using each open-source software program. Afterwards, predefined calcium score categories (0 or low risk, 1–300 or moderate risk, and >300 or high risk) were also used to group patients according to findings obtained by both software evaluations [36,37]. Coronary vascular age (CVA) was also estimated by equating estimated CAD risk for chronological age and CAC using the formula 39.1 + 7.25 × 9 ln (CAC + 1) [40].
2.4. Muscle Mass Evaluation
The cross-sectional area of all skeletal muscles, including the psoas, paraspinal muscles (erector spinae and quadratus lumborum), and abdominal wall muscles (transversus abdominis, external and internal obliques, and rectus abdominis), was calculated on a single axial image at the level of the third lumbar vertebra, using the open-source Horos (version 3.3.6) and LIFEx (version v7.1.0) software. [41,42,43,44,45]. Once muscle borders were manually traced, a range of attenuation was then set to include tissue between −29 and +150 HU.
2.5. LIFEx
LIFEx is a freeware enabling calculation of a broad range of conventional, textural, and shape indices from PET, magnetic resonance (MR), ultrasound (US), and CT images. To determine the muscle area, we manually drew an ROI by the Pencil2D procedure on the selected slice and obtained an area with gray tones in the range from −29 HU to +150 HU by the threshold procedure. Instead, to determine the CAC score we selected several ROIs to cover the coronary areas on all slides containing them, using the same procedures adopted for the muscle area, and with gray tones greater than or equal to +130 HU. Once the ROIs with gray tone values in the range considered were obtained from the software, we applied the calcium quantitation procedure to calculate the CAC score. For this study, we used LIFEx version 7.1.0. The procedure pipeline is illustrated in Figure 1.
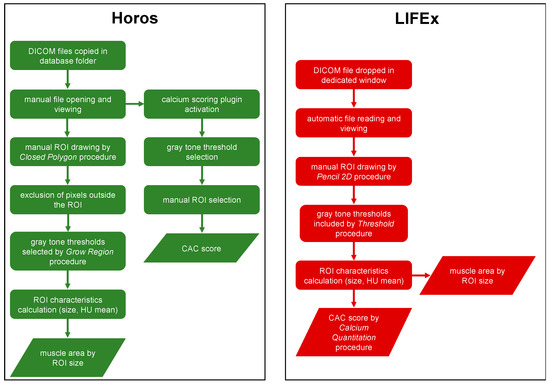
Figure 1.
Horos and LIFEx pipelines.
2.6. Horos
Horos is a free, open-source medical image viewer (free and open-source code software (FOSS) program. It is based upon OsiriXTM and other open-source medical imaging libraries and is made available under the Lesser General Public License, Version 3 (LGPL-3.0), at Horosproject.org and sponsored by Nimble Co LLC d/b/a (Purview in Annapolis, MD, USA). To calculate the muscle area, firstly we manually drew an ROI with the closed polygon procedure on the selected slice. After excluding pixels outside the ROI, we obtained an area with gray tones in the range from −29 HU to +150 HU by the grow region (2D segmentation) procedure. In addition, to calculate the CAC score, dedicated calcium scoring plugin (version 2.0) was used. After selecting the gray tone threshold, calcified areas within coronary vessels were manually selected. In accordance with the Agatston method, as previously described, the CAC score was obtained. The procedure pipeline is illustrated in Figure 1.
2.7. Statistical Analysis
Continuous variables were expressed as mean ± standard deviation or median and range, as appropriate. Categorical data were reported as percentages. Normality of the data distributions was verified with the Shapiro–Wilk test. Statistical difference between data distributions obtained by Horos and LIFEx software was evaluated using Wilcoxon matched-pairs signed-rank test. To assess the agreement between the measurements obtained by the two software programs, for muscle area we used the classical Bland–Altman analysis, supplemented by Carkeet’s exact 95% confidence interval (CI) for the limits of agreement [46] and 95% CI for the bias was reported. In addition, for CAC score, due to a trend in the linear relationship between average values and differences using the two software programs, we used the regression method proposed by Bland and Altman [47]. Correlations between measurements obtained from the two software programs were evaluated by the concordance correlation coefficient, introduced by Lin to measure the agreement between methods when the response is continuous. Ninety-five percent confidence intervals (95% CIs) were supplemented, while two-sided p values < 0.05 were considered statistically. Statistical analysis was performed using the R software, version 3.6.3 (The R Foundation for Statistical Software, Vienna, Austria). For our analysis, we used Bland Altman Leh, DescTools, and ggplot2 R packages.
3. Results
The clinical characteristics of the 40 enrolled patients for the evaluation of the muscle area by Horos and LIFEx are reported in Table 1.

Table 1.
Clinical characteristics of overall patient population.
Imaging findings in the overall patient population according to Horos and LIFEx evaluation are described in Table 2. Of note, by grouping patients according to CAC score, both software programs perfectly agreed in categorizing patients at high risk of CAD, while there was only a slight and not significant discrepancy regarding patients at low and moderate CAD risk (3 out of 40 patients, 7%, p = 0.67).
Table 2.
Imaging findings in the overall patient population according to Horos and LIFEx evaluation.
3.1. CAC Score
CAC score distributions obtained by Horos and LIFEx were not Gaussian (p < 0.001 for both), and not comparable in shape (p = 0.002). Lin’s concordance correlation coefficient was 0.998 (95% CI: 0.997–0.998). Figure 2 shows the boxplots of the measurements of the CAC score achieved by Horos and LIFEx.
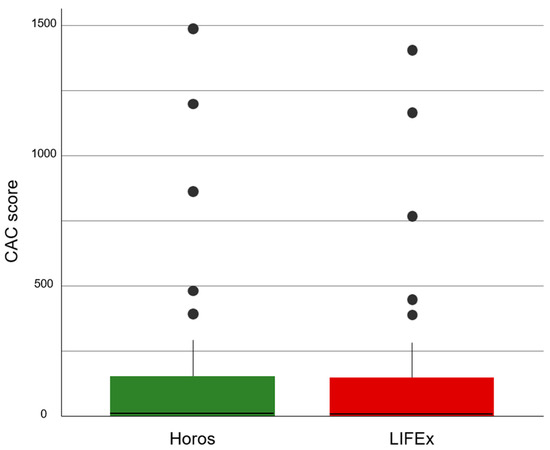
Figure 2.
Boxplots of the CAC score values calculated by Horos and LIFEx. The continuous line represents the median, the colored zones delimit the interquartile range, and the filled circles indicate outliers.
Figure 3 reports the Bland–Altman plot of the CAC score. The mean difference among the measurements increased from 8 to 78 by the mean values of the measured CAC score (intercept = −0.050; slope = 0.054; p < 0.001). According to the observed linear relationship, lower and upper limits of agreement were shifted ± 1.96 times the residual standard deviation (SD = 20.5) of the regression. The Bland–Altman plot shows an increasing difference in measurement by two software programs as the score increases.
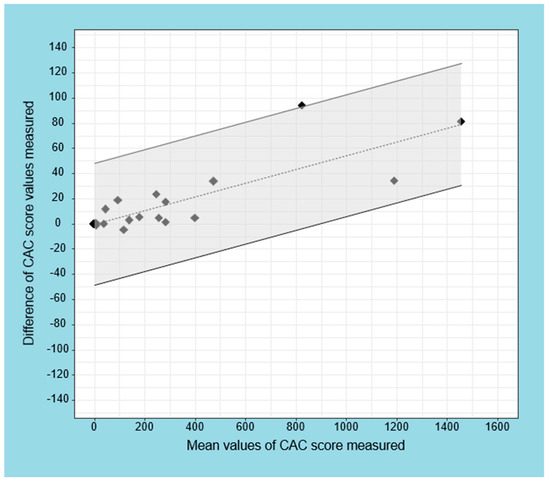
Figure 3.
Regression-based limits of agreement for difference in CAC score measured by Horos and LIFEx software. The dashed line represents the fitted regression line, and the continuous lines refer to the 95% CI (gray area). The limits of agreement refer to the Bland–Altman regression method.
Figure 4 shows a comparison between the ROI and the CAC score obtained by Horos and LIFEx software in two patients. The volumes turned out to be equal between the two software programs, while the CAC scores calculated by Horos were overestimated with respect to LIFEx.
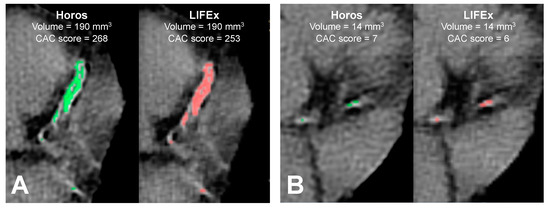
Figure 4.
Comparison between coronary calcifications in two patients (A,B), obtained by Horos (green) and LIFEx (red) software. Patient A is a 70-year-old man with a prostatic tumor. Patient B is a 64-year-old man with a prostatic tumor. For each patient, coronary calcifications have the same volume and different CAC scores, as calculated by Horos and LIFEx.
CVA was computed for 31 of 40 patients with age > 39 years (mean, 65 ± 11 years). CVA was 60 ± 20 years for both Horos and LIFEx. These distributions were in agreement (p = 0.99), while the Bland–Altman plot showed three measurements out of 95% CI (−0.9 to 1.3 years).
3.2. Muscle Area
The muscle area distributions calculated with the two software programs were not Gaussian (p = 0.044 for Horos and p = 0.041 for LIFEx), and statistically not comparable (p = 0.004). Figure 5 shows the boxplots of the muscle area obtained with the two software programs. The median and range were 121.3 cm2 and 62.3–222.2 cm2 with Horos and 121.6 cm2 and 61.7–221.9 cm2 with LIFEx. Lin’s concordance correlation coefficient between the two software was 0.9997 (95% CI: 0.9995–0.9999).
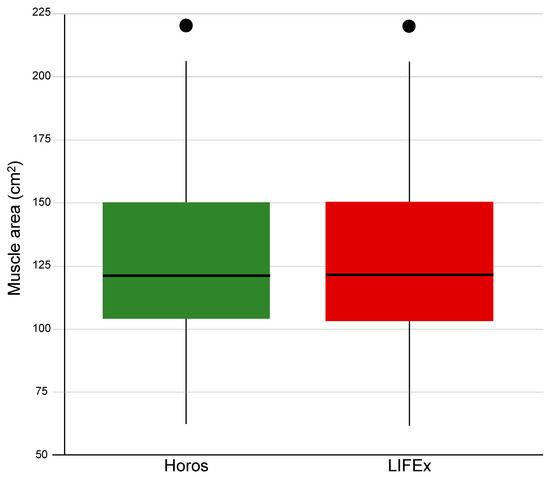
Figure 5.
Boxplots of the muscle area values calculated by Horos and LIFEx. A continuous line represents the median, a colored zone delimits the interquartile range, and the a filled circle indicates an outlier.
Figure 6 shows the Bland–Altman plot of the muscle area measured by Horos and LIFEx software. The bias was 0.41 ± 0.75 cm2 (95% CI 0.17–0.65 cm2). The lower and upper limits of agreement were −1.06 cm2 and 1.89 cm2, respectively, supplemented by the exact 95% CIs obtained as proposed by Carkeet for N-1 = 39 degrees of freedom.
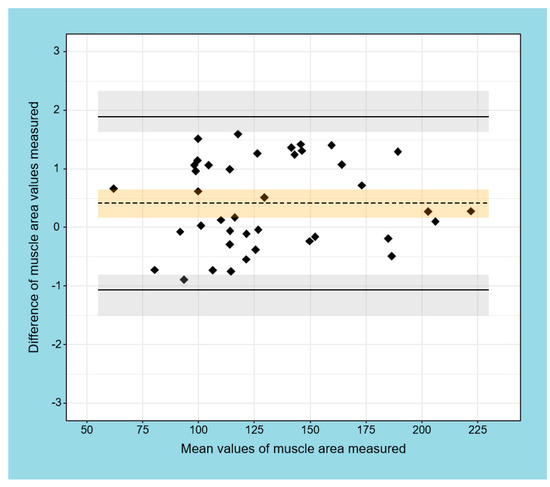
Figure 6.
Bland–Altman plot of muscle area measured by Horos and LIFEx software. The limits of agreement are shown as solid, black lines with 95% exact CI (light grey area); bias (dashed black line) with 95% CI (light orange area).
Figure 7 shows a comparison between the muscle area obtained with Horos and LIFEx software programs in two patients. The images demonstrate good agreement between the two software programs.
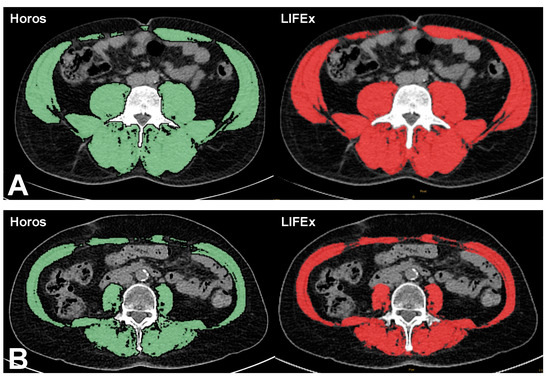
Figure 7.
Comparison between muscle areas of two patients (A,B), achieved through Horos (green) and LIFEx (red) software. Patient A is a 70-year-old woman with pulmonary carcinoma. Muscle area was 99 cm2 with Horos and 98 cm2 with LIFEx. Patient B is a 56-year-old man with prostatic tumor. Muscle area was 206 cm2 with Horos and 206 cm2 with LIFEx.
4. Discussion
4.1. State-of-the Art
To the best of our knowledge, there are no studies that evaluate CAC score and sarcopenia by the proposed software. However, the interest in CAC score and sarcopenia seems to be notable and increasing. In fact, research in PubMed containing the term “sarcopenia” has shown that the number of publications has been increasing in an exponential mode in the last decades, passing from 28 in 2001 to 3106 in 2021. Moreover, using the string “coronary calcium score”, the number of publications in PubMed increased from 67 in 2001 to 624 in 2021.
4.2. Investigation Findings
Our study indicates agreement between the measurement of both CAC scores and muscle mass area obtained using the freeware Horos and LIFEx software. However, for high values of CAC score, we found some disagreement in Bland–Altman analysis. This finding can be explained by the fact that the two software programs may work with different methods with a slight overestimation of the CAC score by Horos in comparison to LIFEx when the number and the volume of calcified zones increase and the differences between the two software programs are magnified. Yet, it should be taken into account that the observed slight discrepancies might be relevant under other experimental conditions, such as poor image quality. However, discrepancies between software at the algorithm level could not be further investigated because the freeware software source codes are not freely available. However, the observed difference in CAC score seems clinically negligible considering that, categorizing patients according to CAC score categories, the two software programs perfectly agreed in categorizing patients at high risk of CAD.
Regarding the muscle area, Horos and LIFEx software showed very good agreement. The distributions of the measured values by the two software programs were superimposable, highlighting only a slight increase of the Horos median with respect to LIFEx. Lin’s correlation was high, and the Bland–Altman analysis showed a mean difference between measurements less than a half centimeter squared. In particular, the major discrepancies were noted for small values of muscle areas. This effect is explainable by the variation of the relative error, which increases when the value to be measured decreases and the absolute error remains approximately equal. For the same reason, we observed a slight increase in the Bland–Altman limits of agreement for women as compared to men. Nowadays, oncological patients can have a relatively long life expectancy, but their condition can lead to multiple instrumental examinations that can include iodizing radiation exposure. It is very important to optimize radiation exposure and at the same time to obtain as much information as possible from instrumental examinations. Muscle mass loss and sarcopenia onset during chemotherapy or cancer progression has been reported to have a negative effect on prognosis and on complication onset [8,9,10,11,12,13,14,15,16,17,18,19,20,21]. Some drugs used in chemotherapy are related to cardiotoxicity as well [48,49,50,51,52]. Patients treated with these drugs usually undergo echocardiography or magnetic resonance for strain and ejection fraction measurement during follow up for cardiac functionality modification [53,54,55,56,57], but CAC scoring can be feasible as well for cardiac injury monitoring during chemotherapy [34,58,59].
Further, in the era of artificial intelligence, a truly automated method may implement the relevance of the present finding. On the other hand, the two software packages used in this study require a semi-automatic procedure, consisting in the DICOM visualization, then the selection of ROI, and lastly the application of the algorithm of interest. These algorithms are based on grey tone thresholds, and complex algorithms, such as machine learning, are not needed.
5. Limitations
Our study was affected by some limitations. First, the manual selection of ROI may be a source of error. This is a generalized problem in the evaluation with semi-automatic software, and to minimize it could be fundamental to their use when expert operators are not present. Nevertheless, the agreement between readers partly overcomes this limitation. To minimize the error, in our study four expert operators with at least 10 years of experience were involved in delimiting the ROI.
Moreover, a comparison of our findings with results obtained from commercial tools or with published data may have helped to further demonstrate the performance of the two open-source tools. Yet, commercial software was available at our institution for such a comparison. Another limitation is represented by the type and the number of patients enrolled. Indeed, the statistical power of results provided by a Bland–Altman analysis should be confirmed in larger sample size populations. However, the goal of the present investigation was to compare the software tools and not to focus on their clinical applications.
6. Future Studies and Recommendations
Our study should be considered exploratory; we plan to work with a larger group of patients for testing, and also for software evaluations related to other body areas.
7. Conclusions
This study is part of the growing interest in CAC score and sarcopenia and in the use of software for the evaluation of this state of health. Our results demonstrated that in patients undergoing PET/CT imaging, Horos and LIFEx software are interchangeable concerning the evaluation of the muscle area. Although measurements are slightly different between the two software programs for high values of CAC score, both programs demonstrated a similar ability to categorize CAD risk according to CAC score values.
Author Contributions
Conceptualization, C.N., R.M., M.P. and A.C.; Methodology, C.N.; Software, R.M.; Validation, A.P. and F.V. and E.C.; Formal analysis, C.N and R.M.; Investigation, L.P. and E.C.; Resources, C.N, C.G.M. and E.V.; Data curation, C.N., C.G.M. and E.V.; Writing—Original draft preparation, C.N., R.M., M.K. and M.I.; Writing—Review and Editing, C.N., R.M., M.K. and M.I.; Supervision, M.P. and A.C.; Project administration, M.P. and A.C. All authors have read and agreed to the published version of the manuscript.
Funding
This research received no external funding.
Institutional Review Board Statement
The study was conducted according to the guidelines of the Declaration of Helsinki and approved on 8 October 2018 by Institutional Review Committee of the Department of Advanced Biomedical Sciences of the University of Naples Federico II (251180/18).
Informed Consent Statement
Informed consent was obtained from all subjects involved in the study.
Data Availability Statement
The data presented in this study are available on request from the corresponding author. The data are not publicly available due to privacy restrictions.
Conflicts of Interest
The authors declare no conflict of interest.
References
- Albini, A.; Pennesi, G.; Donatelli, F.; Cammarota, R.; De Flora, S.; Noonan, D.M. Cardiotoxicity of Anticancer Drugs: The Need for Cardio-Oncology and Cardio-Oncological Prevention. JNCI J. Natl. Cancer Inst. 2010, 102, 14–25. [Google Scholar] [CrossRef] [Green Version]
- Garg, P.K.; Jorgensen, N.W.; McClelland, R.L.; Leigh, J.A.; Greenland, P.; Blaha, M.J.; Yoon, A.J.; Wong, N.D.; Yeboah, J.; Budoff, M.J. Use of Coronary Artery Calcium Testing to Improve Coronary Heart Disease Risk Assessment in a Lung Cancer Screening Population: The Multi-Ethnic Study of Atherosclerosis (MESA). J. Cardiovasc. Comput. Tomogr. 2018, 12, 493–499. [Google Scholar] [CrossRef] [PubMed]
- Hecht, H.; Blaha, M.J.; Berman, D.S.; Nasir, K.; Budoff, M.; Leipsic, J.; Blankstein, R.; Narula, J.; Rumberger, J.; Shaw, L.J. Clinical Indications for Coronary Artery Calcium Scoring in Asymptomatic Patients: Expert Consensus Statement from the Society of Cardiovascular Computed Tomography. J. Cardiovasc. Comput. Tomogr. 2017, 11, 157–168. [Google Scholar] [CrossRef] [PubMed]
- Budoff, M.J.; Nasir, K.; Kinney, G.L.; Hokanson, J.E.; Barr, R.G.; Steiner, R.; Nath, H.; Lopez-Garcia, C.; Black-Shinn, J.; Casaburi, R. Coronary Artery and Thoracic Calcium on Noncontrast Thoracic CT Scans: Comparison of Ungated and Gated Examinations in Patients from the COPD Gene Cohort. J. Cardiovasc. Comput. Tomogr. 2011, 5, 113–118. [Google Scholar] [CrossRef] [Green Version]
- McClelland, R.L.; Chung, H.; Detrano, R.; Post, W.; Kronmal, R.A. Distribution of coronary artery calcium by race, gender, and age: Results from the Multi-Ethnic Study of Atherosclerosis (MESA). Circulation 2006, 113, 30–37. [Google Scholar] [CrossRef] [PubMed] [Green Version]
- Schmermund, A.; Möhlenkamp, S.; Berenbein, S.; Pump, H.; Moebus, S.; Roggenbuck, U.; Stang, A.; Seibel, R.; Grönemeyer, D.; Jöckel, K.H.; et al. Population-based assessment of subclinical coronary atherosclerosis using electron-beam computed tomography. Atherosclerosis 2006, 185, 177–182. [Google Scholar] [CrossRef]
- Gerke, O.; Lindholt, J.S.; Abdo, B.H.; Lambrechtsen, J.; Frost, L.; Steffensen, F.H.; Karon, M.; Egstrup, K.; Urbonaviciene, G.; Busk, M.; et al. Prevalence and extent of coronary artery calcification in the middle-aged and elderly population. Eur. J. Prev. Cardiol. 2022, 28, 2048–2055. [Google Scholar] [CrossRef]
- Del Fabbro, E.; Parsons, H.; Warneke, C.L.; Pulivarthi, K.; Litton, J.K.; Dev, R.; Palla, S.L.; Brewster, A.; Bruera, E. The Relationship between Body Composition and Response to Neoadjuvant Chemotherapy in Women with Operable Breast Cancer. Oncol. 2012, 17, 1240–1245. [Google Scholar] [CrossRef] [Green Version]
- Mir, O.; Coriat, R.; Dhooge, M.; Perkins, G.; Boudou-Rouquette, P.; Brezault, C.; Ropert, S.; Durand, J.-P.; Chaussade, S.; Goldwasser, F. Feasibility of Gemcitabine and Oxaliplatin in Patients with Advanced Biliary Tract Carcinoma and a Performance Status of 2. Anticancer. Drugs 2012, 23, 739–744. [Google Scholar] [CrossRef]
- Psutka, S.P.; Carrasco, A.; Schmit, G.D.; Moynagh, M.R.; Boorjian, S.A.; Frank, I.; Stewart, S.B.; Thapa, P.; Tarrell, R.F.; Cheville, J.C.; et al. Sarcopenia in Patients with Bladder Cancer Undergoing Radical Cystectomy: Impact on Cancer-Specific and All-Cause Mortality: Sarcopenia and Survival After RC for UC. Cancer 2014, 120, 2910–2918. [Google Scholar] [CrossRef]
- Joglekar, S.; Asghar, A.; Mott, S.L.; Johnson, B.E.; Button, A.M.; Clark, E.; Mezhir, J.J. Sarcopenia Is an Independent Predictor of Complications Following Pancreatectomy for Adenocarcinoma. J. Surg. Oncol. 2015, 111, 771–775. [Google Scholar] [CrossRef] [PubMed] [Green Version]
- Kirihara, Y.; Takahashi, N.; Hashimoto, Y.; Sclabas, G.M.; Khan, S.; Moriya, T.; Sakagami, J.; Huebner, M.; Sarr, M.G.; Farnell, M.B. Prediction of Pancreatic Anastomotic Failure After Pancreatoduodenectomy: The Use of Preoperative, Quantitative Computed Tomography to Measure Remnant Pancreatic Volume and Body Composition. Ann. Surg. 2013, 257, 512–519. [Google Scholar] [CrossRef] [PubMed]
- Tan, B.H.L.; Birdsell, L.A.; Martin, L.; Baracos, V.E.; Fearon, K.C.H. Sarcopenia in an Overweight or Obese Patient Is an Adverse Prognostic Factor in Pancreatic Cancer. Clin. Cancer Res. 2009, 15, 6973–6979. [Google Scholar] [CrossRef] [PubMed] [Green Version]
- Torres, M.L.; Hartmann, L.C.; Cliby, W.A.; Kalli, K.R.; Young, P.M.; Weaver, A.L.; Langstraat, C.L.; Jatoi, A.; Kumar, S.; Mariani, A. Nutritional Status, CT Body Composition Measures and Survival in Ovarian Cancer. Gynecol. Oncol. 2013, 129, 548–553. [Google Scholar] [CrossRef] [PubMed]
- Sabel, M.S.; Lee, J.; Cai, S.; Englesbe, M.J.; Holcombe, S.; Wang, S. Sarcopenia as a Prognostic Factor among Patients with Stage III Melanoma. Ann. Surg. Oncol. 2011, 18, 3579–3585. [Google Scholar] [CrossRef]
- Thoresen, L.; Frykholm, G.; Lydersen, S.; Ulveland, H.; Baracos, V.; Prado, C.M.M.; Birdsell, L.; Falkmer, U. Nutritional Status, Cachexia and Survival in Patients with Advanced Colorectal Carcinoma. Different Assessment Criteria for Nutritional Status Provide Unequal Results. Clin. Nutr. Edinb. Scotl. 2013, 32, 65–72. [Google Scholar] [CrossRef]
- Elliott, J.A.; Doyle, S.L.; Murphy, C.F.; King, S.; Guinan, E.M.; Beddy, P.; Ravi, N.; Reynolds, J.V. Sarcopenia: Prevalence, and Impact on Operative and Oncologic Outcomes in the Multimodal Management of Locally Advanced Esophageal Cancer. Ann. Surg. 2017, 266, 822–830. [Google Scholar] [CrossRef]
- Kawamura, T.; Makuuchi, R.; Tokunaga, M.; Tanizawa, Y.; Bando, E.; Yasui, H.; Aoyama, T.; Inano, T.; Terashima, M. Long-Term Outcomes of Gastric Cancer Patients with Preoperative Sarcopenia. Ann. Surg. Oncol. 2018, 25, 1625–1632. [Google Scholar] [CrossRef]
- Kurita, Y.; Kobayashi, N.; Tokuhisa, M.; Goto, A.; Kubota, K.; Endo, I.; Nakajima, A.; Ichikawa, Y. Sarcopenia Is a Reliable Prognostic Factor in Patients with Advanced Pancreatic Cancer Receiving FOLFIRINOX Chemotherapy. Pancreatol. Off. J. Int. Assoc. Pancreatol. IAP Al 2019, 19, 127–135. [Google Scholar] [CrossRef]
- Sato, S.; Kunisaki, C.; Suematsu, H.; Tanaka, Y.; Miyamoto, H.; Kosaka, T.; Yukawa, N.; Tanaka, K.; Sato, K.; Akiyama, H.; et al. Impact of Sarcopenia in Patients with Unresectable Locally Advanced Esophageal Cancer Receiving Chemoradiotherapy. In Vivo Athens Greece 2018, 32, 603–610. [Google Scholar] [CrossRef]
- Ishihara, H.; Kondo, T.; Omae, K.; Takagi, T.; Iizuka, J.; Kobayashi, H.; Tanabe, K. Sarcopenia and the Modified Glasgow Prognostic Score Are Significant Predictors of Survival Among Patients with Metastatic Renal Cell Carcinoma Who Are Receiving First-Line Sunitinib Treatment. Target. Oncol. 2016, 11, 605–617. [Google Scholar] [CrossRef] [PubMed] [Green Version]
- Lee, C.S.; Cron, D.C.; Terjimanian, M.N.; Canvasser, L.D.; Mazurek, A.A.; Vonfoerster, E.; Tishberg, L.M.; Underwood, P.W.; Chang, E.T.; Wang, S.C.; et al. Dorsal Muscle Group Area and Surgical Outcomes in Liver Transplantation. Clin. Transplant. 2014, 28, 1092–1098. [Google Scholar] [CrossRef] [PubMed] [Green Version]
- DiMartini, A.; Cruz, R.J.; Dew, M.A.; Myaskovsky, L.; Goodpaster, B.; Fox, K.; Kim, K.H.; Fontes, P. Muscle Mass Predicts Outcomes Following Liver Transplantation: Muscle Mass Predicts Outcomes After Transplantation. Liver Transpl. 2013, 19, 1172–1180. [Google Scholar] [CrossRef] [PubMed] [Green Version]
- Montano-Loza, A.J.; Meza-Junco, J.; Baracos, V.E.; Prado, C.M.M.; Ma, M.; Meeberg, G.; Beaumont, C.; Tandon, P.; Esfandiari, N.; Sawyer, M.B.; et al. Severe Muscle Depletion Predicts Postoperative Length of Stay but Is Not Associated with Survival after Liver Transplantation: Sarcopenia After Liver Transplantation. Liver Transpl. 2014, 20, 640–648. [Google Scholar] [CrossRef]
- Hasselager, R.; Gögenur, I. Core Muscle Size Assessed by Perioperative Abdominal CT Scan Is Related to Mortality, Postoperative Complications, and Hospitalization after Major Abdominal Surgery: A Systematic Review. Langenbecks Arch. Surg. 2014, 399, 287–295. [Google Scholar] [CrossRef]
- Barret, M.; Berthaud, C.; Taïeb, J. Sarcopenia: A concept of growing importance in the management of colorectal cancer. Presse Med. Paris Fr. 1983 2014, 43, 628–632. [Google Scholar] [CrossRef]
- Yip, C.; Goh, V.; Davies, A.; Gossage, J.; Mitchell-Hay, R.; Hynes, O.; Maisey, N.; Ross, P.; Gaya, A.; Landau, D.B.; et al. Assessment of Sarcopenia and Changes in Body Composition after Neoadjuvant Chemotherapy and Associations with Clinical Outcomes in Oesophageal Cancer. Eur. Radiol. 2014, 24, 998–1005. [Google Scholar] [CrossRef]
- Martin, L.; Birdsell, L.; MacDonald, N.; Reiman, T.; Clandinin, M.T.; McCargar, L.J.; Murphy, R.; Ghosh, S.; Sawyer, M.B.; Baracos, V.E. Cancer Cachexia in the Age of Obesity: Skeletal Muscle Depletion Is a Powerful Prognostic Factor, Independent of Body Mass Index. J. Clin. Oncol. 2013, 31, 1539–1547. [Google Scholar] [CrossRef]
- Albano, D.; Messina, C.; Vitale, J.; Sconfienza, L.M. Imaging of Sarcopenia: Old Evidence and New Insights. Eur. Radiol. 2020, 30, 2199–2208. [Google Scholar] [CrossRef]
- Bauer, J.M.; Verlaan, S.; Bautmans, I.; Brandt, K.; Donini, L.M.; Maggio, M.; McMurdo, M.E.T.; Mets, T.; Seal, C.; Wijers, S.L.; et al. Effects of a Vitamin D and Leucine-Enriched Whey Protein Nutritional Supplement on Measures of Sarcopenia in Older Adults, the PROVIDE Study: A Randomized, Double-Blind, Placebo-Controlled Trial. J. Am. Med. Dir. Assoc. 2015, 16, 740–747. [Google Scholar] [CrossRef]
- Rakauskas, A.; Shah, T.T.; Peters, M.; Randeva, J.S.; Hosking-Jervis, F.; Schmainda, M.J.; Orczyck, C.; Emberton, M.; Arya, M.; Moore, C.; et al. Can Quantitative Analysis of Multi-Parametric MRI Independently Predict Failure of Focal Salvage HIFU Therapy in Men with Radio-Recurrent Prostate Cancer? Urol. Oncol. Semin. Orig. Investig. 2021, 39, 830.e1–830.e8. [Google Scholar] [CrossRef] [PubMed]
- Akarken, İ.; Bilen, C.Y.; Özden, E.; Gülşen, M.; Üçer, O.; Şahin, H. Can Aortic and Renal Arteries Calcium Scores Be New Factors to Predict Post-Operative Renal Function After Nephron Sparing Surgery? Clin. Genitourin. Cancer 2022, 20, e45–e52. [Google Scholar] [CrossRef] [PubMed]
- Nioche, C.; Orlhac, F.; Boughdad, S.; Reuzé, S.; Goya-Outi, J.; Robert, C.; Pellot-Barakat, C.; Soussan, M.; Frouin, F.; Buvat, I. LIFEx: A Freeware for Radiomic Feature Calculation in Multimodality Imaging to Accelerate Advances in the Characterization of Tumor Heterogeneity. Cancer Res. 2018, 78, 4786–4789. [Google Scholar] [CrossRef] [PubMed] [Green Version]
- Li, Y.; Zhang, Y.; Fang, Q.; Zhang, X.; Hou, P.; Wu, H.; Wang, X. Radiomics Analysis of [18F]FDG PET/CT for Microvascular Invasion and Prognosis Prediction in Very-Early- and Early-Stage Hepatocellular Carcinoma. Eur. J. Nucl. Med. Mol. Imaging 2021, 48, 2599–2614. [Google Scholar] [CrossRef]
- Kimura, K.; Yoshida, S.; Tsuchiya, J.; Yamada, I.; Tanaka, H.; Yokoyama, M.; Matsuoka, Y.; Yoshimura, R.; Tateishi, U.; Fujii, Y. Usefulness of Texture Features of Apparent Diffusion Coefficient Maps in Predicting Chemoradiotherapy Response in Muscle-Invasive Bladder Cancer. Eur. Radiol. 2022, 32, 671–679. [Google Scholar] [CrossRef] [PubMed]
- Larobina, M.; Megna, R.; Solla, R. Comparison of Three Freeware Software Packages for 18F-FDG PET Texture Feature Calculation. Jpn. J. Radiol. 2021, 39, 710–719. [Google Scholar] [CrossRef]
- Boellaard, R.; Delgado-Bolton, R.; Oyen, W.J.G.; Giammarile, F.; Tatsch, K.; Eschner, W.; Verzijlbergen, F.J.; Barrington, S.F.; Pike, L.C.; Weber, W.A.; et al. FDG PET/CT: EANM Procedure Guidelines for Tumour Imaging: Version 2.0. Eur. J. Nucl. Med. Mol. Imaging 2015, 42, 328–354. [Google Scholar] [CrossRef]
- Petranović Ovčariček, P.; Giovanella, L.; Carrió Gasset, I.; Hindié, E.; Huellner, M.W.; Luster, M.; Piccardo, A.; Weber, T.; Talbot, J.-N.; Verburg, F.A. The EANM Practice Guidelines for Parathyroid Imaging. Eur. J. Nucl. Med. Mol. Imaging 2021, 48, 2801–2822. [Google Scholar] [CrossRef]
- Agatston, A.S.; Janowitz, W.R.; Hildner, F.J.; Zusmer, N.R.; Viamonte, M.; Detrano, R. Quantification of Coronary Artery Calcium Using Ultrafast Computed Tomography. J. Am. Coll. Cardiol. 1990, 15, 827–832. [Google Scholar] [CrossRef] [Green Version]
- Nappi, C.; Gaudieri, V.; Acampa, W.; Arumugam, P.; Assante, R.; Zampella, E.; Mannarino, T.; Mainolfi, C.G.; Imbriaco, M.; Petretta, M.; et al. Coronary Vascular Age: An Alternate Means for Predicting Stress-Induced Myocardial Ischemia in Patients with Suspected Coronary Artery Disease. J. Nucl. Cardiol. 2019, 26, 1348–1355. [Google Scholar] [CrossRef]
- Boutin, R.D.; Yao, L.; Canter, R.J.; Lenchik, L. Sarcopenia: Current Concepts and Imaging Implications. Am. J. Roentgenol. 2015, 205, W255–W266. [Google Scholar] [CrossRef] [PubMed]
- Maddalena, C.; Ponsiglione, A.; Camera, L.; Santarpia, L.; Pasanisi, F.; Bruzzese, D.; Panico, C.; Fiore, G.; Camardella, S.; Caramia, T.; et al. Prognostic Role of Sarcopenia in Metastatic Colorectal Cancer Patients during First-Line Chemotherapy: A Retrospective Study. World J. Clin. Oncol. 2021, 12, 355–366. [Google Scholar] [CrossRef]
- Rutten, I.J.G.; Ubachs, J.; Kruitwagen, R.F.P.M.; Beets-Tan, R.G.H.; Olde Damink, S.W.M.; Van Gorp, T. Psoas Muscle Area Is Not Representative of Total Skeletal Muscle Area in the Assessment of Sarcopenia in Ovarian Cancer. J. Cachexia Sarcopenia Muscle 2017, 8, 630–638. [Google Scholar] [CrossRef] [Green Version]
- Nioche, C.; Orlhac, F.; Buvat, I. User guide Local Image Features Extraction, LIFEx version 7.2.0. Available online: https://www.lifexsoft.org (accessed on 27 January 2022).
- Eckert, J.; Schmidt, M.; Magedanz, A.; Voigtländer, T.; Schmermund, A. Coronary CT Angiography in Managing Atherosclerosis. Int. J. Mol. Sci. 2015, 16, 3740–3756. [Google Scholar] [CrossRef] [PubMed]
- Carkeet, A. Exact parametric confidence intervals for Bland-Altman limits of agreement. Optom. Vis Sci. 2015, 92, 71–80. [Google Scholar] [CrossRef] [Green Version]
- Bland, J.M.; Altman, D.G. Measuring agreement in method comparison studies. Stat. Methods Med. Res. 1999, 8, 135–160. [Google Scholar] [CrossRef] [PubMed]
- Kozhukhov, S.M.; Dovganych, N.V.; Smolanka, I.I.; Lygyrda, O.F.; Bazyka, O.Y.; Lyalkin, S.A.; Ivankova, O.M.; Yarinkina, O.A.; Tkhor, N.V. Cardiotoxicity Risk Prediction in Breast Cancer Patients. Radiat. Med. Radiobiol. 2021, 26, 498–512. [Google Scholar] [CrossRef]
- Batra, A.; Patel, B.; Addison, D.; Baldassarre, L.A.; Desai, N.; Weintraub, N.; Deswal, A.; Hussain, Z.; Brown, S.-A.; Ganatra, S.; et al. Cardiovascular Safety Profile of Taxanes and Vinca Alkaloids: 30 Years FDA Registry Experience. Open Heart 2021, 8, e001849. [Google Scholar] [CrossRef]
- Bilir, Ö.A.; Çetin, İ.İ.; Kaçar, D.; Aker, C.B.; Özbek, N.Y.; Yaralı, N. Evaluation of Early-Onset Cardiotoxic Effects of Anthracyclines Used during the Treatment of Childhood Acute Lymphoblastic Leukemia by Speckle-Tracking Echocardiography. Anatol. J. Cardiol. 2022, 26, 57–62. [Google Scholar] [CrossRef]
- Guan, J.; Bao, W.; Xu, Y.; Yang, W.; Li, M.; Xu, M.; Zhang, Y.; Zhang, M. Assessment of Myocardial Work in Cancer Therapy-Related Cardiac Dysfunction and Analysis of CTRCD Prediction by Echocardiography. Front. Pharmacol. 2021, 12, 770580. [Google Scholar] [CrossRef]
- Bouwer, N.I.; Liesting, C.; Kofflard, M.J.M.; Brugts, J.J.; Kock, M.C.J.; Kitzen, J.J.E.M.; Levin, M.-D.; Boersma, E. 2D-Echocardiography vs Cardiac MRI Strain: A Prospective Cohort Study in Patients with HER2-Positive Breast Cancer Undergoing Trastuzumab. Cardiovasc. Ultrasound 2021, 19, 35. [Google Scholar] [CrossRef]
- Niemelä, J.; Ylänen, K.; Suominen, A.; Pushparajah, K.; Mathur, S.; Sarkola, T.; Jahnukainen, K.; Eerola, A.; Poutanen, T.; Vettenranta, K.; et al. Cardiac Function After Cardiotoxic Treatments for Childhood Cancer—Left Ventricular Longitudinal Strain in Screening. Front. Cardiovasc. Med. 2021, 8, 715953. [Google Scholar] [CrossRef] [PubMed]
- Radulescu, L.M.; Radulescu, D.; Ciuleanu, T.-E.; Crisan, D.; Buzdugan, E.; Romitan, D.-M.; Buzoianu, A.D. Cardiotoxicity Associated with Chemotherapy Used in Gastrointestinal Tumours. Medicina 2021, 57, 806. [Google Scholar] [CrossRef] [PubMed]
- Lopez-Mattei, J.C.; Yang, E.H.; Ferencik, M.; Baldassarre, L.A.; Dent, S.; Budoff, M.J. Cardiac Computed Tomography in Cardio-Oncology. JACC CardioOncol. 2021, 3, 635–649. [Google Scholar] [CrossRef] [PubMed]
- Wang, F.M.; Reiter–Brennan, C.; Dardari, Z.; Marshall, C.H.; Nasir, K.; Miedema, M.D.; Berman, D.S.; Rozanski, A.; Rumberger, J.A.; Budoff, M.J.; et al. Association between Coronary Artery Calcium and Cardiovascular Disease as a Supporting Cause in Cancer: The CAC Consortium. Am. J. Prev. Cardiol. 2020, 4, 100119. [Google Scholar] [CrossRef]
- Layoun, M.E.; Yang, E.H.; Herrmann, J.; Iliescu, C.A.; Lopez-Mattei, J.C.; Marmagkiolis, K.; Budoff, M.J.; Ferencik, M. Applications of Cardiac Computed Tomography in the Cardio-Oncology Population. Curr. Treat. Options Oncol. 2019, 20, 47. [Google Scholar] [CrossRef] [Green Version]
- Alañón Fernández, F.J.; Alañón Fernández, M.; Alañón Cárdenas, F.; Marín González, B.; Cueva-López, V. Mejora de la planificación de las cirugías lagrimales a partir de imágenes tridimensionales con el visualizador DICOM Horos®. Arch. Soc. Esp. Oftalmol. 2021, 96, 509–514. [Google Scholar] [CrossRef] [PubMed]
- Zhao, Y.; Yang, J.; Luo, M.; Yang, Y.; Guo, X.; Zhang, T.; Hao, J.; Yao, Y.; Ma, X. Contrast-Enhanced CT-Based Textural Parameters as Potential Prognostic Factors of Survival for Colorectal Cancer Patients Receiving Targeted Therapy. Mol. Imaging Biol. 2021, 23, 427–435. [Google Scholar] [CrossRef]
Publisher’s Note: MDPI stays neutral with regard to jurisdictional claims in published maps and institutional affiliations. |
© 2022 by the authors. Licensee MDPI, Basel, Switzerland. This article is an open access article distributed under the terms and conditions of the Creative Commons Attribution (CC BY) license (https://creativecommons.org/licenses/by/4.0/).