
Ti6Al4V-ELI Alloy Manufactured via Laser Powder-Bed Fusion and Heat-Treated below and above the β-Transus: Effects of Sample Thickness and Sandblasting Post-Process


Abstract
:1. Introduction
2. Materials and Methods
3. Results
3.1. Microstructure and Surface Roughness
3.2. Mechanical Properties
4. Discussion
5. Conclusions
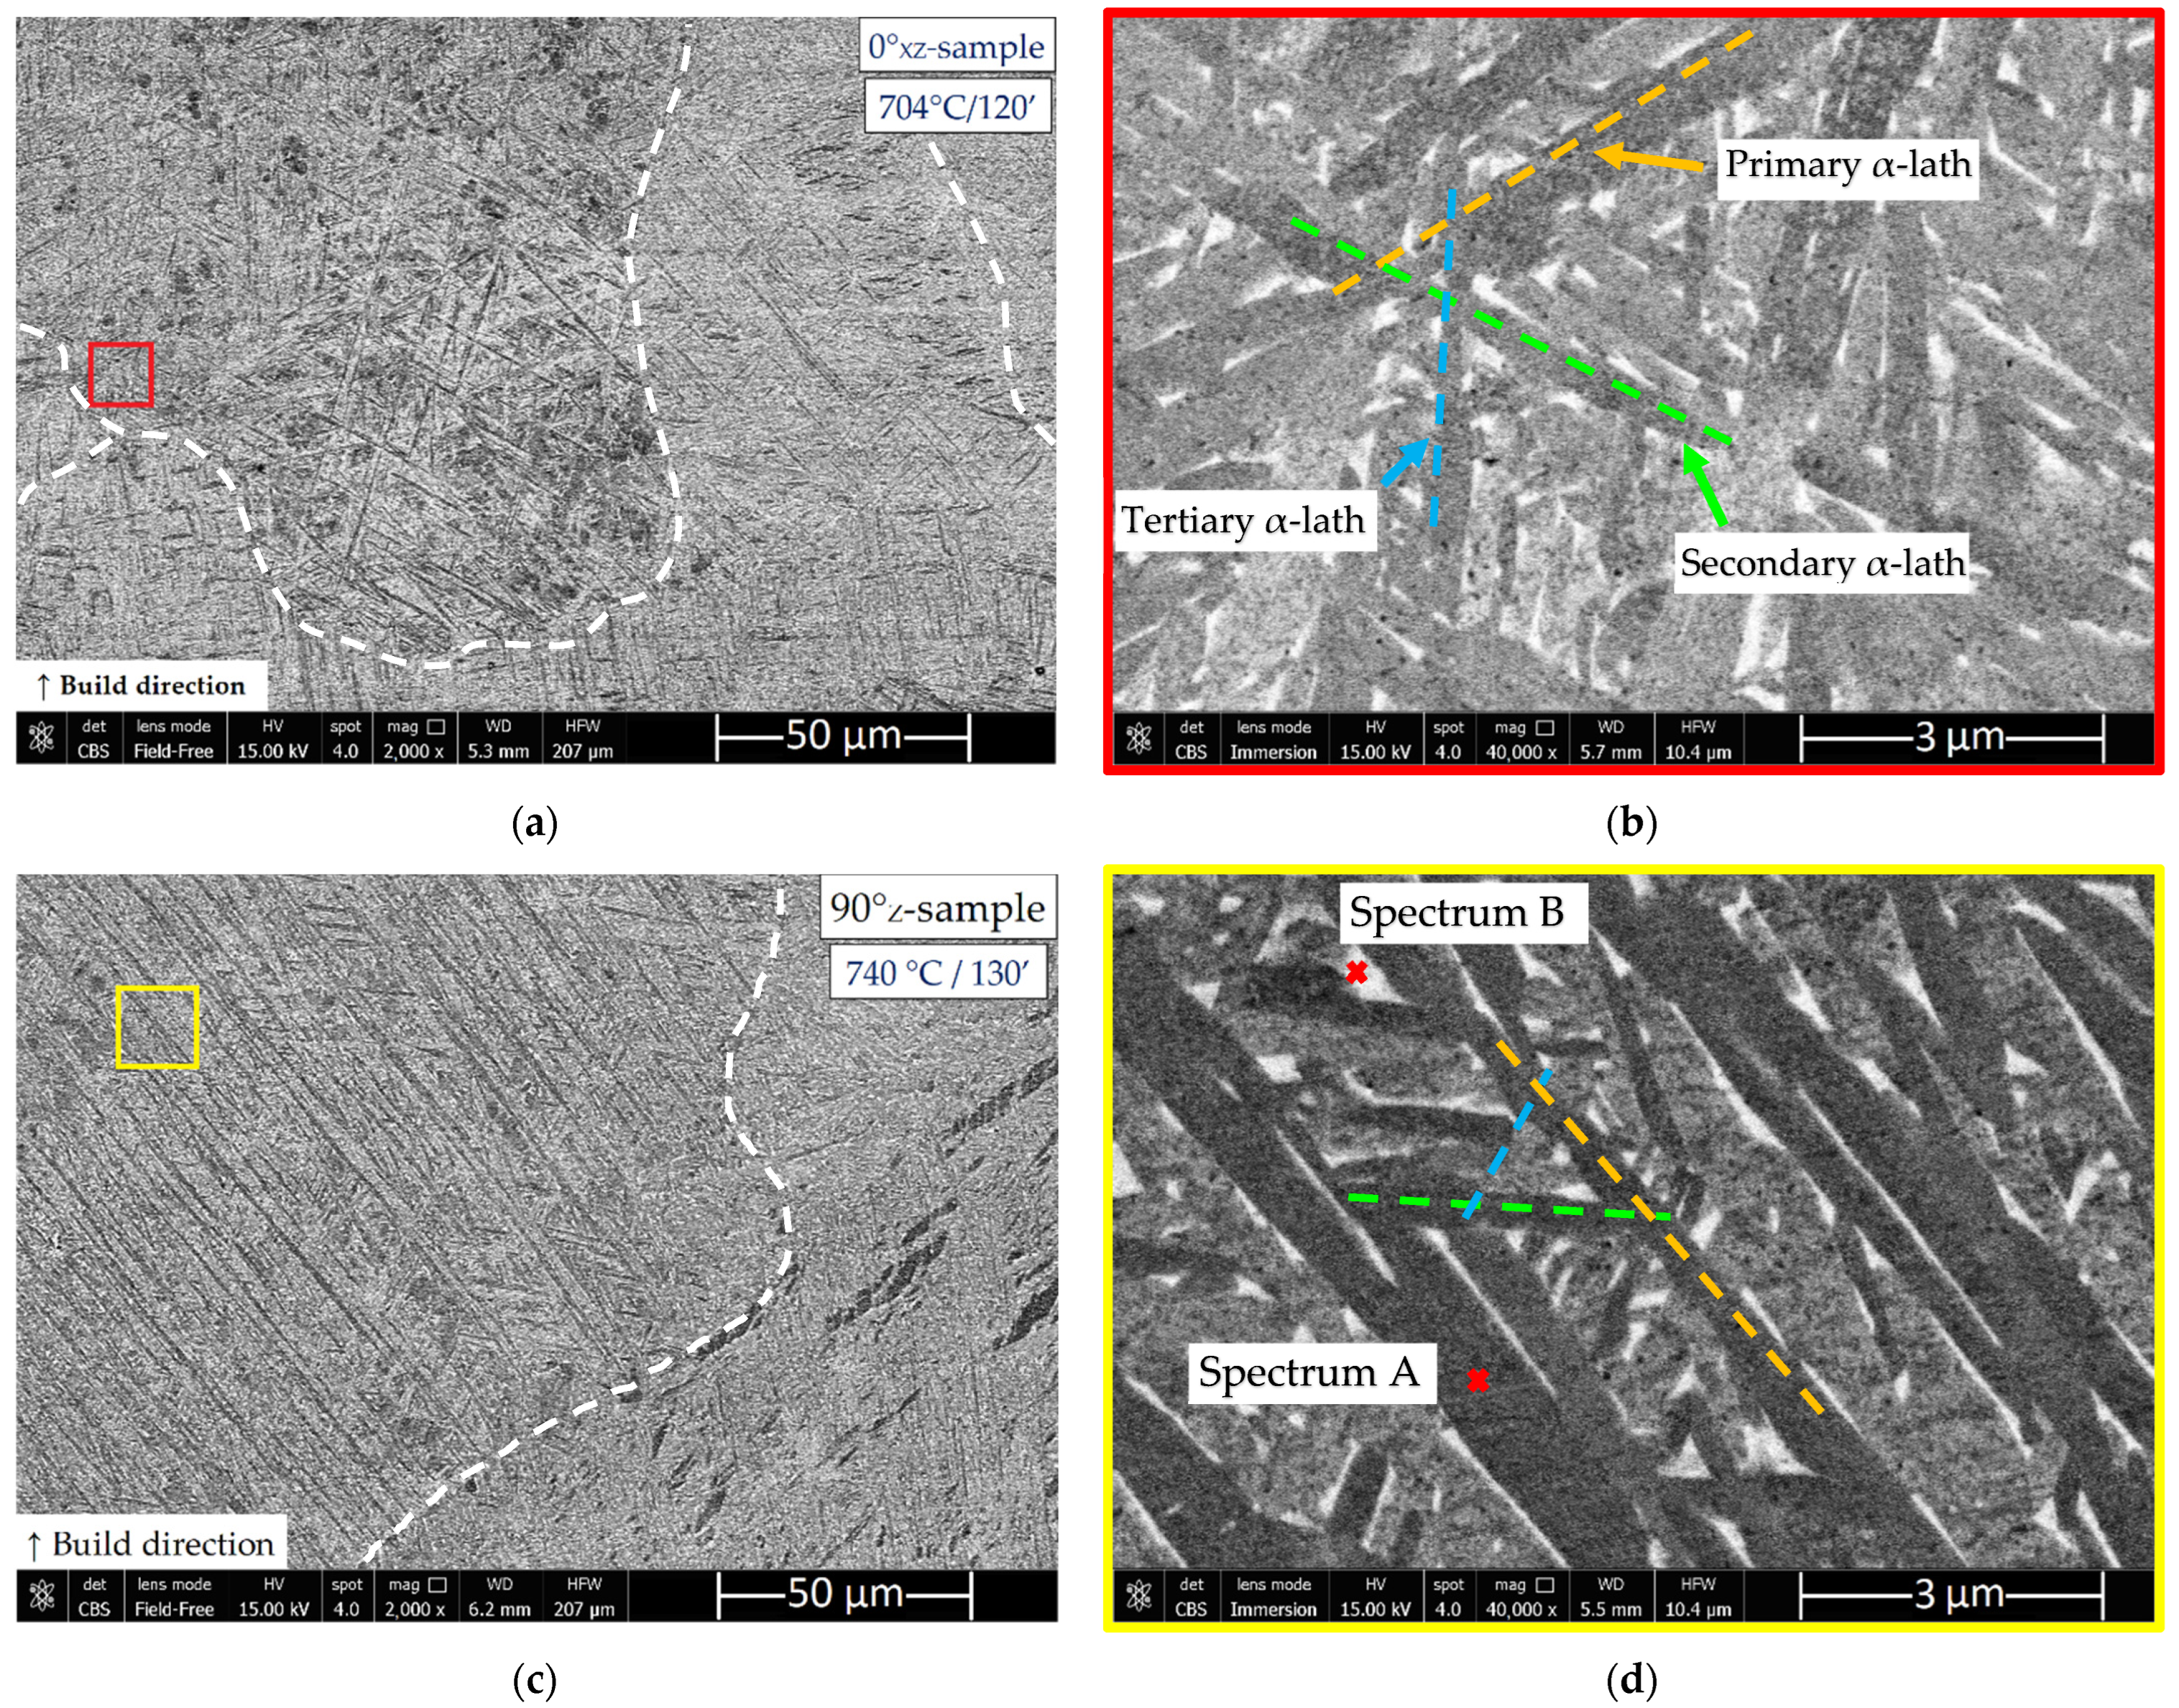
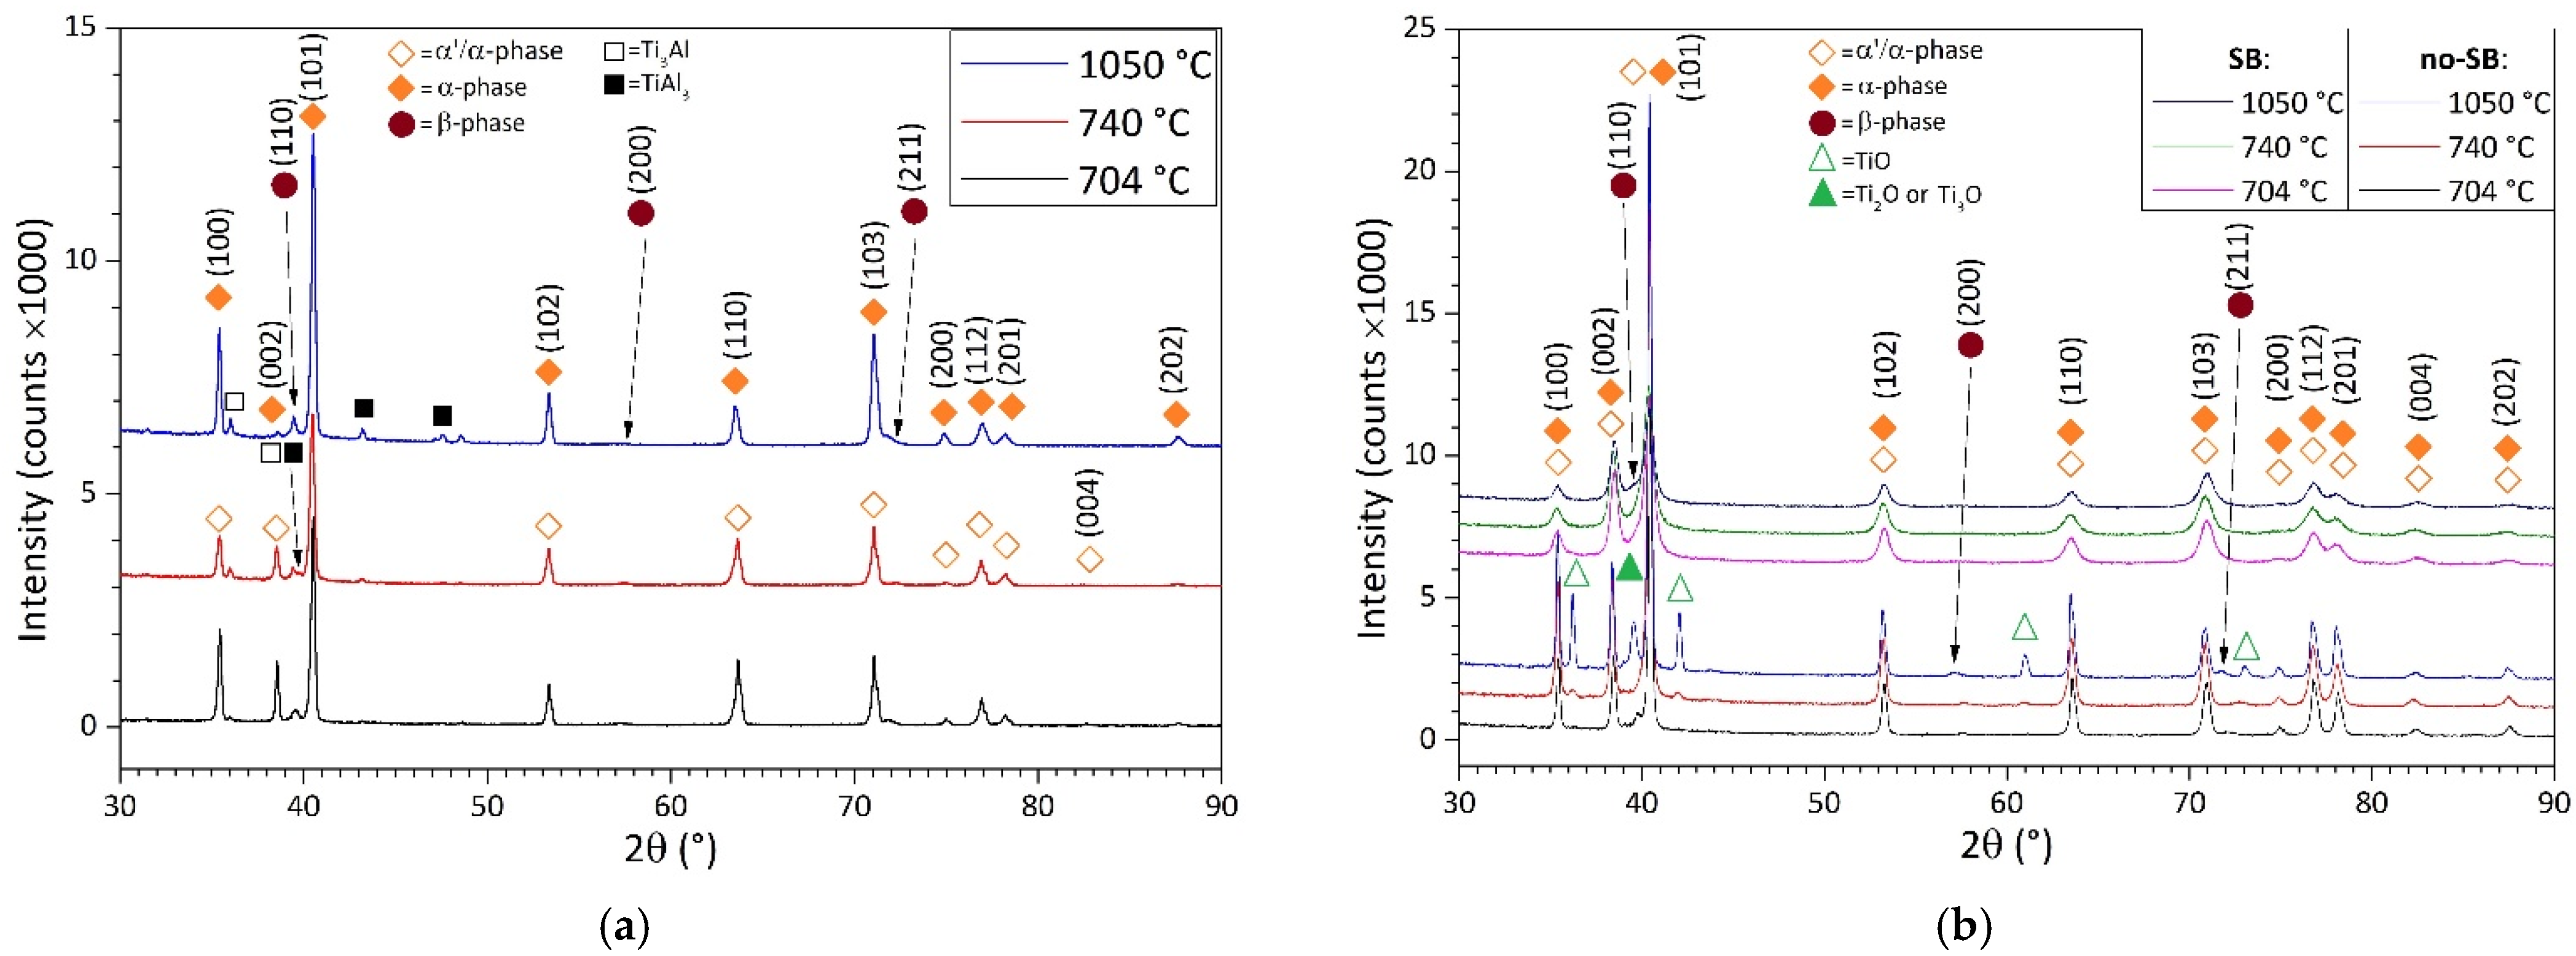
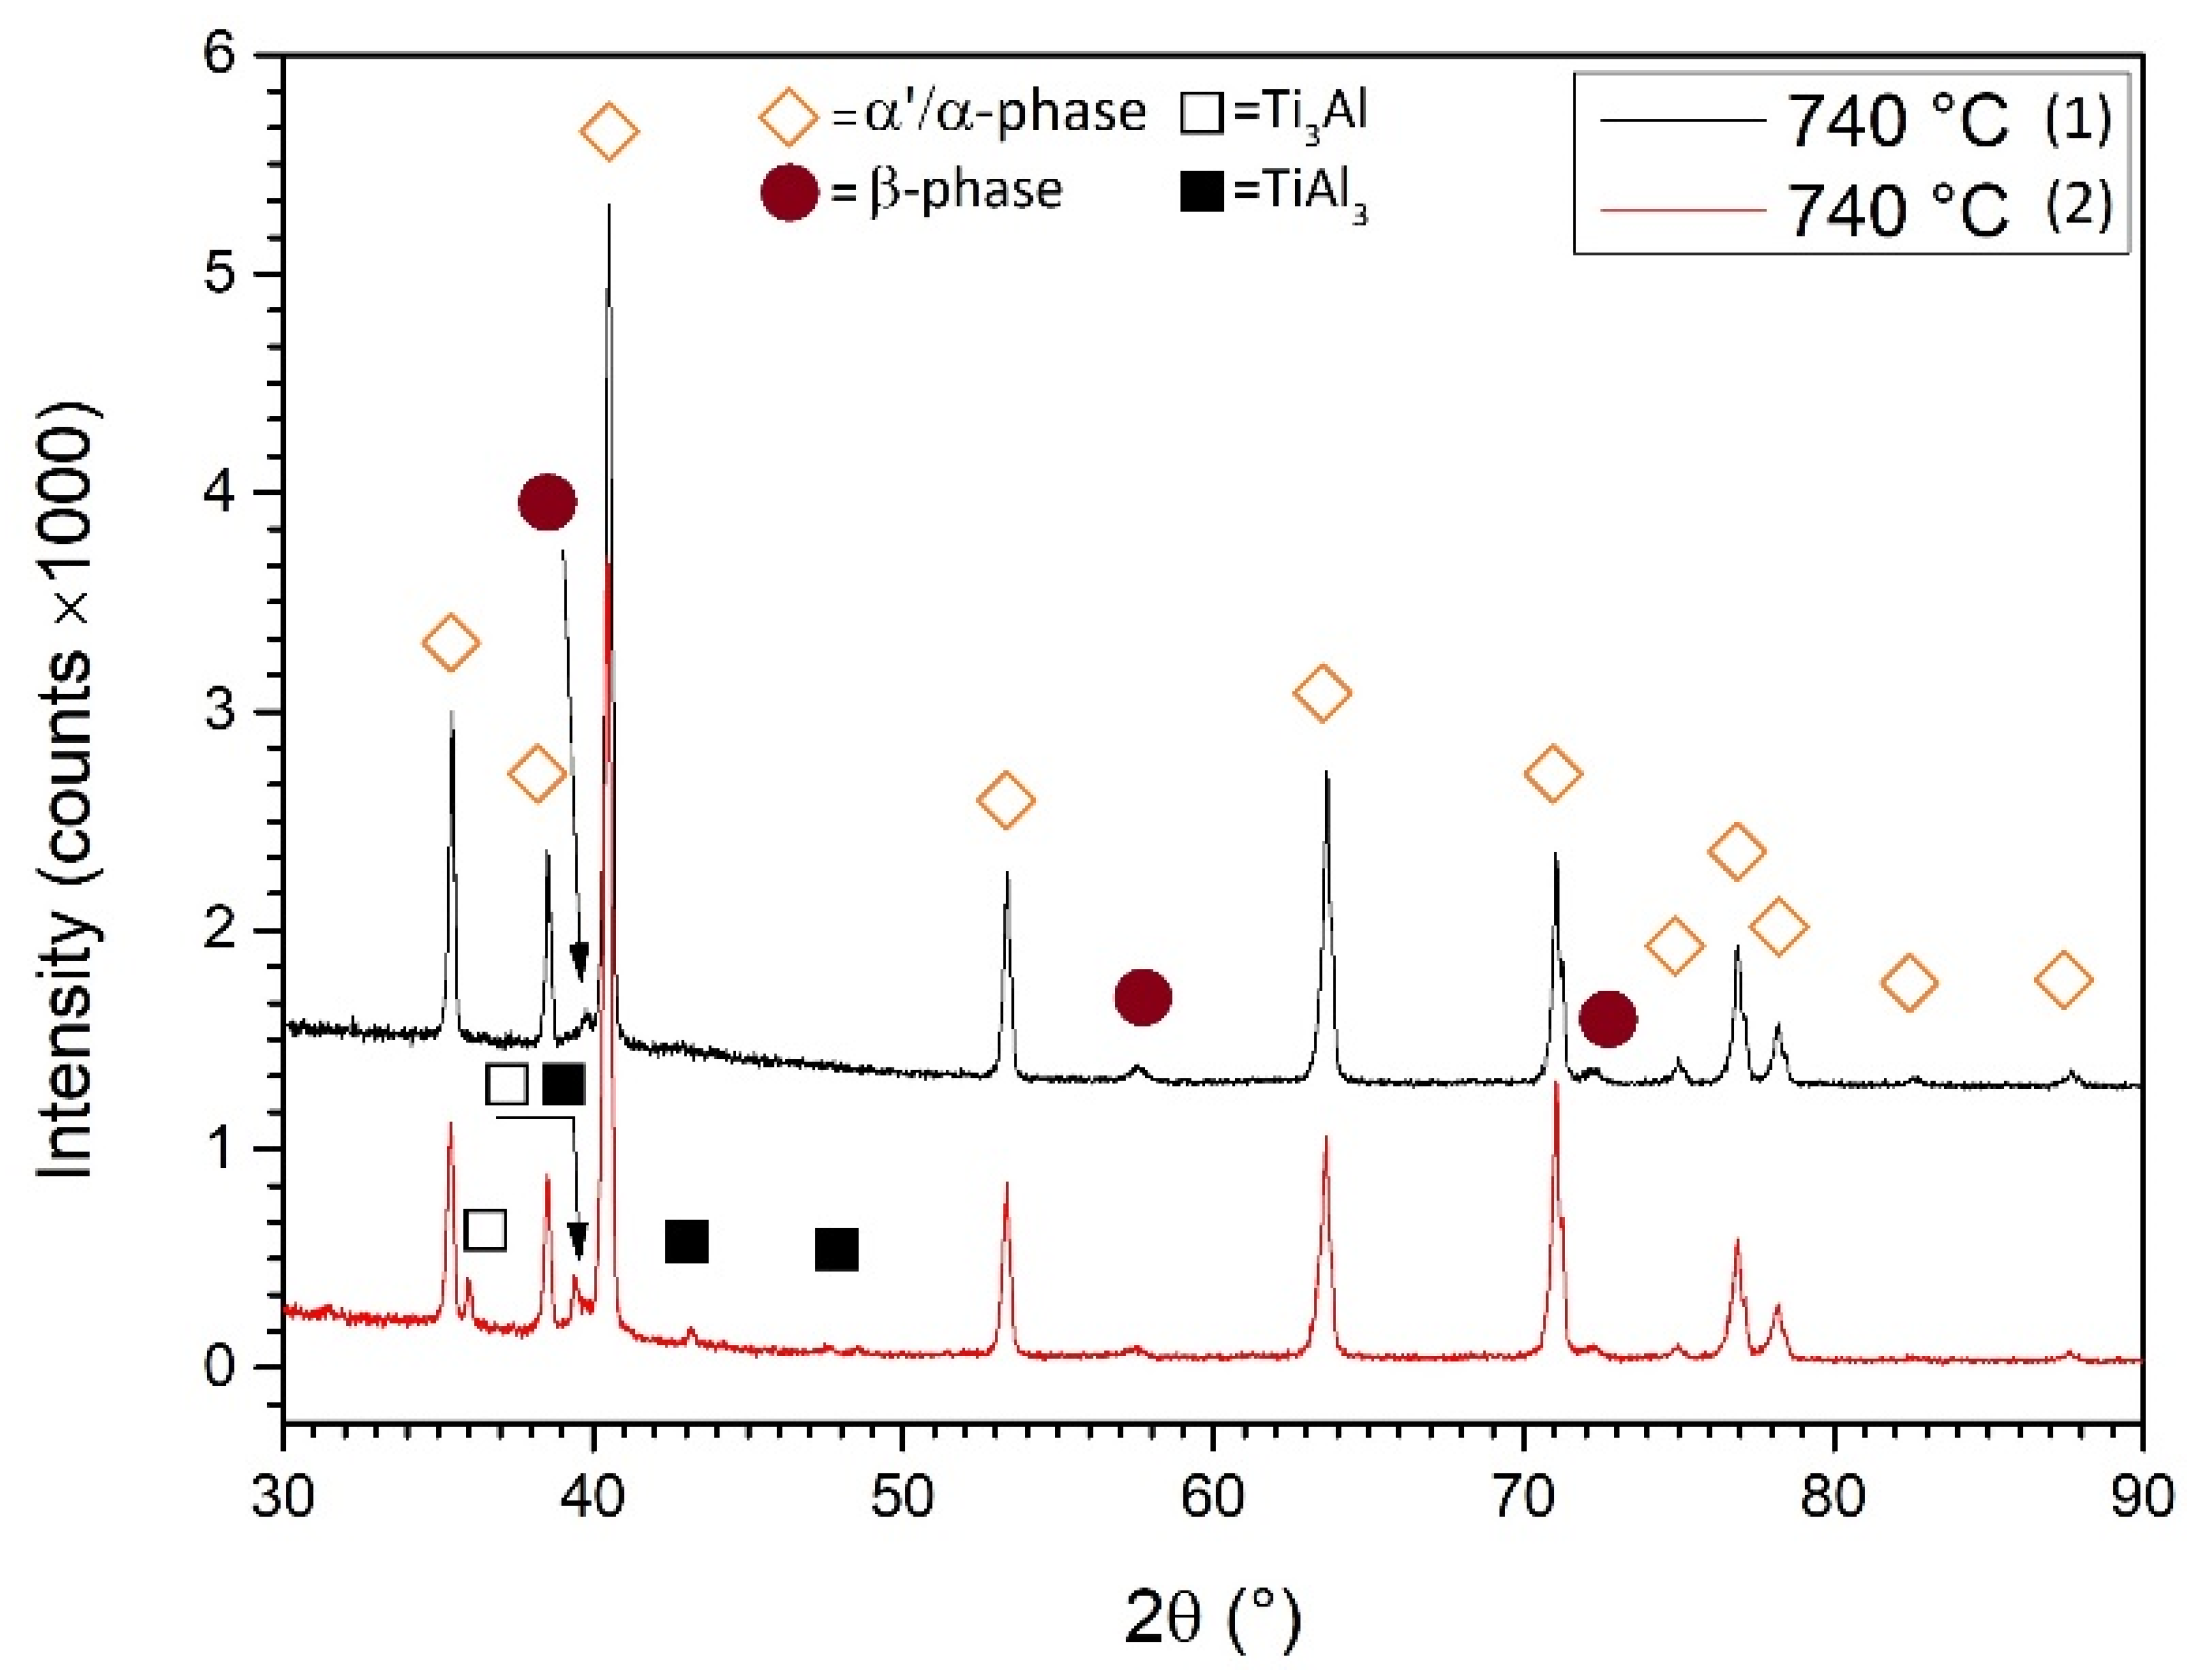
- The microstructure of samples heat-treated at 704 and 740 °C is formed by columnar β-grains containing α′-martensite and α (primary, secondary and tertiary) + β phases. Some samples also showed α2-Ti3Al and TiAl3 precipitates that are probably formed during the L-PBF process. These can cause the anisotropic behavior of the mechanical performance related to samples grown along the same direction.
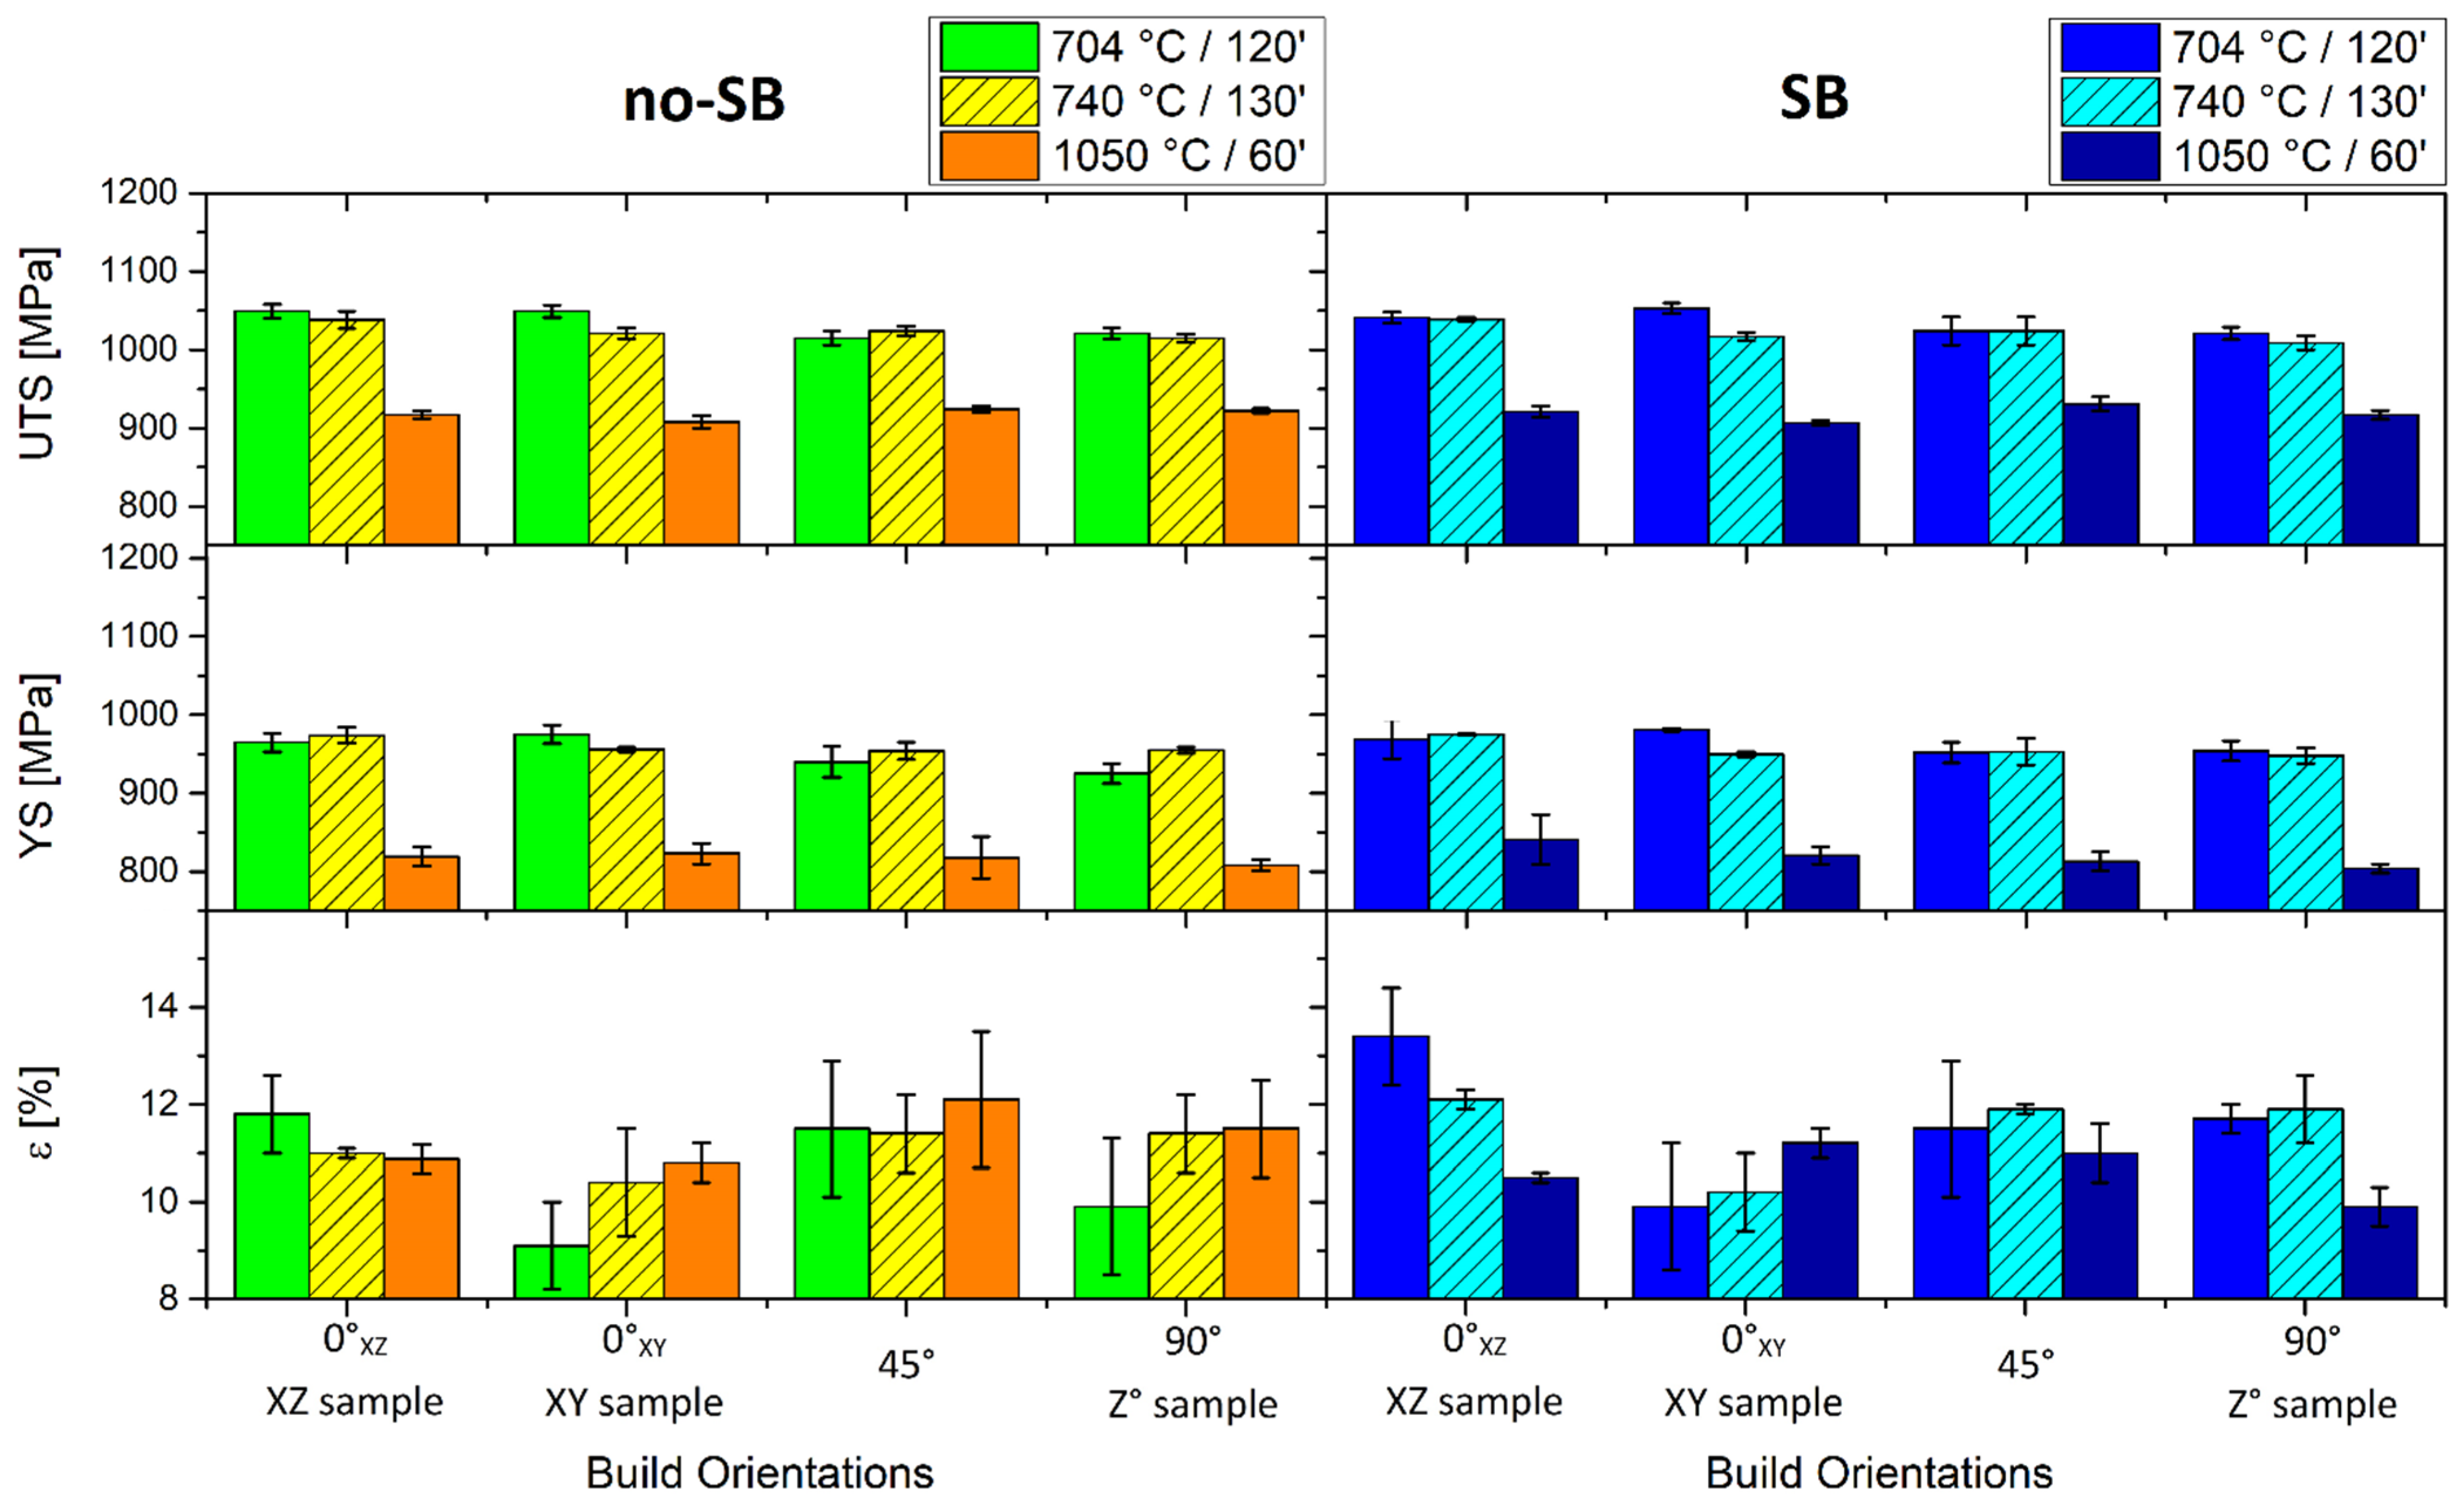
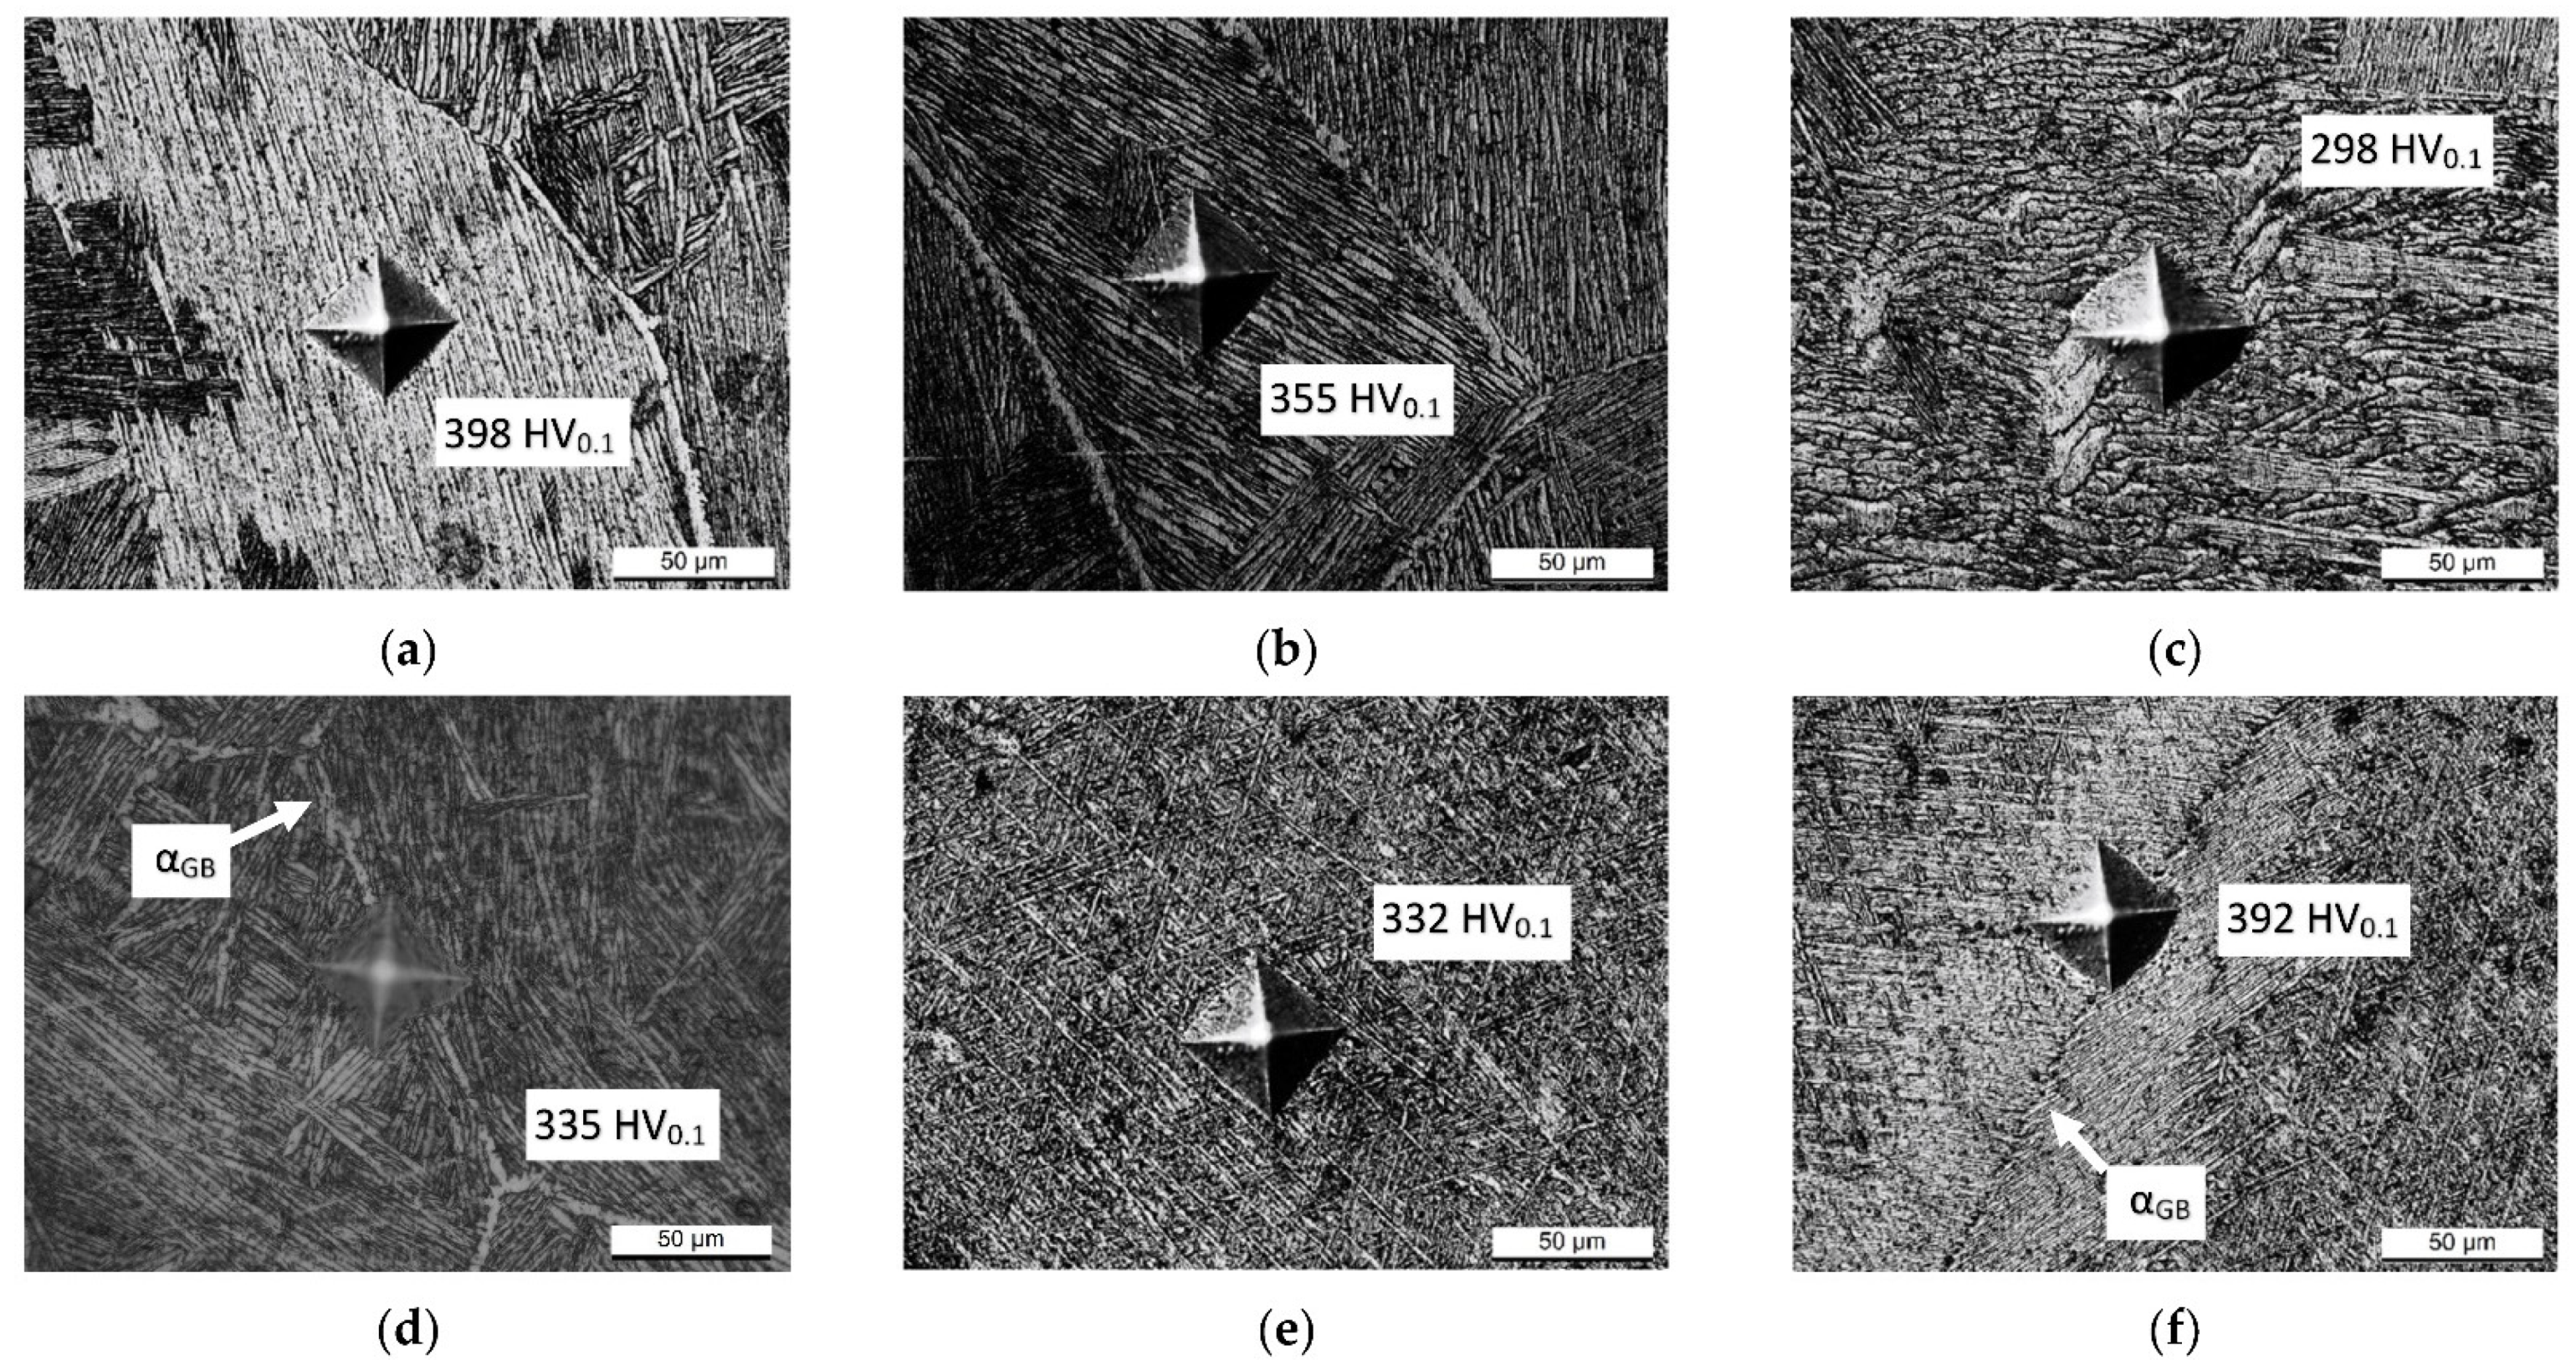
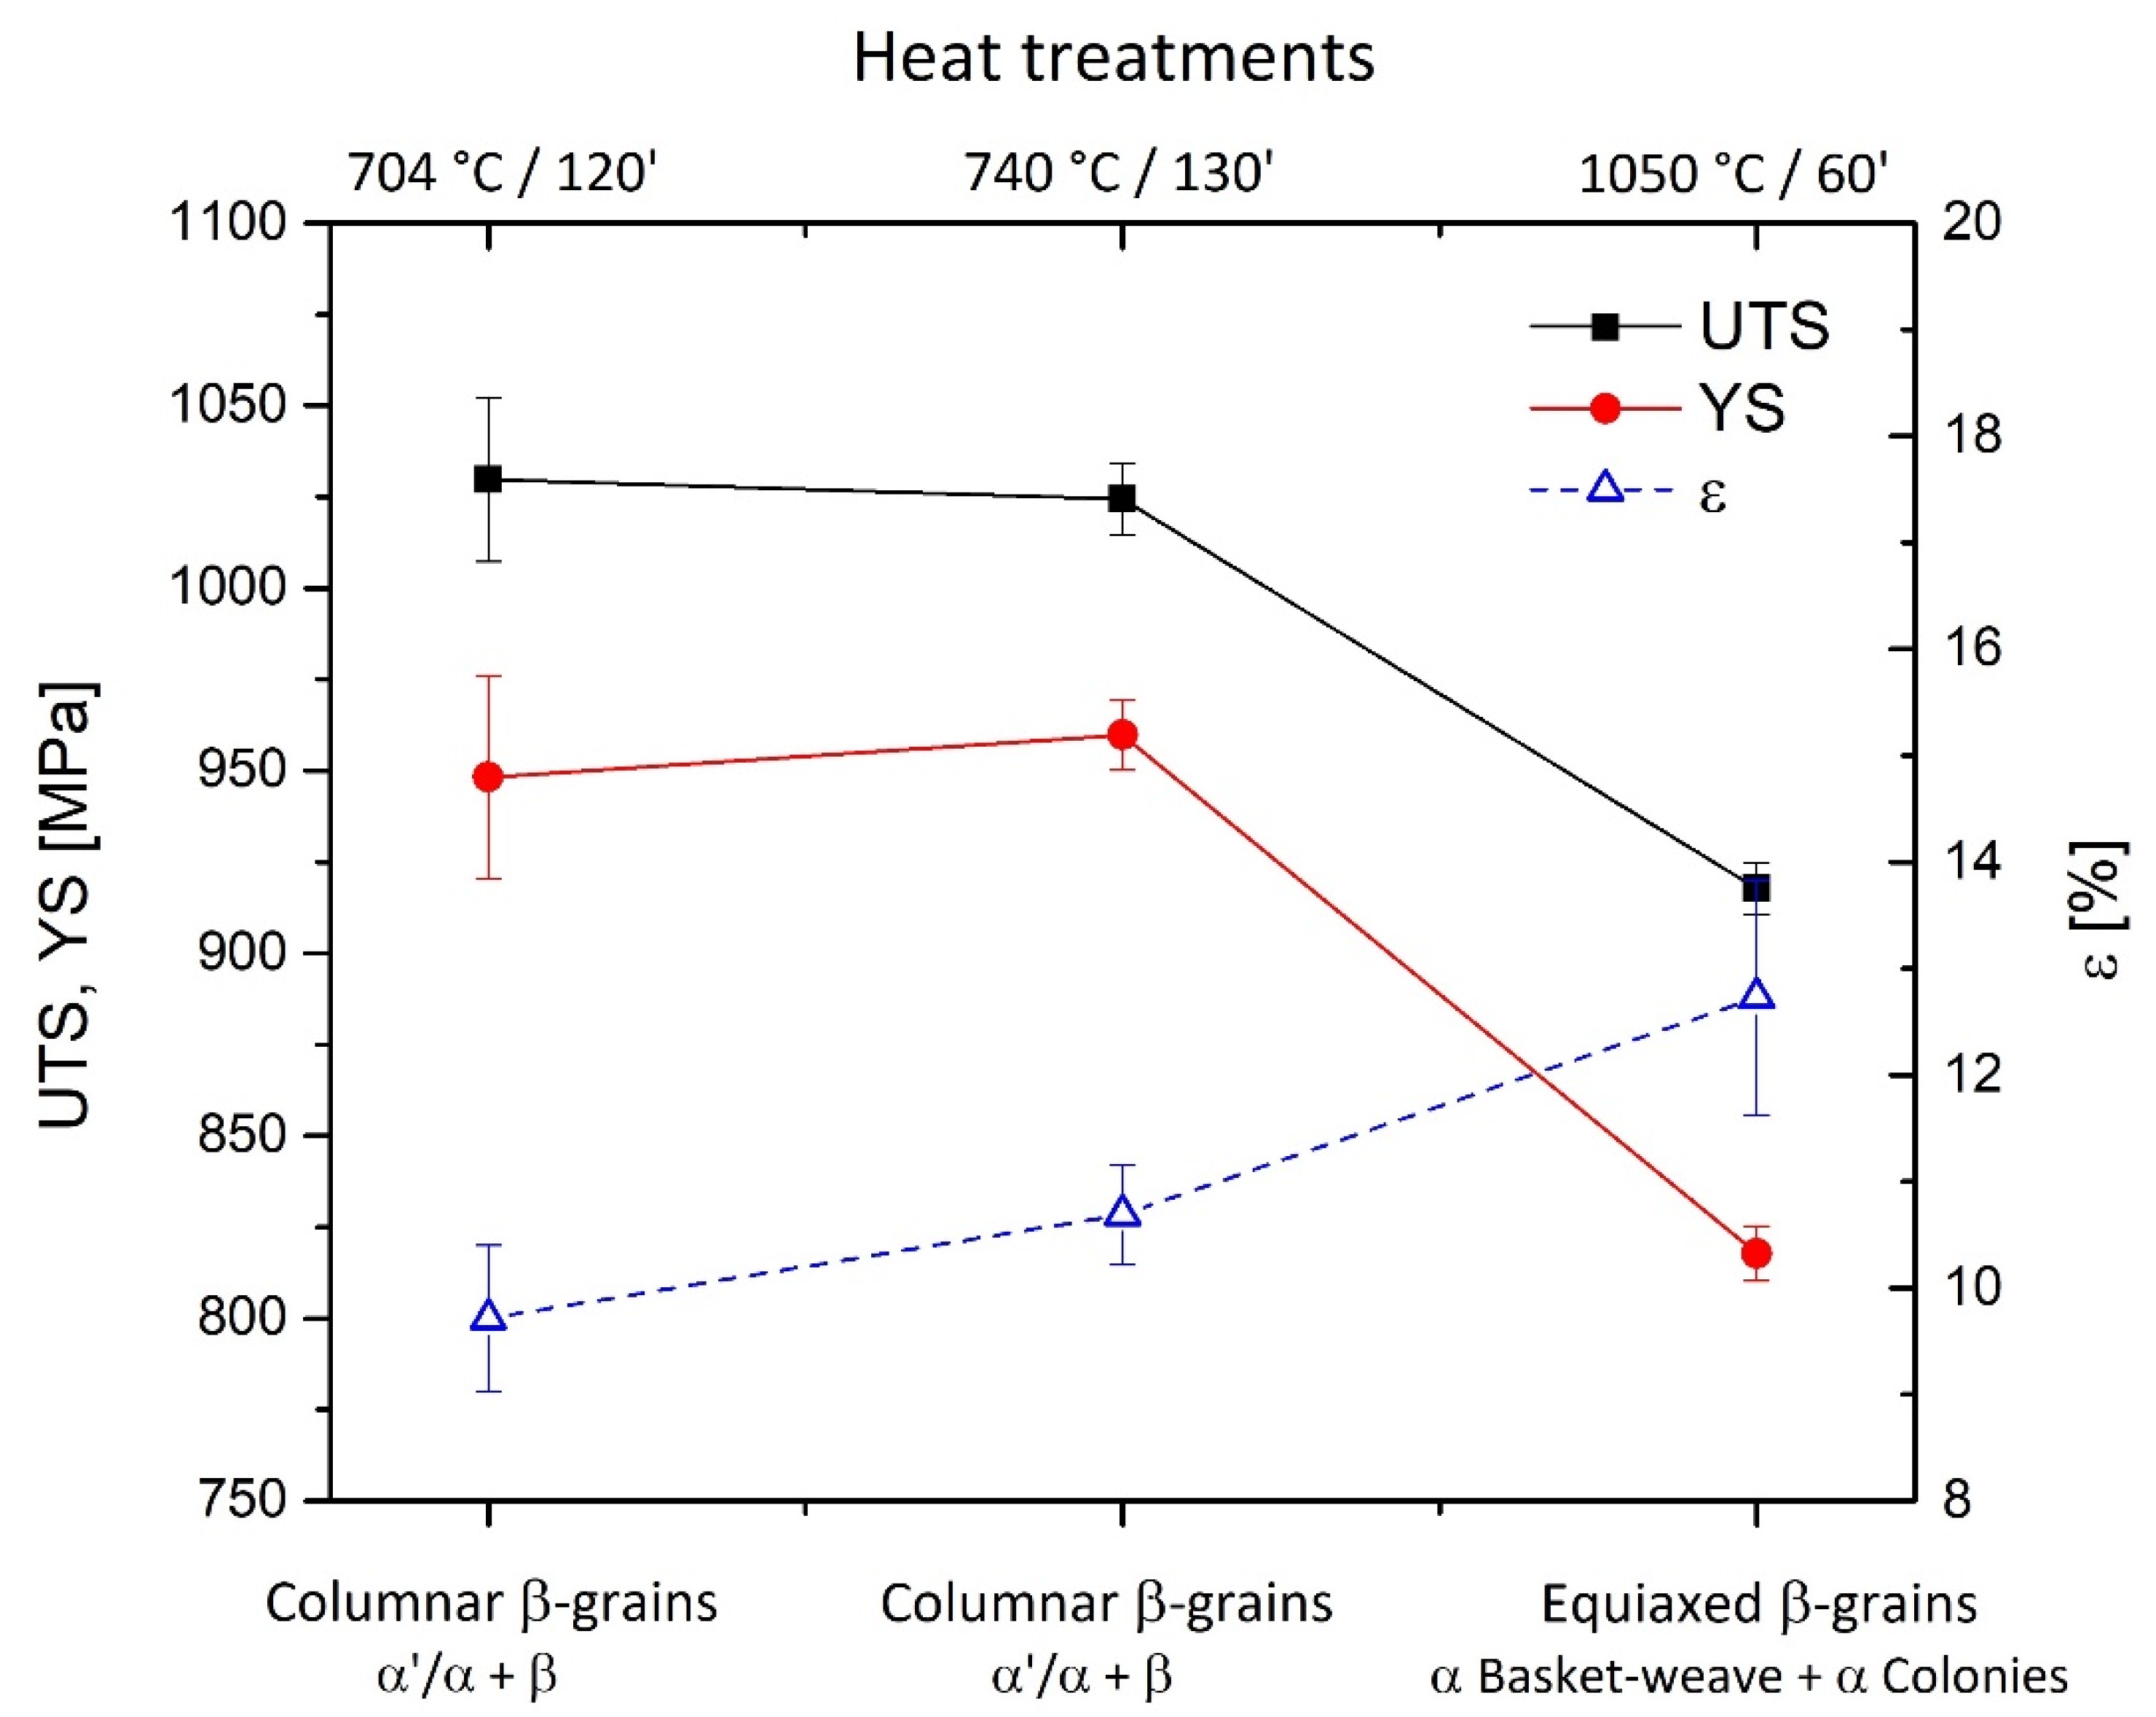
- The samples heat-treated at 704 °C show more anisotropic mechanical properties than the same tensile samples heat-treated at 740 °C. On the other hand, both satisfy ASTM F2924 and ASTM F3001 standard specifications. The increase in α-lath’s thickness from 538 ± 66 to 704 ± 11 μm only influences the HV0.1 microhardness measurements, but apparently has no effect on yield, ultimate tensile strength or elongation.
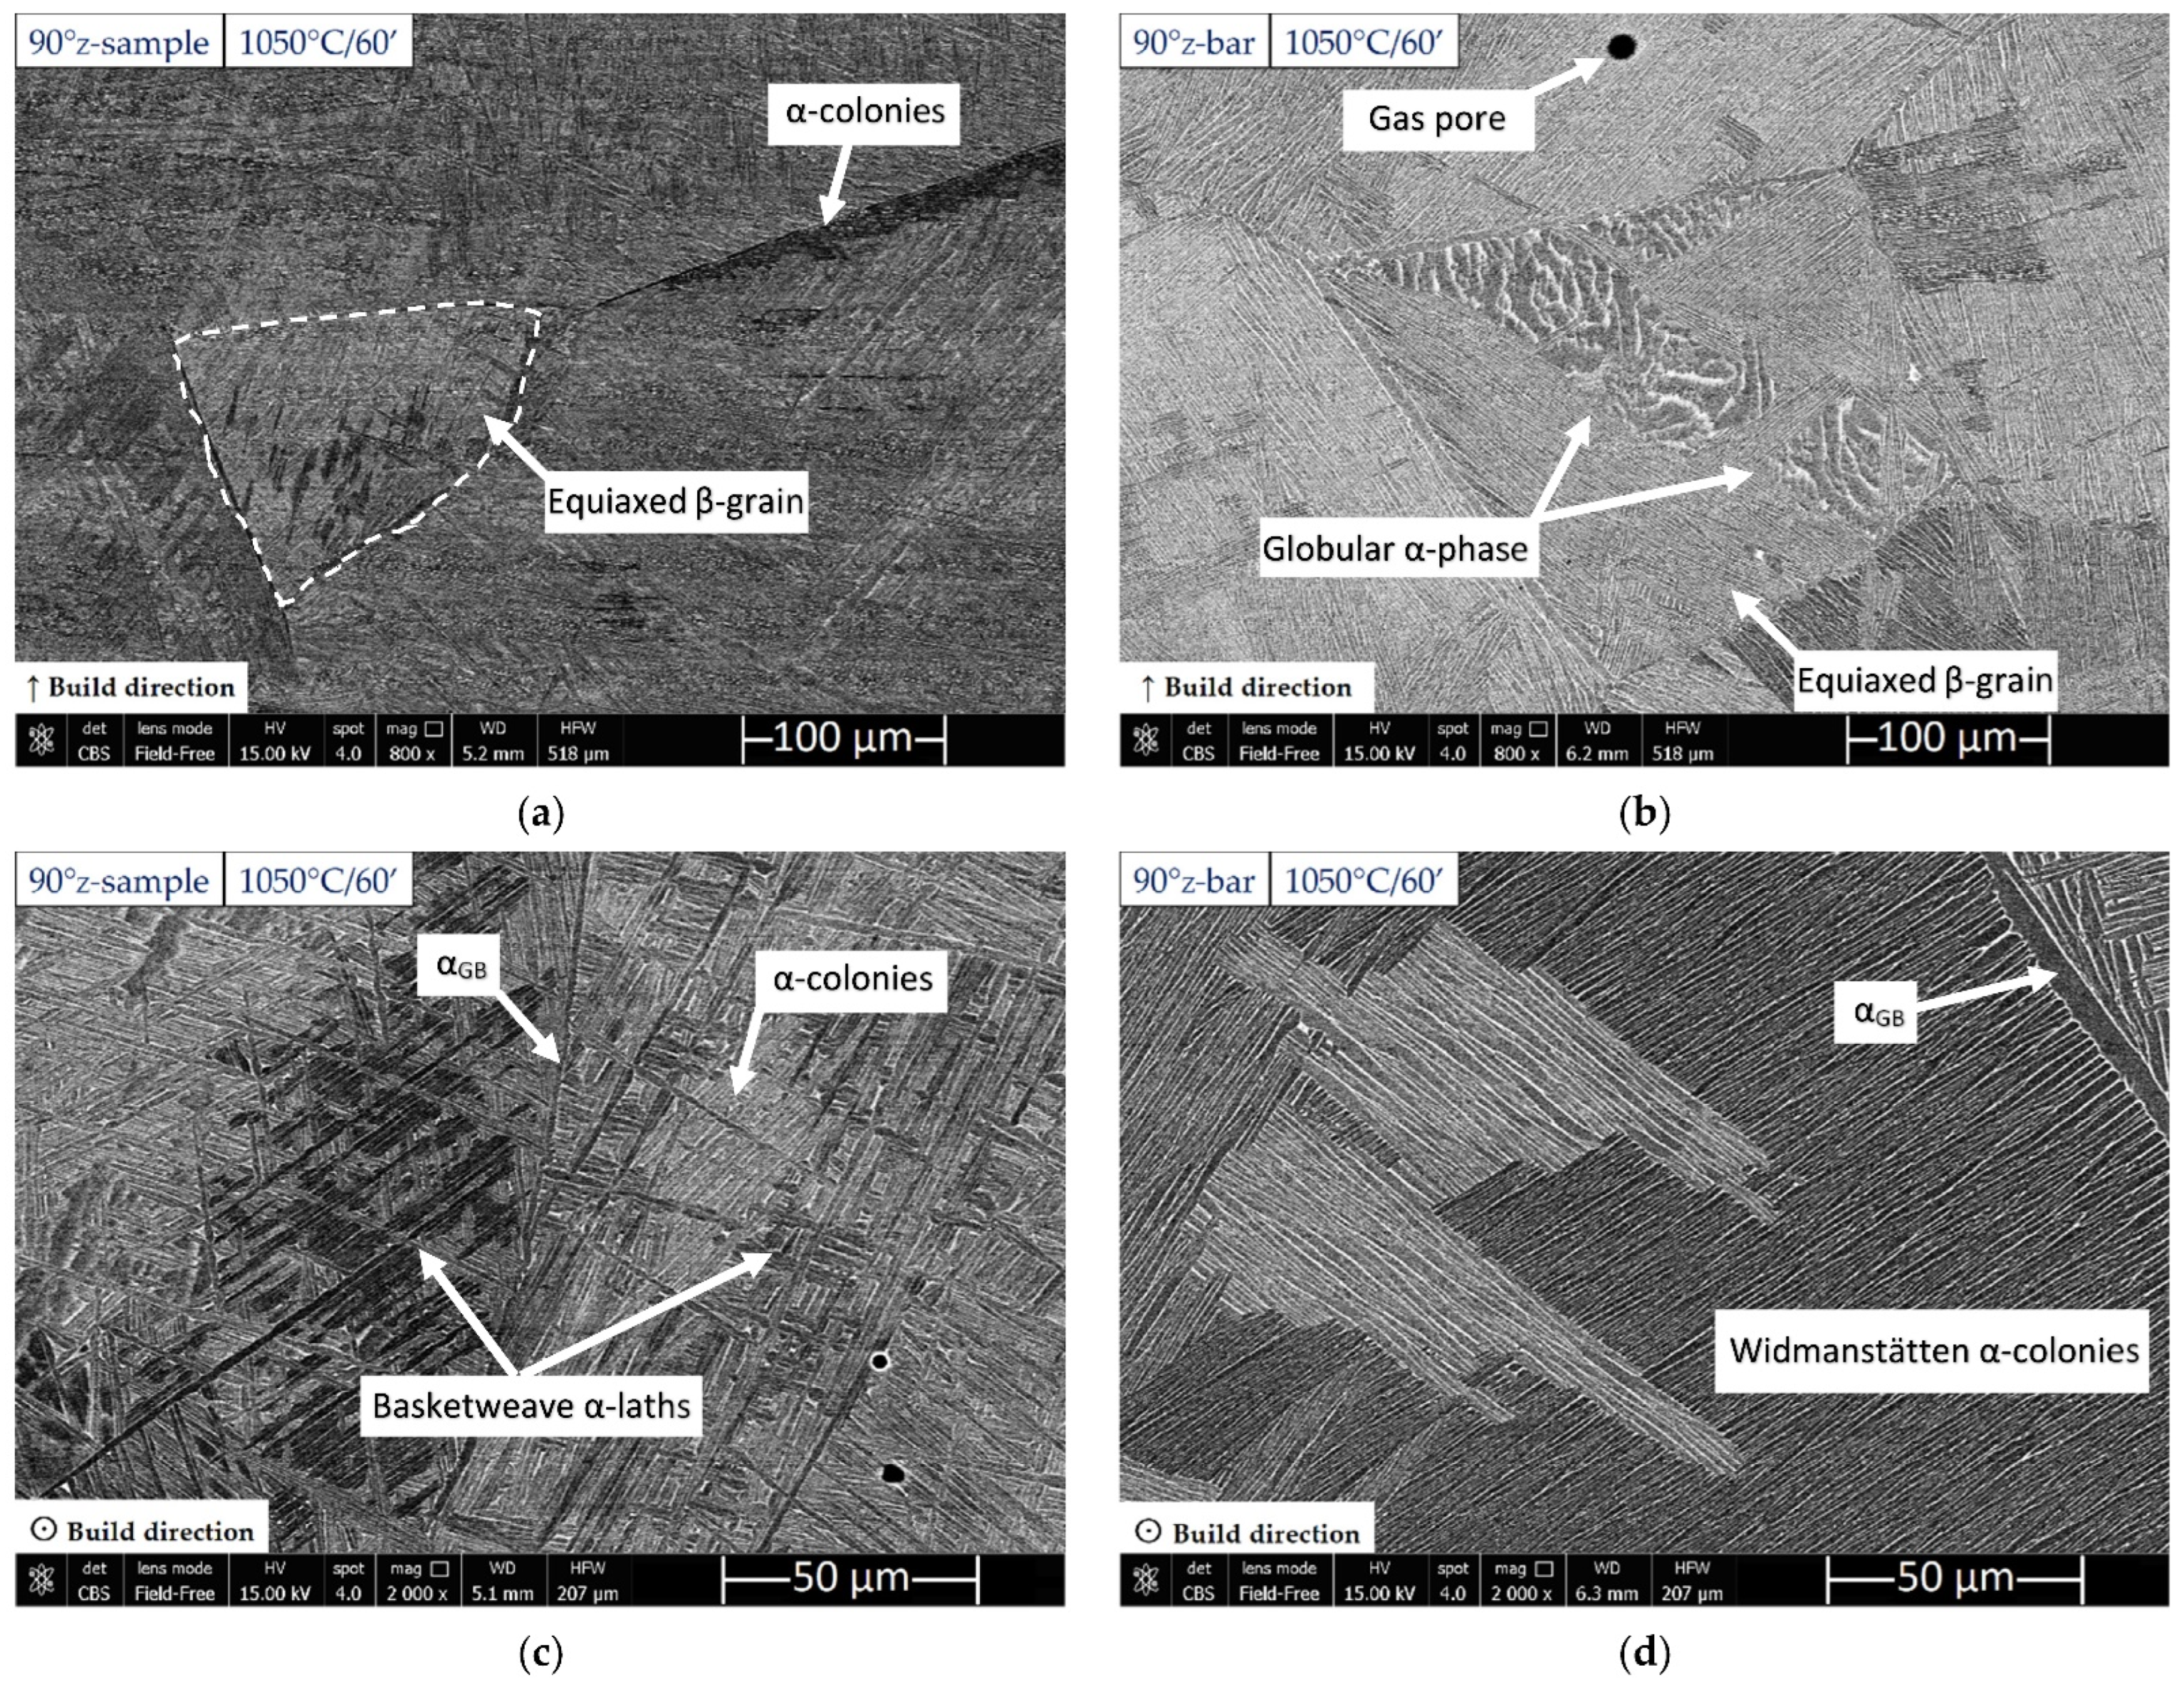
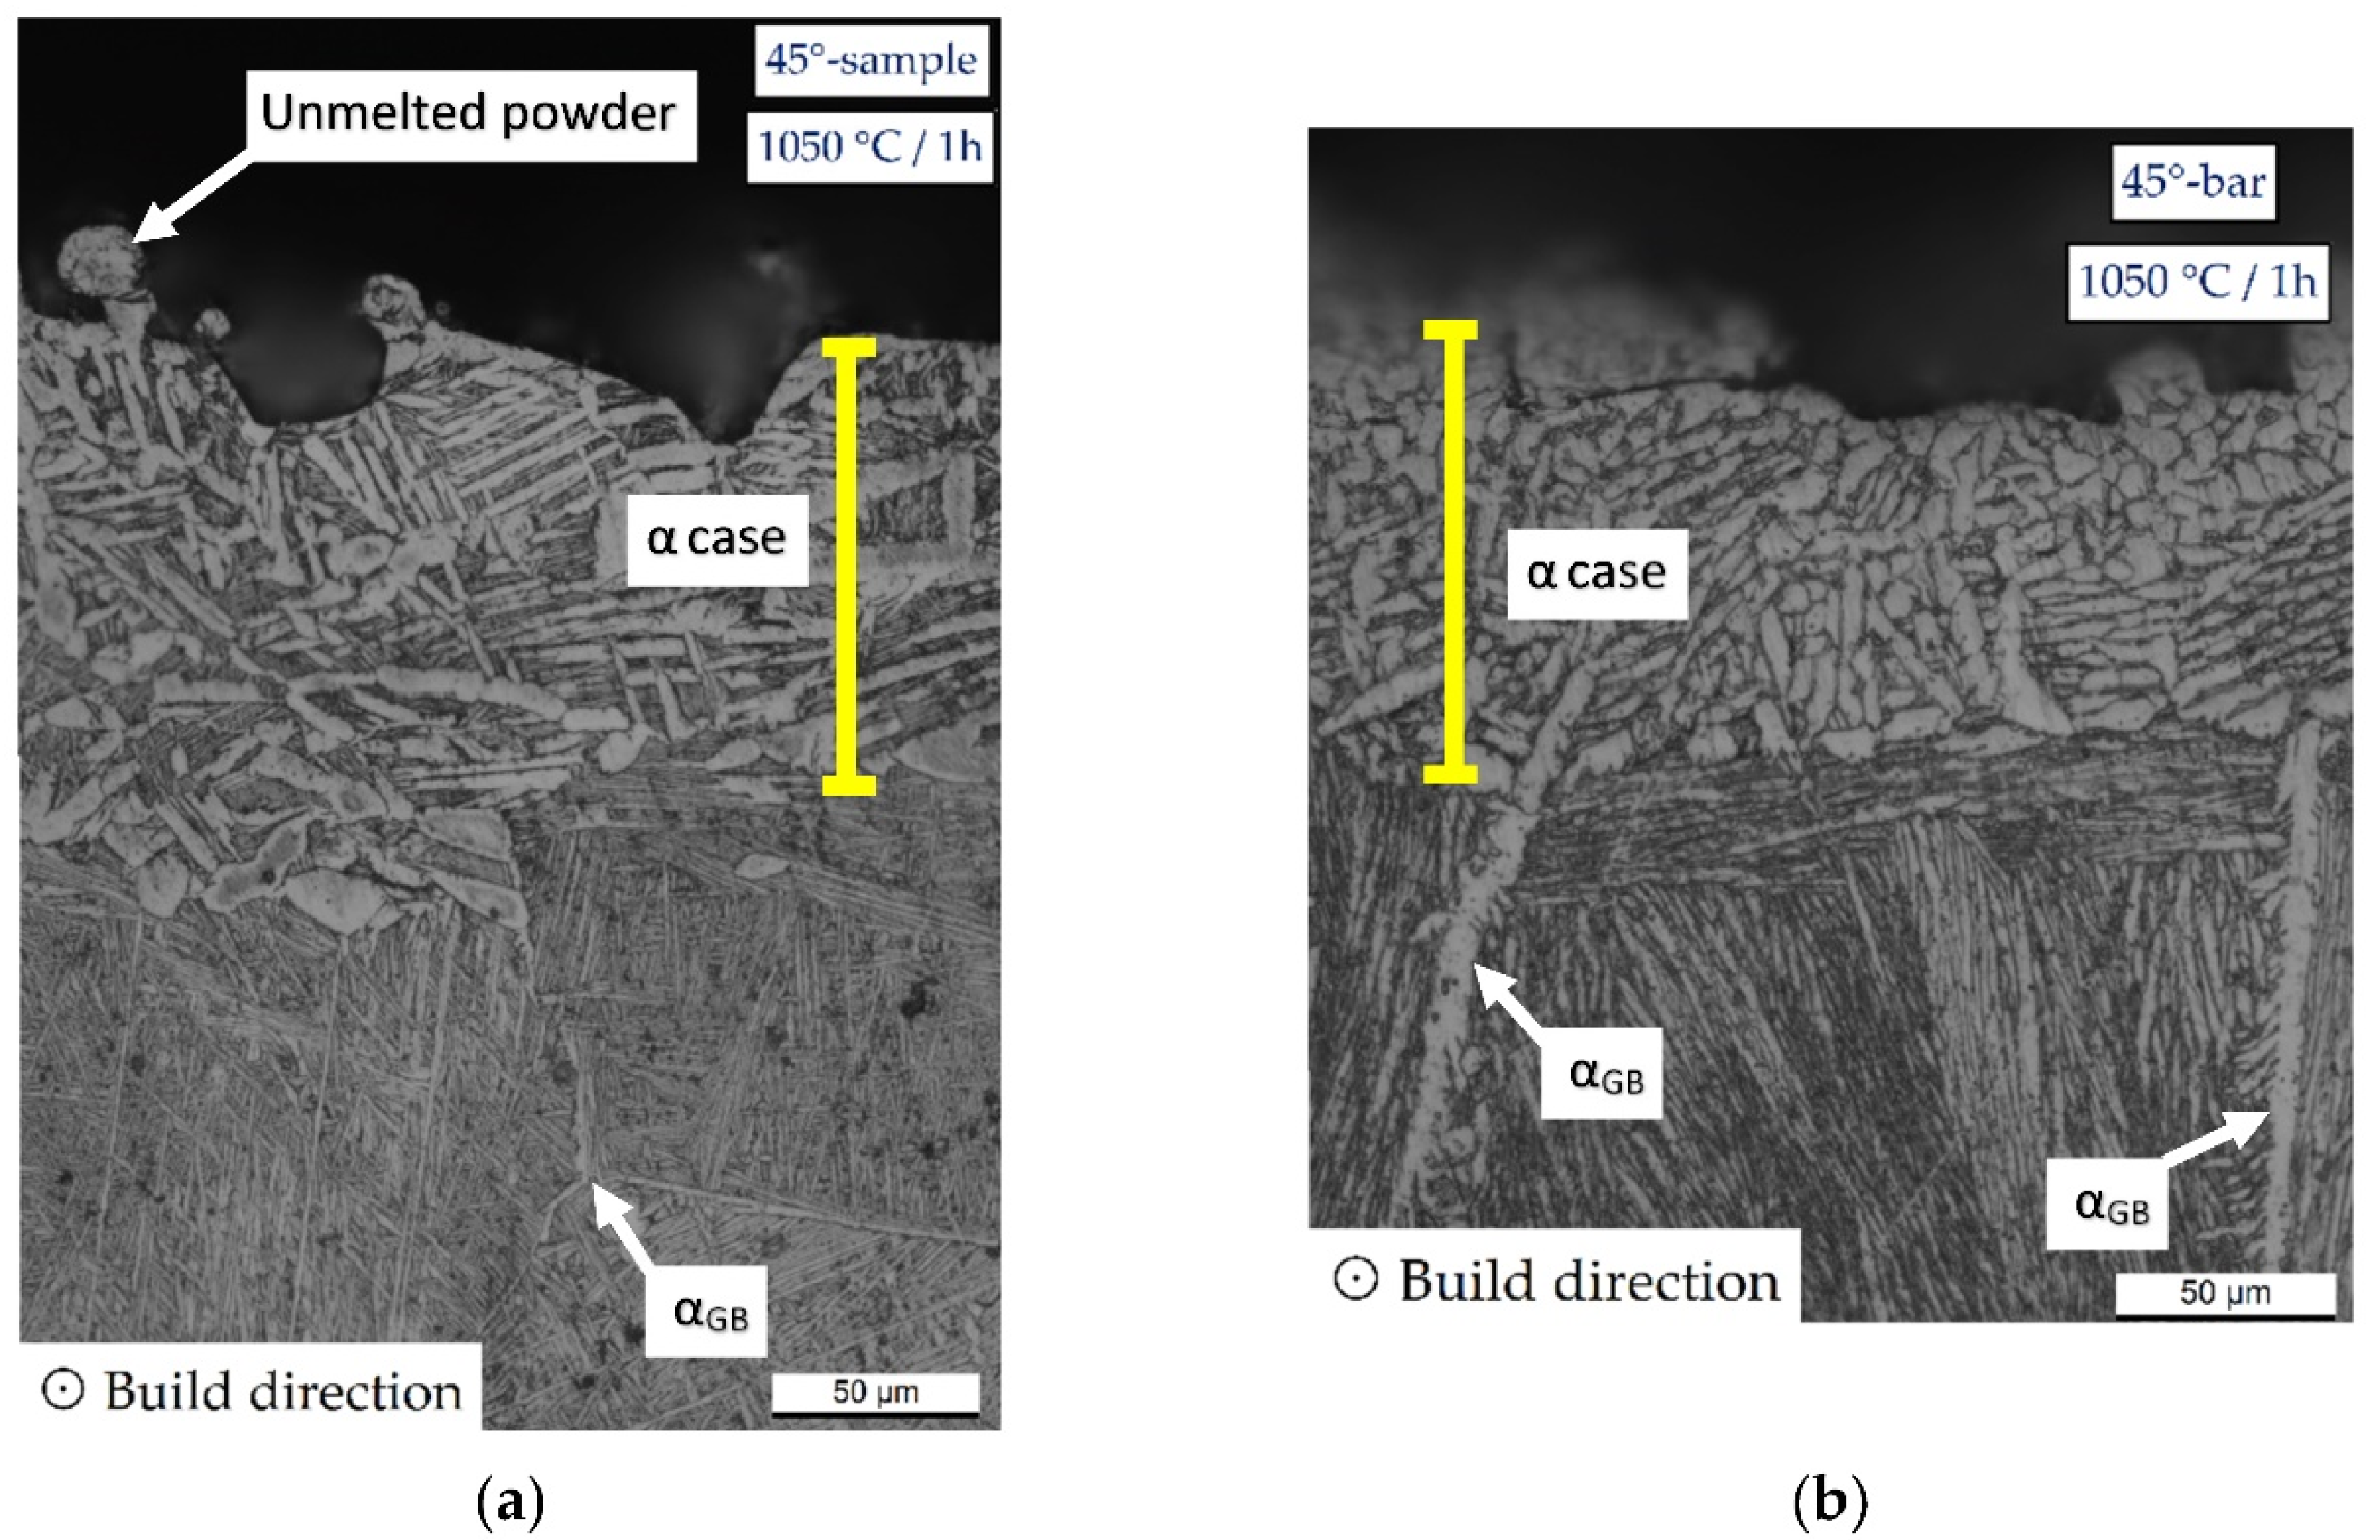
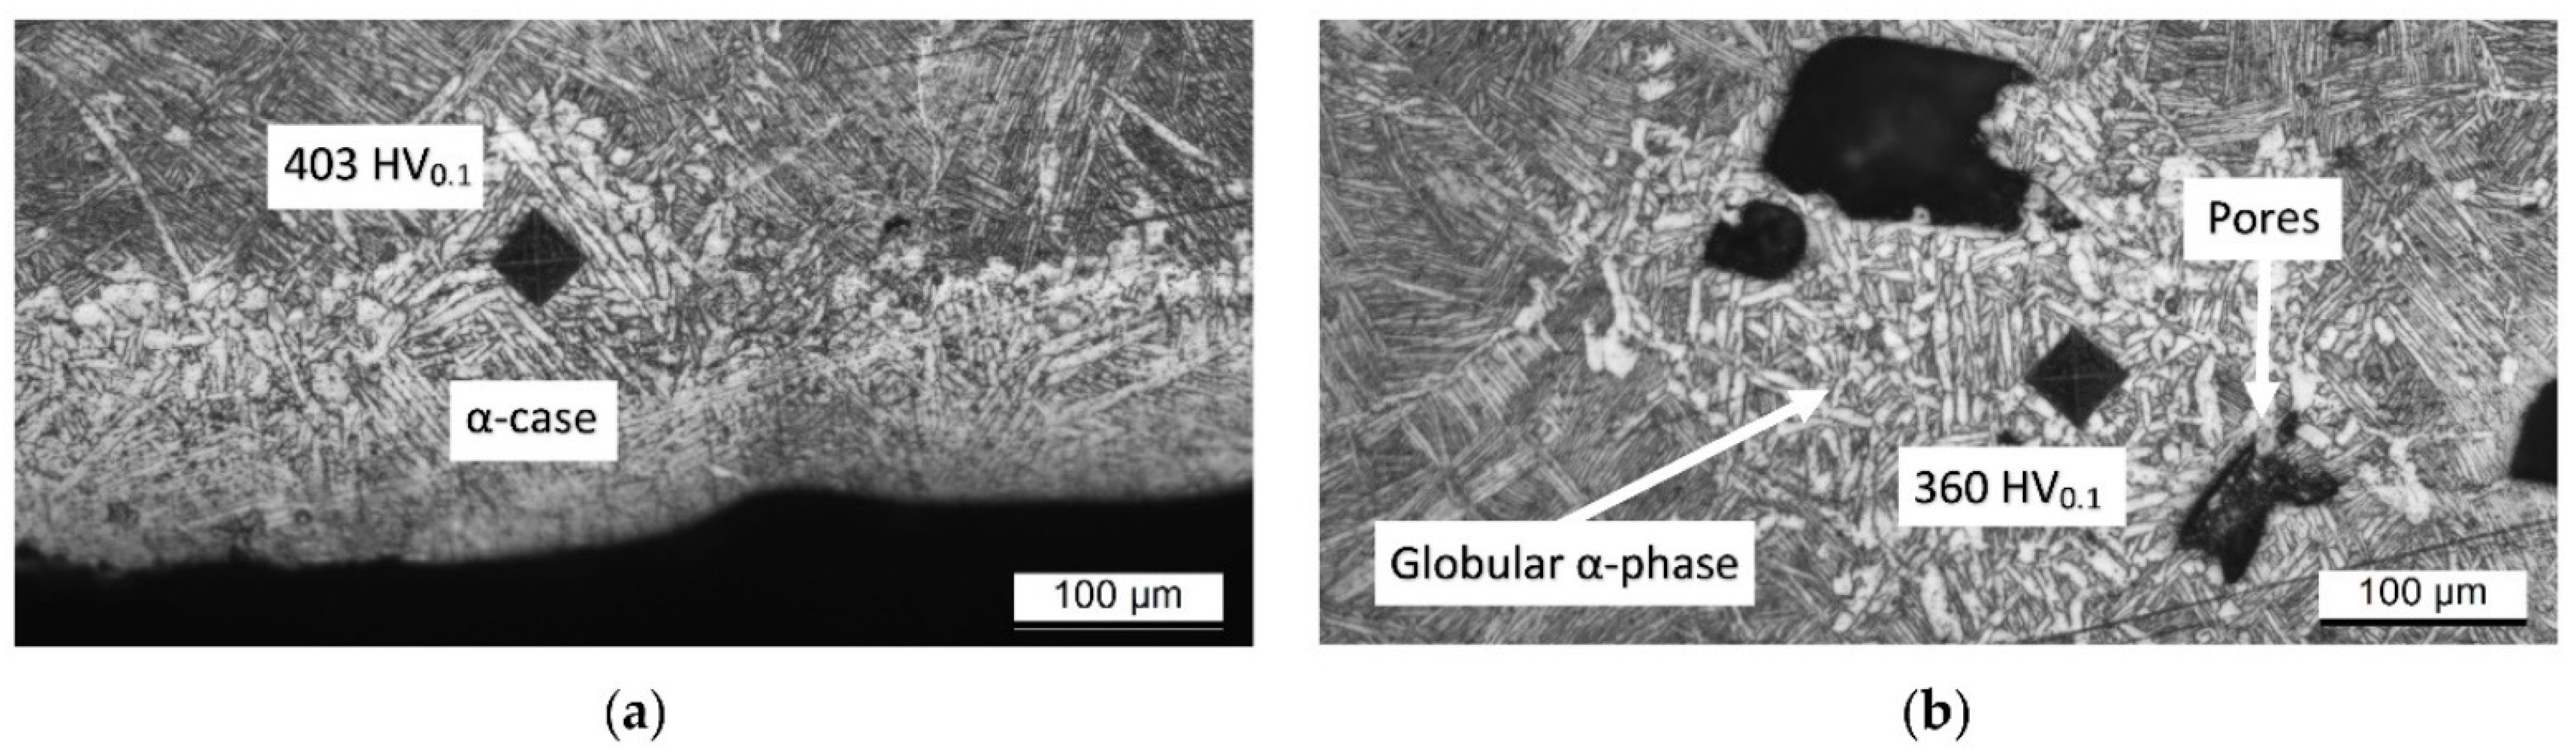
- The microstructure of samples heat-treated at 1050 °C varies in relation to the sample’s thickness. As a matter of fact, the tensile samples (6 mm) are formed by α-laths in a basketweave or Widmanstätten structure and small α-colonies within recrystallized equiaxed β-grains. Instead, bars (10 mm) are formed by wider α-colonies in a basketweave or Widmanstätten structure and globular α-phase within the same equiaxed β-grains. Moreover, in both cases, an α-case layer of about 100 ÷ 150 μm is formed on the surface.
- The samples heat-treated at 1050 °C show mechanical properties that satisfy only the ASTM F3001 standard specification. Despite the decrease in UTS and YS by about 10% and 14%, respectively, the elongation values do not show a significant increase with respect to the samples heat-treated at 704 and 740 °C, probably due to the presence of the α-case layer.
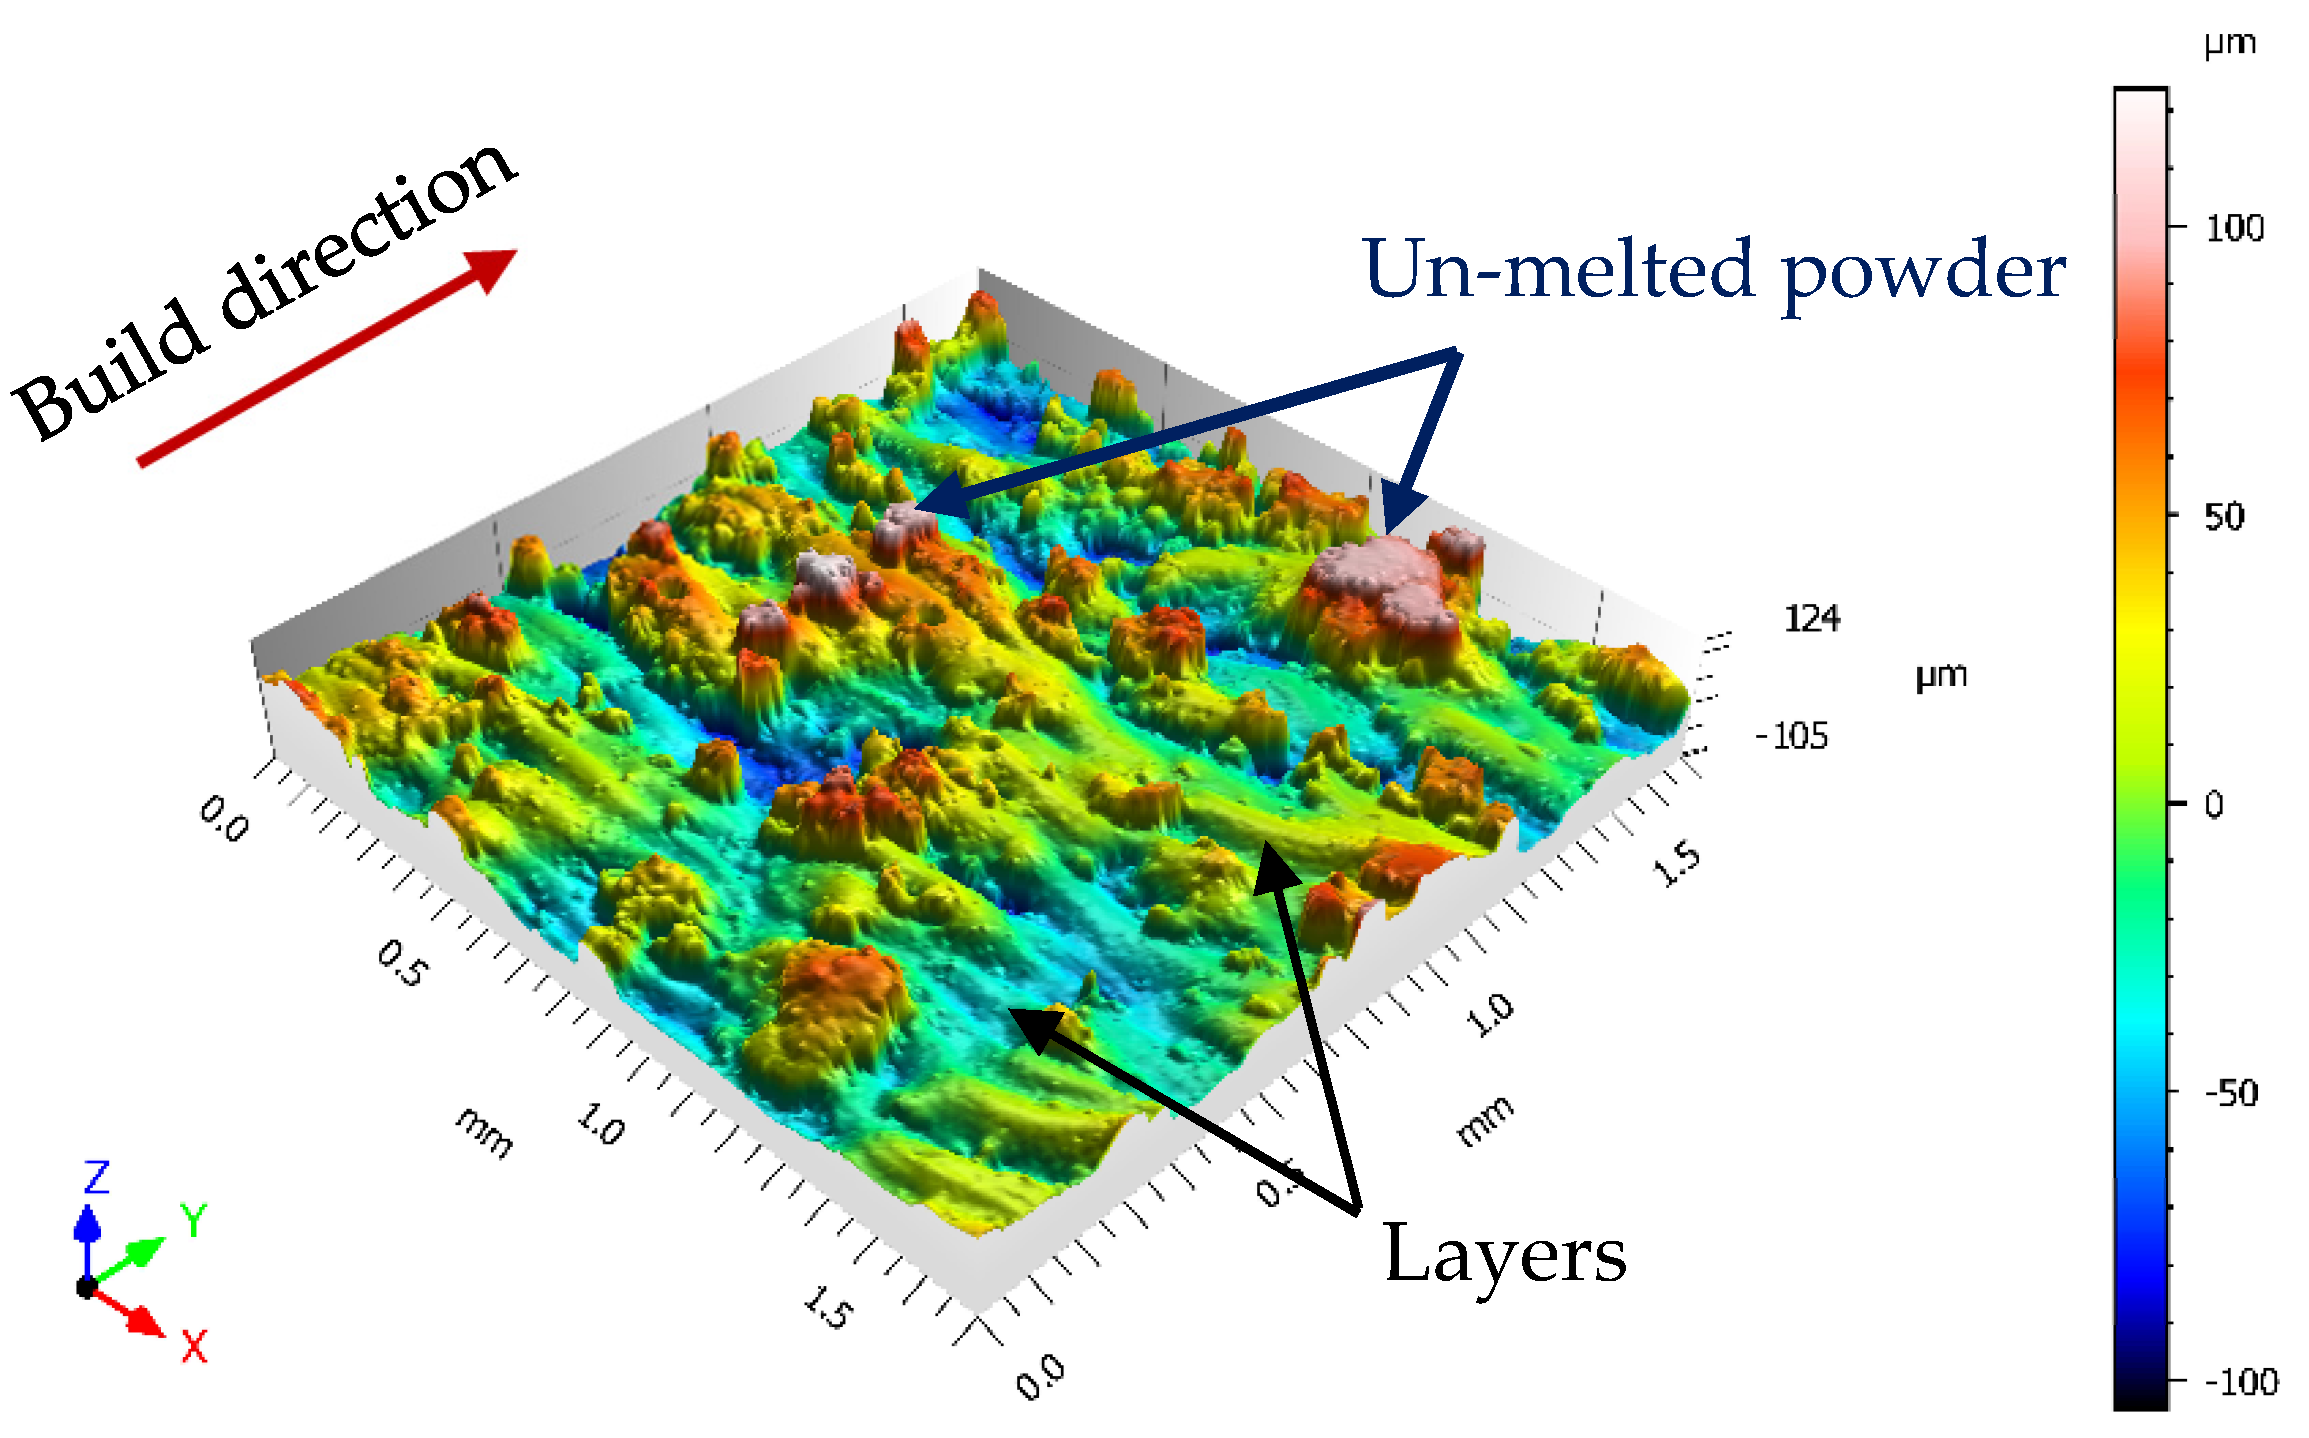
- The sandblasting process does not induce effects on the mechanical properties, but increases the plastic strain in the near-surface area. The obtained surface roughness of the sandblasted tensile sample (12 ÷ 16 μm) does not satisfy the requirements for aerospace applications.
Author Contributions
Funding
Institutional Review Board Statement
Informed Consent Statement
Data Availability Statement
Acknowledgments
Conflicts of Interest
References
- Froes, F.; Boyer, R.; Dutta, B. Introduction to aerospace materials requirements and the role of additive manufacturing. In Additive Manufacturing for Aerospace Industry, 1st ed.; Froes, F., Boyer, R., Eds.; Elsevier: Amsterdam, The Netherlands, 2017; pp. 1–6. [Google Scholar] [CrossRef]
- Rugg, D.; Dixon, M.; Burrows, J. High-temperature application of titanium alloys in gas turbines. Material life cycle opportunities and threats—An industrial perspective. Mater. High Temp. 2016, 233, 536–541. [Google Scholar] [CrossRef]
- Singh, P.; Pungotra, H.; Kalsi, N. On the characteristics of titanium alloys for the aircraft applications. Mater. Today Proc. 2017, 4, 8971–8982. [Google Scholar] [CrossRef]
- Gurrapa, I. Characterization of titanium alloy Ti-6Al-4V for chemical, marine and industrial applications. Mater. Charact. 2003, 51, 131–139. [Google Scholar] [CrossRef]
- Liu, Z.; He, B.; Lyu, T.; Zou, Y. A Review on Additive Manufacturing of Titanium Alloys for Aerospace Applications: Direct Energy Deposition and Beyond Ti-6Al-4V. JOM 2021, 73, 1804–1818. [Google Scholar] [CrossRef]
- Inagaki, I.; Takechi, T.; Shirai, Y.; Ariyasu, N. Application and Features of Titanium for the Aerospace Industry. Nippon Steel Sumimoto Met. Tech. Rep. 2014, 106, 22–27. [Google Scholar]
- Dutta, B.; Froes, F. The Additive Manufacturing (AM) of titanium alloy. Met. Powder Rep. 2017, 72, 96–106. [Google Scholar] [CrossRef]
- Allen, J. An Investigation into the Comparative Costs of Additive Manufacture vs. Machine Form Solid for Aero Engine Parts; Rolls-Royce PLC Derby: Derbyshire, UK, 2006. [Google Scholar]
- Ahmed, M.; Savvakin, D.; Ivasishin, O.; Pereloma, E. The effect of ageing on microstructure and mechanical properties of powder Ti-5Al-5Mo-5V-1Cr-1Fe alloy. Mater. Sci. Eng. A 2014, 605, 89–97. [Google Scholar] [CrossRef] [Green Version]
- Sun, H.; Chu, X.; Liu, Z.; Gisele, A.; Zou, Y. Selective Laser Melting of Maraging Steels Using Recycled Powders: A Comprehensive Microstructural and Mechanical Investigation. Metall. Mater. Trans. A 2021, 52, 1714–1722. [Google Scholar] [CrossRef]
- Watson, J.; Taminger, K. A decision-support model for selective additive manufacturing versus subtractive manufacturing based on energy consumption. J. Clean. Prod. 2018, 176, 1316–1322. [Google Scholar] [CrossRef] [PubMed]
- Ghio, E.; Cerri, E. Additive Manufacturing of AlSi10Mg and Ti6Al4V lightweight alloys via Laser Powder Bed Fusion: A review of heat treatments effects. Materials 2022, 15, 2047. [Google Scholar] [CrossRef] [PubMed]
- ASTM 52900:2015(E); Standard Terminology for Additive Manufacturing-General Principles-Terminology. ASTM: West Conshohocken, PA, USA, 2000.
- Gibbons, D.; Serfontein, J.-P.L.; van der Merwe, A.F. Mapping the path to certification of metal laser powder bed fusion for aerospace applications. Rapid Prototyp. J. 2021, 27, 355–361. [Google Scholar] [CrossRef]
- Tang, M.; Pistorius, P.; Beuth, J.L. Prediction of a lack-of-fusion porosity for powder bed fusion. Addit. Manuf. 2017, 14, 39–48. [Google Scholar] [CrossRef]
- Schwerz, C.; Nyborg, L. Linking In Situ Molten Pool Monitoring to Melt Size Distributions and Internal Flaws in Laser Powder Bed Fusion. Metals 2021, 11, 1856. [Google Scholar] [CrossRef]
- He, Y.; Montgomery, C.; Beuth, J.; Webler, B. Melt pool geometry and microstructure of Ti6Al4V with B additions processed by selective laser melting additive manufacturing. Mater. Des. 2019, 183, 108126. [Google Scholar] [CrossRef]
- Karayagiz, K.; Elwany, A.; Tapia, G.; Franco, B.; Johnson, L.; Ma, J.; Karaman, I.; Arróyane, R. Numerical and experimental analysis of heat distribution in the laser powder bed fusion of Ti-6Al-4V. IISE Trans. 2019, 51, 136–152. [Google Scholar] [CrossRef]
- Boyer, R.; Welsch, G.; Colling, E.W. Materials Properties: Handbook; ASM International: Geauga County, OH, USA, 1994. [Google Scholar]
- ASTM F3001-14; Standard Specification for Additive Manufacturing Titanium-6 Aluminium-4 Vanadium ELI (Extra Low Interstitial) with Powder Bed Fusion. ASTM: West Conshohocken, PA, USA, 2013.
- Saboori, A.; Gallo, D.; Biamino, S.; Fino, P.; Lombardi, M. An Overview of Additive Manufacturing of Titanium Components by Direct Energy Deposition: Microstructure and Mechanical Properties. Appl. Sci. 2017, 7, 883. [Google Scholar] [CrossRef] [Green Version]
- Bontha, S.; Klingbeil, N.; Kobrin, P.; Fraser, H. Thermal process maps for prediction solidification microstructure in laser fabrication of thin-wall structures. J. Mater. Proc. Technol. 2006, 178, 135–142. [Google Scholar] [CrossRef]
- Ali, H.; Ma, L.; Ghadbeigi, H.; Mumtaz, K. In-situ residual stress reduction, martensitic decomposition and mechanical properties enhancement through high temperature powder bed pre-heating of selective laser melted Ti6Al4V. Mater. Sci. Eng. A 2017, 695, 211–220. [Google Scholar] [CrossRef]
- Barriobero-Vila, P.; Gussone, J.; Haubrick, J.; Sandloebes, S.; Da Silva, J.; Cloentes, P.; Schell, N.; Raquerra, C. Inducing Stable α+β Microstructure During Selective Laser Melting of Ti-6Al-4V Using Intensified Intrinsic Heat Treatment. Materials 2017, 10, 268. [Google Scholar] [CrossRef]
- Xu, W.; Brandt, M.; Sun, S.; Elambasseril, J.; Liu, Q.; Latham, K.; Xia, K.; Qian, M. Additive manufacturing of string and ductile Ti-6Al-4V by selective laser melting via in situ martensite decomposition. Acta Mater. 2015, 85, 74–84. [Google Scholar] [CrossRef]
- Kaschel, F.; Vijayaraghavan, R.; Shmeliov, A.; McCarthy, E.; Canavan, M.; McNally, P.; Dowling, D.; Nicolosi, V.; Celikin, M. Mechanism of stress relaxation and phase transformation in additively manufactured Ti-6Al-4V via in-situ high temperature XRD and TEM analyses. Acta Mater. 2020, 188, 720–732. [Google Scholar] [CrossRef]
- Xing, L.; Zhang, W.-J.; Zhao, C.-C.; Gao, W.-Q.; Shen, Z.-J.; Liu, W. Influence of Powder Bed Temperature on the Microstructure Mechanical Properties of Ti-6Al-4V Alloy Fabricated via Laser Powder Bed Fusion. Materials 2021, 14, 2278. [Google Scholar] [CrossRef]
- Illarinov, A.; Stepanov, S.; Demakov, S. Effect of Thermomechanical Treatment Parameters on Structure, Phase Composition and Mechanical Properties of Ti-3Al-5Mo-4.5V Titanium Alloy. In Proceedings of the IOP Conference Series: Materials Science and Engineering, Chelyabinsk, Russia, 22–24 September 2020. [Google Scholar] [CrossRef]
- Haar, G.; Becker, T. Selective Laser Melting Produced Ti-6Al-4V: Post-Process Heat Treatments to Achieve Superior Tensile Properties. Materials 2018, 11, 146. [Google Scholar] [CrossRef] [PubMed] [Green Version]
- Sabban, R.; Bahl, S.; Chatterjee, K.; Suwas, S. Globularization using heat treatment in additively manufactured Ti-6Al-4V for high strength and toughness. Acta Mater. 2019, 162, 239–254. [Google Scholar] [CrossRef]
- Muhammad, M.; Pegeus, J.; Shamsei, N.; Haghshenas, M. Effect of heat treatments on microstructure/small-scale properties of additive manufactured Ti-6Al-4V. Int. J. Manuf. Technol. 2019, 103, 4161–4172. [Google Scholar] [CrossRef]
- Huang, Q.; Liu, X.; Yang, X.; Zhang, R.; Shen, Z.; Feng, Q. Specific heat treatment of selective laser melted Ti-6Al-4V for biomedical applications. Front. Mater. Sci. 2015, 9, 373–381. [Google Scholar] [CrossRef]
- Lekoadi, P.; Tlotleng, M.; Annan, K.; Maledi, N.; Masina, B. Evaluation of Heat Treatment Parameters on Microstructure and Hardness Properties of High-Speed Selective Laser Melted Ti6Al4V. Metals 2021, 11, 255. [Google Scholar] [CrossRef]
- Jaber, H.; Kónya, J.; Kulcsár, K.; Kovács, T. Effects of Annealing and Solution Treatments on the Microstructure and Mechanical Properties of Ti6Al4V Manufactured by Selective Laser Melted. Materials 2022, 15, 1978. [Google Scholar] [CrossRef]
- Liu, S.; Shin, Y. Additive manufacturing of Ti6Al4V alloy: A review. Mater. Des. 2019, 164, 107552. [Google Scholar] [CrossRef]
- Bai, H.; Deng, H.; Chen, L.; Liu, X.; Qin, X.; Zhang, D.; Liu, T.; Cui, X. Effect of Heat Treatment on the Microstructure and Mechanical Properties of Selective Laser-Melted Ti64 and Ti-5Al-5Mo-5V-1Cr-1Fe. Metals 2021, 11, 534. [Google Scholar] [CrossRef]
- Tennant, R. Mechanical Surface in the Aerospace Industry. Aircr. Eng. Aerosp. Technol. 1992, 64, 4–14. [Google Scholar] [CrossRef]
- Bower, K.; Murray, S.; Reinhart, A.; Nieto, A. Corrosion resistance of selective laser melted Ti-6Al-4V alloy in salt fog environment. Res. Mater. 2020, 8, 100122. [Google Scholar] [CrossRef]
- Croll, S. Surface roughness profile and its effect on coating adhesion and corrosion protection: A review. Prog. Org. Coat. 2020, 148, 105847. [Google Scholar] [CrossRef]
- Günter, J.; Krewerth, D.; Lippmann, T.; Leuders, S.; Tröster, T.; Weidne, A.; Biermann, H.; Niendorf, T. Fatigue life of additively manufactured Ti-6Al-4V in the very high cycle fatigue regime. Int. J. Fatigue 2017, 94, 236–245. [Google Scholar] [CrossRef]
- Zhang, H.; Dong, D.; Su, S.; Chen, A. Experimental study of effect of post processing on fracture toughness and fatigue crack growth performance of selective laser melting Ti-6Al-4V. Chin. J. Aeronaut. 2019, 32, 2383–2393. [Google Scholar] [CrossRef]
- Möller, H.; Curle, U. Fatigue and Fracture Toughness of Ti-6Al-4V Titanium Alloy Manufactured by Selective Laser Melting. Adv. Mater. Res. 2014, 1019, 248–253. [Google Scholar] [CrossRef]
- Gallaraga, H.; Lados, D.; Dehoff, R.; Kirka, M.; Nandwana, P. Effect of the microstructure and porosity of Ti-6Al-4V ELI alloy fabricated by electron beam melting (EBM). Addit. Manuf. 2016, 10, 45–57. [Google Scholar] [CrossRef] [Green Version]
- Tiley, J.; Searles, T.; Lee, E.; Kar, S.; Banerjee, R.; Russ, J.; Fraser, H. Quantification of microstructural features in α/β titanium alloys. Mater. Sci. Eng. A 2004, 372, 191–198. [Google Scholar] [CrossRef]
- Eshawish, N.; Malinov, S.; Sha, W.; Wallas, P. Microstructure and Mechanical Properties of Ti-6Al-4V Manufactured by Selective Laser Melting after Stress Relieving, Hot Isostatic Pressing Treatment, and Post-Heat Treatment. J. Mater. Eng. Perform. 2021, 30, 5290–5296. [Google Scholar] [CrossRef]
- Vilaro, T.; Colin, C.; Bartout, J. As-fabricated and Heat-treated microstructures of the Ti-6Al-4V alloy processed by Selective Laser Melting. Mater. Trans. A 2011, 42, 3190–3199. [Google Scholar] [CrossRef]
- Qiao, Y.; Xu, D.; Wnag, S.; Ma, Y.; Chen, J.; Wnag, Y.; Zhou, H. Corrosion and Tensile Behaviors of Ti-6Al-2V-1Mo-1Fe and Ti-6Al-4V Titanium Alloys. Metals 2019, 9, 1213. [Google Scholar] [CrossRef] [Green Version]
- Cao, S.; Chen, Z.; Lim, C.; Yang, K.; Jia, Q.; Jarvis, T.; Tomus, D.; Wu, X. Defect, Microstructure, and Mechanical Property of Ti-6Al-4V Alloy Fabricated by High-Power Selective Laser Melting. JOM 2017, 96, 2684–2692. [Google Scholar] [CrossRef]
- Seth, P.; Jha, J.; Alankar, A.; Mishra, S. Alpha-case Formation in Ti-6Al-4V in a Different Oxidizing Environment and Its Effect on Tensile and Fatigue Crack Growth Behavior. Oxid. Met. 2022, 97, 77–95. [Google Scholar] [CrossRef]
- Nie, B.; Zhao, Z.; Chen, D.; Liu, S.; Lu, M.; Zhang, J.; Liang, F. Effect of Basketweave Microstructure on Very High Cycle Fatigue Behavior of TC21 Titanium Alloy. Metals 2018, 8, 401. [Google Scholar] [CrossRef] [Green Version]
- Ahmed, T.; Rack, H. Phase transformations during cooling in α+β titanium alloys. Mater. Sci. Eng. A 1998, 243, 206–211. [Google Scholar] [CrossRef]
- Chicos, L.-A.; Zaharia, S.; Lancea, C.; Pop, M.; Cañadas, I.; Rodrìguez, J.; Galindo, J. Concentrated solar energy used for heat treatment of Ti6Al4V alloy manufactured by selective laser melting. Solar Energy 2018, 173, 76–88. [Google Scholar] [CrossRef]
- Zhao, X.-A.; So, F.; Nicolet, N.-A. TiAl3 formation by furnace annealing of Ti/Al bilayers and the effects of impurities. J. Appl. Phys. 1988, 63, 2600–2607. [Google Scholar] [CrossRef] [Green Version]
- Ohnuma, I.; Fujita, Y.; Mitsui, H.; Ishikawa, K.; Kainuma, R.; Ishida, K. Phase equilibria in the Ti-Al binary system. Acta Mater. 2000, 48, 3113–3123. [Google Scholar] [CrossRef]
- Antonisamy, A.; Meyer, J.; Prangnell, P. Effect of build geometry on the β-grains structure and texture in additive manufacture of Ti-6Al-4V by selective electrons beam melting. Mater. Charact. 2015, 632, 505–513. [Google Scholar] [CrossRef]
- Wang, T.; Zhou, Y.; Zhang, S.; Tang, H.; Wang, H. Grain morphology evolution behaviour of titanium alloy components during laser melting deposition additive manufacturing. J. Alloys Compd. 2021, 13, 1159–1168. [Google Scholar] [CrossRef]
- Qi, M.; Huang, S.; Ma, Y.; Youssef, S.; Zhang, R.; Qiu, J.; Lei, J.; Yang, R. Columnar to equiaxed transition during β heat treatment in a near β alloy by laser additive manufacture. J. Mater. Res. Technol. 2021, 13, 1159–1168. [Google Scholar] [CrossRef]
- Sui, Q.; Li, P.; Wnak, K.; Yin, X.; Liu, L.; Zhang, Y.; Zhang, Q.; Wang, S.; Wang, L. Effect of Build Orientation on the Corrosion Behavior and Mechanical Properties of Selective Laser Melted Ti-6Al-4V. Metals 2019, 9, 976. [Google Scholar] [CrossRef] [Green Version]
- Salsi, E.; Chiumenti, M.; Cervera, M. Modeling of Microstructure Evolution of Ti6Al4V for Additive Manufacturing. Metals 2018, 8, 633. [Google Scholar] [CrossRef] [Green Version]
- Yang, J.; Yu, H.; Yin, J.; Gao, M.; Wang, Z.; Zeng, X. Formation and control of martensite in Ti-6Al-4V alloy processed by selective laser melting. Mater. Des. 2016, 108, 308–318. [Google Scholar] [CrossRef]
- Pantawane, M.; Ho, Y.; Joshi, S.; Dahotre, N. Computational Assessment of Thermokinetics and Associated Microstructural Evolution in Laser Powder Bed Fusion Manufacturing of Ti6Al4V Alloy. Sci. Rep. 2020, 10, 7579. [Google Scholar] [CrossRef] [PubMed]
- Spigarelli, S.; Paoletti, C.; Cabibbo, M.; Cerri, E.; Santecchia, E. On the creep performance of the Ti-6Al-4V alloy processed by additive manufacturing. Addit. Manuf. 2022, 49, 102520. [Google Scholar] [CrossRef]
- Simonelli, M.; Tse, Y.Y.; Tuck, C. Effect of the building orientation on the mechanical properties and fracture modes of SLM Ti-6Al-4V. Mater. Sci. Eng. A 2014, 616, 1–11. [Google Scholar] [CrossRef] [Green Version]
- Hartunian, P.; Eshraghi, M. Effect of Build Orientation on the Microstructure and Mechanical Properties of Selective Laser-Melted Ti-6Al-4V Alloy. J. Manuf. Mater. Process. 2018, 2, 69. [Google Scholar] [CrossRef] [Green Version]
- Bartsch, K.; Hergoz, D.; Bossen, B.; Emmelmann, C. Material modelling of Ti-6Al-4V processed by laser powder bed fusion for application for application in macro-scale process simulation. Mater. Sci. Eng. A 2021, 814, 141237. [Google Scholar] [CrossRef]
- Wu, S.; Lu, Y.; Gan, Y.; Huang, T.; Zhao, C.; Lin, J.; Guo, S.; Lin, J. Microstructural evolution and microhardness of selective-laser-melted Ti-6Al-4V alloy after post heat treatments. J. Alloys Compd. 2016, 672, 643–652. [Google Scholar] [CrossRef]
- Jha, J.S.; Toppo, S.P.; Singh, R.; Tewari, A.; Mishra, S.K. Deformation behavior of Ti-6Al-4V microstructures under uniaxial loading: Equiaxed Vs. transformed-β microstructures. Mater. Charact. 2021, 171, 110780. [Google Scholar] [CrossRef]
- Vrancken, B.; Thijs, L.; Kruth, J.; Humbeeck, J. Heat treatments of Ti6Al4V produced by Selective Laser Melting: Microstructure and mechanical properties. J. Alloy. Compd. 2012, 541, 177–185. [Google Scholar] [CrossRef] [Green Version]
- Leuders, S.; Lieneke, T.; Lammers, S.; Tröster, T.; Niendorf, T. On the fatigue properties of metals manufactured by selective laser melting—The role of ductility. J. Mater. Res. 2014, 29, 1911–1919. [Google Scholar] [CrossRef]
- ASTM F2924-12; Standard Specification for Additive Manufacturing Titanium-6 Aluminium-4 Vanadium with Powder Bed Fusion. ASTM: West Conshohooken, PA, USA, 2013.
- Ji, Y.; Heo, T.; Zhang, F.; Chen, L. Theoretical Assessment on the Phase Transformation Kinetic Pathways of Multi-Component Alloys: Application to Ti-6Al-4V. J. Phase Equilibria Diffus. 2016, 54, 149–158. [Google Scholar] [CrossRef]
- Sallica-Leva, E.; Caram, R.; Jardini, A.; Fagagnolo, J. Ductility improvement due to martensite α’ decomposition in porous Ti-6Al-4V parts produced by selective laser melting for orthopedic implants. J. Mech. Behav. Biomed. Mater. 2016, 54, 149–158. [Google Scholar] [CrossRef] [PubMed]
- Cao, S.; Chu, R.; Zhou, X.; Yang, K.; Jia, Q.; Lim, C.S.; Huang, A.; Wu, X. Role of martensite decomposition in tensile properties of selective laser melted Ti-6Al-4V. J. Alloy. Compd. 2018, 744, 357–363. [Google Scholar] [CrossRef]
- Sieniawski, J.; Ziaja, W.; Kubiac, K.; Motyka, M. Microstructure and Mechanical Properties of High-Strength Two-Phase Titanium Alloys. In Titanium Alloys—Advances in Properties Control; Sieniawski, J., Ziaja, W., Eds.; IntechOpen: London, UK, 2013. [Google Scholar] [CrossRef] [Green Version]
- Gallaraga, H.; Warren, R.; Lados, D.; Dehoff, R.; Kirka, M.; Nandwana, P. Effects of heat treatments on microstructure and properties od Ti-6Al-4V ELI alloys fabricated by electron beam melting (EBM). Mater. Sci. Eng. A 2017, 685, 417–428. [Google Scholar] [CrossRef] [Green Version]
- Guo, Z.; Malinov, S.; Sha, W. Modelling beta transus temperature of titanium alloys using artificial neural network. Comput. Mater. Sci. 2005, 32, 1–12. [Google Scholar] [CrossRef]
- Kolachev, B.; Egorova, Y.; Belova, S. Relation between the temperature of the α + β → β transformation of commercial titanium alloys and their chemical composition. Met. Sci. Heat Treat. 2008, 50, 367–372. [Google Scholar] [CrossRef]
- Bagehorn, S.; Wehr, J.; Maier, H. Application of mechanical surface finishing processes for roughness reduction and fatigue improvement of additvely manufactured Ti-6Al-4V parts. Int. J. Fatigue 2017, 102, 135–142. [Google Scholar] [CrossRef]


| Elements | Ti | Al | V | C | Fe | O | N | H | Y |
|---|---|---|---|---|---|---|---|---|---|
| wt.% | Bal. | 6.47 | 4.06 | 0.01 | 0.21 | 0.09 | 0.01 | 0.001 | <0.001 |
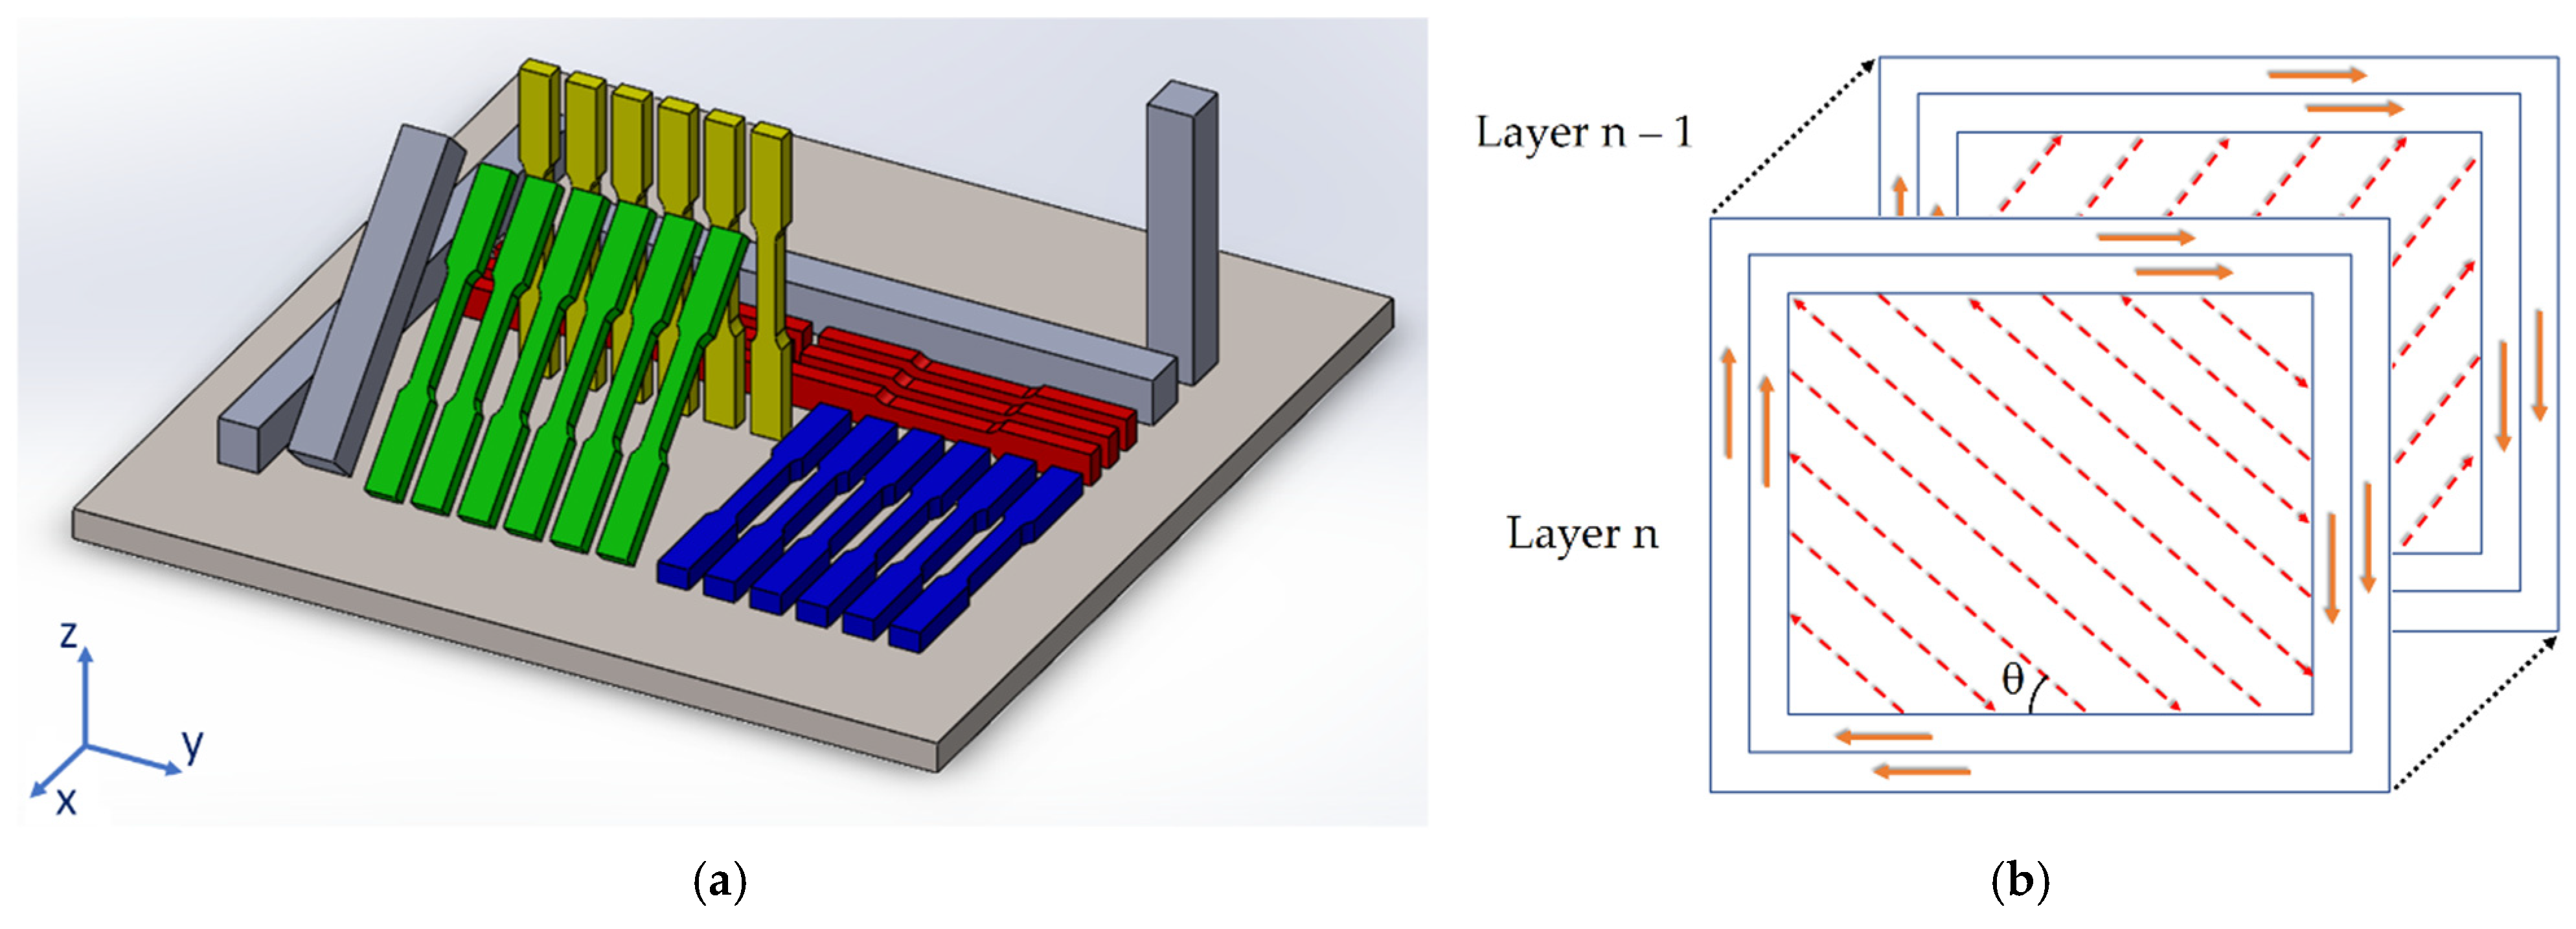
| Samples | Nomenclature | Color | Length (mm) | Width (mm) | Thickness (mm) | Cross-Section Area (mm2) |
|---|---|---|---|---|---|---|
| Tensile sample | 0°XZ-sample | Blue | 10.0 1 | 6.0 ± 0.1 1 | 6.0 1 | 36 |
| 0°XY-sample | Red | |||||
| 45°-sample | Green | |||||
| 90°Z-sample | Yellow | |||||
| Bars | 0°XZ-bar | Grey | 25 | 15 | 15 | 225 |
| 0°XY-bar | ||||||
| 45°-bar | 10 | |||||
| 90°Z-bar |
| Spectrum | Ti | Al | V | Fe | Phase |
|---|---|---|---|---|---|
| A | 91.6 | 7.2 | 1.2 | - | α |
| B | 89.9 | 2.0 | 7.9 | 0.2 | β |
| Heat Treatments | No-SB | SB | ||||
|---|---|---|---|---|---|---|
| UTS [MPa] | YS [MPa] | ε [%] | UTS [MPa] | YS [MPa] | ε [%] | |
| 704 °C/120′ | 1034 ± 18 | 948 ± 28 | 10.58 ± 0.69 | 1035 ± 5 | 964 ± 9 | 11.85 ± 0.5 |
| 740 °C/120′ | 1025 ± 10 | 960 ± 10 | 11.05 ± 0.49 | 1022 ± 7 | 957 ± 7 | 11.53 ± 0.35 |
| 1050 °C/60′ | 918 ± 7 | 818 ± 7 | 12.75 ± 1.01 | 919 ± 3 | 820 ± 11 | 10.65 ± 0.21 |
| Heat Treatments | 0°XZ- | 0°XY- | 45°- | 90°Z- | ||||||||
|---|---|---|---|---|---|---|---|---|---|---|---|---|
| Sample | Bar | Sample | Bar | Sample | Bar | Sample | Bar | |||||
| xz Plane | xy Plane | xz Plane | xy Plane | xz Plane | xy Plane | xz Plane | xy Plane | |||||
| 704 °C/120′ | 387 ± 12 | 381 ± 15 | 374 ± 10 | 390 ± 10 | 379 ± 20 | 371 ± 19 | 381 ± 11 | 382 ± 10 | 368 ± 18 | 386 ± 6 | 381 ± 19 | 377 ± 15 |
| 740 °C/130′ | 375 ± 10 | 376 ± 17 | 361 ± 14 | 374 ± 6 | 370 ± 24 | 365 ± 21 | 372 ± 12 | 380 ± 12 | 370 ± 18 | 368 ± 10 | 374 ± 20 | 360 ± 18 |
| 1050 °C/60′ | 338 ± 5 | 341 ± 9 | 341 ± 8 | 336 ± 12 | 345 ± 8 | 343 ± 7 | 340 ± 9 | 339 ± 10 | 342 ± 8 | 339 ± 8 | 342 ± 5 | 348 ± 8 |
Publisher’s Note: MDPI stays neutral with regard to jurisdictional claims in published maps and institutional affiliations. |
© 2022 by the authors. Licensee MDPI, Basel, Switzerland. This article is an open access article distributed under the terms and conditions of the Creative Commons Attribution (CC BY) license (https://creativecommons.org/licenses/by/4.0/).
Share and Cite
Cerri, E.; Ghio, E.; Bolelli, G. Ti6Al4V-ELI Alloy Manufactured via Laser Powder-Bed Fusion and Heat-Treated below and above the β-Transus: Effects of Sample Thickness and Sandblasting Post-Process. Appl. Sci. 2022, 12, 5359. https://doi.org/10.3390/app12115359
Cerri E, Ghio E, Bolelli G. Ti6Al4V-ELI Alloy Manufactured via Laser Powder-Bed Fusion and Heat-Treated below and above the β-Transus: Effects of Sample Thickness and Sandblasting Post-Process. Applied Sciences. 2022; 12(11):5359. https://doi.org/10.3390/app12115359
Chicago/Turabian StyleCerri, Emanuela, Emanuele Ghio, and Giovanni Bolelli. 2022. "Ti6Al4V-ELI Alloy Manufactured via Laser Powder-Bed Fusion and Heat-Treated below and above the β-Transus: Effects of Sample Thickness and Sandblasting Post-Process" Applied Sciences 12, no. 11: 5359. https://doi.org/10.3390/app12115359
APA StyleCerri, E., Ghio, E., & Bolelli, G. (2022). Ti6Al4V-ELI Alloy Manufactured via Laser Powder-Bed Fusion and Heat-Treated below and above the β-Transus: Effects of Sample Thickness and Sandblasting Post-Process. Applied Sciences, 12(11), 5359. https://doi.org/10.3390/app12115359