Abstract
Because of the resilient frame structure, the factor graph is often used in navigation systems to solve the sensor asynchrony problem and realize plug-and-play effectively in the navigation information fusion method. To improve the fault detection performance of resilient integrated navigation systems under complex interference environments, a fault detection method in factor graph navigation framework based on INS measurements and GNSS pseudo-range measurements is proposed in this paper. The proposed method can effectively locate the fault satellite pseudo-range information based on the Chi-square fault detection method. Due to the plug-and-play characteristic of the factor graph framework, this method can quickly isolate faults to improve navigation accuracy. Finally, the effect of the method is verified by simulation and experiment. Compared with the Chi-square fault detection method, positioning accuracy is improved by more than 40%.
1. Introduction
Navigation and positioning are necessary capabilities for autonomous systems to complete remote tasks [1]. Global navigation satellite system (GNSS) provides high-precision positioning, navigation and timing (PNT) services. Based on the association and integration of satellite navigation systems and other industries, GNSS has become the technical support of the modern information industry, big data service and artificial intelligence technology. An autonomous navigation system with a flexible framework and that is suitable for a variety of environments is closely related to modern science, economy and society. Building resilient navigation systems is the future development trend of the autonomous navigation system, which ensures that users can continuously obtain high-quality PNT information in a complex environment.
Due to the respective shortcomings of INS and GNSS, the positioning and attitude of autonomous vehicles are estimated generally by fusing multi-sensor information from inertial navigation system (INS), GNSS and other sensors [2,3]. Due to environmental disturbance or carrier vibration, the sensors of autonomous vehicles are prone to more significant errors or even faults [4]. Under the influence of vehicle fluctuation, the error of the inertial navigation system will increase suddenly, and even calculation failure will occur. GNSS signals are vulnerable to electromagnetic interference [5]. If fault information is not processed, the fault measurement will pollute the results of fused navigation and positioning states. Therefore, effective fault detection and isolation methods and robust navigation estimation under unknown interference are important for autonomous system safety.
Because of the advantages of the plug-and-play capability and its resilient structure, the factor graph method has gradually attracted the attention of scholars at home and abroad in recent years [6,7,8]. Factor graph theory was first studied in the field of coding theory. In 1981, Tanner introduced a bipartite graph called a “Tanner graph” to describe the parity check matrix in the coding field [9]. Kschischang et al. combined the characteristics of the Wiberg graph, Tanner graph and other graph models and put forward the concept of a factor graph [10]. Indelman et al. proposed a factor graph information fusion model based on an inertial/visual integrated navigation system [11]. Kaess et al. proposed a simultaneous localization and mapping (SLAM) method to optimize the image plane with the least square method [12]. Gao et al. studied a method of constructing a factor graph based on INS, which was to make full use of INS measurement in the navigation system and avoid wasting measurement information [13]. Zeng et al. improved the traditional factor graph fusion method and realized integrated navigation and precise positioning based on the multi-source navigation information of UAVs [14]. To improve robust performance, the development of fault detection and adaptive fusion methods suitable for the factor graph framework should be studied.
In safety critical applications (SCA), fault detection and isolation (FDI) is a key aspect in order to effectively improve the robustness of the system and prevent the navigation system from crashing due to sensor failure [15]. Faurie et al. proposed a new fault detection algorithm based on the multi-model algorithm, in which the Kalman filter in the system is replaced by the proposed model [16]. Geng et al. designed a fault-tolerant Kalman filter scheme that included multiple filters based on the Chi-square method [17]. Almagbile performed a statistical analysis on the separability of multiple faults in a GPS/INS combined system and found a significant relationship between the correlation and fault test value based on combined similarity [18]. Xiong et al. studied Kullback–Leibler divergence theory and proposed a relative navigation fault detection method [19]. Watanabe proposed a tight integrated vision/GNSS navigation system and introduced an integrity monitoring reset mechanism, which can eliminate the influence of undetected faults on the new reset detector [20]. Paul et al. used ultra-wideband (UWB) technology to make up for navigation performance when GNSS is unreliable and discussed how to apply FDI technology to avoid fault anchors when employing UWB in disturbance environments [21]. Jurado et al. proposed a sensor verification method, which introduces the fault detection of a residual into the filter update in theory and improves the integrity of the integrated navigation system [22]. Al Hage et al. studied the use of multiple sensors in different environments to ensure the required navigation performance and put forward a general method for integrity problems based on measurement rejection and position error representation [23]. However, the former methods mainly judge whether the measurement in the integrated navigation system is faulty. There is no effective fault detection and isolation method for the resilient architecture of graph optimization.
An INS is a kind of autonomous navigation sensor, which is generally free from external interference. GNSS is vulnerable to electromagnetic interference, and the measurement may contain fault errors. To solve the fault problem of navigation equipment in the complex environment, a fault detection and isolation algorithm based on pseudo-range measurements is proposed. Compared with the traditional FDI method, this method can discern which satellite has a problem in pseudo-range and has better isolation efficiency.
The contents of this paper are organized as follows. The system scheme is defined in Section 2.1. The factor graph fused method is introduced in Section 2.2. The integrity detection method is shown in Section 2.3. Simulation experiments and actual data experiments are presented in Section 3. Section 4 presents the discussions. Section 5 is the conclusion.
2. Methods
2.1. System Solutions
Many navigation sensors can obtain navigation data of autonomous vehicles in a resilient integrated navigation system, such as IMU, GNSS and MAG, etc. Autonomous vehicles are assumed to be equipped with multi-rate sensors. Especially under interference and disturbance, the sensor is prone to error increase and even failure. However, in the complex environment of the urban canyon and the electromagnetic interference environment, it is easy to cause the solution failure of GNSS. Due to the wide distribution of satellites, there are problems in measuring the pseudo-range data of only one or several satellites by receivers. A new fault detection and isolation method is proposed in the paper to locate the fault pseudo-range measurements in the factor graph navigation system. The scheme of the FDI method and the factor graph fusion method is shown in Figure 1. The proposed method determines whether the fault exists in the pseudo-range measurement of GNSS, and then the system isolates the fault.
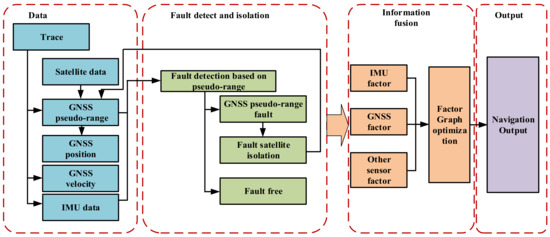
Figure 1.
Scheme of integrity detection of integrated navigation.
Due to vibration and electromagnetic disturbance, some sensors may become inactive or faulty. It is an urgent problem to improve navigation systems’ fault detection and isolation effect and location accuracy under interference and electromagnetic disturbance. The proposed method is to achieve more reliable navigation from multi-source sensor information in case of failure.
After the FDI algorithm detects a sensor fault, it is helpful to isolate the measurement information of the fault sensor in time to ensure positioning accuracy. The main feature of a factor graph is abstracting the navigation sub-system and realizing the algorithm of rapid integration, reconstruction and filtering. Effective fault detection and isolation algorithms can help quickly find fault sensors and isolate fault measurements that may pollute the whole system. Plug-and-play capability is helpful to isolate the measurement information of the fault sensor in time. When the system has no fault, the factor graph algorithm adds a factor node to the factor graph framework by the sensor measurement. The factor graph algorithm isolates the fault measurement when the sensor fails by not adding factor nodes.
2.2. Factor Graph Model
Because of the flexible optimization structure, the factor graph framework has good research prospects. It can quickly isolate the fault navigation subsystem under vibration disturbance and electromagnetic interference.
The factor graph originates from the bipartite graph. The fixed points of a factor graph can be divided into two different types of information, and the relationship between the two nodes is connected by edges. The complex navigation system can be simplified by factorization in the factor graph.
2.2.1. Factor Graph Method
The factor graph consists of two different types of nodes and edges between connected nodes. For the state quantity and quantity measurement of the navigation system, the factor node represents the quantity measurement, the variable node represents the state quantity and the equivalent measurement represents the measurement of the state; it passes through the corresponding factor node and variable node of the edge. In the theory of a factor graph navigation system, the maximum a posteriori probability estimation is used to represent the state estimation problem in navigation.
Before discussing the fusion process, we constructed a factor graph model of the standard sensor. The reference sources in the system are the IMU and GNSS. The measurements of sensors are transformed into factor nodes. In Figure 2, white circles represent variable nodes. The black, yellow and green circles represent factor nodes. fIMU represents the measurement from the IMU. fGNSS represents the measurement information from GNSS. The factor graph system with plug-and-play capability can handle fault isolation and reconnection issues.
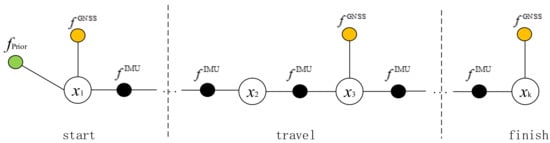
Figure 2.
Schematic diagram of factor graph navigation framework.
2.2.2. Factor Nodes
Several factor nodes equations are presented in this section.
- 1.
- Prior factor;
The prior factor information represents a set of previous information, which is defined as
Generally, in the navigation system, we assume that the prior factor obeys the Gaussian distribution; then we can construct the prior factor model through the mean and variance .
- 2.
- IMU factor;
The measurement of IMU is related to the time period between and according to the frequency. The navigation estimation of strapdown inertial navigation can be realized by different integral processing methods, which will not be described in detail in this paper. The quaternion method is used to estimate the carrier’s position, speed and attitude. The factor node model of INS is represented by the following formula
In principle, the form of system state equation represents an IMU factor . The system transfer matrix and covariance can be obtained based on a nonlinear equation about navigation state of position, velocity and attitude [24]. The state is calculated from the state and the measurement at time . Through the pre-integration method, the continuous IMU measurements over a period of time can be combined into a single factor. The transition matrix is given by
where is the vpdate period. is the gravity vector. is the attitude transformation matrix. , , are the increment of position, velocity and attitude, and they are obtained by . The covariance of transition matrix is derived by system noise.
- 3.
- Other sensor factors;
The other navigation sensor factor node is given by
where is the measurement of the navigation sensor, is the measurement function, and is the measurement noise, which is white noise in a Gaussian system. The measurement noise of GNSS is position and velocity measurement noise.
2.2.3. Graph Optimization Equations
The factor graph theory calculates the navigation state estimation based on the maximum a posteriori probability estimation. The specific derivation process is as follows.
The factor represents an error function of the states
where the operator represents the specific cost function. represents the error function of the factor.
For Gaussian noise distributions, the above formula can be changed into
where is the nonlinear measurement function, and is the actual measurement.
means the corresponding state value when the maximum posterior probability of the state under the condition of measurement occurrence, as
If the negative logarithm is taken on both sides of Equation (6), then the observation equation is introduced and transformed into the form of 2-norm.
where is the the Jacobian matrix of the observation equation. is calculated by , and it means a partial differential of at point [25].
After calculating the updated value ∆, the states’ value can be obtained by accumulating and updating variables . Therefore, in the factor graph method, the state estimation problem is solved by the least square method, and the updated estimated state is based on the least square solution.
Through the above formula derivation, the factor graph is updated by the least square method. Federated filtering needs to be filtered at the lowest common frequency of the sensor, while the factor graph method only needs to add factor nodes and delete fault factor nodes to realize the overall update.
2.3. Fault Detection and Isolation Method
It is urgent to improve the fault detection and isolation effect and location accuracy of autonomous vehicles under interference or fluctuations. We need to detect sensor faults in a timely way and prevent the measurement information of fault navigation sensors from polluting the state of a navigation system in the fault environment.
With the development of GNSS receiver autonomous integrity monitoring (RAIM), the multiple solution separation (MSS) method effectively extends the concept of “RAIM” to the INS/GNSS integrated navigation system. The Chi-square method is used as the basic detection method in this paper. The linear discrete time-varying system model can be described as
where is the states vector. and are the states functions and measurement model functions. represents the measurement vector. is the process noise, and is the measurement noise. They are all assumed to be zero-mean Gaussian white noise.
State m-step prediction equation is
The residual vector is
where is the residual. Furthermore, the covariance of is
where is the Jacobian matrix of measurement equation. is the variance matrix of measurement noise. is the m step prediction mean square error equation. It is recursively obtained from the prediction mean square error matrix in the previous step, as follows
where is the Jacobian matrix of state equation, and . is the variance matrix of system noise.
Therefore, whether the system fails can be determined by testing the residual . Then, the fault detection function is
The filter framework of the proposed method is shown as MSS in Figure 3. The main filter is used to process all received satellite pseudo-range data. After the fault is detected by the main filter, each sub-filter analyzes and processes the data, deducting the pseudo-range of a satellite.
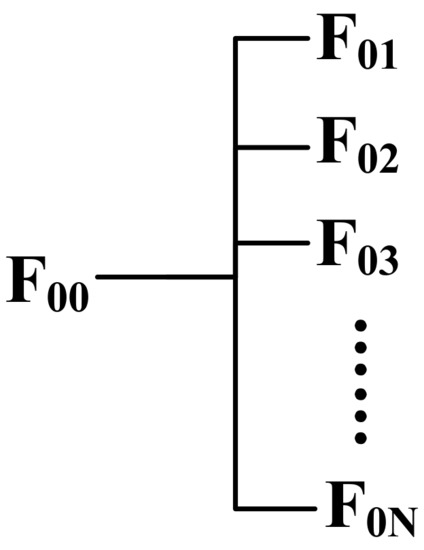
Figure 3.
Structure diagram of MSS fault detection.
For the framework mentioned above, the main filter detects fault based on all satellite pseudo-range measurements. The sub-filter detects fault based on all satellite pseudo-range measurements except the nth satellite pseudo-range. If nth satellite fails, without removing the pseudo-range of the nth satellite, the fusion result of the main filter will be polluted.
The position, velocity, attitude, gyro random constant, gyro random noise, accelerometer random noise, pseudo-range and pseudo-range rate are all important in aviation applications. Therefore, by comparing the fault detection results of the main filter and the sub-filter, it can be decided which satellite has a fault in the pseudo-range.
is the result of the main fault detection filter, and is the fault detection result of the sub-filter .
It can be determined whether there is a fault by applying the following hypothesis test
where is a detection threshold that is related to the false alarm probability . The effect of FDI is determined by the preset threshold. According to the Neyman–Pearson criterion, satisfies as follows
where is the error function. is the maximal eigenvalue of , which is the covariance matrix of . The matrix is expressed as
with and the covariance matrices of the estimation error for main filter and sub-filter excluding the satellite pseudo-range measurement, respectively.
Considering that the probability of the simultaneous failure of each sub-navigation system is small, it can be concluded that there is no fault in the system after the isolation of the faulty pseudo-range measurements. Even if there are still outliers in the measurement of the satellite receiver, it can be eliminated based on the integrity algorithm of the satellite receiver to ensure better navigation performance.
3. Results
In order to verify the effectiveness of the proposed FDI algorithm in the environment of vibration interference and multipath effect, the generation of simulated faults is established, and the simulation results show that the proposed method can quickly detect and isolate faults.
The simulation and actual data experiment of autonomous vehicle navigation with fault are established to simulate the parameters of vehicle autonomous navigation sensor in a fault environment and collect vehicle navigation data in complex scenes. The proposed FDI algorithm based on data validation is in the next section.
3.1. Simulation Results
According to the path of autonomous vehicles, we design an 800 s vehicle trajectory. As shown in Figure 4, the takeoff point is 118.8° N, 31.95° E, 5 m. The initial velocity is 0 m/s, and the initial heading direction is north.
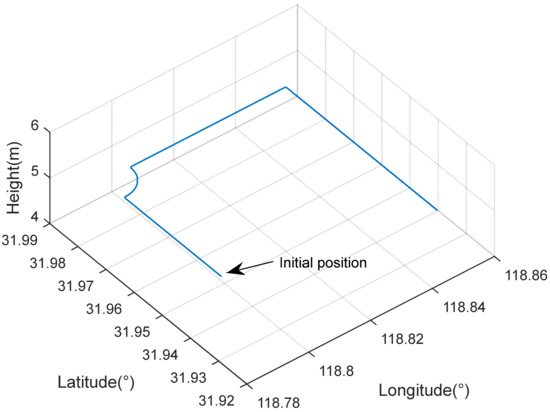
Figure 4.
The path of vehicles.
The update frequency settings are shown in Table 1. The error parameters of the navigation systems are shown in Table 2. The fault simulation scenarios settings are shown in Table 3.

Table 1.
Sensor rates setting.
Table 2.
Errors of different sensors.
Table 3.
Fault scenarios in the navigation system.
As Table 3 shows, faults are added to GNSS pseudo-ranges. A step fault with amplitude 1000 m and a ramp fault with a slope of 20 m/s are all typical failure types in GNSS pseudo-ranges.
3.1.1. No. 1 Simulation Results
Figure 5, Figure 6, Figure 7 and Table 4 compare the performance of the Chi-square and the proposed method in the No. 1 scenario. In Figure 5, the diagram of the test statistic caused by a step fault in SV-1 shows that both methods can successfully detect the step fault in a single-satellite pseudo-range measurement. In Figure 6, the Chi-square method can generally detect satellite faults between 200–250 s. After isolating the position factor, position and speed will diverge without correction. The proposed method can isolate the fault pseudo-range measurements. Furthermore, the normal satellite data can correct the inertial navigation data as usual. Table 4 proves the proposed method has better accuracy with the RMS results by simulation under the step fault. The box diagram of position and velocity errors also shows the superiority of the proposed method in Figure 7. Positioning accuracy can be improved by more than 70%.
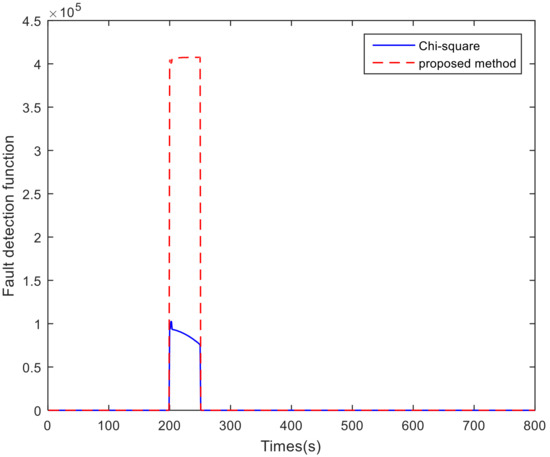
Figure 5.
The test statistic of fault detection obtained by simulation under the single-satellite step fault.
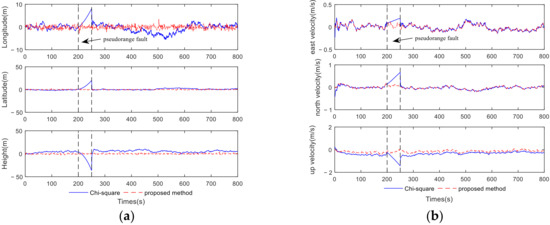
Figure 6.
The fusion states errors under the single-satellite step fault: (a) position errors; (b) velocity errors.
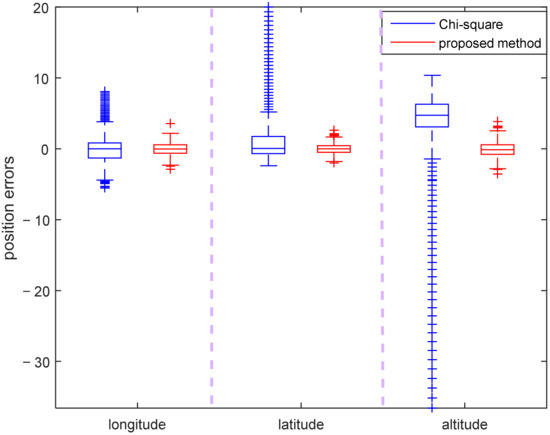
Figure 7.
The box diagram of fused position errors under the single-satellite step fault.
Table 4.
RMS of navigation errors obtained by simulation under the single-satellite step fault.
3.1.2. No. 2 Simulation Results
Figure 8, Figure 9, Figure 10 and Table 5 compare the performance of the Chi-square and the proposed method in the GNSS ramp fault scenario. In Figure 8, the test statistic caused by a ramp fault in SV-1 shows that both methods can detect the ramp fault and that the proposed method can detect it faster. In Figure 9, when the ramp fault first appears, neither method can detect the fault. When the ramp fault increases, the proposed method can detect the fault faster, then detect and isolate the fault satellite pseudo-range measurements with sub-filters to ensure positioning accuracy. Table 5 proves that the proposed method has lower RMS results. The box diagram of position errors also shows the superiority of the proposed method in Figure 10. Positioning accuracy can be improved by more than 60%.
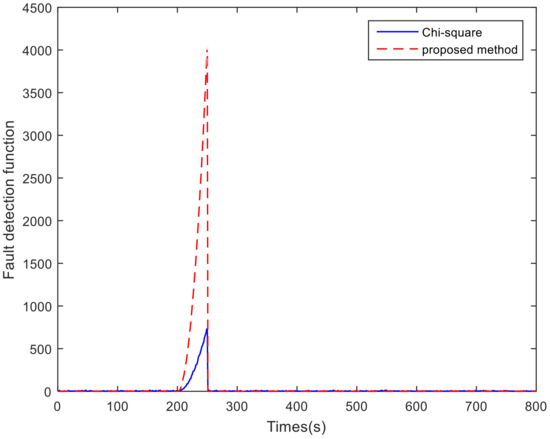
Figure 8.
The test statistic of fault detection obtained by simulation under the single-satellite ramp fault.
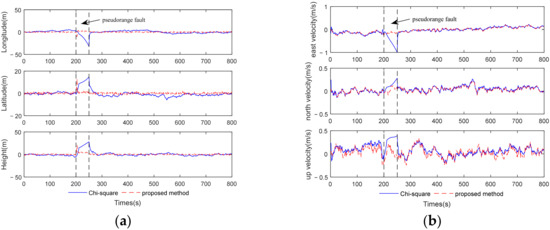
Figure 9.
The fusion states’ errors under the single-satellite ramp fault: (a) position errors; (b) velocity errors.
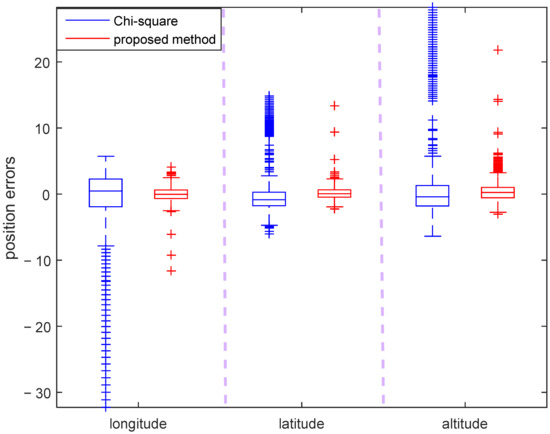
Figure 10.
The box diagram of fused position errors under the single-satellite ramp fault.
Table 5.
RMS of navigation errors obtained by simulation under the single-satellite ramp fault.
3.2. Experiment Results
We make full use of the open-source vehicle city data set. The data set used in the experiment is captured by the vehicle platform of the Hong Kong Polytechnic University, China. The vehicle navigation system data includes INS data and GNSS original pseudo-range data, together with accurate ground truth from the SPAN-CPT system. The detailed sensors setup, noise analysis and data format of this open-source dataset are in [26]. The path is shown in Figure 11.
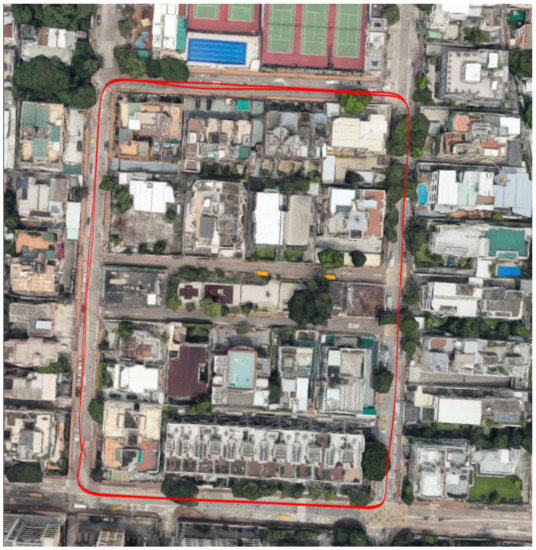
Figure 11.
The path of the vehicle platform in an urban environment.
The on-board strapdown inertial navigation system is composed of a gyroscope and an accelerometer. The vehicle position is calculated by angular velocity and acceleration. The raw GNSS RINEX information includes pseudo-range measurements, Doppler shift and ephemeris. The INS data is provided by Xsens Mti-10, and raw GNSS data is collected by u-blox M8T. Due to the urban canyon environment in Hong Kong, the GNSS signal is easily disturbed, resulting in non-line-of-sight (NLOS) receptions, multipath effect or breakdown.
As a high-frequency sensor, the preprocessed IMU measurement value is regarded as an equivalent IMU factor. When the GNSS detects the pseudo-range fault due to the proposed FDI algorithm, the data isolation and fusion system isolates the fault pseudo-range measurements and adds the GNSS factor calculated from the remaining normal data.
The dataset UrbanNav-HK 2020 is obtained in the urban community environment of residences. Since the experimental environment is residential, no fewer than four satellites are observed during the experimental vehicle’s trajectory. The performance is analyzed by the dataset UrbanNav-HK 2020 in the following figures. In Figure 12, the number of satellites in the low urbanization environment is greater than 4. If the detection value in the figure is greater than the threshold (132–150 s), it is the case that the pseudo-range errors are large, due to the surrounding buildings.
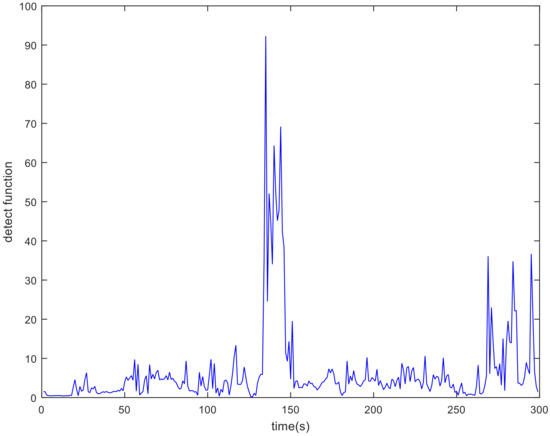
Figure 12.
The test statistic of fault detection obtained by the dataset UrbanNav-HK 2020.
By analyzing the detection value of sub-filters during 132–150 s, the fault detection value of a satellite with a PRN of 8 exceeds the threshold. After the isolation of satellite pseudo-range measurements with a PRN of 8, the positioning accuracy of fusion is improved in Figure 13a. Due to the pseudo-range detection, the velocity errors of the two methods are approximately the same in Figure 13b.
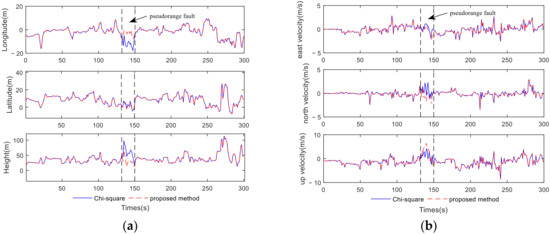
Figure 13.
The fusion states errors obtained by the dataset UrbanNav-HK 2020: (a) position errors; (b) velocity errors.
From Table 6, the positioning accuracy of the proposed method in the fault period is improved by 42.34% on average. The box diagram of position errors also shows the superiority of the proposed method in Figure 14. The box diagram of position error shows that the errors of the proposed method are smaller in 132–150 s.
Table 6.
RMS of navigation errors obtained by the dataset UrbanNav-HK 2020 under the satellite fault.
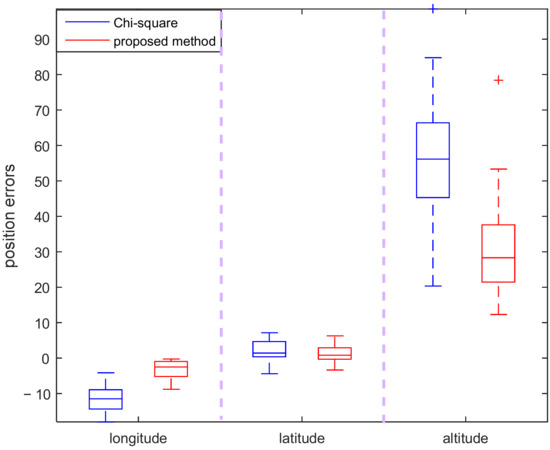
Figure 14.
The box diagram of fused position errors obtained by the dataset UrbanNav-HK 2020.
4. Discussion
The factor graph fusion navigation method can deal with the non-synchronization of navigation information and realize the ability of plug-and-play, which is consistent with the results of [14]. The traditional FDI method is based on INS measurements and GNSS position and velocity measurements. Generally, INS measurement is used as a reference to isolate the satellite fault, which leads to the waste of regular pseudo-range information. On this basis, the proposed FDI method can judge that the pseudo-range of a satellite is faulty. After isolating the faulty pseudo-range measurements, it can still rely on normal measurements to improve positioning accuracy.
The factor graph navigation FDI method based on pseudo-range can detect GNSS pseudo-range faults effectively. It improves the navigation and positioning accuracy under disturbance and meets the needs of positioning in the complex environment. After isolating the fault pseudo-range measurements, it is equivalent to preventing the fault measurements from polluting the fused navigation information, which effectively improves the reliability of navigation. The positioning accuracy of the proposed FDI method in three directions is improved by 40% to 70%.
The algorithm and experimental verification in this paper focus on detecting a single-satellite pseudo-range fault. In order to expand the application scope of the algorithm, we will optimize the algorithm framework and experimental scheme in the future and supplement the detection of multi-satellite pseudo-range fault measurements and INS fault measurements. Through the multi-filter architecture, different fault measurement types will be comprehensively detected. In addition, adaptive filtering is widely used in the autonomous navigation system. The two detection thresholds proposed in [21] can calculate the weight of measurement information through the detection function value. We can also use an adaptive weight factor to isolate fault measurements’ insignificant errors and reduce the weight of sensor factors in minor errors. It can obtain more accurate and robust navigation information. This will be worth further investigation.
5. Conclusions
To improve the fault detection performance of factor graph navigation systems under complex environments, a fault detection method is applied. It provides the capability of satellite pseudo-range fault location, which can detect the fault pseudo-range measurements and improve the positioning accuracy of the resilient integrated navigation system after isolation. The conclusions can be summarized as follows:
- (1)
- The factor graph navigation algorithm has been widely used because it can effectively solve the problem of sensor asynchrony in navigation information fusion and realize the plug-and-play configuration of multiple sensors.
- (2)
- Based on the Chi-square testing and MSS method, a new fault detection method based on a factor graph framework is designed and constructed through the INS measurements and GNSS pseudo-range. The proposed method can locate faulty pseudo-range measurements.
- (3)
- The simulation and open-sourcing data experimental results show that the proposed method has a better performance by improving fault detection under complex interference. Compared with the Chi-square fault detection method, the navigation performance is improved by more than 40%.
Author Contributions
Conceptualization, K.S. and Q.Z.; methodology, K.S.; software, K.S.; validation, K.S., Q.Z. and S.W.; formal analysis, S.W.; investigation, S.W.; resources, J.L.; data curation, S.W.; writing—original draft preparation, K.S.; writing—review and editing, Q.Z.; visualization, K.S.; supervision, Q.Z.; project administration, J.L.; funding acquisition, J.L. All authors have read and agreed to the published version of the manuscript.
Funding
This research was funded by the National Natural Science Foundation of China (Grant 61533008, 61603181), the Fundamental Research Funds for the Central Universities (No. NS2018021). This research was also supported by the Fundamental Research Funds for the Central Universities, and Engineering Research Center of Autonomous Control Technology of aircraft, Ministry of Education.
Institutional Review Board Statement
Not applicable.
Informed Consent Statement
Not applicable.
Data Availability Statement
Not applicable.
Acknowledgments
The authors would like to thank Lita Hsu in the Hong Kong Polytechnic University for providing the datasets for this study.
Conflicts of Interest
The authors declare no conflict of interest.
References
- Bijjahalli, S.; Sabatini, R. A High-Integrity and Low-Cost Navigation System for Autonomous Vehicles. IEEE Trans. Intell. Transp. Syst. 2021, 22, 356–369. [Google Scholar] [CrossRef]
- Li, Q.Q.; Jorge, P.Q.; Tuan, N.G. Multi Sensor Fusion for Navigation and Mapping in Autonomous Vehicles: Accurate Localization in Urban Environments. Unmanned Syst. 2020, 8, 229–237. [Google Scholar] [CrossRef]
- Leutenegger, S.; Lynen, S.; Bosse, M.; Siegwart, R.; Furgale, P. Keyframe-based visual–inertial odometry using nonlinear optimization. Int. J. Robot. Res. 2015, 34, 314–334. [Google Scholar] [CrossRef] [Green Version]
- Kim, J.; Lyou, J.; Kwak, H. Vision coupled GPS/INS scheme for helicopter navigation. J. Mech. Sci. Technol. 2010, 24, 489–496. [Google Scholar] [CrossRef]
- Kamatham, Y. Estimation, analysis and prediction of multipath error for static GNSS applications. In Proceedings of the 2018 Conference on Signal Processing and Communication Engineering Systems (SPACES), Vijayawada, India, 4–5 January 2018. [Google Scholar]
- Vadim, I.; Stephen, W.; Michael, K. Factor graph based incremental smoothing in inertial navigation systems. In Proceedings of the International Conference on Information Fusion, Singapore, 9–12 July 2012. [Google Scholar]
- Michael, K.; Stephen, W.; Vadim, I. Concurrent filtering and smoothing. In Proceedings of the International Conference on Information Fusion, Singapore, 9–12 July 2012. [Google Scholar]
- Wu, X.; Xiao, B.; Wu, C.; Guo, Y.; Li, L. Factor graph based navigation and positioning for control system design: A review. Chin. J. Aeronaut. 2021; in press. [Google Scholar] [CrossRef]
- Tanner, R. A recursive approach to low complexity codes. IEEE Trans. Inf. Theory 1981, 27, 533–547. [Google Scholar] [CrossRef] [Green Version]
- Kschischang, F.R.; Frey, B.J.; Loeliger, H.A. Factor graphs and the sum-product algorithm. IEEE Trans. Inf. Theory 2001, 47, 498–519. [Google Scholar] [CrossRef] [Green Version]
- Indelman, V.; Williams, S.; Kaess, M. Information fusion in navigation systems via factor graph based incremental smoothing. Robot. Auton. Syst. 2013, 61, 721–738. [Google Scholar] [CrossRef]
- KAESS, M. Simultaneous localization and mapping with infinite planes. In Proceedings of the 2015 IEEE International Conference on Robotics and Automation, Washington, CA, USA, 26–30 May 2015. [Google Scholar]
- Hsiao, M.; Westman, E.; Zhang, G. Key-frame- based dense planar SLAM. In Proceedings of the 2017 IEEE International Conference on Robotics and Automation, Singapore, 29 May–3 June 2017. [Google Scholar]
- Zeng, Q.H.; Chen, W.N.; Liu, J.Y. An improved multi-sensor fusion navigation algorithm based on the factor graph. Sensors 2017, 17, 641. [Google Scholar] [CrossRef] [PubMed] [Green Version]
- Hashemi, M.; Shami, E. New fault detection and fault-tolerant scheme for Doppler velocity logger outage in ocean navigation systems. J. Navig. 2021, 74, 409–424. [Google Scholar] [CrossRef]
- Frederic, F.; Audrey, G.; Eric, G. Fault detection combining interacting multiple model and multiple solution separation for aviation satellite navigation system. In Proceedings of the IEEE International Conference on Acoustics, Speech and Signal Processing, Taiwan, China, 19–24 April 2009. [Google Scholar]
- Geng, K.K.; Chulin, N.A. Applications of multi-height sensors data fusion and fault-tolerant Kal-man filter in integrated navigation system of UAV. Procedia Comput. Sci. 2017, 103, 231–238. [Google Scholar] [CrossRef]
- Almagbile, A. Geometric and statistical interpretation of correlation between fault tests in integrated GPS/INS systems. J. Appl. Geod. 2019, 13, 267–278. [Google Scholar] [CrossRef]
- Xiong, J.; Cheong, J.W.; Xiong, Z. Fault-tolerant relative navigation based on Kull-back–Leibler divergence. Int. J. Adv. Robot. Syst. 2020, 17. [Google Scholar] [CrossRef]
- Watanabe, Y. Vision-integrated Navigation and Integrity Monitoring for Aircraft Final Approach. In Proceedings of the 21st IFAC World Congress, Berlin, Germany, 11–17 July 2020. [Google Scholar]
- Paul, Z.; De Miguel, G.; Goya, J. Residual based fault detection and exclusion methods applied to Ultra-Wideband navigation. Measurement 2021, 179, 109350. [Google Scholar]
- Juan, J.; John, R.; Christine, M.S. Single-filter finite fault detection and exclusion methodology for real-time validation of plug-and-play sensors. IEEE Trans. Aerosp. Electron. Syst. 2021, 57, 66–75. [Google Scholar]
- Al Hage, J.; Xu, P.; Bonnifait, P.; Ibanez-Guzman, J. Localization Integrity for Intelligent Vehicles Through Fault Detection and Position Error Characterization. IEEE Trans. Intell. Transp. Syst. 2022, 23, 2978–2990. [Google Scholar] [CrossRef]
- Wei, X.K.; Li, J.; Zhang, D.B.; Feng, K.Q. An improved integrated navigation method with enhanced robustness based on factor graph. Mech. Syst. Signal Processing 2021, 155, 107565. [Google Scholar] [CrossRef]
- Dellaert, F.; Kaess, M. Factor Graphs for Robot Perception. Now Found. Trends 2017, 6, 1–139. [Google Scholar]
- Hsu, L.T.; Kubo, N.; Wen, W.; Chen, W.; Liu, Z.; Suzuki, T.; Meguro, J. UrbanNav: An Open-Sourced Multisensory Dataset for Benchmarking Positioning Algorithms Designed for Urban Areas. In Proceedings of the 2021 ION GNSS+, St. Louis, MI, USA, 14–17 September 2021. [Google Scholar]
Publisher’s Note: MDPI stays neutral with regard to jurisdictional claims in published maps and institutional affiliations. |
© 2022 by the authors. Licensee MDPI, Basel, Switzerland. This article is an open access article distributed under the terms and conditions of the Creative Commons Attribution (CC BY) license (https://creativecommons.org/licenses/by/4.0/).