Abstract
Automatic garment size measurement approaches using computer vision algorithms have been attempted in various ways, but there are still many limitations to overcome. One limitation is that the process involves 2D images, which results in constraints in the process of determining the actual distance between the estimated points. To solve this problem, in this paper, we propose an automated method for measuring garment sizes using computer vision deep learning models and point cloud data. In the proposed method, a deep learning-based keypoint estimation model is first used to capture the clothing size measurement points from 2D images. Then, point cloud data from a LiDAR sensor are used to provide real-world distance information to calculate the actual clothing sizes. As the proposed method uses a mobile device equipped with a LiDAR sensor and camera, it is also more easily configurable than extant methods, which have varied constraints. Experimental results show that our method is not only precise but also robust in measuring the size regardless of the shape, direction, or design of the clothes in two different environments, with 1.59% and 2.08% of the average relative error, respectively.
1. Introduction
Measuring clothes is essential for both sellers and buyers in the fashion industry, but it also incurs many unwanted costs. Such costs include labor costs (from manually measuring the size of a garment) and costs surrounding exchanges and refunds due to sizing issues [1,2]. For example, on the seller’s side, apparel manufacturers regularly measure their products for quality control, and retail and thrift stores size their garments again to provide consumers with the size labels and accurate measurements. Although information is provided, many consumers still experience much inconvenience in exchanging and refunding products because of the sizes being different from their expectations [3,4,5]. This is because the sizing standards created for the mass production of clothes are inadequate to cover a wide range of consumers [6,7]. Such repetitive and inefficient work is pervasive throughout the industry and, consequently, it leads to high cost increases in the apparel market.
In this paper, we propose a novel method for automating garment size measurements using a mobile device equipped with a camera and a LiDAR sensor. A LiDAR sensor projects a laser pulse to store point cloud data representing spatial information in the real world in three dimensions. Since the point cloud data are points with distance (so called depth) information from the LiDAR sensor, it is possible to calculate the distance between specific points in the scanned space. Moreover, mobile devices equipped with LiDAR sensors and cameras have recently become common, making it possible to simultaneously scan the real world with 2D and 3D data. With this advantage, we succeed in measuring the sizes of clothes using 2D images and 3D point clouds to detect the size measurement points and to calculate the distance between the points, respectively. As shown in Figure 1, the proposed method consists of three steps.
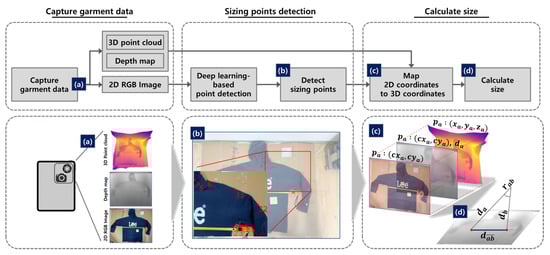
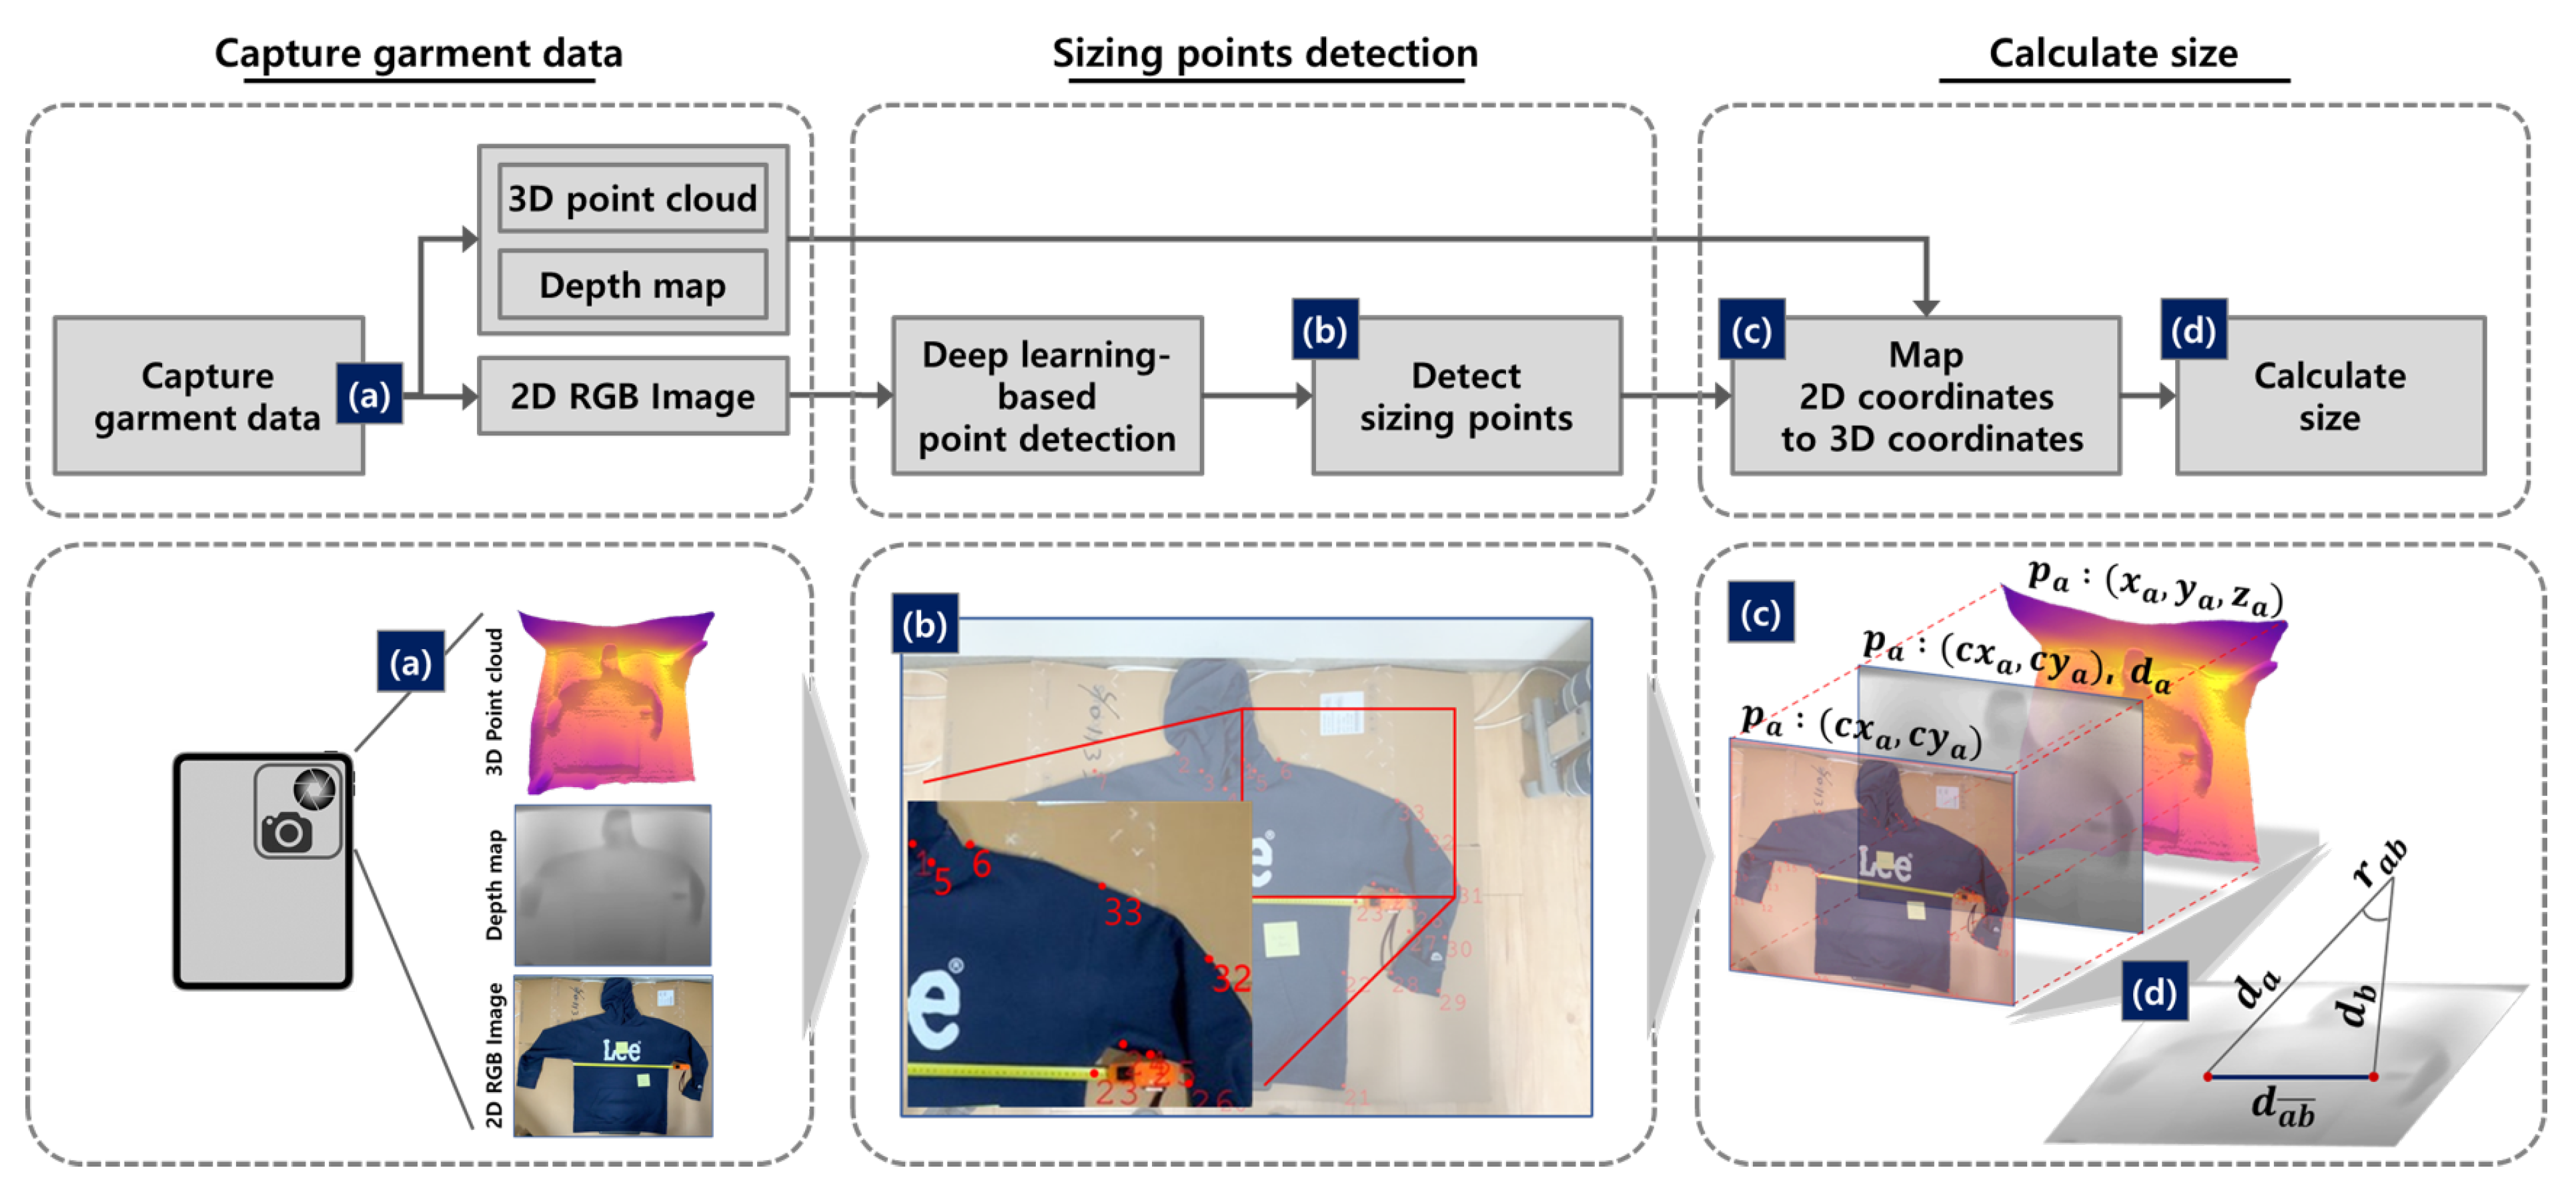
Figure 1.
Three steps of the automatic garment size measurement approach. (a) We used a mobile device equipped with cameras and a LiDAR sensor to collect images and point clouds of clothes taken from the same viewpoint. (b) The deep learning-based point detector detects the two-dimensional coordinates in the picture of the measurement points. (c) The points in the depth map are in 2D coordinates that match the RGB image, and each has a distance from the sensor. (d) Finally, the program calculates the size with and and the angle between two points.
First, we capture clothes lying flat on the floor using a mobile device equipped with a camera and a LiDAR sensor. With a single capture, a dataset consisting of an image, depth map, and point cloud data are created, as shown in Figure 1a. Next, the deep learning-based point detector detects the locations of the size measurement points corresponding to the clothing categories in the 2D image, as exhibited in Figure 1b. A computer vision deep learning model is used as a measurement point detector to determine the pixel coordinates of the multiple measurement points. Finally, we calculate the sizes based on the depth information of the point cloud. The depth map represents the depth information of each point, which is in the 2D coordinates, the same as the 2D image. As illustrated in Figure 1c, each point that is detected in the previous step is mapped to a point in the point cloud and assigned the distance from the LiDAR sensor. Based on the actual distance information between the device and the scanned space, we can find the actual sizes using the depths and contained angle.
Our method succeeds in measuring the clothing size (as precise as manual sizing) by simply combining the advantages of the deep learning model and point cloud data. Section 2 introduces the deep learning algorithms our team apply and how we utilize the advantages of LiDAR sensors to minimize intervention from human factors. We also present the details of the proposed method in Section 3 and outline the conducted experiments to verify the method’s accuracy, tolerance, and robustness in Section 4. Finally, the benefits of the suggested procedure and further studies are summarized in Section 5 and Section 6, respectively.
Overall, our contributions are as follows:
- We introduce a novel method for automating garment sizing using a mobile device with cameras and LiDAR sensors without environmental controls.
- We illustrate how we can successfully measure sizes by exploiting 3D point cloud features, as precise as manual measurements.
- We present how robust the proposed method is by examining experimental results (with and without backgrounds) using deep learning-based point detectors.
2. Related Work
We examine the proposed methods and the limitations of previous research in this field and introduce applicable computer vision deep learning technology and the use of LiDAR sensors as solutions to overcome these issues.
2.1. Automatic Measurement of Garment Sizes
In the past few decades, some methods [8,9,10,11] for automating garment size measurements using 2D image recognition have been proposed based on two perspectives: (1) external environment (workbench) control and (2) varied contour extraction algorithm [12,13,14]. Because the two-dimensional image itself cannot preserve the physical distance information (e.g., cm, in) in the real world, these studies, which rely solely on two-dimensional images, have the following problems.
First, the workbench environment must be strictly devised because of the distance conversion from the pixel-level to the actual measure. To calculate the actual size from the image, delicate camera calibration [15] is required to convert the actual distance for each pixel. Since the camera calibration must take into account all components related to the device and workbench, it must be premised that many factors (e.g., the distance between the clothes and the camera, the image resolution, the lens alignment, etc.) must be strictly controlled. The various and rigorous controls of workbench specifications are impractical because they are extremely difficult to reproduce in other environments; even small inadvertent changes can lead to significant errors.
In addition, contour extraction algorithms [12,13,14] for point detection are susceptible to image quality and shape variations of clothing. Paler [12] and Davies [13], respectively, proposed a mask-matching method and the generalized Hough transformation as methods for detecting edges. However, these algorithms do not work properly when image processing is complex or when the edges are relatively blunt. Chunxiao et al. [8], inspired by Serge’s work [14], used predefined contour templates to match garment contours. However, for this process, one template must be prepared for each clothing type. This is ’unsound’ in the fashion industry, as various designs exist (even for one clothing type). Above all, in both approaches, different colored backgrounds are essential to find the outlines of the clothes.
2.2. Deep Learning-Based Keypoint Estimation Model
To train a deep learning model to detect size measurement points, numerous clothing images in which pixel-level coordinates of measurement points are annotated for clothing items are necessary. In 2019, the DeepFashion2 dataset [16] published by The Chinese University of Hong Kong and SenseTime Research consisted of 491,000 images with a total of 294 annotated landmarks and 13 clothing categories. Landmarks are key characteristics of the outlines of clothes and the markers include size measurement points that are unique according to the type of clothing (e.g., left and right armpits and hem), as shown in Figure A1. This dataset contains much richer clothing types and keypoint information than previously known fashion datasets [17,18].
Regarding the point estimation problem, a high-resolution network (HRNet) [19] is a state-of-the-art deep neural network architecture. In 2019, it proved its effectiveness in the human pose estimation problem that predicted unique marked keypoints for each part of the human body. This model architecture is suitable for detecting different sizing points for each clothing type. In the landmark estimation competition hosted in the DeepFashion2 dataset, the models using HRNet architecture ranked first [20] and third [21], proving its potential as a sizing point detector. Inspired by the approaches, our team also adopted a HRNet-based keypoint detection model as a sizing point detector.
HRNet has advantages over previous architectures [22,23,24,25,26,27,28,29] through two different approaches. First, HRNet connects high-to-low-resolution subnetworks in parallel instead of in series. It efficiently preserves high representations, whereas previous approaches used low-level resolution to restore high representation. In addition, this architecture uses repeat multi-scale fusions. Unlike previous fusion schemes that simply aggregated low and high representations, this method keeps both representations at a similar scale. The high-resolution representations learned from HRNet are spatially precise.
2.3. LiDAR Applications
With the advancement and spread of LiDAR devices, various applications and studies [30,31,32,33,34] using LiDAR technology are appearing in our daily lives. In these studies, it is possible that distances (owing to LiDAR sensors) can convert spatial information in the real world into data. It is now viable to measure the distance reliably close to the actual distance, but there are still several obstacles: (1) to measure the distance, human intervention is required to pick the points; (2) on mobile devices, measurement errors may occur due to slight movements while scanning the space.
Considering these issues, we designed an approach that minimizes human factor errors by automating two procedures, as follows:
- The sizing point detector locates the detected sizing points without human intervention.
- We captured the image and the point cloud simultaneously to remove calculation errors caused by hand movements while scanning the clothing area.
3. Proposed Method
The purpose of this study was to show that precise clothing size measurements are possible with a single shot of an image and point cloud data through a device equipped with a camera and LiDAR sensor. Size measurements can be divided into two steps, as follows. First, we find the measurement points corresponding to the desired sizes. The distance between the measurement points is then calculated. As a solution for each step, our team (1) finds the pixel coordinates of each size measurement point in the 2D image by applying the HRNet-based keypoint estimation model, and (2) maps each sizing point to the corresponding point in the point cloud through matching the coordinates of the image and depth map. Because the point cloud represents the spatial information of the real world, the actual size can be calculated based on the depth information derived by the 3D space coordinates of the point cloud.
3.1. Sizing Point Detection
3.1.1. HRNet-Based Sizing Point Detector
We applied an HRNet [19]-based keypoint estimation model as a sizing point detector. HRNet maintains high-resolution representations and simultaneously connects multi-resolution subnetworks, showing excellent comprehensive performance in learning information around keypoints in images. This architecture proves effective in restoring low-resolution features to high-resolution representations [35]. This feature has the same advantage in the problem of keypoint detection for clothes, as the visual features around keypoints are more diverse than those of humans [36].
Regarding the architecture of the point detector, we adopted HRNet-W48. W48 denotes the widths of the subnetworks in the third stage, which is relatively larger than the other variant of HRNet, HRNet-W32. The structure of the network consists of four parallel stages of subnetworks (). In the diagram below, N represents the subnetwork, the subscript s and r denote the stage and the resolution index, respectively. As shown in the diagram below, it begins with a high-resolution subnetwork () in the initial stage. Each subnetwork is branched into two subnetworks: a multi-resolution subnetwork () and a high-to-low resolution subnetwork (). As a result, parallel multi-resolution subnetwork processes maintain the same resolution-level representations among the same r networks.
All parallel subnetworks repeatedly exchange the information from other stages. According to Sun et al. [19], this repeated multi-scale fusion process allows the subnetwork to have rich representation by bidirectional information exchange of high-to-low and low-to-high resolutions, rather than restoring from low to high.
At the last stage, the high-resolution representation output at the final stage estimates heat maps of each keypoint. The loss of estimation error is the Euclidean distance () between the ground truth coordinates and the estimated coordinates of the keypoints. The loss function uses the mean square error as follows,
meaning the problem of finding the shortest straight line distance from the ground truth coordinates of the keypoint.
3.1.2. Data Augmentation
Our team applied a data augmentation scheme to train a sizing point detector inspired by the high-ranking (first, third [20,21]) HRNet models in a landmark estimation competition. Qian [21] presented a clever approach that uses data augmentation for training by swapping symmetrical points (e.g., left and right armpits). Lin [20] pointed out that poor learning with insufficient data on certain types of clothing reduces the overall performance. Reflecting on these two ideas, we trained the sizing point detector by applying data augmentation to the left–right symmetry points, excluding the clothing types that lack training data.
3.2. Physical Distance Calculation
To calculate the actual size, the spatial information corresponding to each detected measurement point should be provided. In order to accomplish this process, as shown in Figure 1c, we mapped a two-dimensional image and a depth map taken from the same viewpoint and angle. The depth map contained data recorded by the LiDAR sensor(ToF sensor with 10 µm pitch px, Sony Group Corp.), which recorded point-by-point distance information between the real space and the device. We filed clothes images, depth maps, and point clouds simultaneously using iPad Pro(A2228, Apple Inc., assembled in China) device equipped with a camera and LiDAR sensor. The camera and LiDAR sensor simultaneously shoot at the same region and viewpoint; we could map the image and the depth map without errors.
As a final step, the target size is calculated using the distance between two detected points and the angle between them, as illustrated in Figure 1d. Each point in the LiDAR sensor is projected at equal angular intervals. Therefore, the angle between two points is equal to the unit angle of points multiplied by the point interval between the two points. In this case, in Equation (3) is the straight line distance between the two points. It is the same as the manual size measurement method with a tape measure.
4. Numerical Experiments
4.1. Dataset
4.1.1. DeepFashion2 Dataset
We trained a point detector with five clothing categories (short sleeve top, long sleeve top, shorts, trousers, and skirt) from the DeepFashion2 dataset [16]. For the accurate detection of the sizing points for each clothing type, the deep learning model requires sufficient data for each type to learn and generalize the visual features. Although the DeepFashion2 dataset was large enough to correspond to 13 clothing types and 491,000 images, the amount of data varied depending on the clothing category. Therefore, it was reasonable to select five clothing categories with at least 50,000 images in our experiment.
4.1.2. Experiment Data
For the size measurement experiments, we collected 33 pieces of clothing from the five clothing types, as described in Table 1. Regarding the clothing, there were varieties of designs, colors, and shapes, and they were all used clothes. Our team manually measured each garment size independently three times and recorded the minimum, maximum, and median values to validate the experimental results. To collect the data, we laid out each piece of clothing on the floor and collected a set of data (consisting of an image, depth map, and point cloud) with a single capture using iPad Pro (A2228, Apple Inc., assembled in China) device. In this manner, the process carried out 10 independent captures for each garment by collecting and replacing. With every capture, the position and shape of the clothes slightly changed. We also collected data in the same way in two experimental conditions with different backgrounds. As a result, we constructed a total of 660 sets of data (330 sets per experiment) with two different background settings.

Table 1.
Descriptionof garments in the dataset. For the experiments, we gathered 33 different designs of clothes from five clothing types. The dataset consists of 10 independent sets * (: image, depth map, and point cloud) for each garment. As shown in Figure A2 and Figure A3, experiments 1 and 2 ** were conducted on a white background plate and a floor without a background plate, respectively.
4.2. Experiment Results
As presented in Table 2, the results of the experiments showed that the average relative errors were (a) 1.59%, (b) 2.08%, respectively. The relative error indicates the magnitude of the error compared to the actual length, as illustrated in Equation (4).
Table 2.
Experimental results. ’Abs. Err.’, ’Rel. Err.’, and ’S.E’ are abbreviations for absolute error, relative error, and standard error, respectively. In experiments 1 and 2, the relative errors were (a) 1.59% and (b) 2.08%, respectively, lower than the (c) 3.25% of the manual measurement.
These results corresponded to errors of 0.79 cm and 1.04 cm, at a length of 50 cm. Compared to the relative error of the manual size measurement (3.25%, value (c) in Table 2), the experimental results showed that it was sufficiently accurate to replace manual measurements in terms of precision. In addition, the standard errors of both experiments were less than 0.0020 (0.20%), indicating that our design of the size measurement was tolerant even if the positions or arrangements of the clothes were slightly different.
The average relative error was mainly inflated by some sizes with large relative errors (e.g., cuff opening and leg opening in Table A1); there were two main reasons for this. First, when the actual length was small, the relative error was overestimated. This is explained by the fact that the absolute errors were all less than 1 cm regardless of the sizes, except for the front rise in Experiment 2. On the other hand, when the detected measurement point deviated slightly from the position, the error increased proportionately. We observed that at certain points with relatively poor visual features (e.g., points on the back of the neck of a T-shirt, the crotch point of shorts and trousers in Table A1), the detection performance also deteriorated. Because the DeepFashion2 dataset [16] contained mostly images of people in clothes, some points were obscured by the human skin. In this case, the detection locations of the points could be slightly different due to the lack of data for these specific points.
5. Discussion
Our proposed method exhibited precision and tolerance performance comparable to that of manual sizing, as presented in Table 2 above. In addition, it had practical and robust advantages over the previous methods [8,9] that used only 2D images in two respects: (1) no external workbench constraints and (2) direct sizing point detection.
One of the major benefits of using a LiDAR sensor to measure clothing size is that it does not require any environmental controls, as described in Table 3. Because past methods [8,9,10,11] relied solely on 2D images, they required delicate environment controls and camera calibration to map the spatial information for each pixel. For these approaches, the external environment has to be designed by considering all components (e.g., the distance between the clothes and the camera, the angle and curvature of the camera lens, the lighting plate under the clothes, etc.) related to the clothing and the camera. In other words, they require allotted space for equipment installation and preparatory work, which is impractical to apply in small businesses and with consumers. By contrast, the proposed method technically does not require these constraints. The operator who wants to measure the sizes does not need to know about the information, such as camera specifications or distance to the clothes. It is because the LiDAR sensor can record the distance to the target space at the level of 0.00001 cm with the same viewpoint as the 2D image. In summary, with a single mobile device, anyone, anywhere, can measure size instantly.
Table 3.
Comparison table with previous garment sizing methods. Since the previous methods derived the actual sizes from the images, all environmental factors between the camera and the clothes had to be strictly controlled. On the other hand, our method (using the LiDAR sensor) does not require any of these setups.
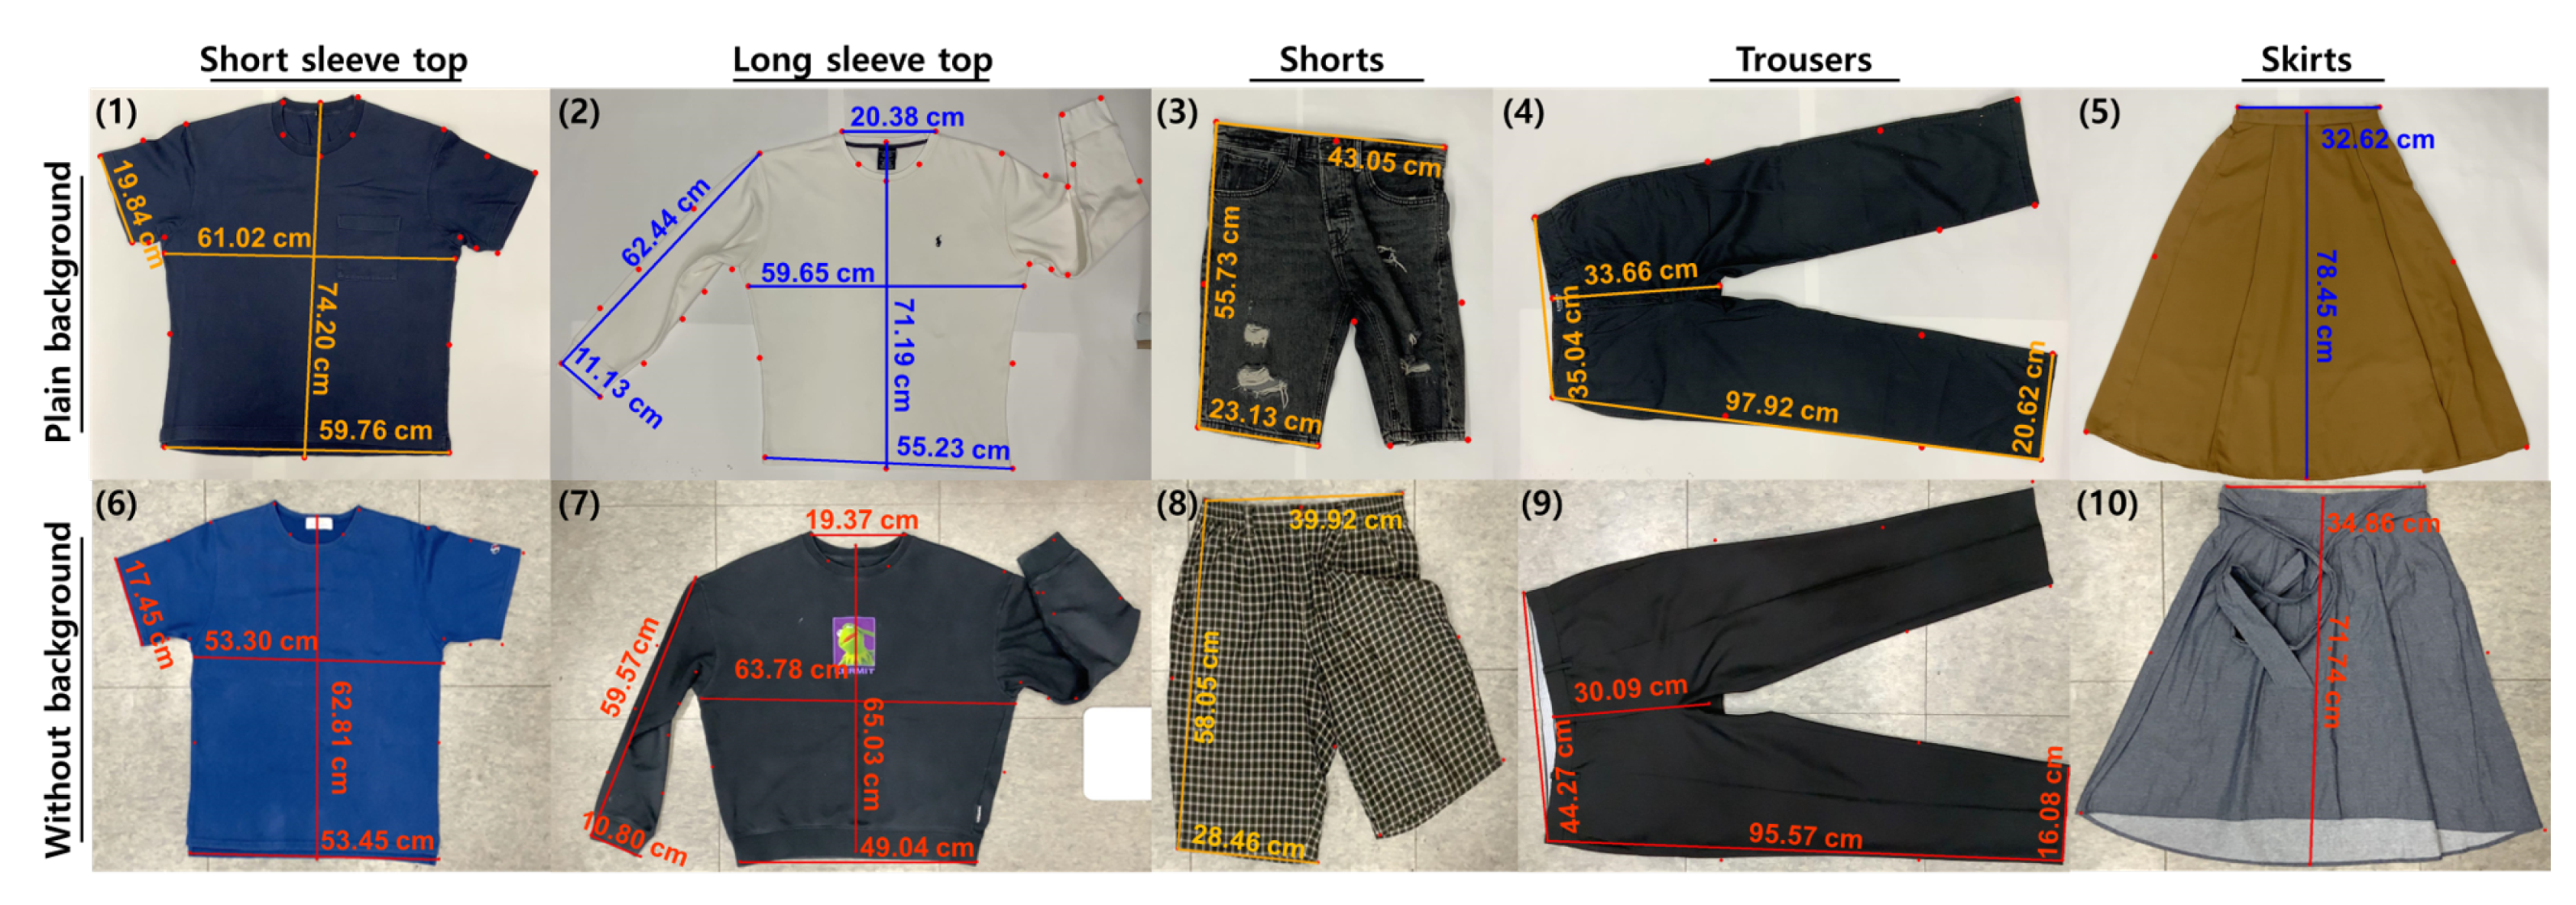
A point detector based on vision deep learning is robust to shape, orientation, and color [35] because it finds the size measurement point directly without a contour extraction process. As shown in Figure 2, we succeeded in measuring the sizes of clothes of various colors and designs in an environment with and without a background. Moreover, our experimental results prove its tolerance to errors that may be caused by human factors. In the fashion industry, where designs are diverse, it is difficult to fit multiple clothing images on a predefined template. Because there are various shapes within the same clothing types (e.g., three-quarter sleeve shirt and pleated skirt), it is not feasible to prepare all outline templates in advance to respond to these various shapes. These approaches also require lighting plates of colored backgrounds to determine the outlines of the clothes in the image. By contrast, as shown in Table 3, the deep learning-based point detector identifies the visual features of the area around the measurement points. Therefore, regardless of the arrangement, orientation, or color of the clothes, measurements can be made directly without contour extraction.
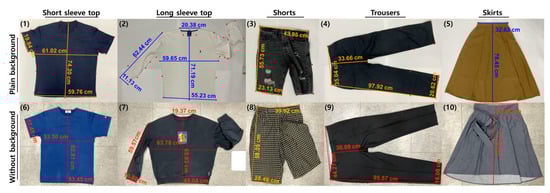
Figure 2.
Some examples of size measurement results. These results show the robustness of the point detector model to the shape, orientation, color, and background. The left arm of the long sleeve top (2, 7) and left leg of the shorts (3, 8) were folded, and the skirt (10) had a different front/back shape. The trousers (4, 9) rotated 90° counterclockwise and the white long sleeve top (2) were the same color as the background; all parts were successfully sized.
6. Conclusions
Although there have been remarkable advances made in artificial intelligence technology, it was developed with a focus on specialized algorithms that are still highly dependent on the format of the data. Despite the development and widespread use of devices, this aspect makes it difficult to converge and utilize the capabilities of different data, thus the applicability to other fields is low. Our study shows that even a simple connection between a deep learning model and point cloud data can exceed the performance of previous sizing methods that required delicately controlled environments and algorithms. Additionally, this method exploits the capabilities of a device that is readily available and it easy to use in various small businesses.
In our approach, the point cloud is simply used to find the distance between two points, but the size measurement method using the point cloud has greater potential for advancement. A point cloud has many points projected at a uniform angle; therefore, there can be more points between the sizing points. It is possible to find not only the distance between two distant points, but also the distance between all adjacent points, and the size can be obtained by summing all these distances. A garment has different curves that are not flat; therefore, we can estimate a more precise size measurement by segmentalizing the arch shapes. In this manner, even a slight wrinkle or clothing hanging on a hanger can be sized by calculating the distance to the surface. We believe that this approach will allow size measurements in various situations. We will elaborate on this method in a future study that is currently in progress.
Author Contributions
Conceptualization, S.K. (Seounggeun Kim) and S.K. (Sunghwan Kim); methodology, S.K. (Seounggeun Kim); software, S.K. (Seounggeun Kim); validation, S.K. (Seounggeun Kim); formal analysis, S.K. (Seounggeun Kim) and S.K. (Sunghwan Kim); investigation, S.K. (Seounggeun Kim); resources, S.K. (Sunghwan Kim); data curation, S.K. (Seounggeun Kim) and H.M.; writing—original draft preparation, S.K. (Seounggeun Kim) and J.O.; writing—review and editing, S.K. (Seounggeun Kim), J.O., Y.L. and H.K.; visualization, S.K. (Seounggeun Kim) and H.M.; supervision, S.K. (Sunghwan Kim); project administration, S.K. (Seounggeun Kim); funding acquisition, S.K. (Sunghwan Kim) All authors have read and agreed to the published version of the manuscript.
Funding
This research was supported by the National Research Foundation of Korea (NRF) funded by the Ministry of Education, Science, and Technology (NRF-2021R1A4A5032622 and NRF-2020R1C1C1A01005229).
Institutional Review Board Statement
Not applicable.
Informed Consent Statement
Not applicable.
Data Availability Statement
All source codes and the datasets for testing are available online at https://github.com/ZinoStudio931/Automatic-Garments-Size-Measurement-using-HRNet-and-Point-Cloud (generated on 26 April 2022) and http://www.hifiai.pe.kr/ (generated on 20 April 2022), respectively. The DeepFashion2 dataset is available at https://github.com/switchablenorms/DeepFashion2 (accessed on 30 November 2021) upon request.
Conflicts of Interest
The authors declare no conflict of interest.
Abbreviations
The following abbreviations are used in this manuscript:
| MDPI | Multidisciplinary Digital Publishing Institute |
| DOAJ | Directory of Open Access Journals |
| LiDAR | light detection and ranging |
| ToF | time of flight |
| µm | micrometer |
| MP | megapixels |
Appendix A
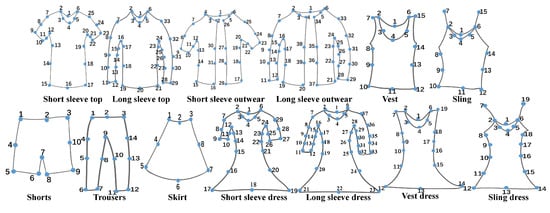
Figure A1.
Definitions of landmarks in DeepFashion2 Dataset.
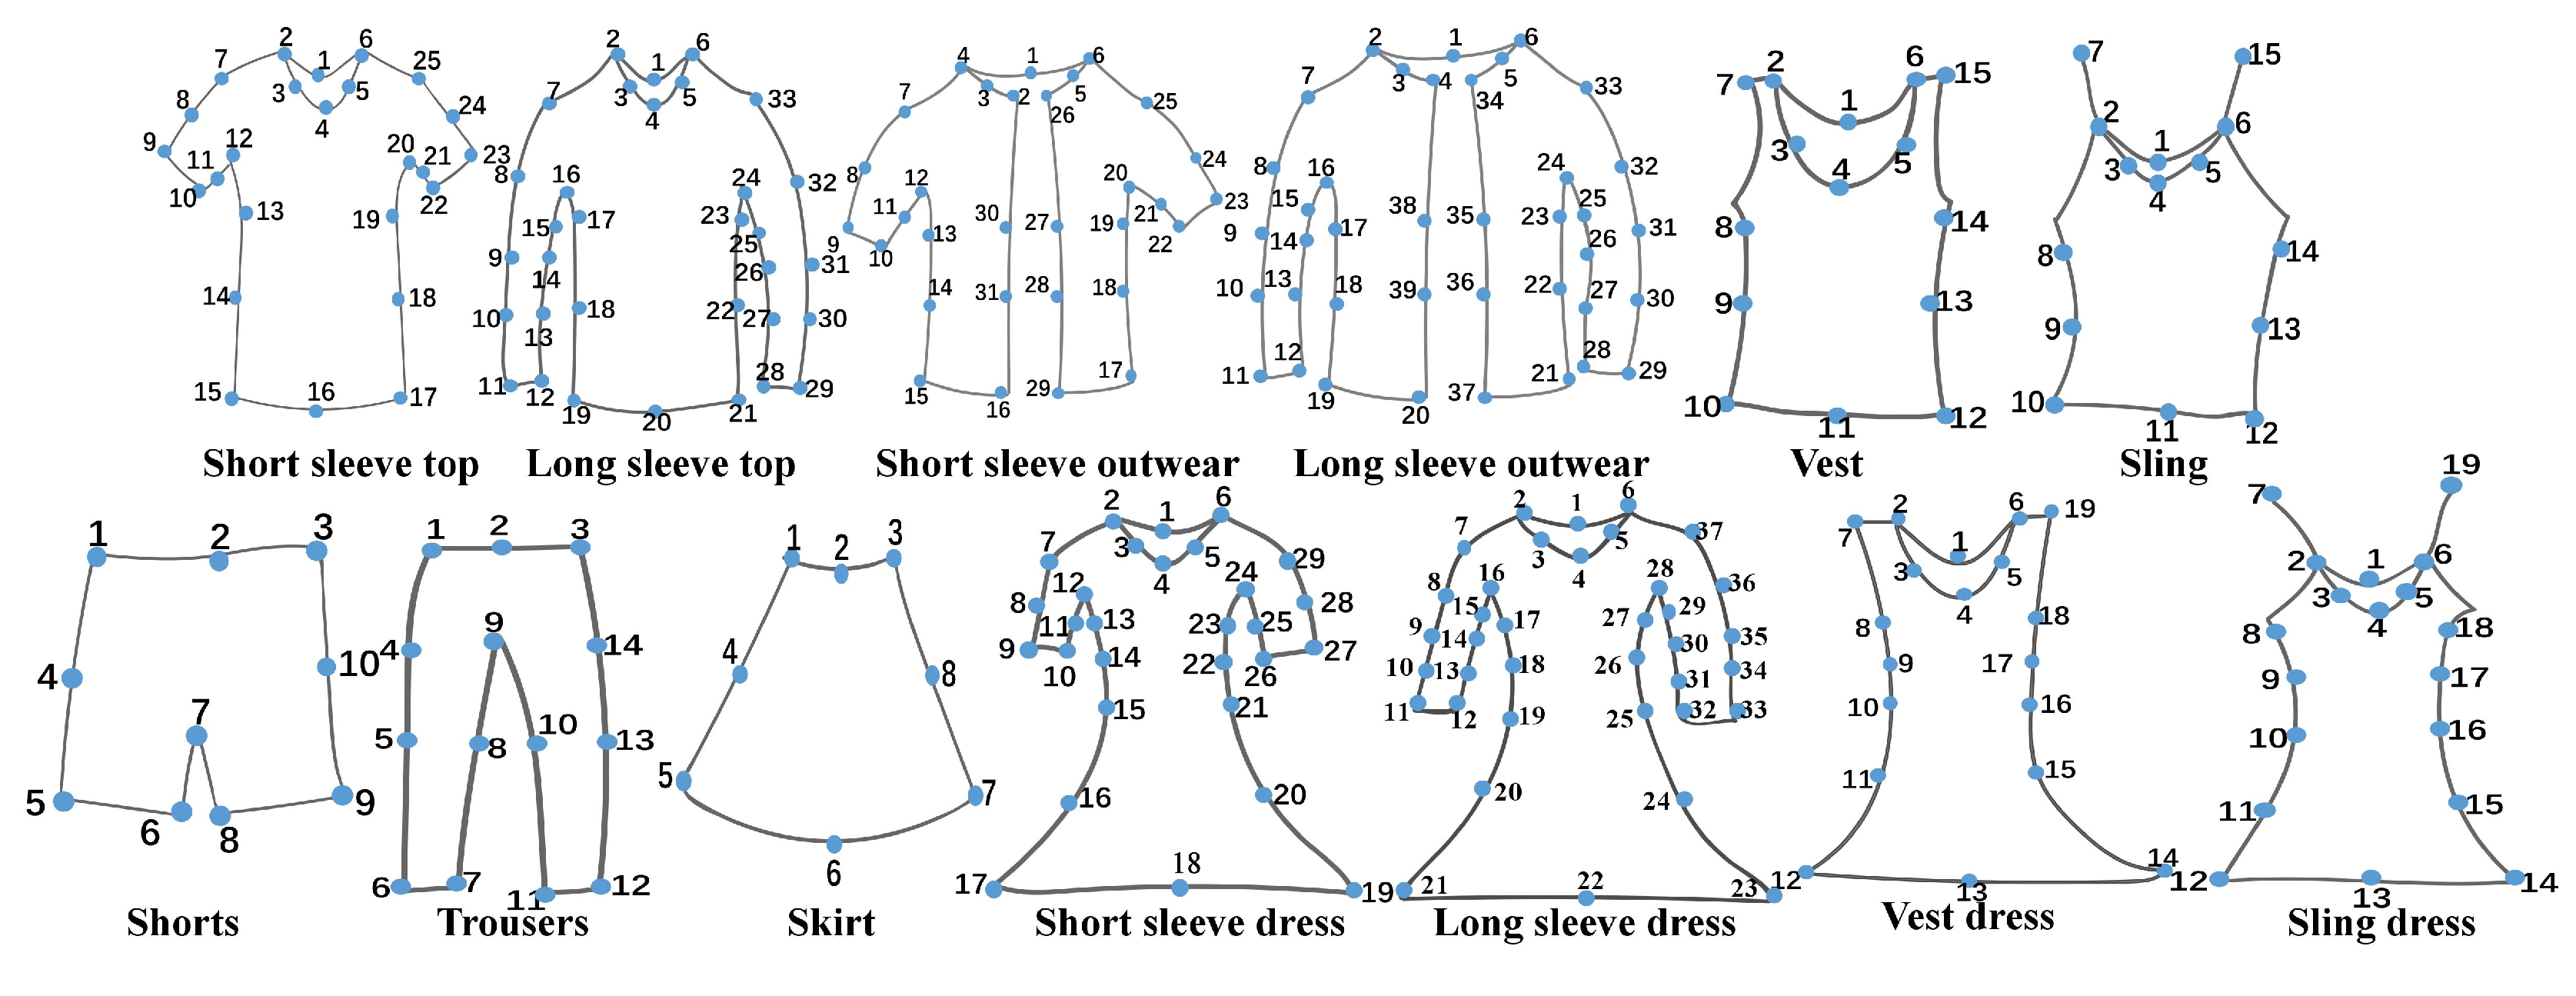
Table A1.
Experimental results. Each value on the left side represents the average value and the corresponding value in brackets indicates its standard error *.
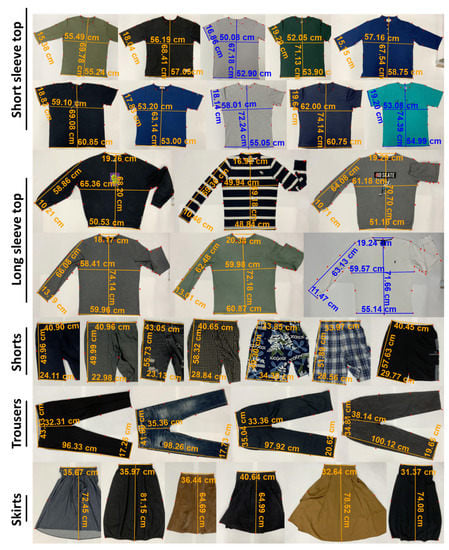
Figure A2.
Samples of Experiment 1 (on white background) results with 33 pieces of clothing.
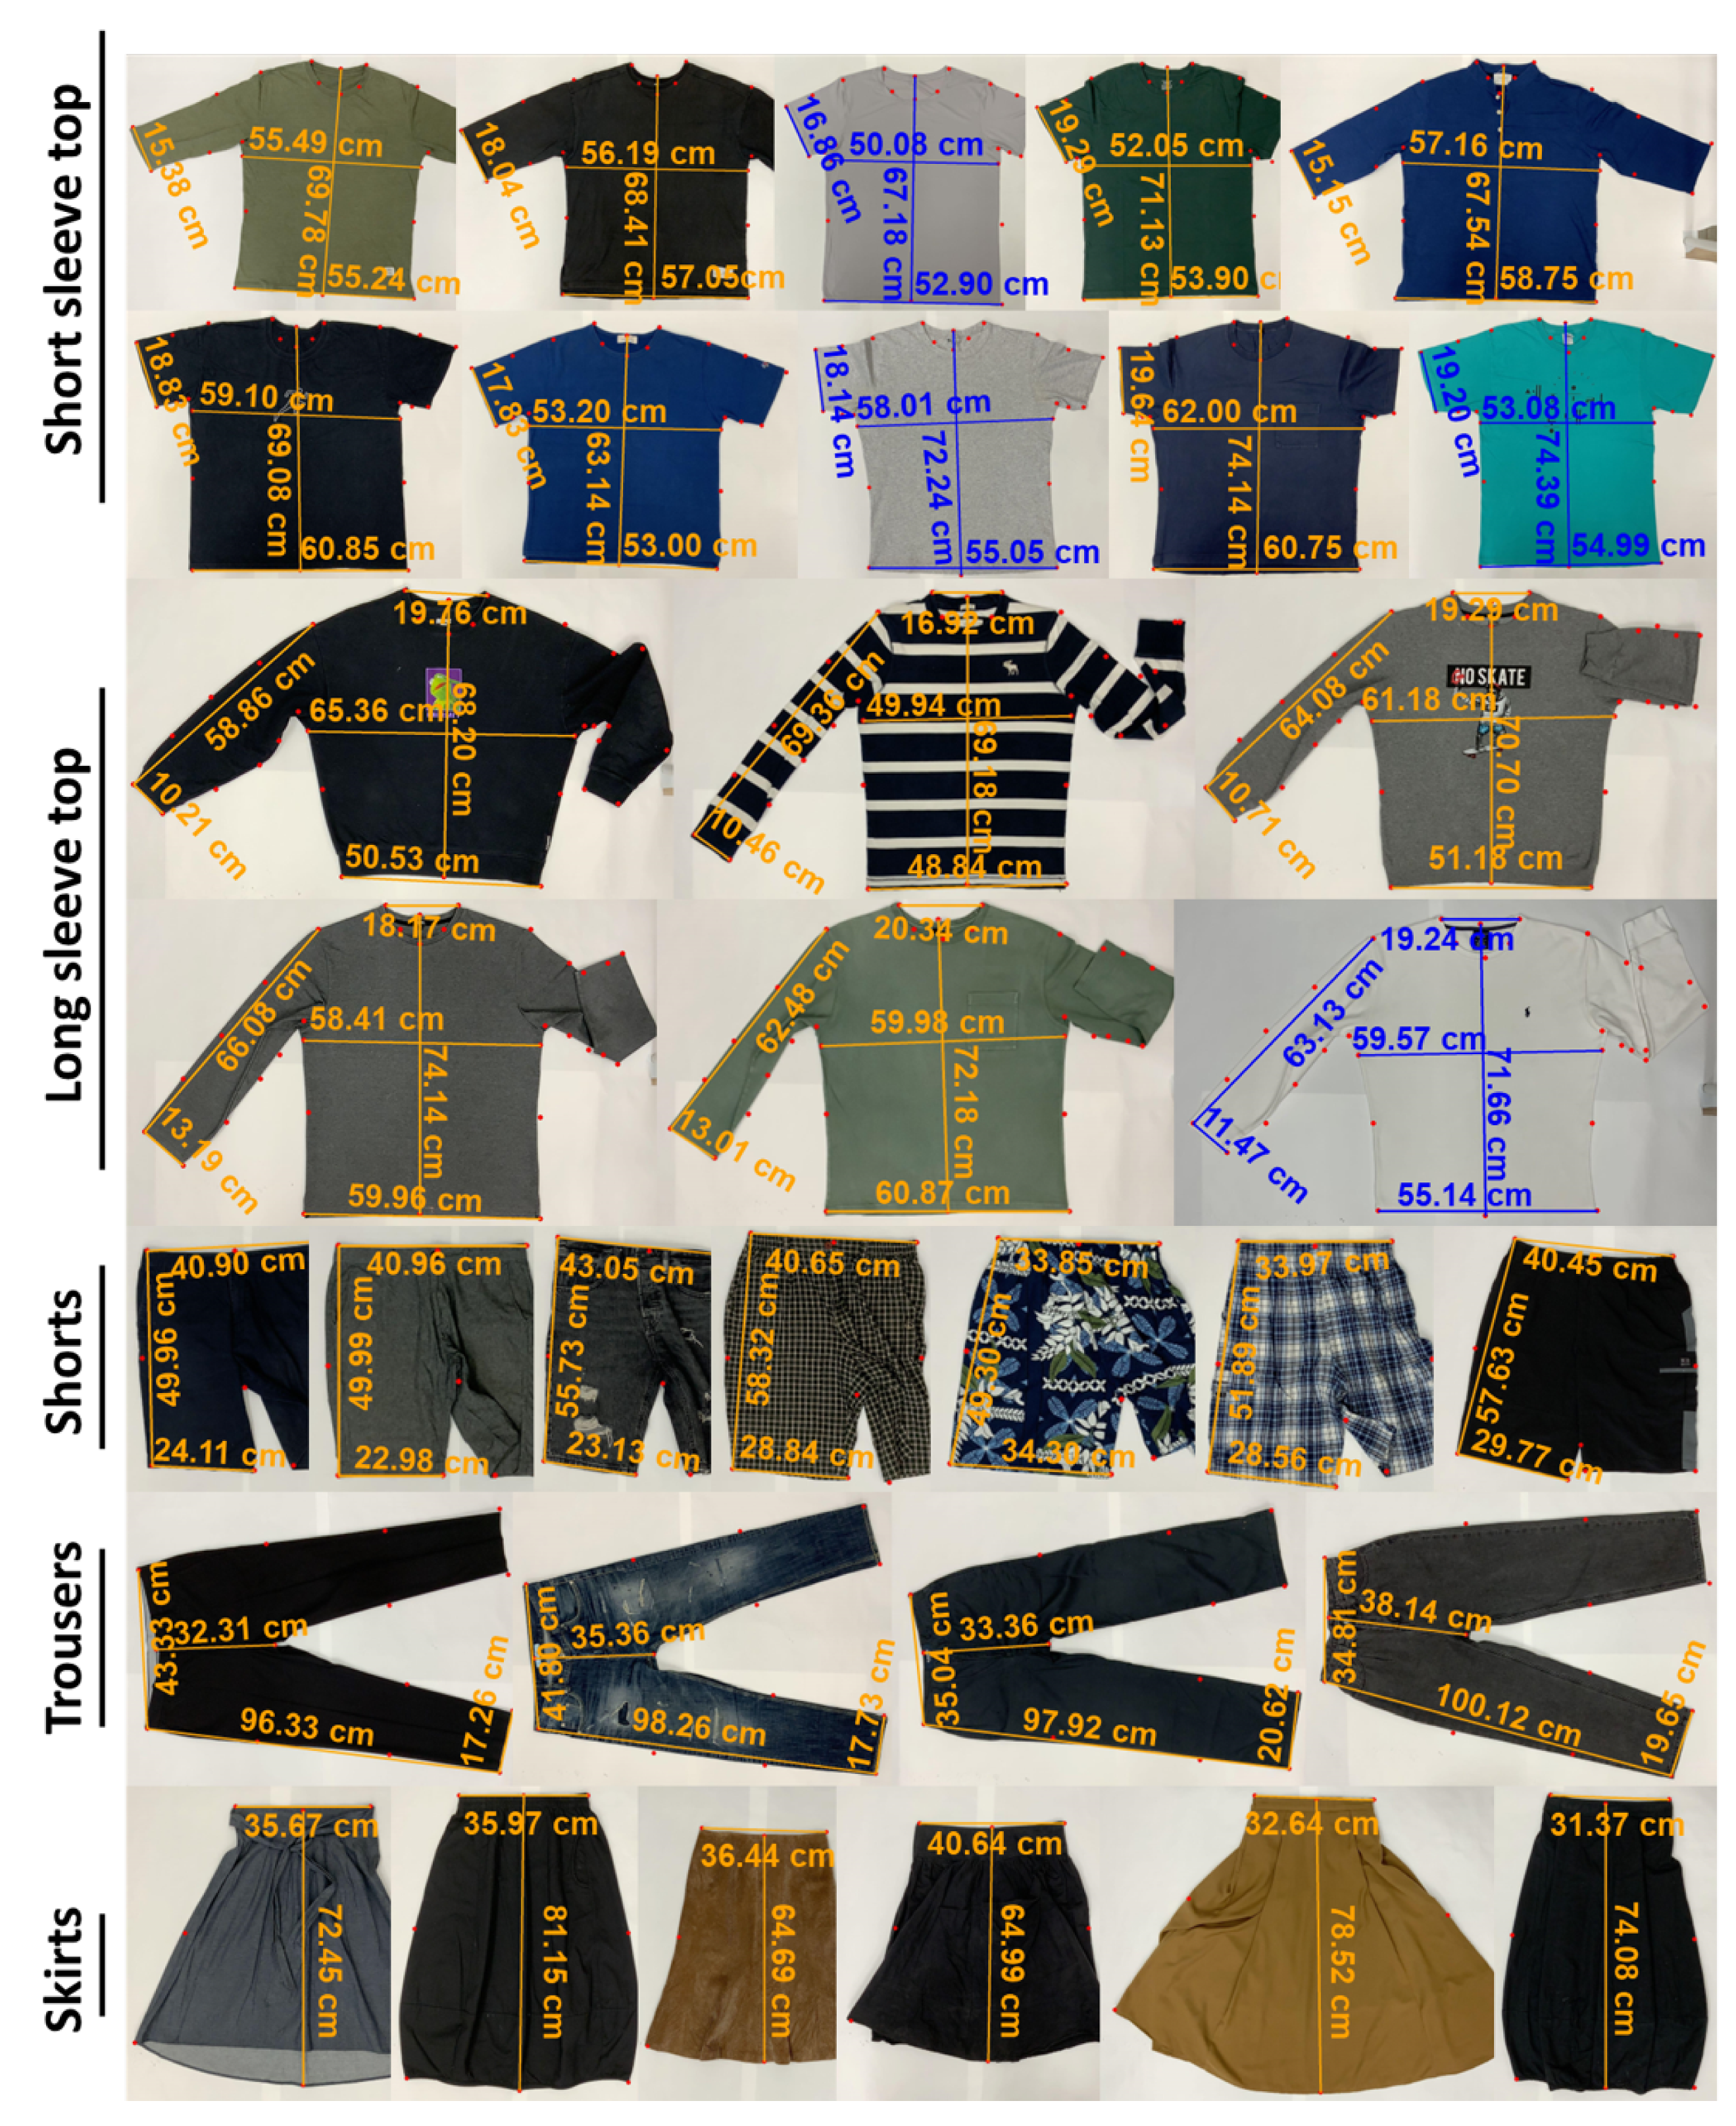
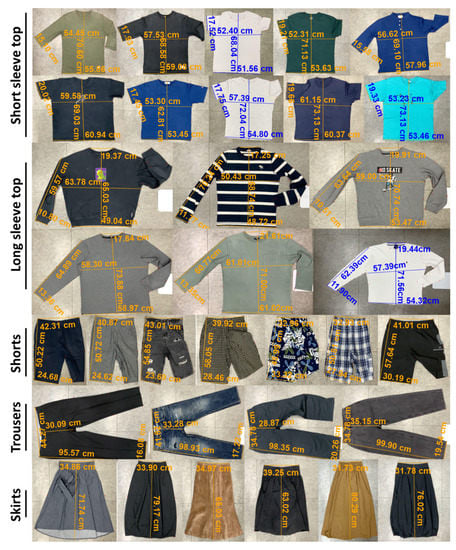
Figure A3.
Samples of Experiment 2 (without background) results with 33 pieces of clothing.

References
- Desmarteau, K. CAD: Let the Fit Revolution Begin. Bobbin 2000, 42, 42. [Google Scholar]
- Abdulla, G.M.; Borar, S. Size Recommendation System for Fashion E-Commerce. In Proceedings of the KDD Workshop on Machine Learning Meets Fashion, Halifax, NS, Canada, 14 August 2017. [Google Scholar]
- Newcomb, B.; Istock, C. A Case for the Revision of U.S. Sizing Standards. J. Text. Appar. Technol. Manag. 2004, 4, 1–6. [Google Scholar]
- PI, L.A.; Brannon, E.; Ulrich, P.; Presley, A.; Woronka, D.; Grasso, M.; Gray, S.; Fit, C. Understanding Fitting Preferences of Female Consumers: Development an Expert System to Enhance Accurate Sizing Selection; National Textile Center Annual Report: November 2000/I98-A08; The National Textile Center; Available online: http://www.ergo-eg.com/uploads/digi_lib/41.pdf (accessed on 18 May 2022).
- Brownbridge, K.; Gill, S.; Grogan, S.; Kilgariff, S.; Whalley, A. Fashion Misfit: Women’s Dissatisfaction and Its Implications. J. Fash. Mark. Manag. Int. J. 2018, 22, 438–452. [Google Scholar] [CrossRef]
- Petrova, A.; Ashdown, S.P. Comparison of Garment Sizing Systems. Cloth. Text. Res. J. 2012, 30, 267–284. [Google Scholar] [CrossRef]
- Hsu, C.-H. Data Mining to Improve Industrial Standards and Enhance Production and Marketing: An Empirical Study in Apparel Industry. Expert Syst. Appl. 2009, 36, 4185–4191. [Google Scholar] [CrossRef]
- Li, C.; Xu, Y.; Xiao, Y.; Liu, H.; Feng, M.; Zhang, D. Automatic Measurement of Garment Sizes Using Image Recognition. In Proceedings of the International Conference on Graphics and Signal Processing, ICGSP ’17, Chiba, Japan, 24–26 June 2017; Association for Computing Machinery: New York, NY, USA, 2017; pp. 30–34. [Google Scholar] [CrossRef]
- Cao, L.; Jiang, Y.; Jiang, M. Automatic Measurement of Garment Dimensions Using Machine Vision. In Proceedings of the 2010 International Conference on Computer Application and System Modeling (ICCASM 2010), Taiyuan, China, 22–24 October 2010; Volume 9, pp. V9-30–V9-33. [Google Scholar] [CrossRef]
- Chen, K. Image Analysis Technology in the Automatic Measurement of Garment Dimensions. Asian J. Inf. Technol. 2005, 4, 832–834. [Google Scholar]
- Jianming, D.; Jueliang, H.U. An efficient method for automatic measurement of garment dimensions. J. Text. Res. 2008, 29, 98–101. [Google Scholar]
- Paler, K.; Föglein, J.; Illingworth, J.; Kittler, J. Local Ordered Grey Levels as an Aid to Corner Detection. Pattern Recognit. 1984, 17, 535–543. [Google Scholar] [CrossRef]
- Davies, E.R. Application of the Generalised Hough Transform to Corner Detection. IEE Proc. E Comput. Digit. Tech. 1988, 135, 49–54. [Google Scholar] [CrossRef]
- Belongie, S.; Malik, J.; Puzicha, J. Shape Context: A New Descriptor for Shape Matching and Object Recognition. In Advances in Neural Information Processing Systems; MIT Press: Cambridge, MA, USA, 2000; Volume 13. [Google Scholar]
- Zhang, Z. A Flexible New Technique for Camera Calibration. IEEE Trans. Pattern Anal. Mach. Intell. 2000, 22, 1330–1334. [Google Scholar] [CrossRef] [Green Version]
- Ge, Y.; Zhang, R.; Wang, X.; Tang, X.; Luo, P. DeepFashion2: A Versatile Benchmark for Detection, Pose Estimation, Segmentation and Re-Identification of Clothing Images. In Proceedings of the 2019 IEEE/CVF Conference on Computer Vision and Pattern Recognition (CVPR), Long Beach, CA, USA, 15–20 June 2019; IEEE: Long Beach, CA, USA, 2019; pp. 5332–5340. [Google Scholar] [CrossRef] [Green Version]
- Liu, Z.; Luo, P.; Qiu, S.; Wang, X.; Tang, X. DeepFashion: Powering Robust Clothes Recognition and Retrieval With Rich Annotations. In Proceedings of the IEEE Conference on Computer Vision and Pattern Recognition 2016, Las Vegas, NV, USA, 27–30 June 2006; pp. 1096–1104. [Google Scholar]
- Zou, X.; Kong, X.; Wong, W.; Wang, C.; Liu, Y.; Cao, Y. FashionAI: A Hierarchical Dataset for Fashion Understanding. In Proceedings of the IEEE/CVF Conference on Computer Vision and Pattern Recognition Workshops 2019, Long Beach, CA, USA, 16–17 June 2019. [Google Scholar]
- Sun, K.; Xiao, B.; Liu, D.; Wang, J. Deep High-Resolution Representation Learning for Human Pose Estimation. In Proceedings of the IEEE/CVF Conference on Computer Vision and Pattern Recognition 2019, Long Beach, CA, USA, 15–20 June 2019; pp. 5693–5703. [Google Scholar]
- Lin, T.-H. Aggregation and Finetuning for Clothes Landmark Detection. arXiv 2020, arXiv:2005.00419. [Google Scholar]
- Qian, S. HRNet for Fashion Landmark Estimation. Available online: https://github.com/svip-lab/HRNet-for-Fashion-Landmark-Estimation.PyTorch (accessed on 19 April 2022).
- Newell, A.; Yang, K.; Deng, J. Stacked Hourglass Networks for Human Pose Estimation. In Computer Vision—ECCV 2016, Amsterdam, The Netherlands, 11–14 October 2016; Leibe, B., Matas, J., Sebe, N., Welling, M., Eds.; Lecture Notes in Computer Science; Springer International Publishing: Cham, Switzerland, 2016; pp. 483–499. [Google Scholar] [CrossRef] [Green Version]
- Insafutdinov, E.; Pishchulin, L.; Andres, B.; Andriluka, M.; Schiele, B. DeeperCut: A Deeper, Stronger, and Faster Multi-Person Pose Estimation Model. In Proceedings of the Computer Vision—ECCV 2016, Amsterdam, The Netherlands, 11–14 October 2016; Leibe, B., Matas, J., Sebe, N., Welling, M., Eds.; Lecture Notes in Computer Science. Springer International Publishing: Cham, Switzerland, 2016; pp. 34–50. [Google Scholar] [CrossRef] [Green Version]
- Xiao, B.; Wu, H.; Wei, Y. Simple Baselines for Human Pose Estimation and Tracking. In Proceedings of the European Conference on Computer Vision, Munich, Germany, 8–14 September 2018; pp. 466–481. [Google Scholar]
- Yang, W.; Li, S.; Ouyang, W.; Li, H.; Wang, X. Learning Feature Pyramids for Human Pose Estimation. In Proceedings of the IEEE International Conference on Computer Vision, Salt Lake City, UT, USA, 18–23 June 2018; pp. 1281–1290. [Google Scholar]
- Chen, Y.; Wang, Z.; Peng, Y.; Zhang, Z.; Yu, G.; Sun, J. Cascaded Pyramid Network for Multi-Person Pose Estimation. In Proceedings of the IEEE Conference on Computer Vision and Pattern Recognition, Salt Lake City, UT, USA, 18–22 June 2018; pp. 7103–7112. [Google Scholar]
- Huang, S.; Gong, M.; Tao, D. A Coarse-Fine Network for Keypoint Localization. In Proceedings of the IEEE International Conference on Computer Vision, Venice, Italy, 22–29 October 2017; pp. 3028–3037. [Google Scholar]
- Fang, H.-S.; Xie, S.; Tai, Y.-W.; Lu, C. RMPE: Regional Multi-Person Pose Estimation. In Proceedings of the IEEE International Conference on Computer Vision, Venice, Italy, 22–29 October 2017; pp. 2334–2343. [Google Scholar]
- He, K.; Gkioxari, G.; Dollar, P.; Girshick, R. Mask R-CNN. In Proceedings of the IEEE International Conference on Computer Vision, Venice, Italy, 22–29 October 2017; pp. 2961–2969. [Google Scholar]
- Ko, K.; Gwak, H.; Thoummala, N.; Kwon, H.; Kim, S. SqueezeFace: Integrative Face Recognition Methods with LiDAR Sensors. J. Sensors 2021, 2021, e4312245. [Google Scholar] [CrossRef]
- Mehendale, N.; Neoge, S. Review on Lidar Technology; SSRN Scholarly Paper 3604309; Social Science Research Network: Rochester, NY, USA, 2020. [Google Scholar] [CrossRef]
- Tavani, S.; Billi, A.; Corradetti, A.; Mercuri, M.; Bosman, A.; Cuffaro, M.; Seers, T.; Carminati, E. Smartphone Assisted Fieldwork: Towards the Digital Transition of Geoscience Fieldwork Using LiDAR-Equipped IPhones. Earth-Sci. Rev. 2022, 227, 103969. [Google Scholar] [CrossRef]
- Royo, S.; Ballesta-Garcia, M. An Overview of Lidar Imaging Systems for Autonomous Vehicles. Appl. Sci. 2019, 9, 4093. [Google Scholar] [CrossRef] [Green Version]
- Debeunne, C.; Vivet, D. A Review of Visual-LiDAR Fusion Based Simultaneous Localization and Mapping. Sensors 2020, 20, 2068. [Google Scholar] [CrossRef] [PubMed] [Green Version]
- Alzubaidi, L.; Zhang, J.; Humaidi, A.J.; Al-Dujaili, A.; Duan, Y.; Al-Shamma, O.; Santamaría, J.; Fadhel, M.A.; Al-Amidie, M.; Farhan, L. Review of Deep Learning: Concepts, CNN Architectures, Challenges, Applications, Future Directions. J. Big Data 2021, 8, 53. [Google Scholar] [CrossRef] [PubMed]
- Lin, T.-Y.; Maire, M.; Belongie, S.; Hays, J.; Perona, P.; Ramanan, D.; Dollár, P.; Zitnick, C.L. Microsoft COCO: Common Objects in Context. In Computer Vision—ECCV 2014; Fleet, D., Pajdla, T., Schiele, B., Tuytelaars, T., Eds.; Lecture Notes in Computer Science; Springer International Publishing: Cham, Switzerland, 2014; pp. 740–755. [Google Scholar] [CrossRef] [Green Version]
Publisher’s Note: MDPI stays neutral with regard to jurisdictional claims in published maps and institutional affiliations. |
© 2022 by the authors. Licensee MDPI, Basel, Switzerland. This article is an open access article distributed under the terms and conditions of the Creative Commons Attribution (CC BY) license (https://creativecommons.org/licenses/by/4.0/).