
Experimental Study of Scour Hole Depth around Bridge Pile Using Efficient Cross-Section


Abstract
:1. Introduction
2. Research Significance
3. Methodology
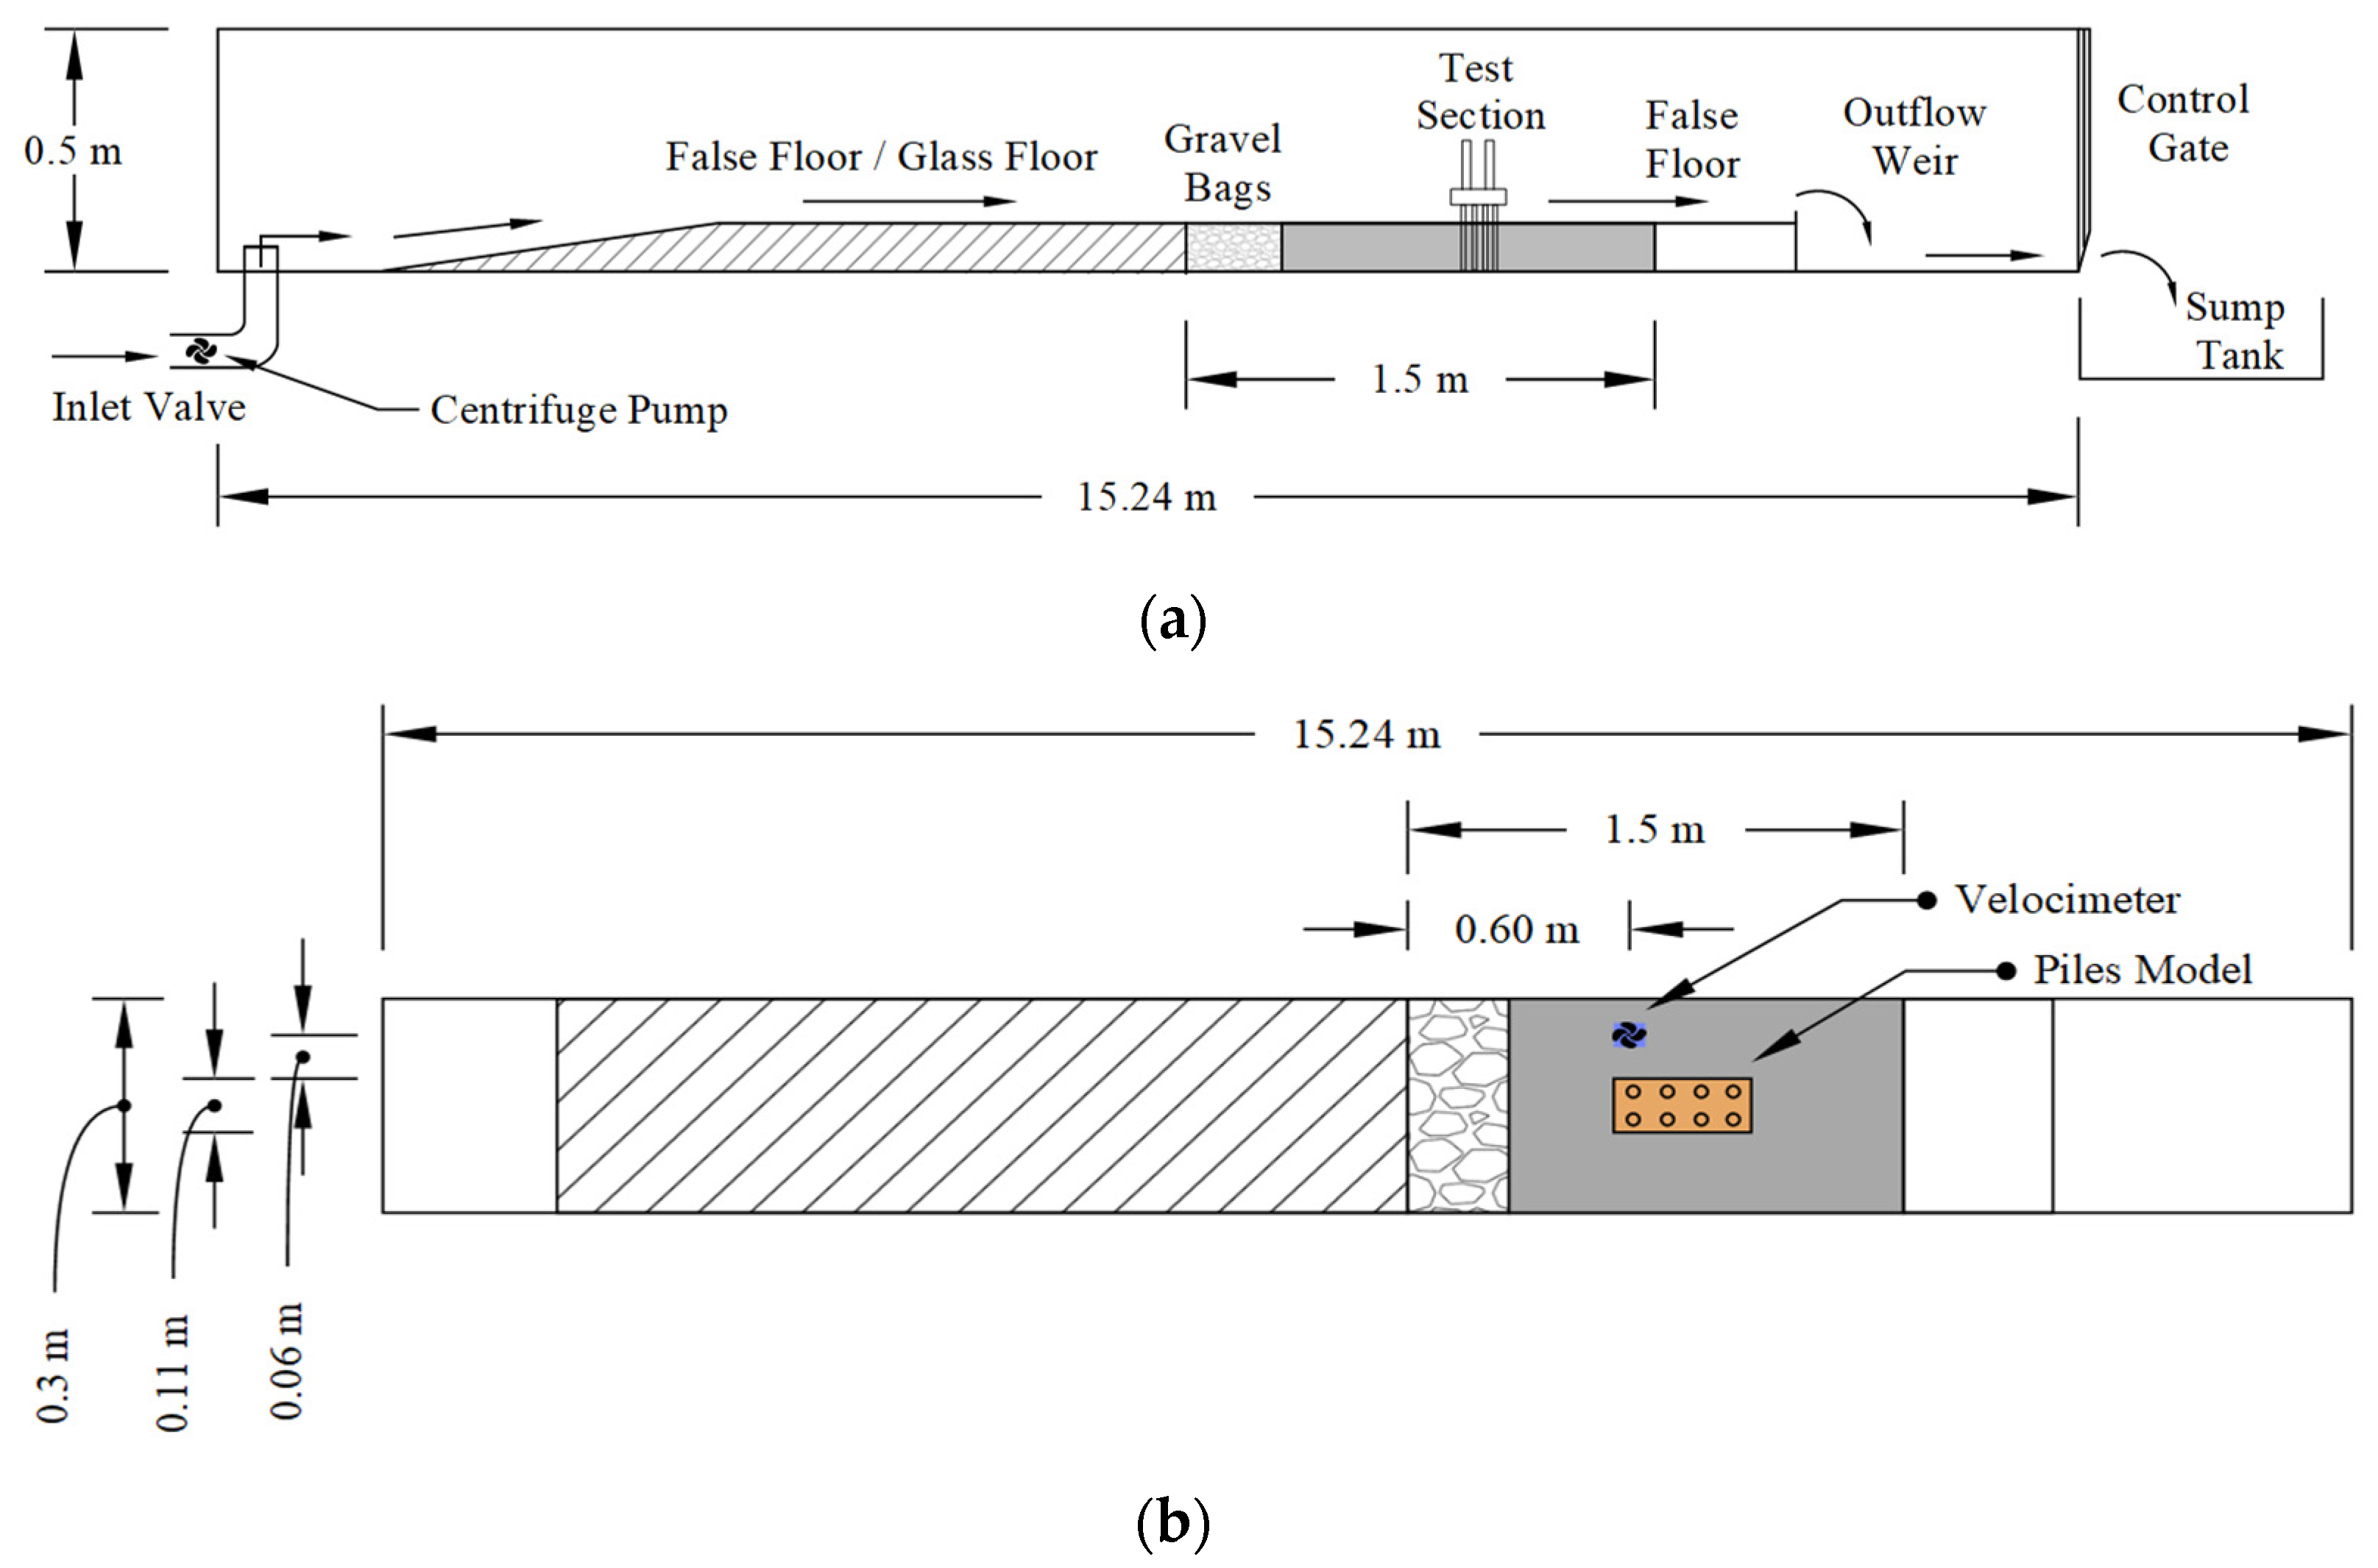
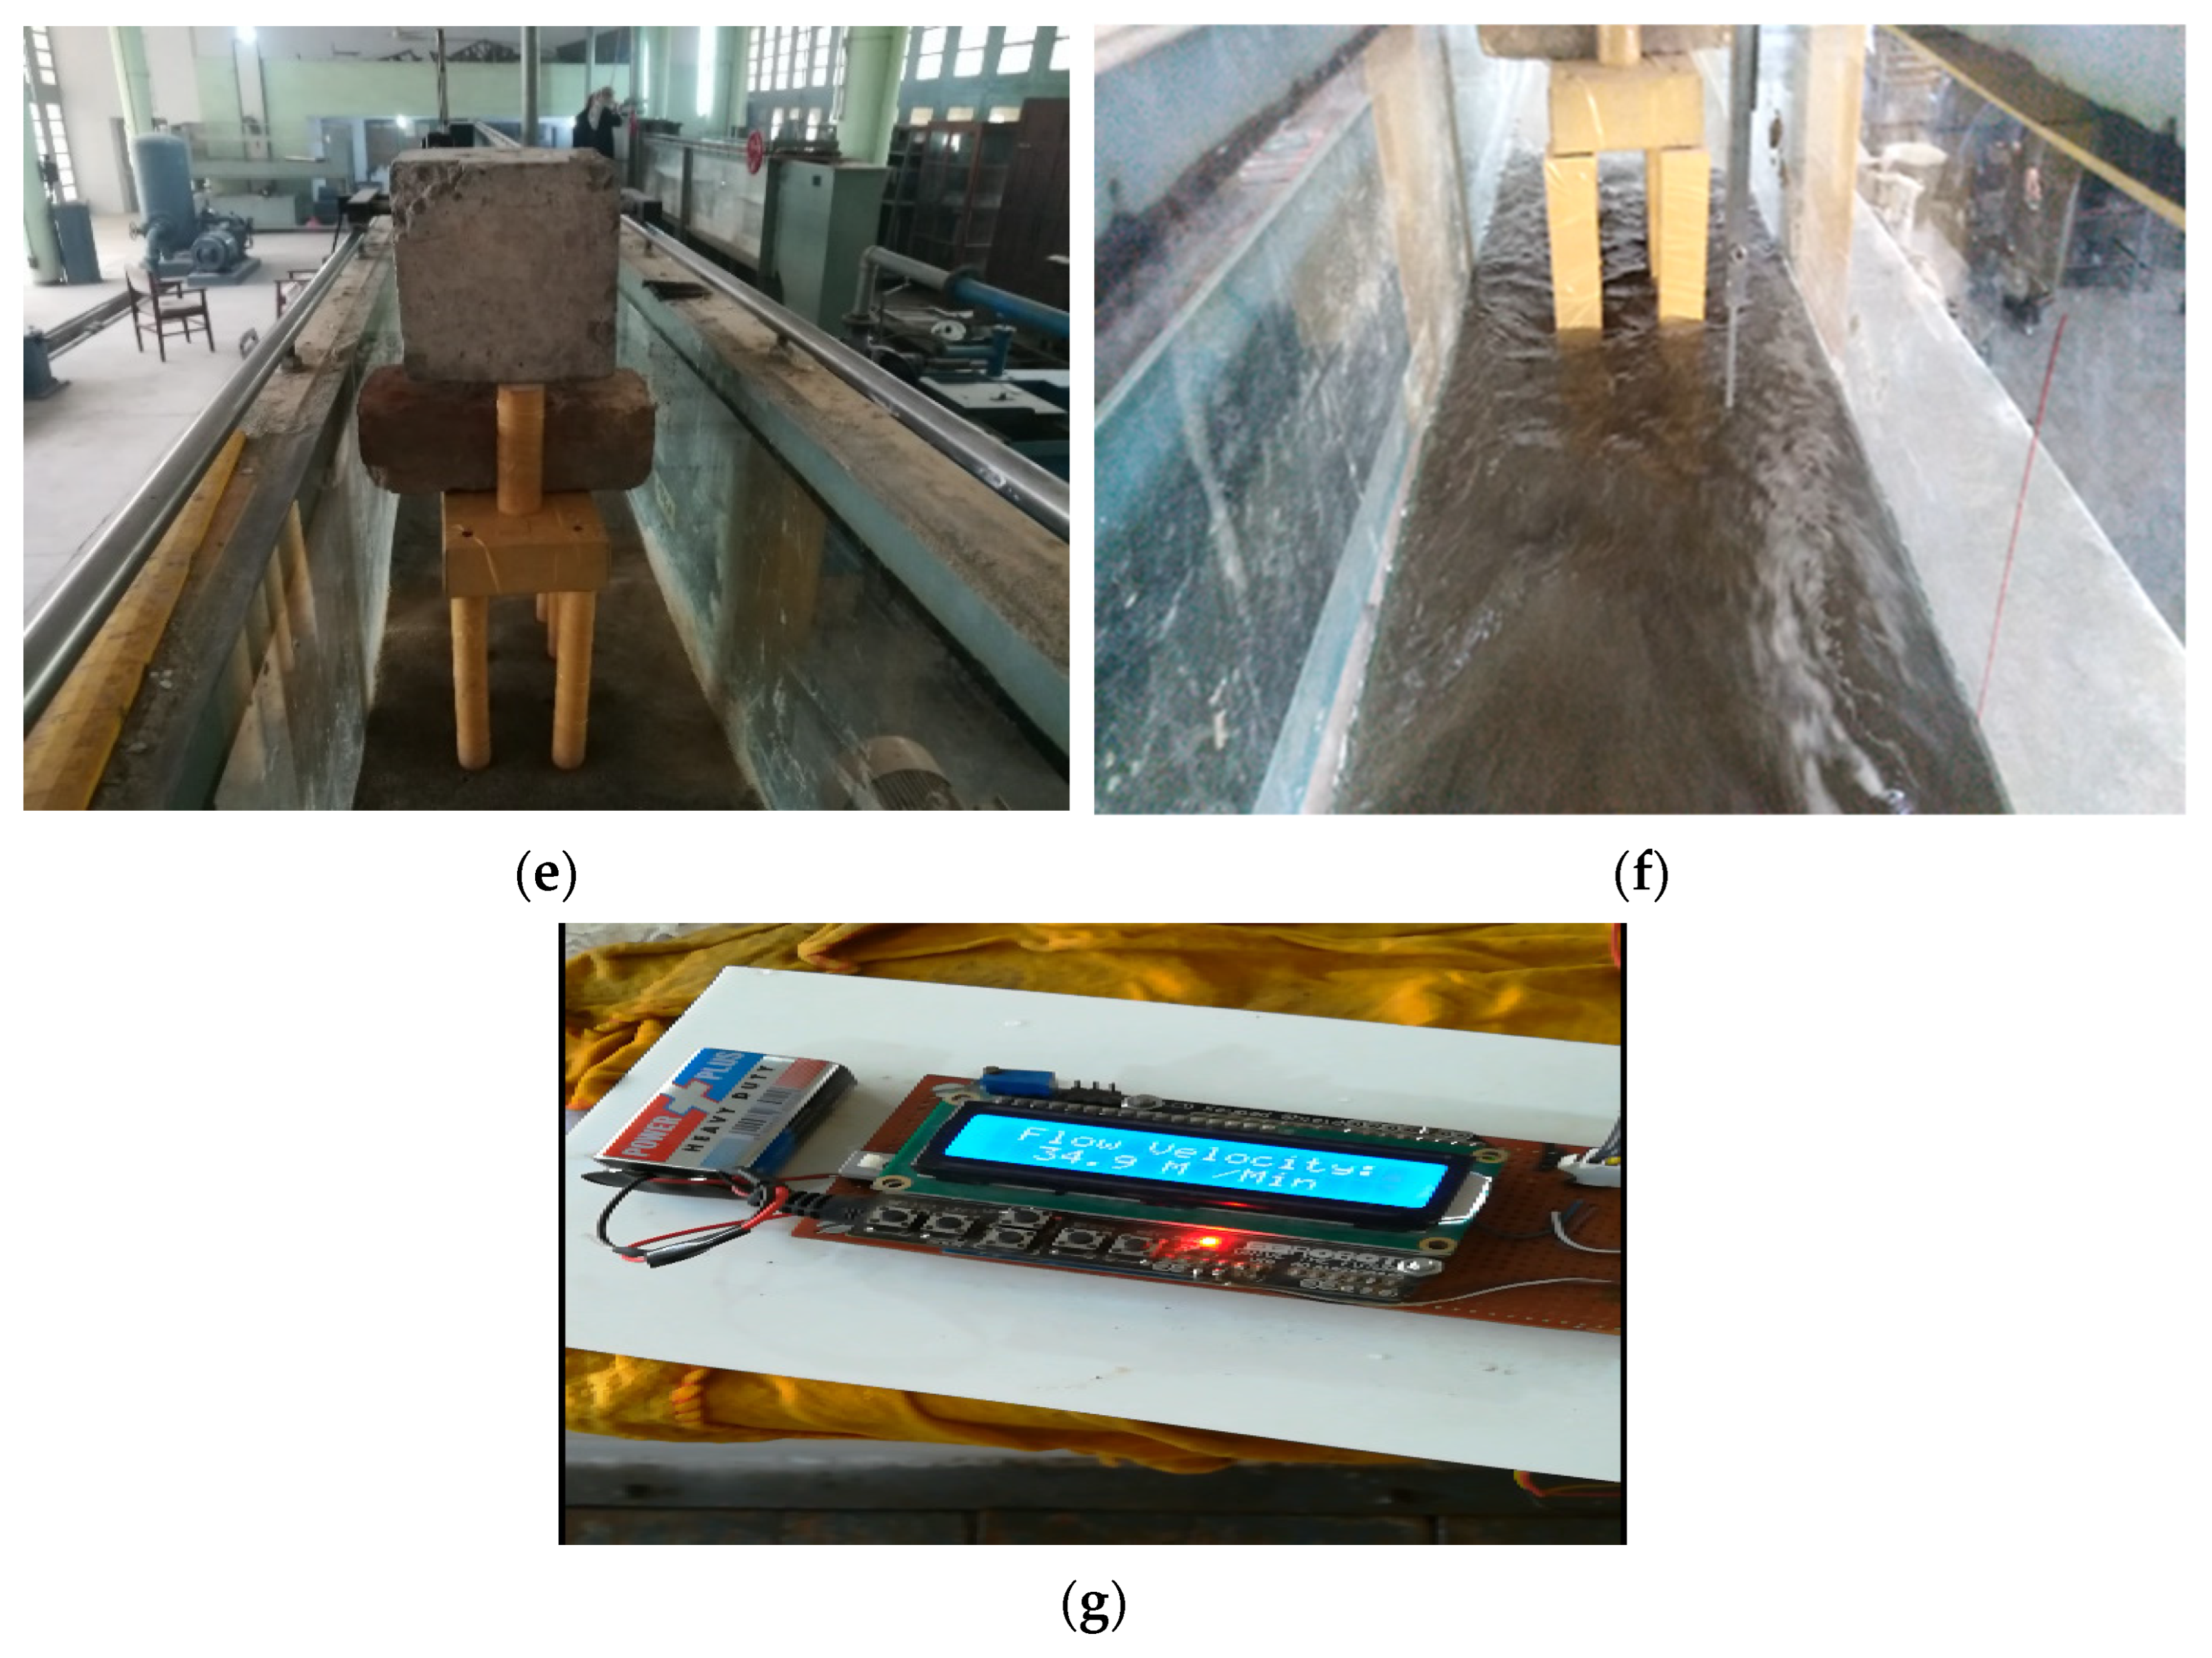
3.1. Flume
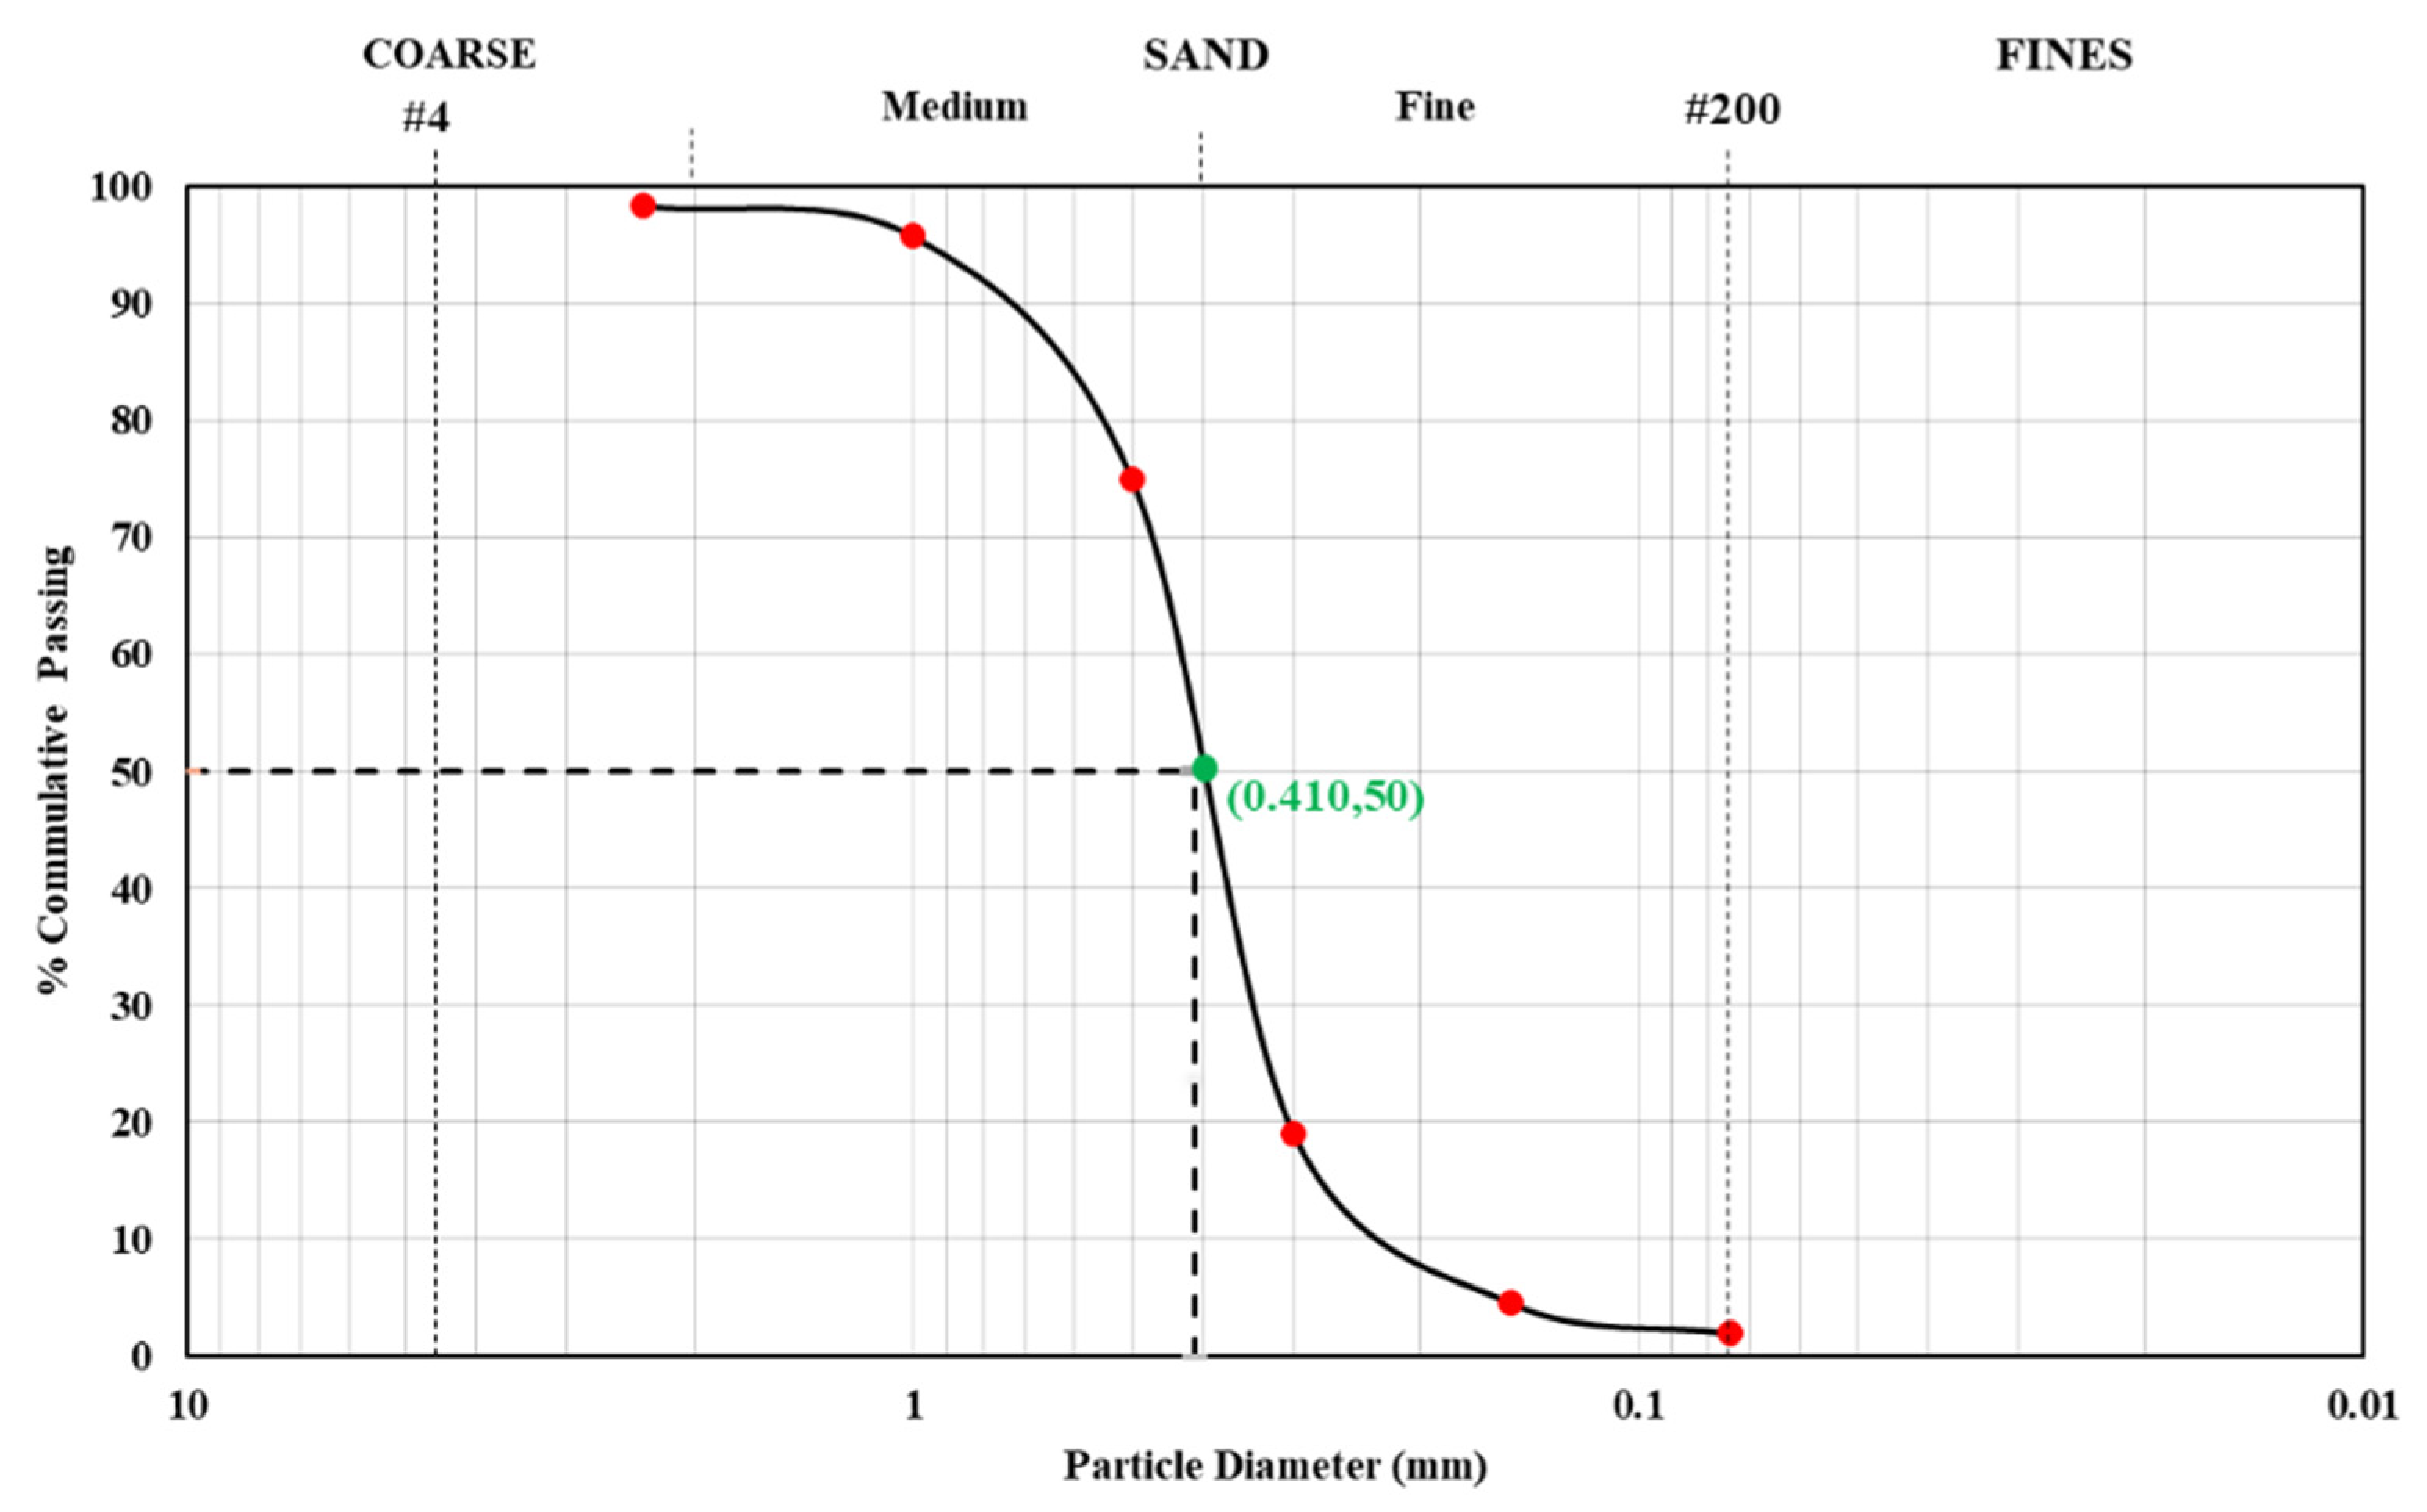
3.2. Sieve Analysis
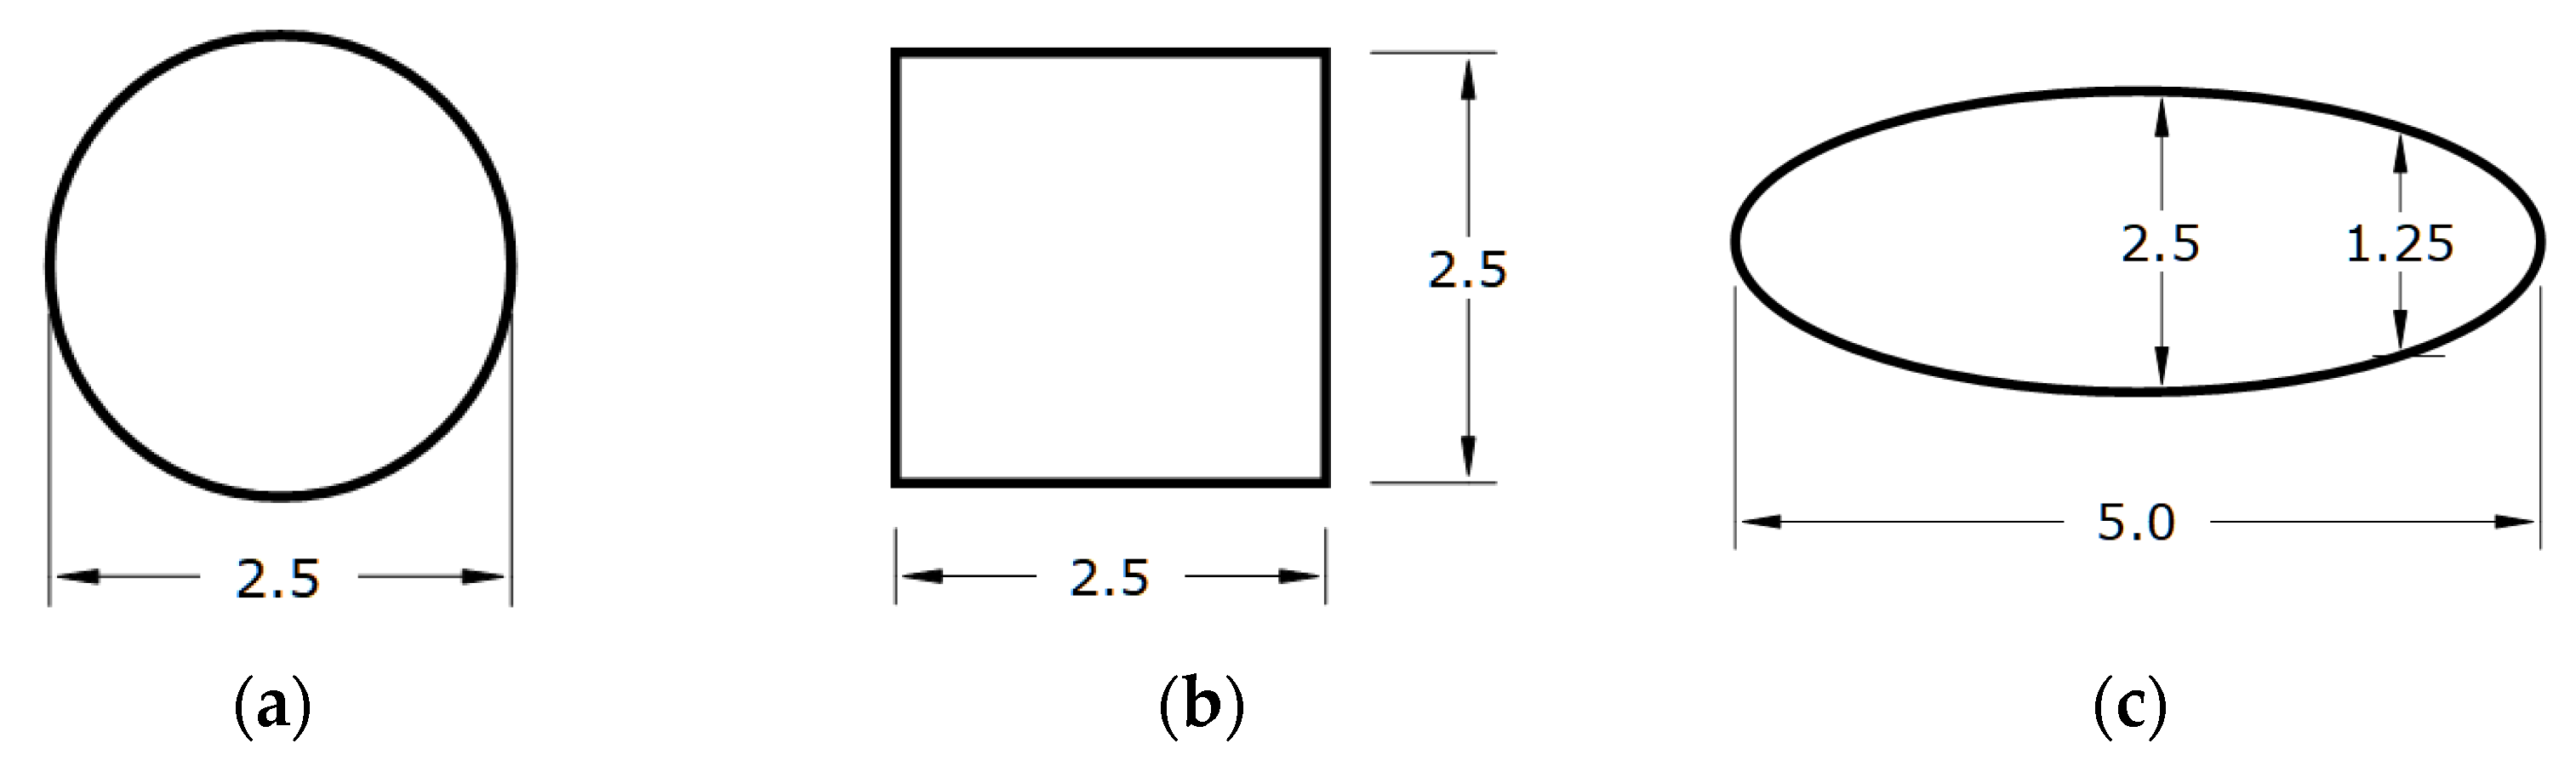
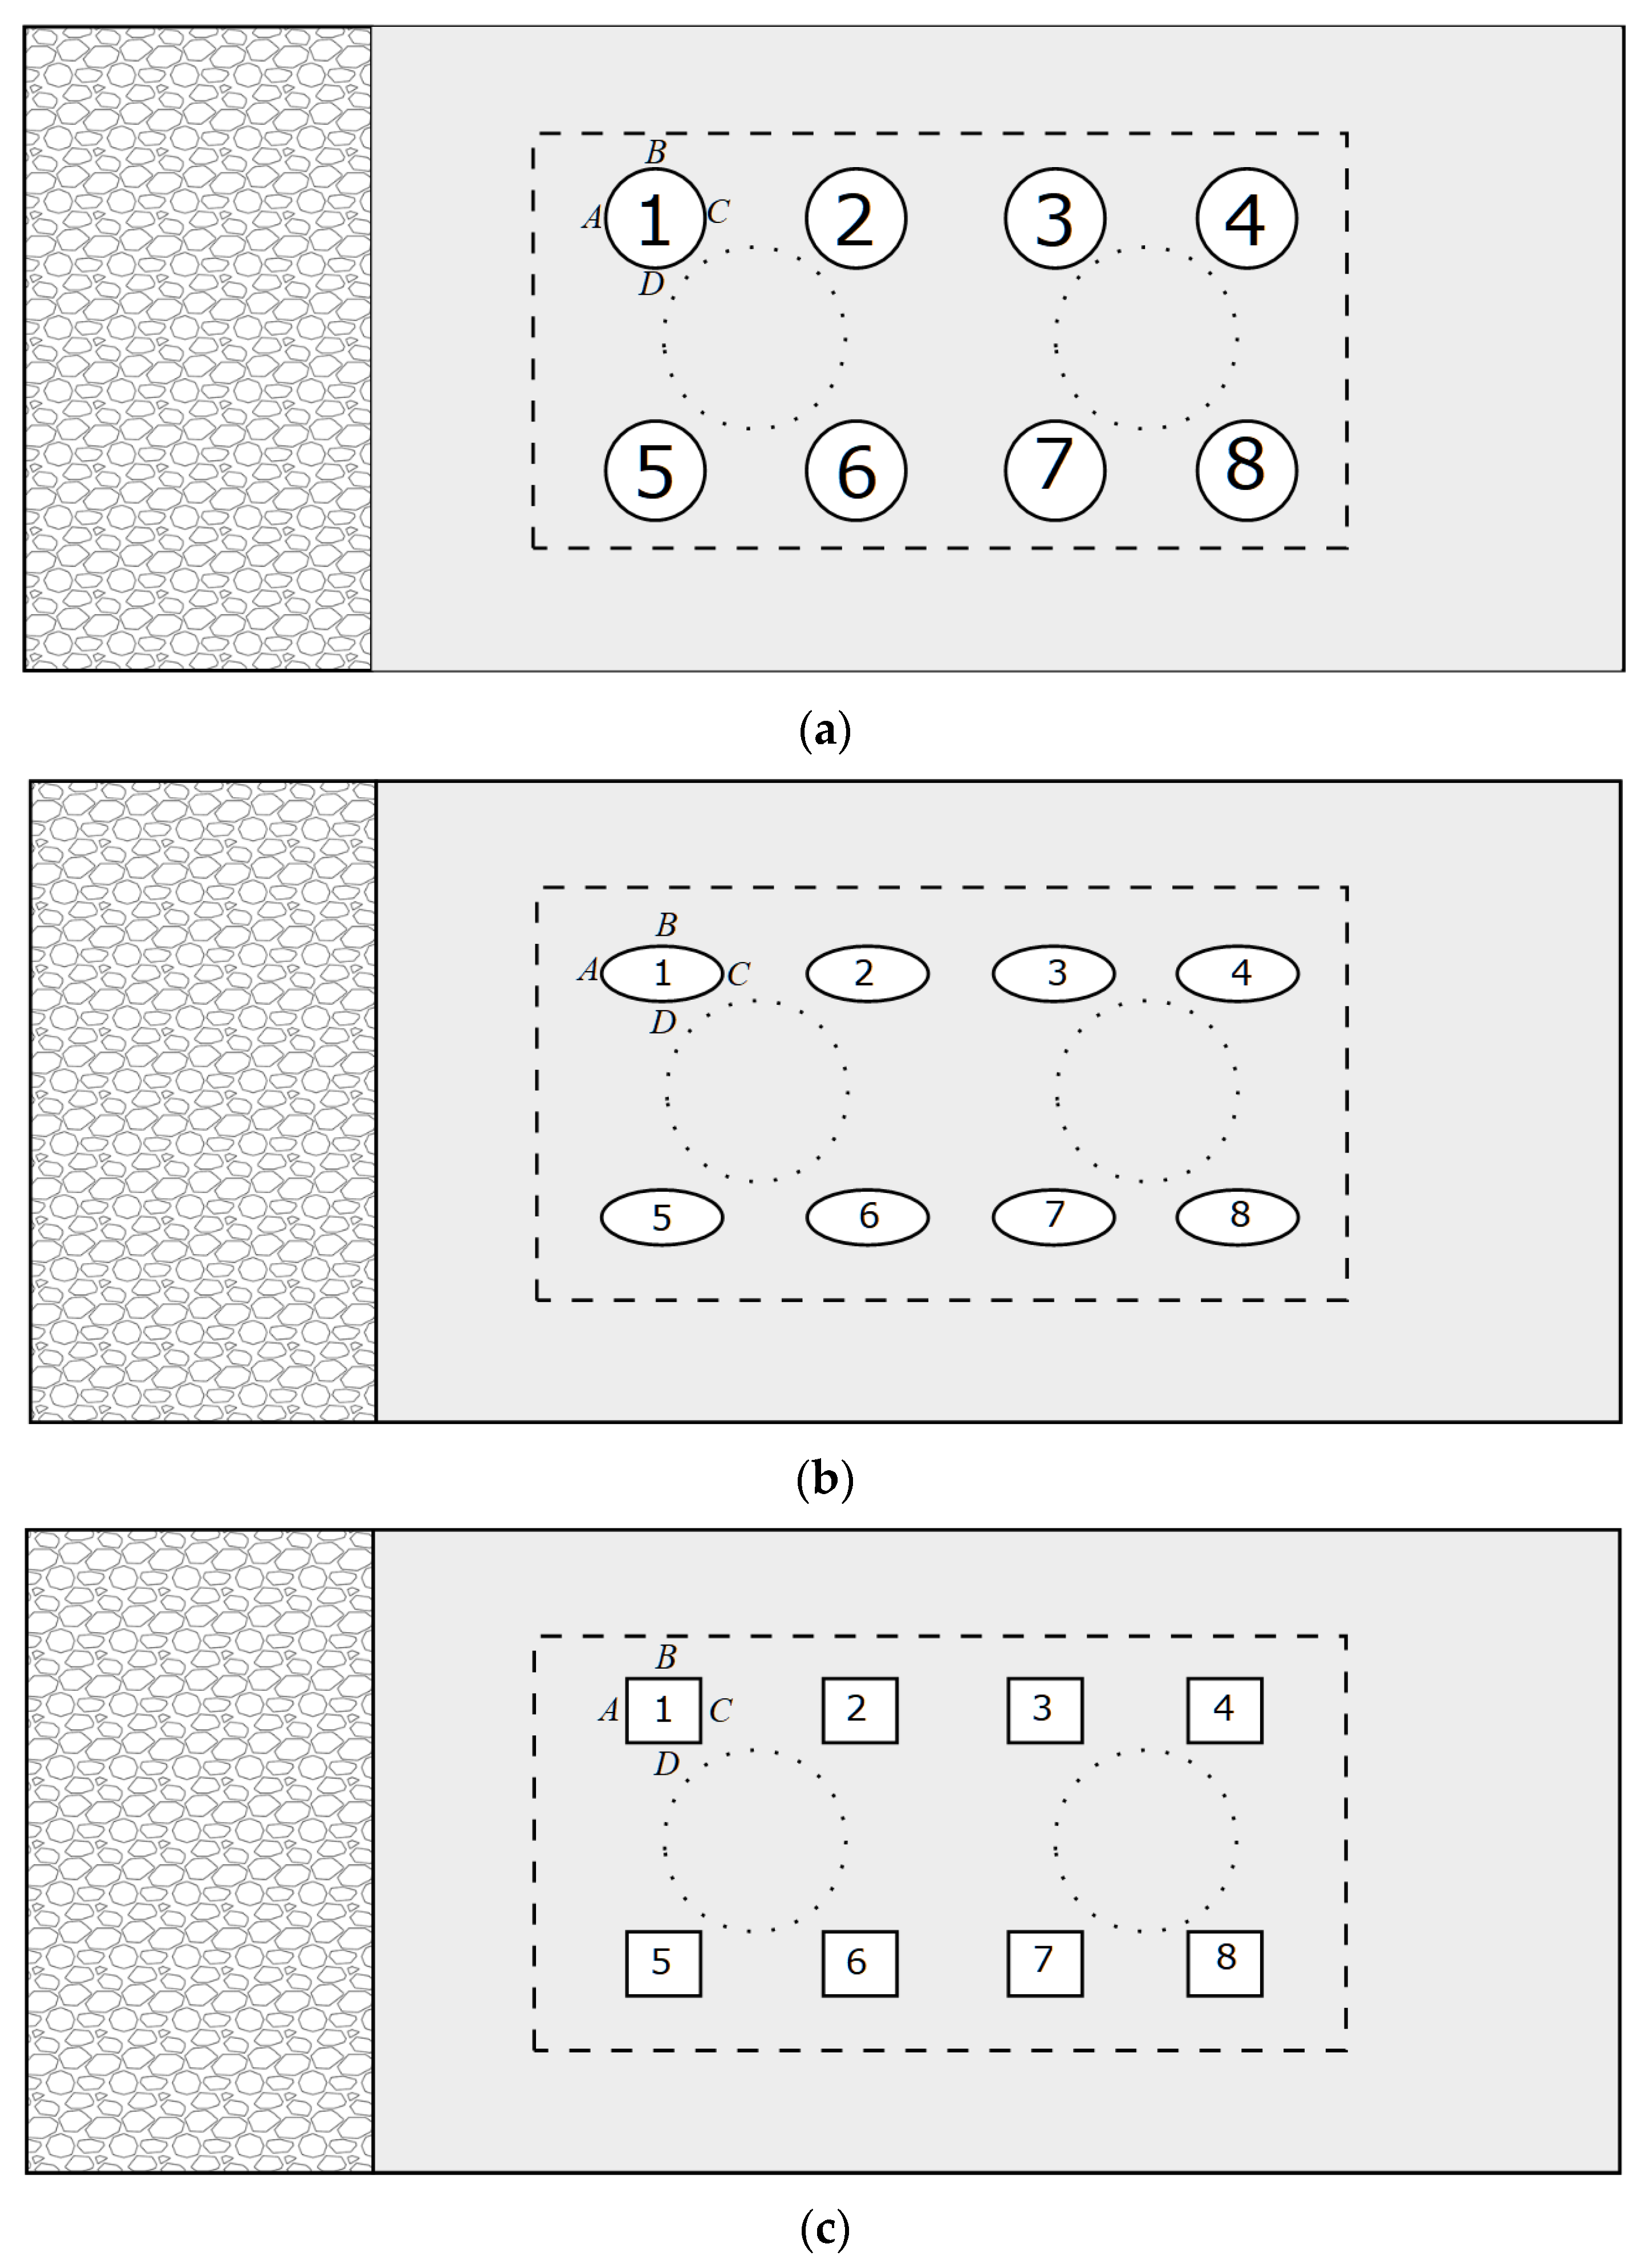
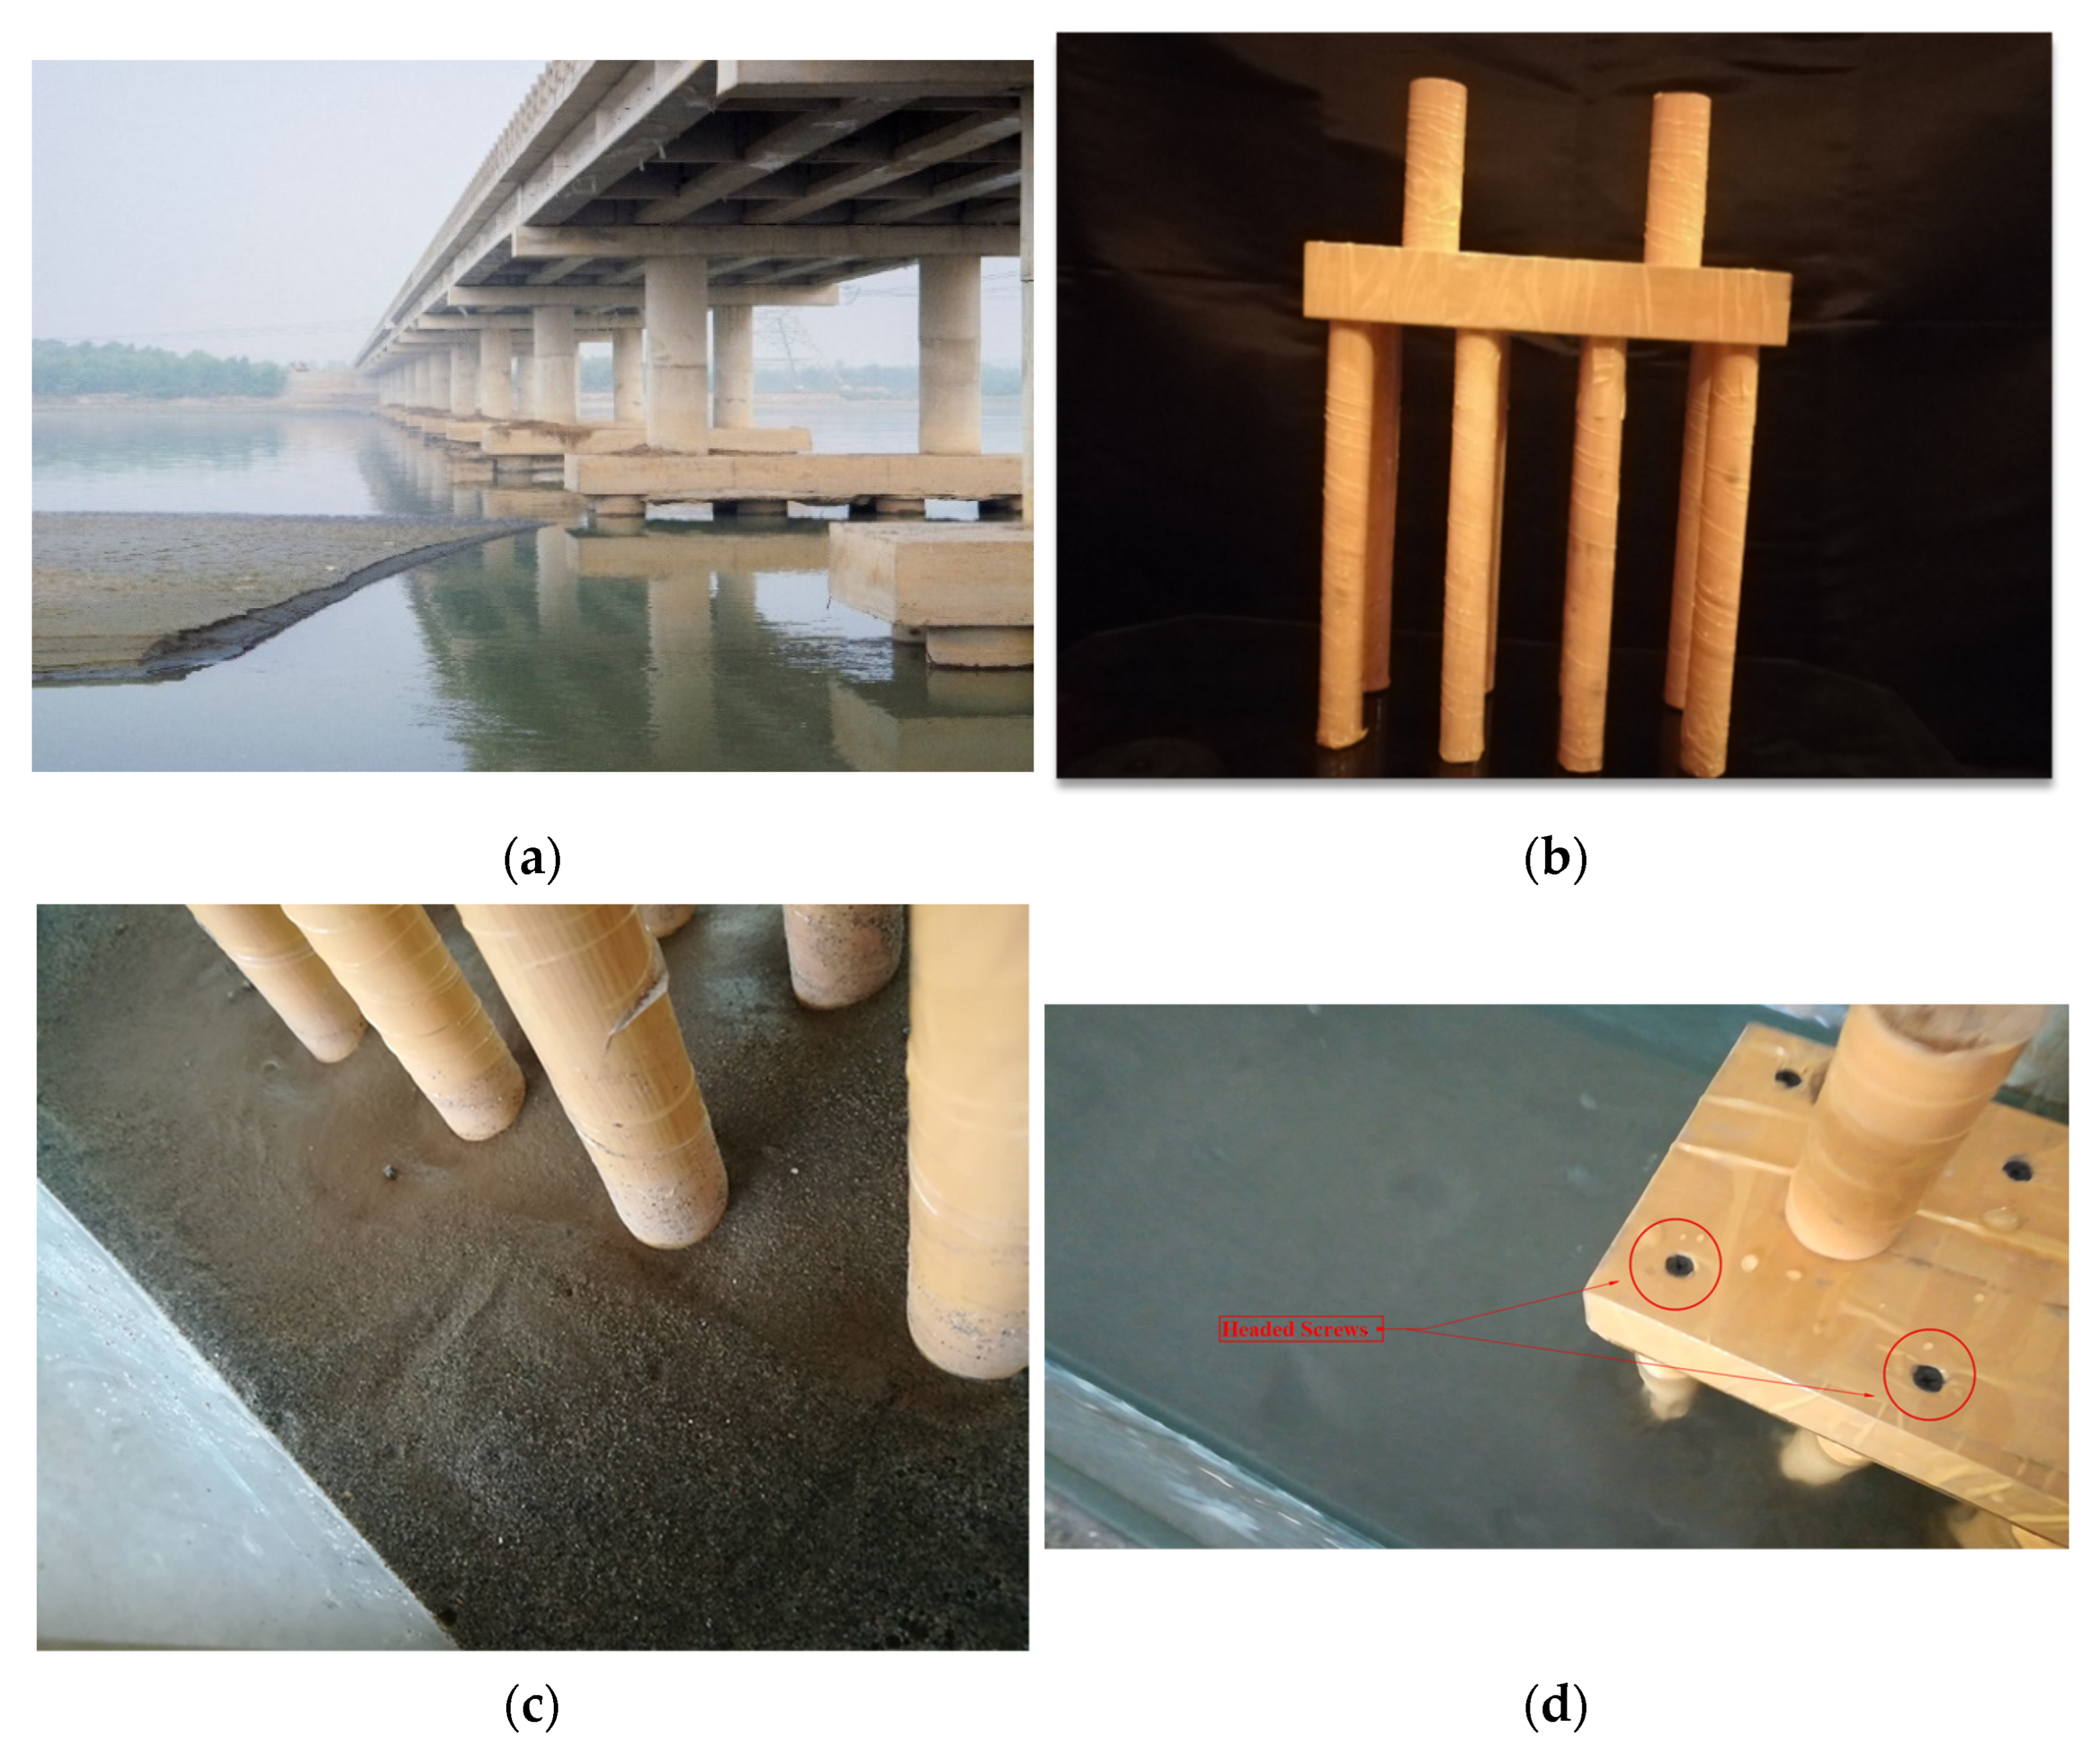
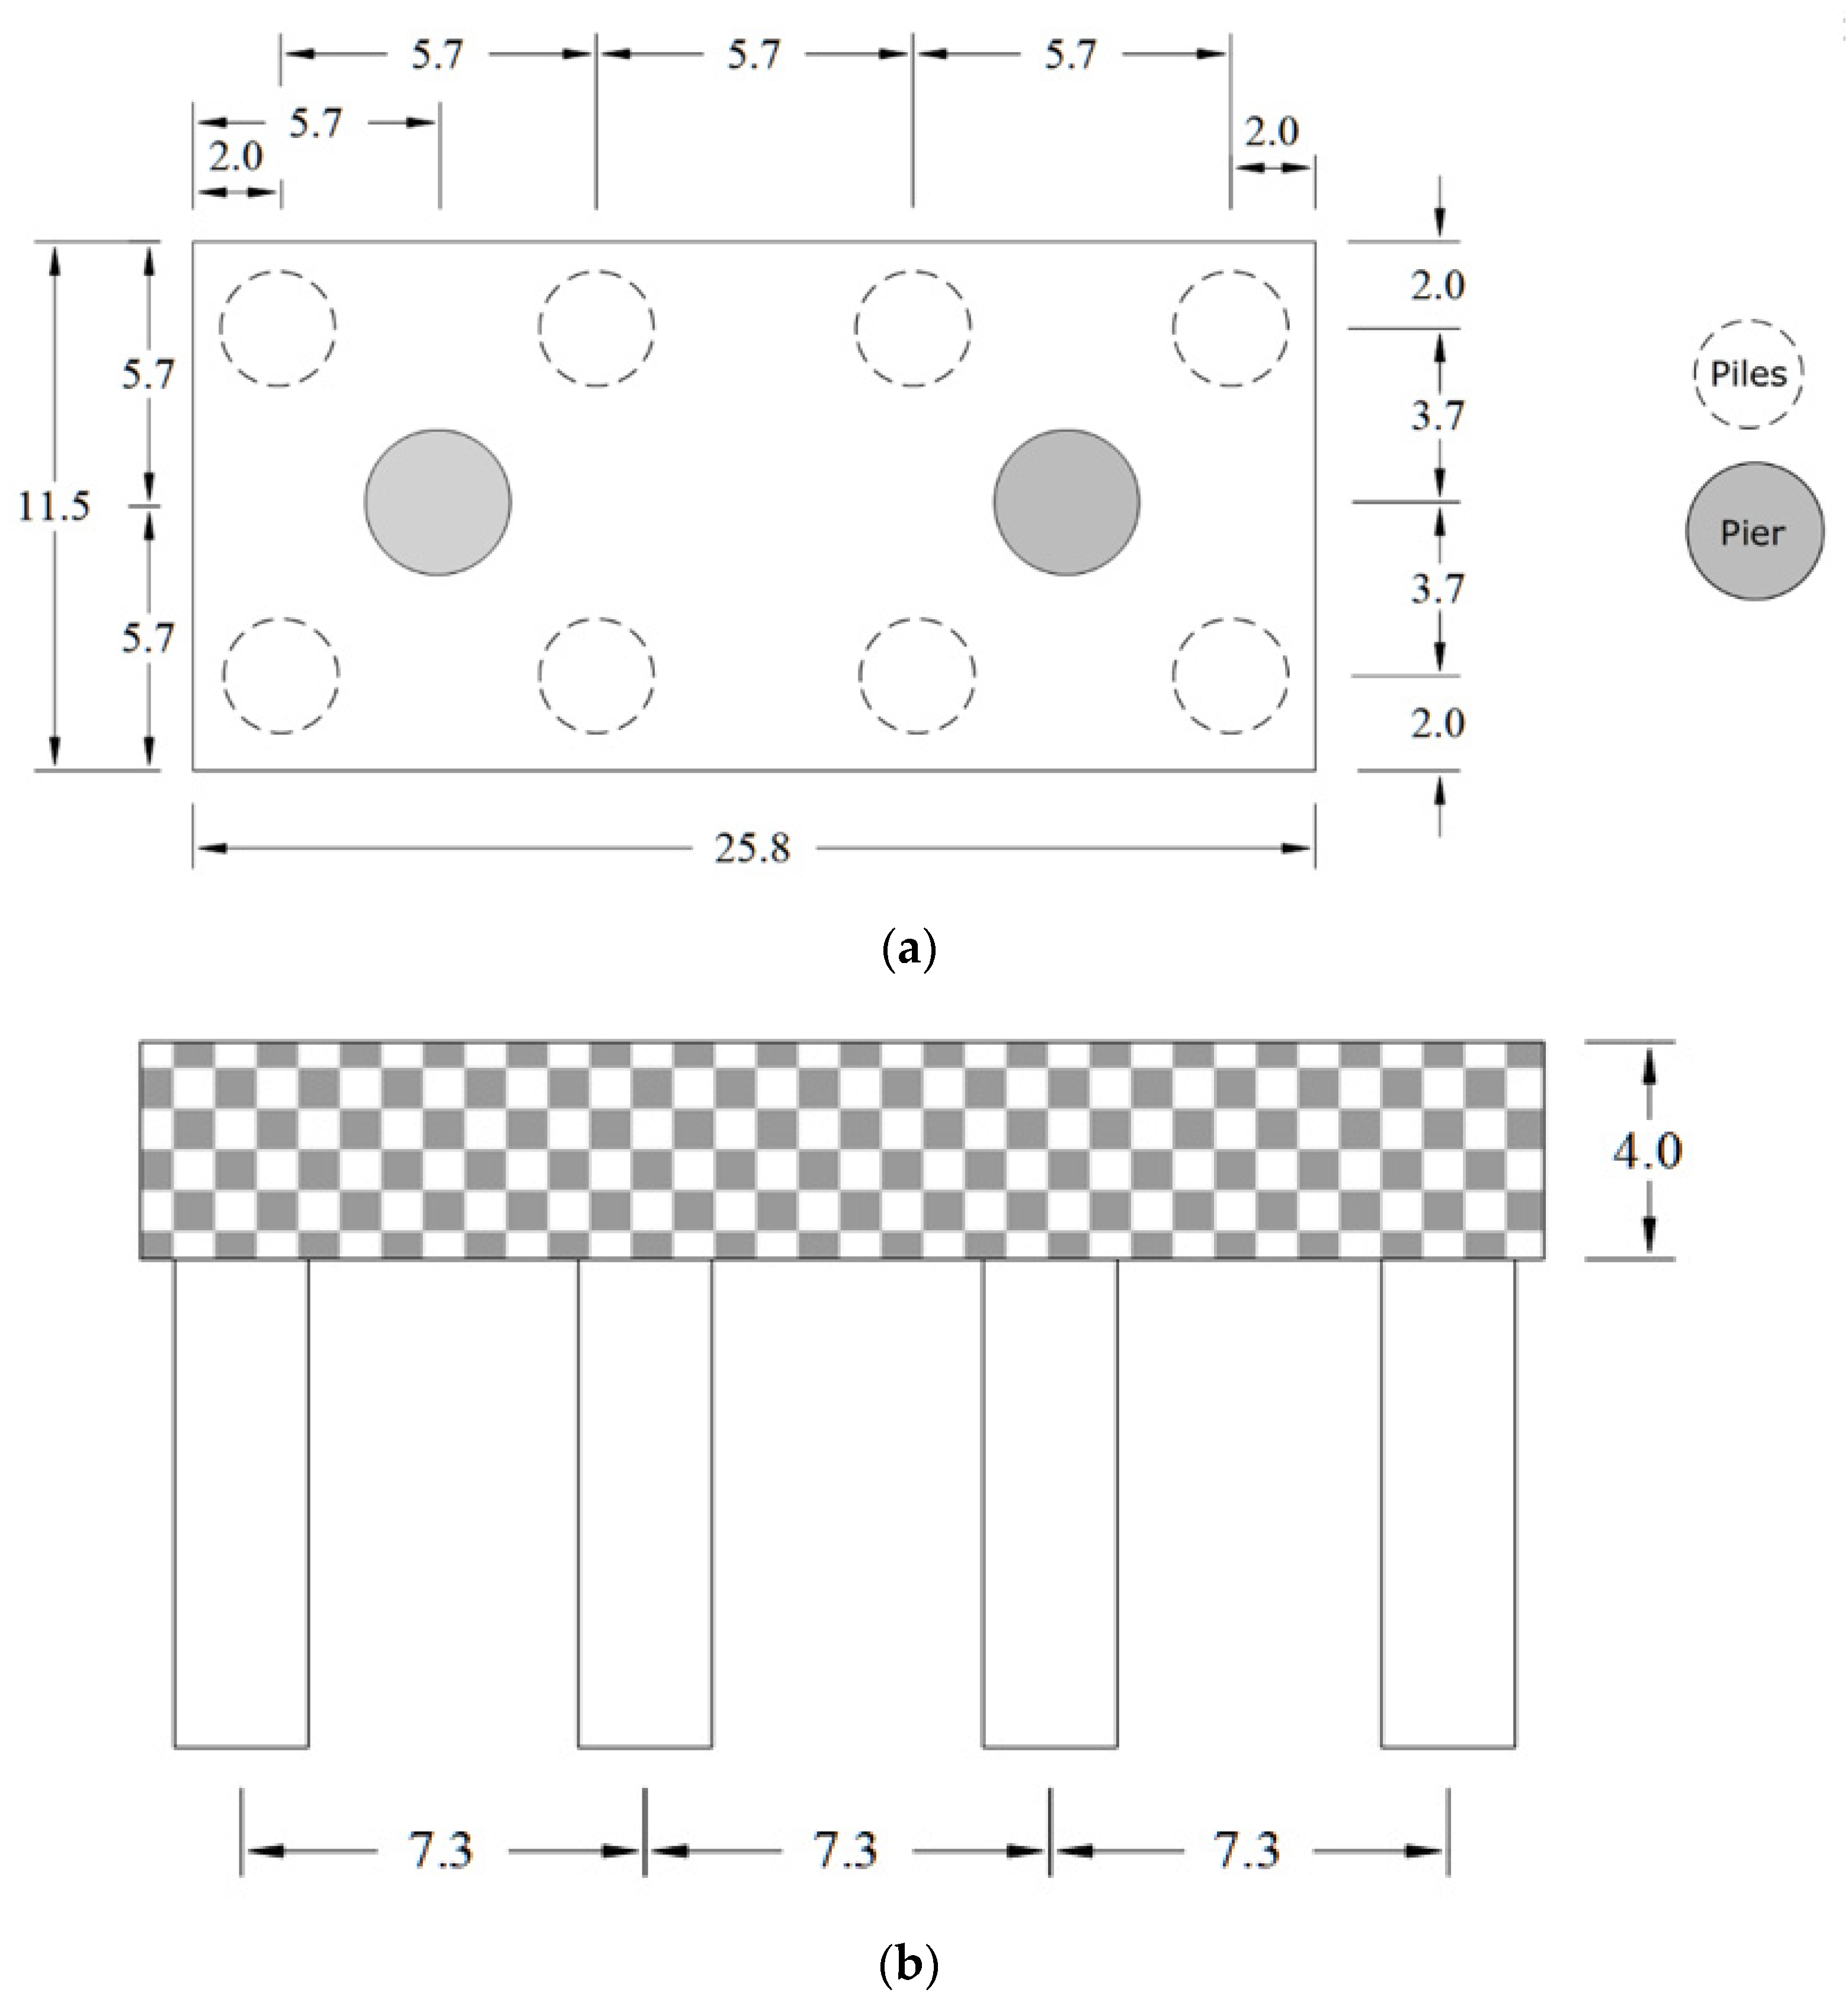
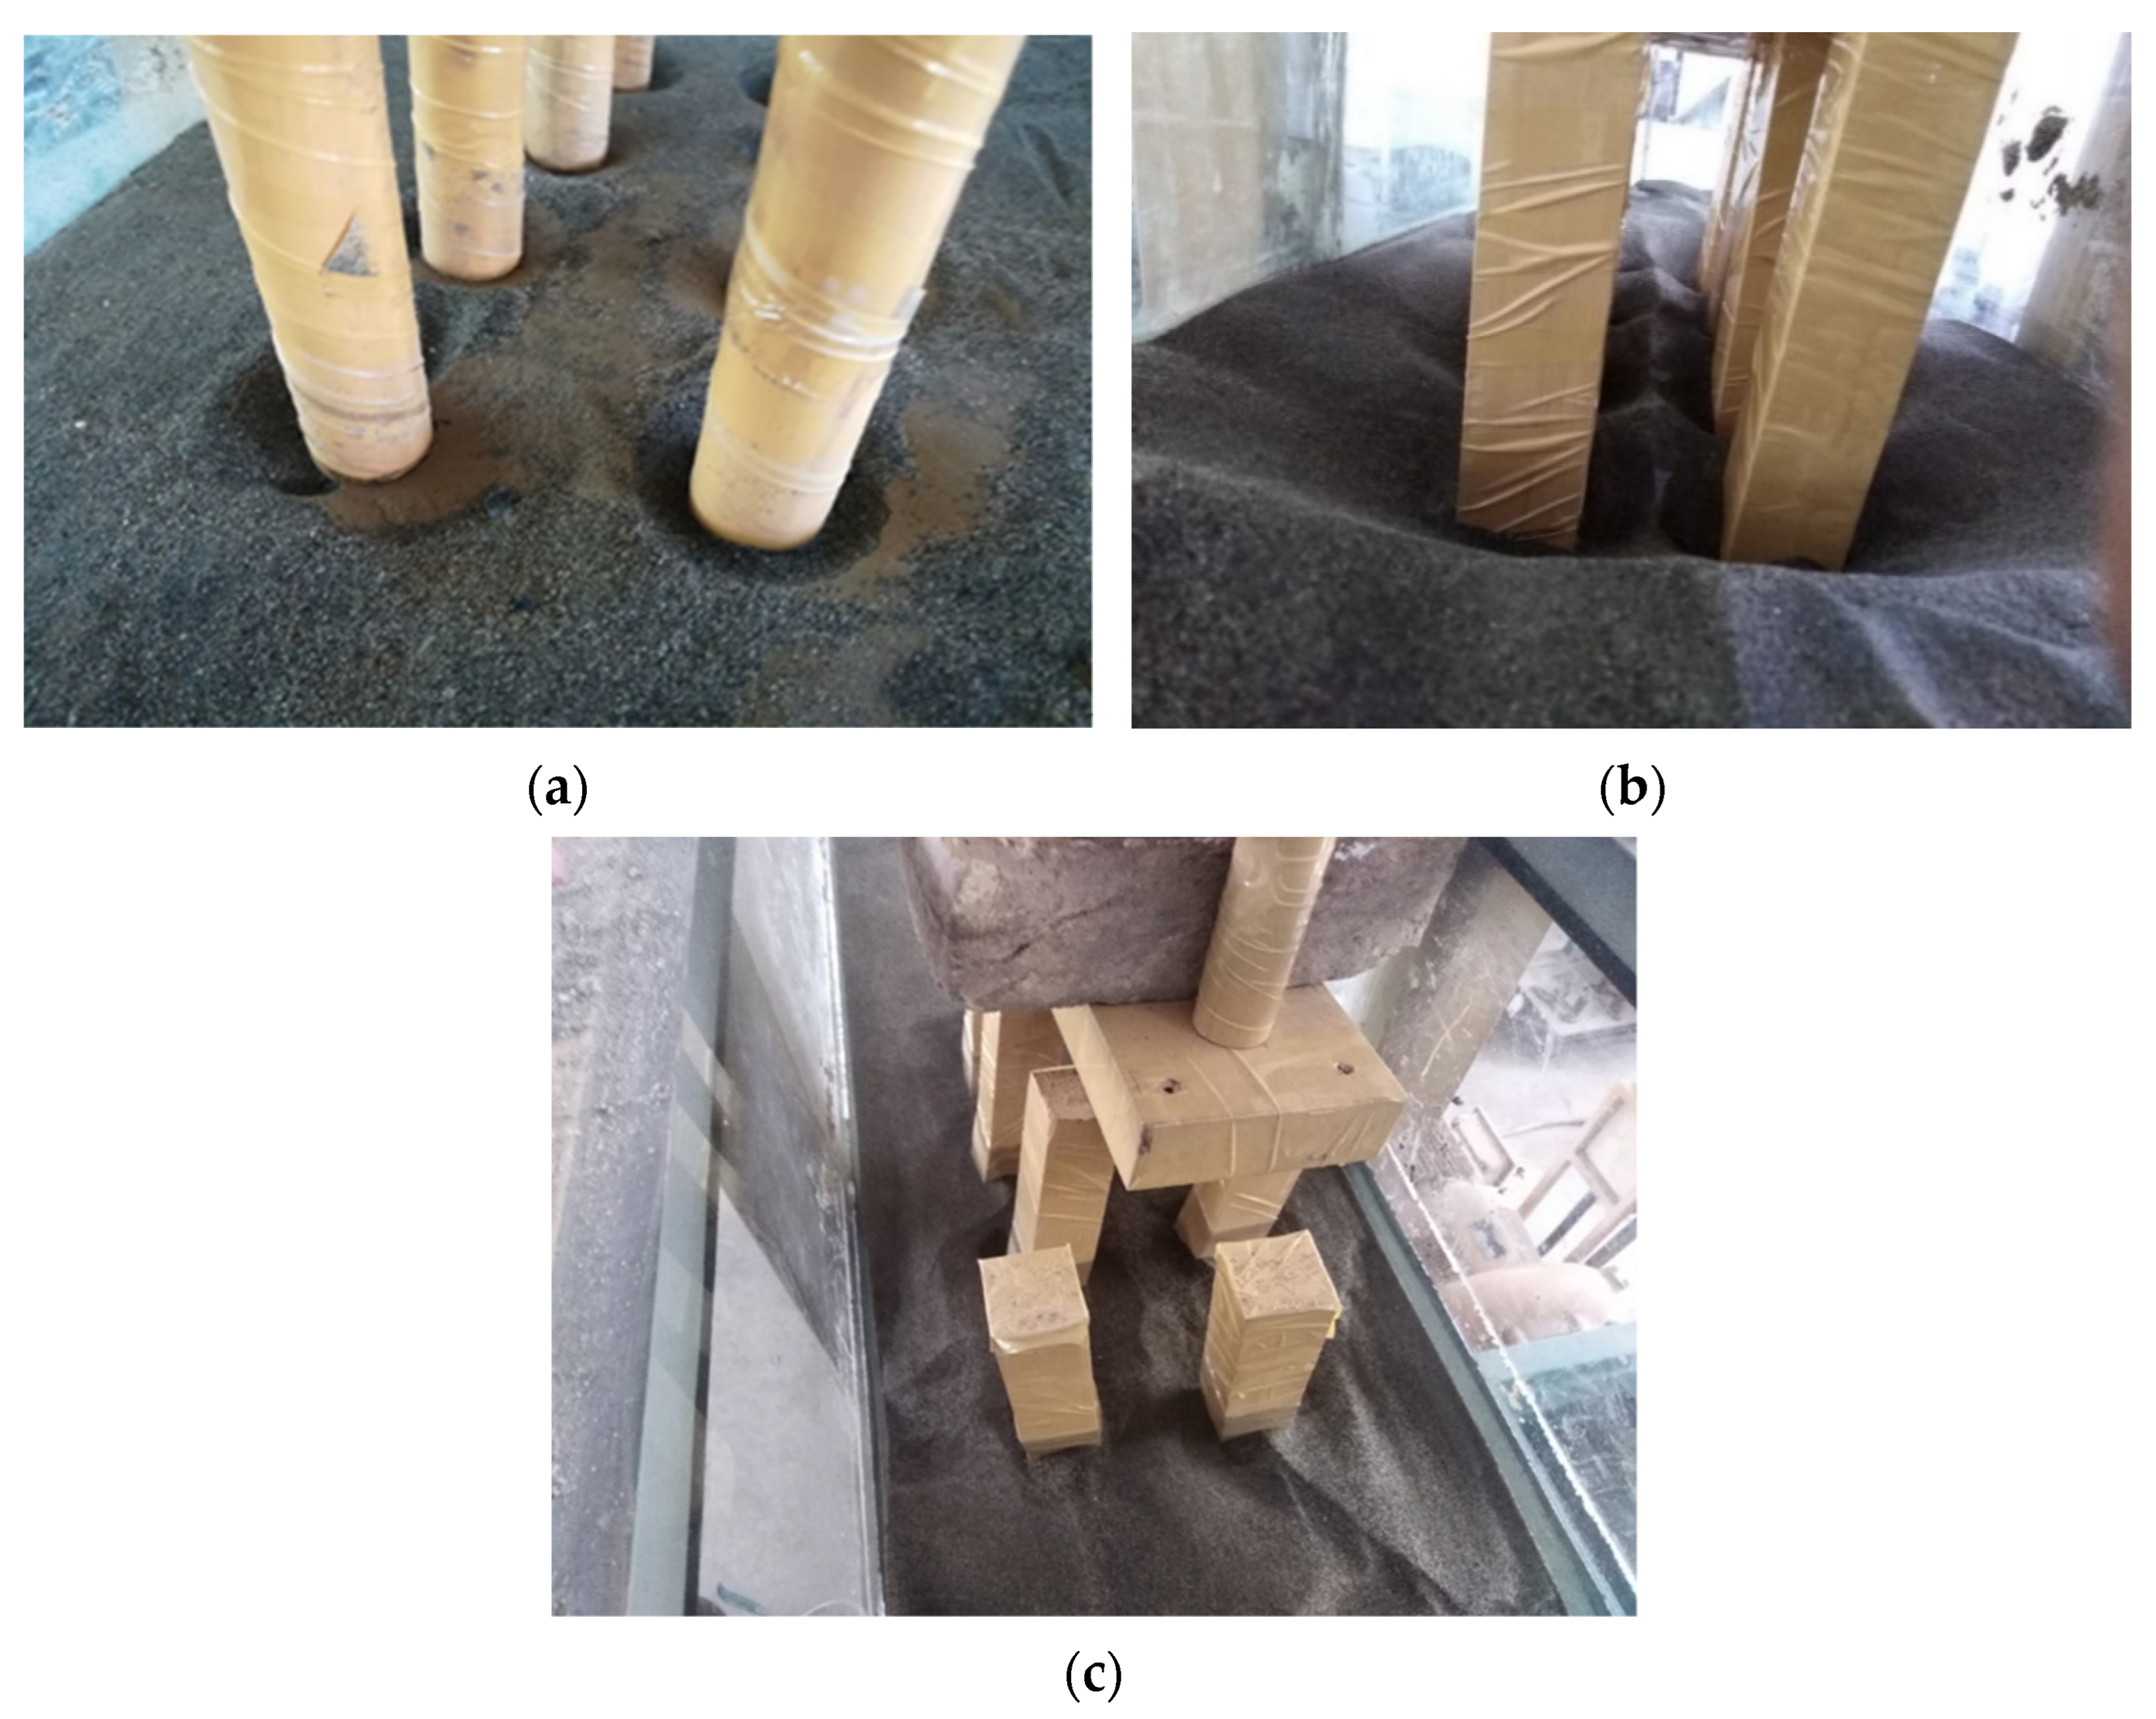
3.3. Bridge Pier Piles Models Selection
4. Results and Discussion
4.1. Scouring at Different Positions of Piles
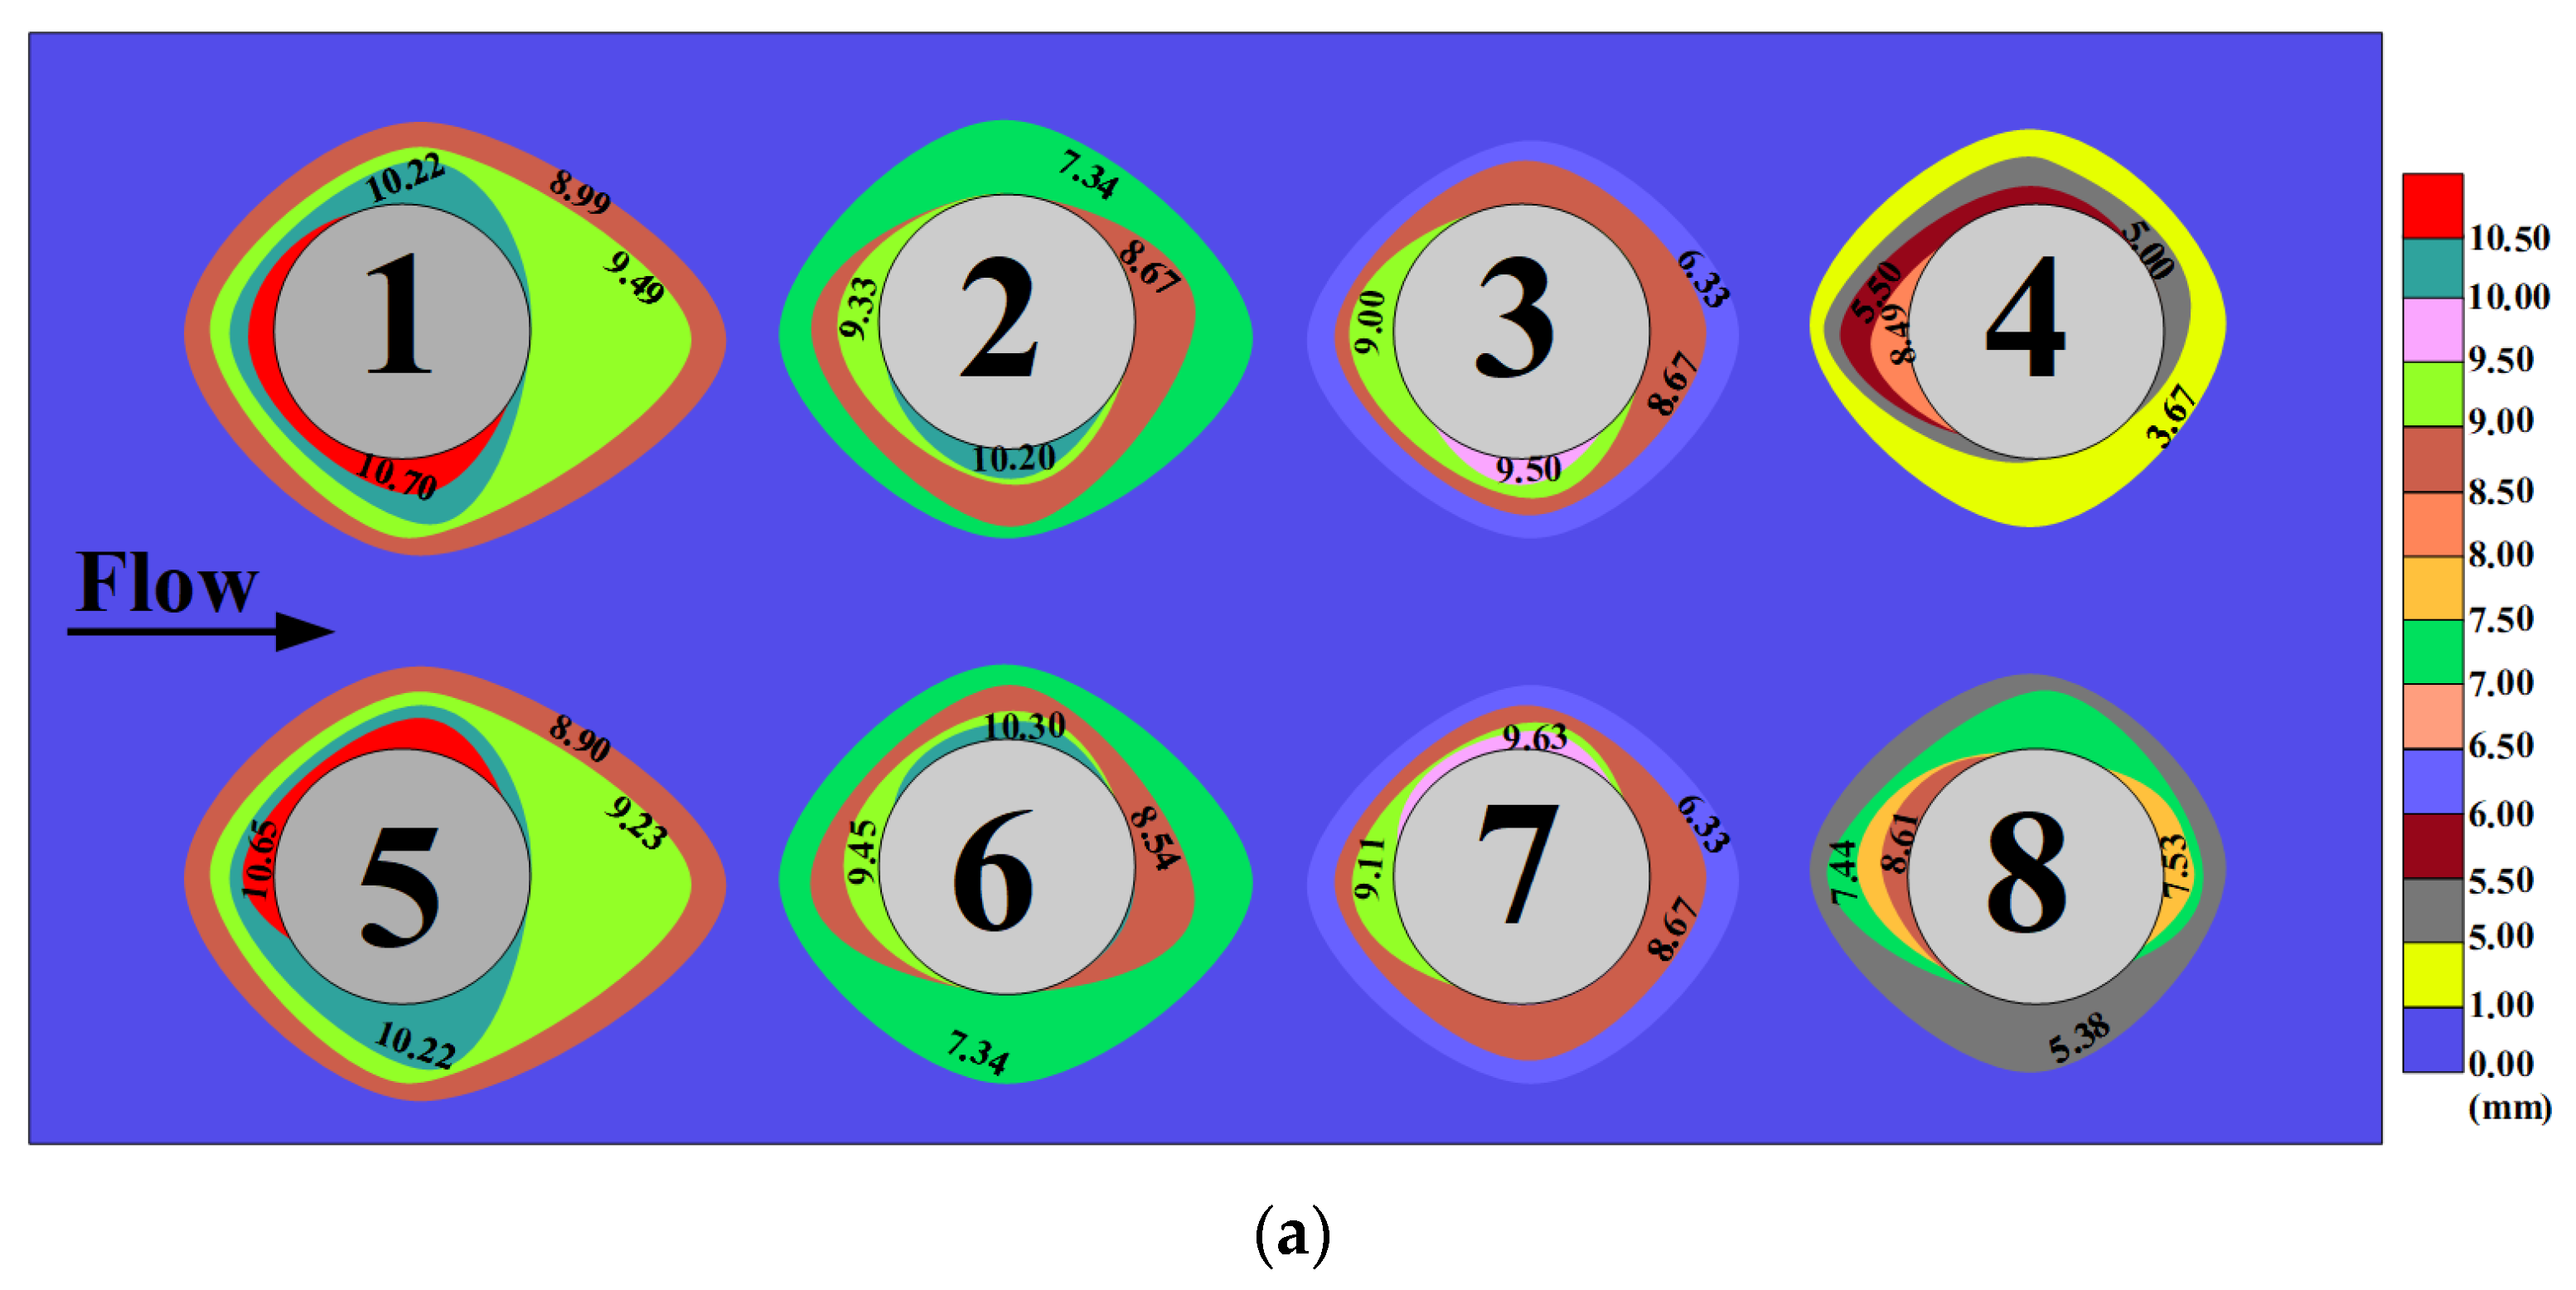
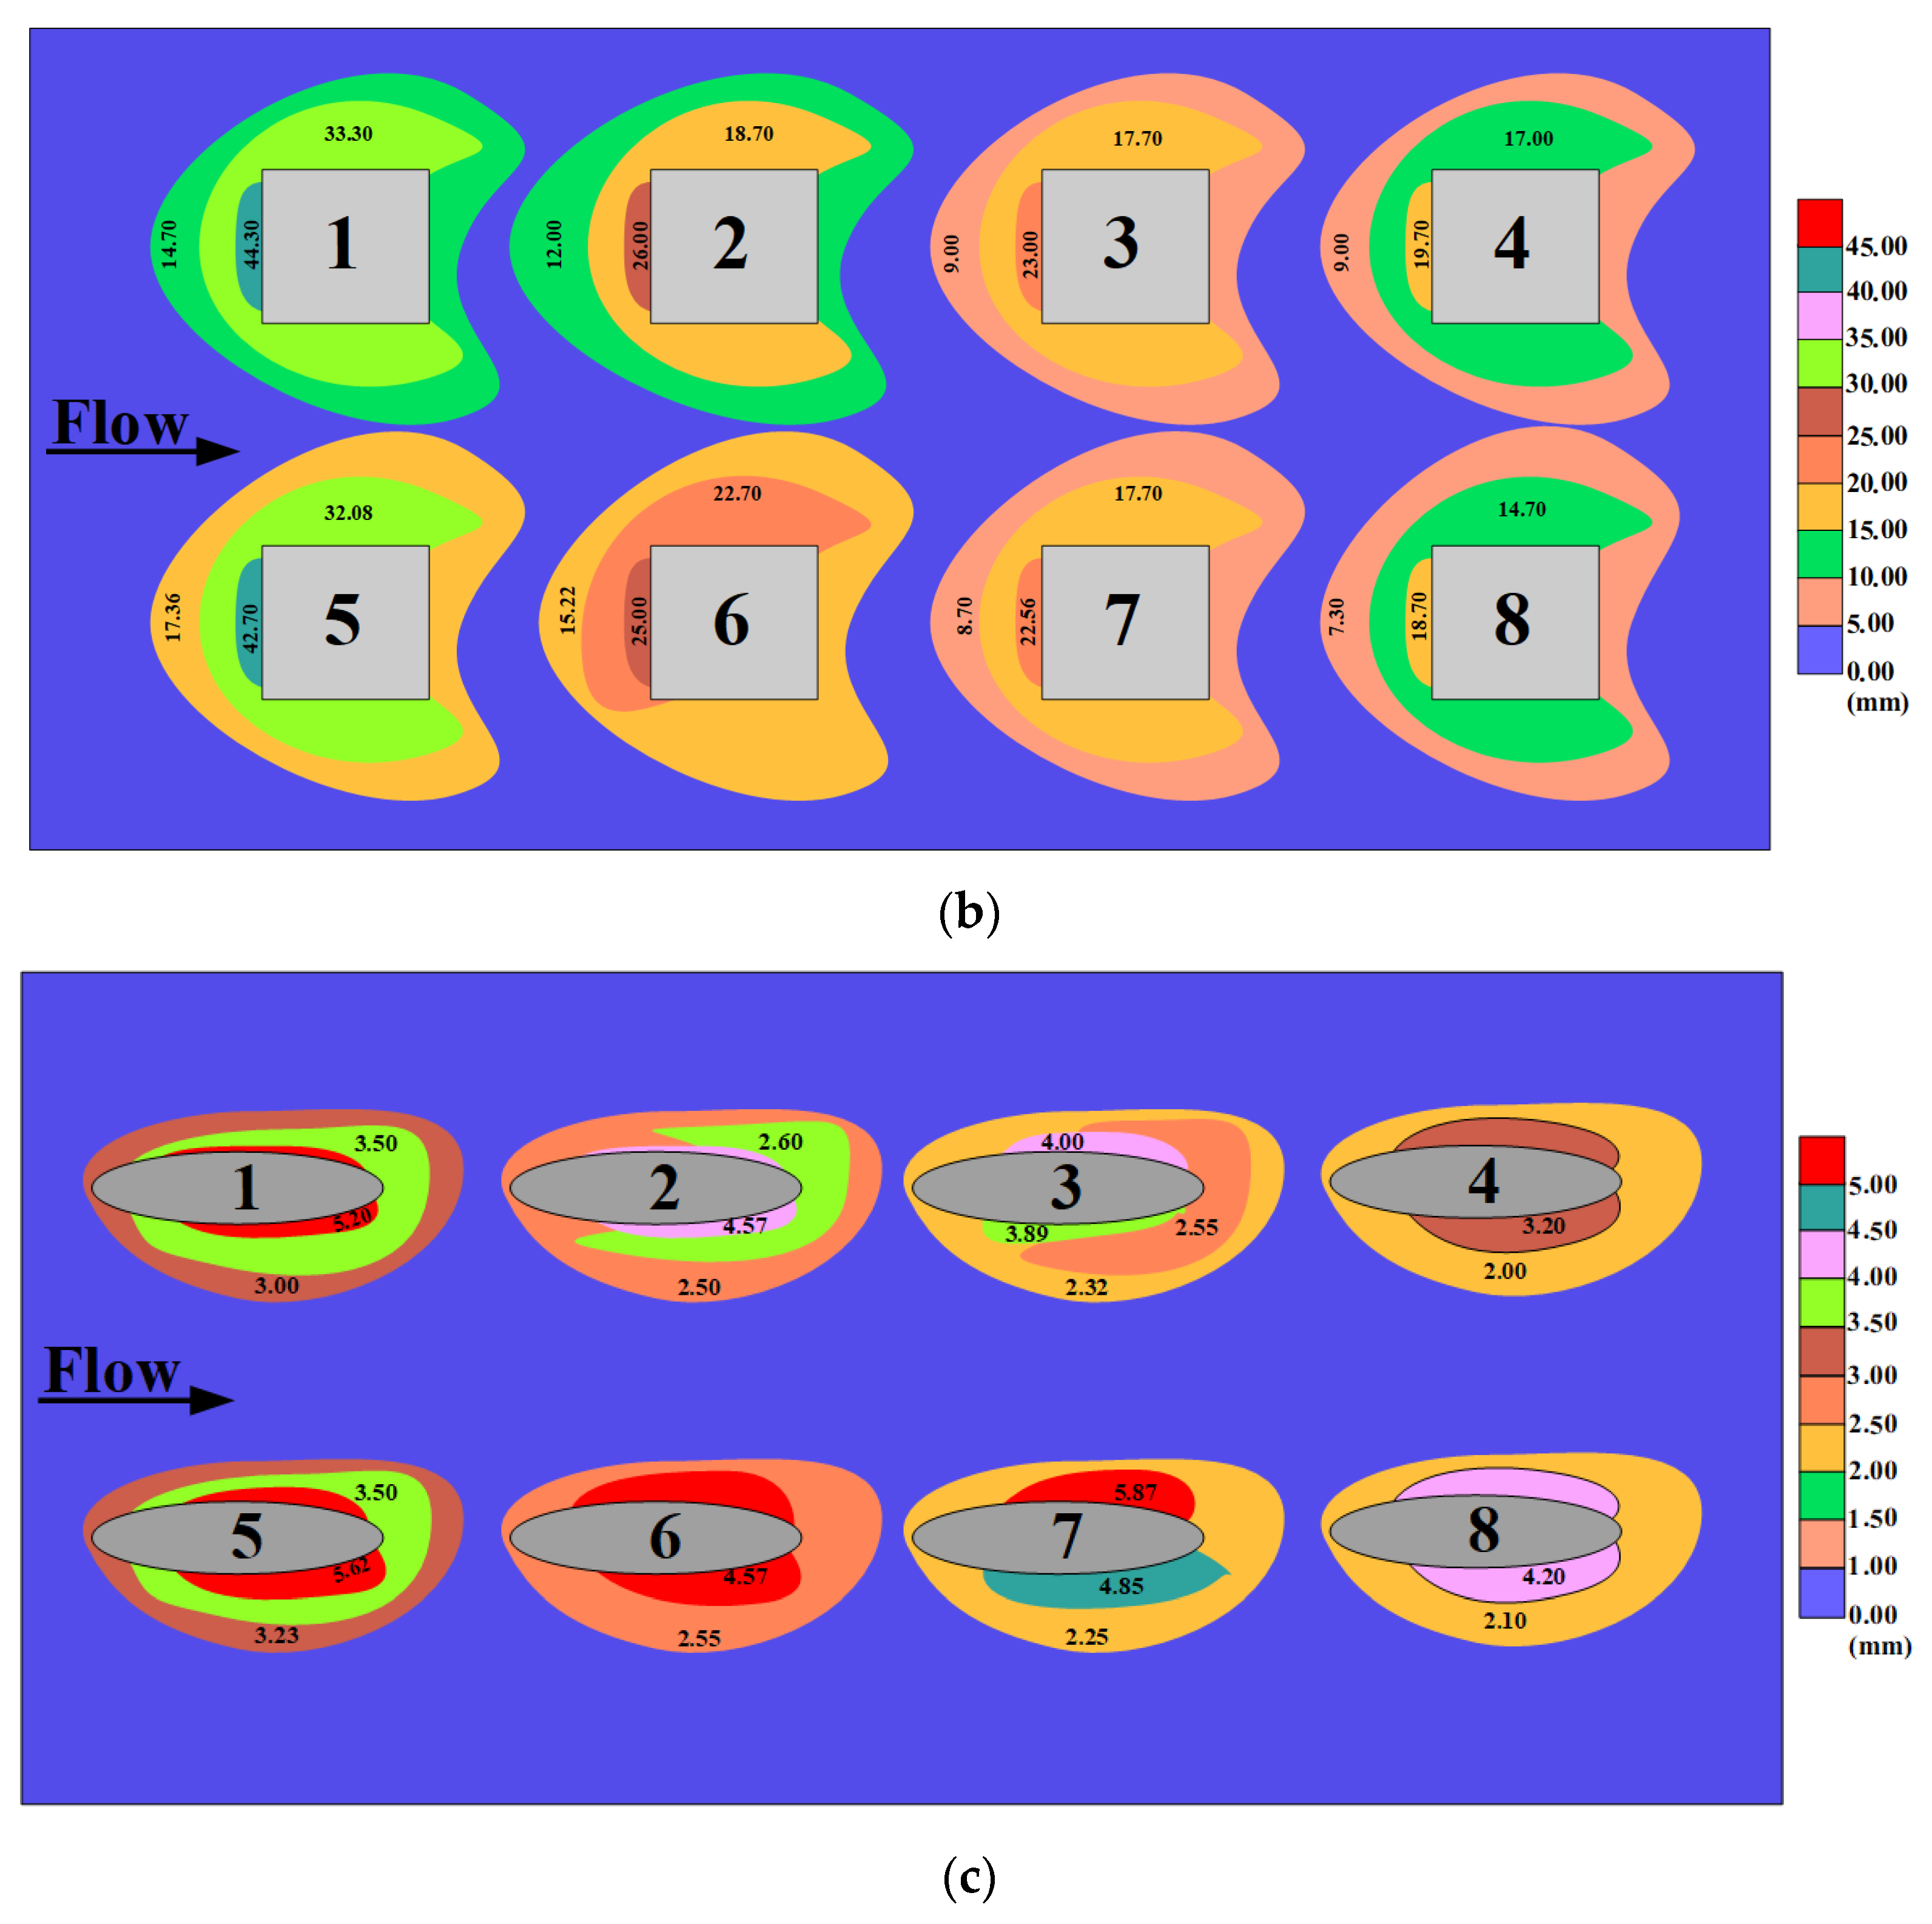
4.2. Scouring around Each Pile
4.3. Scour Prediction Equations
5. Conclusions
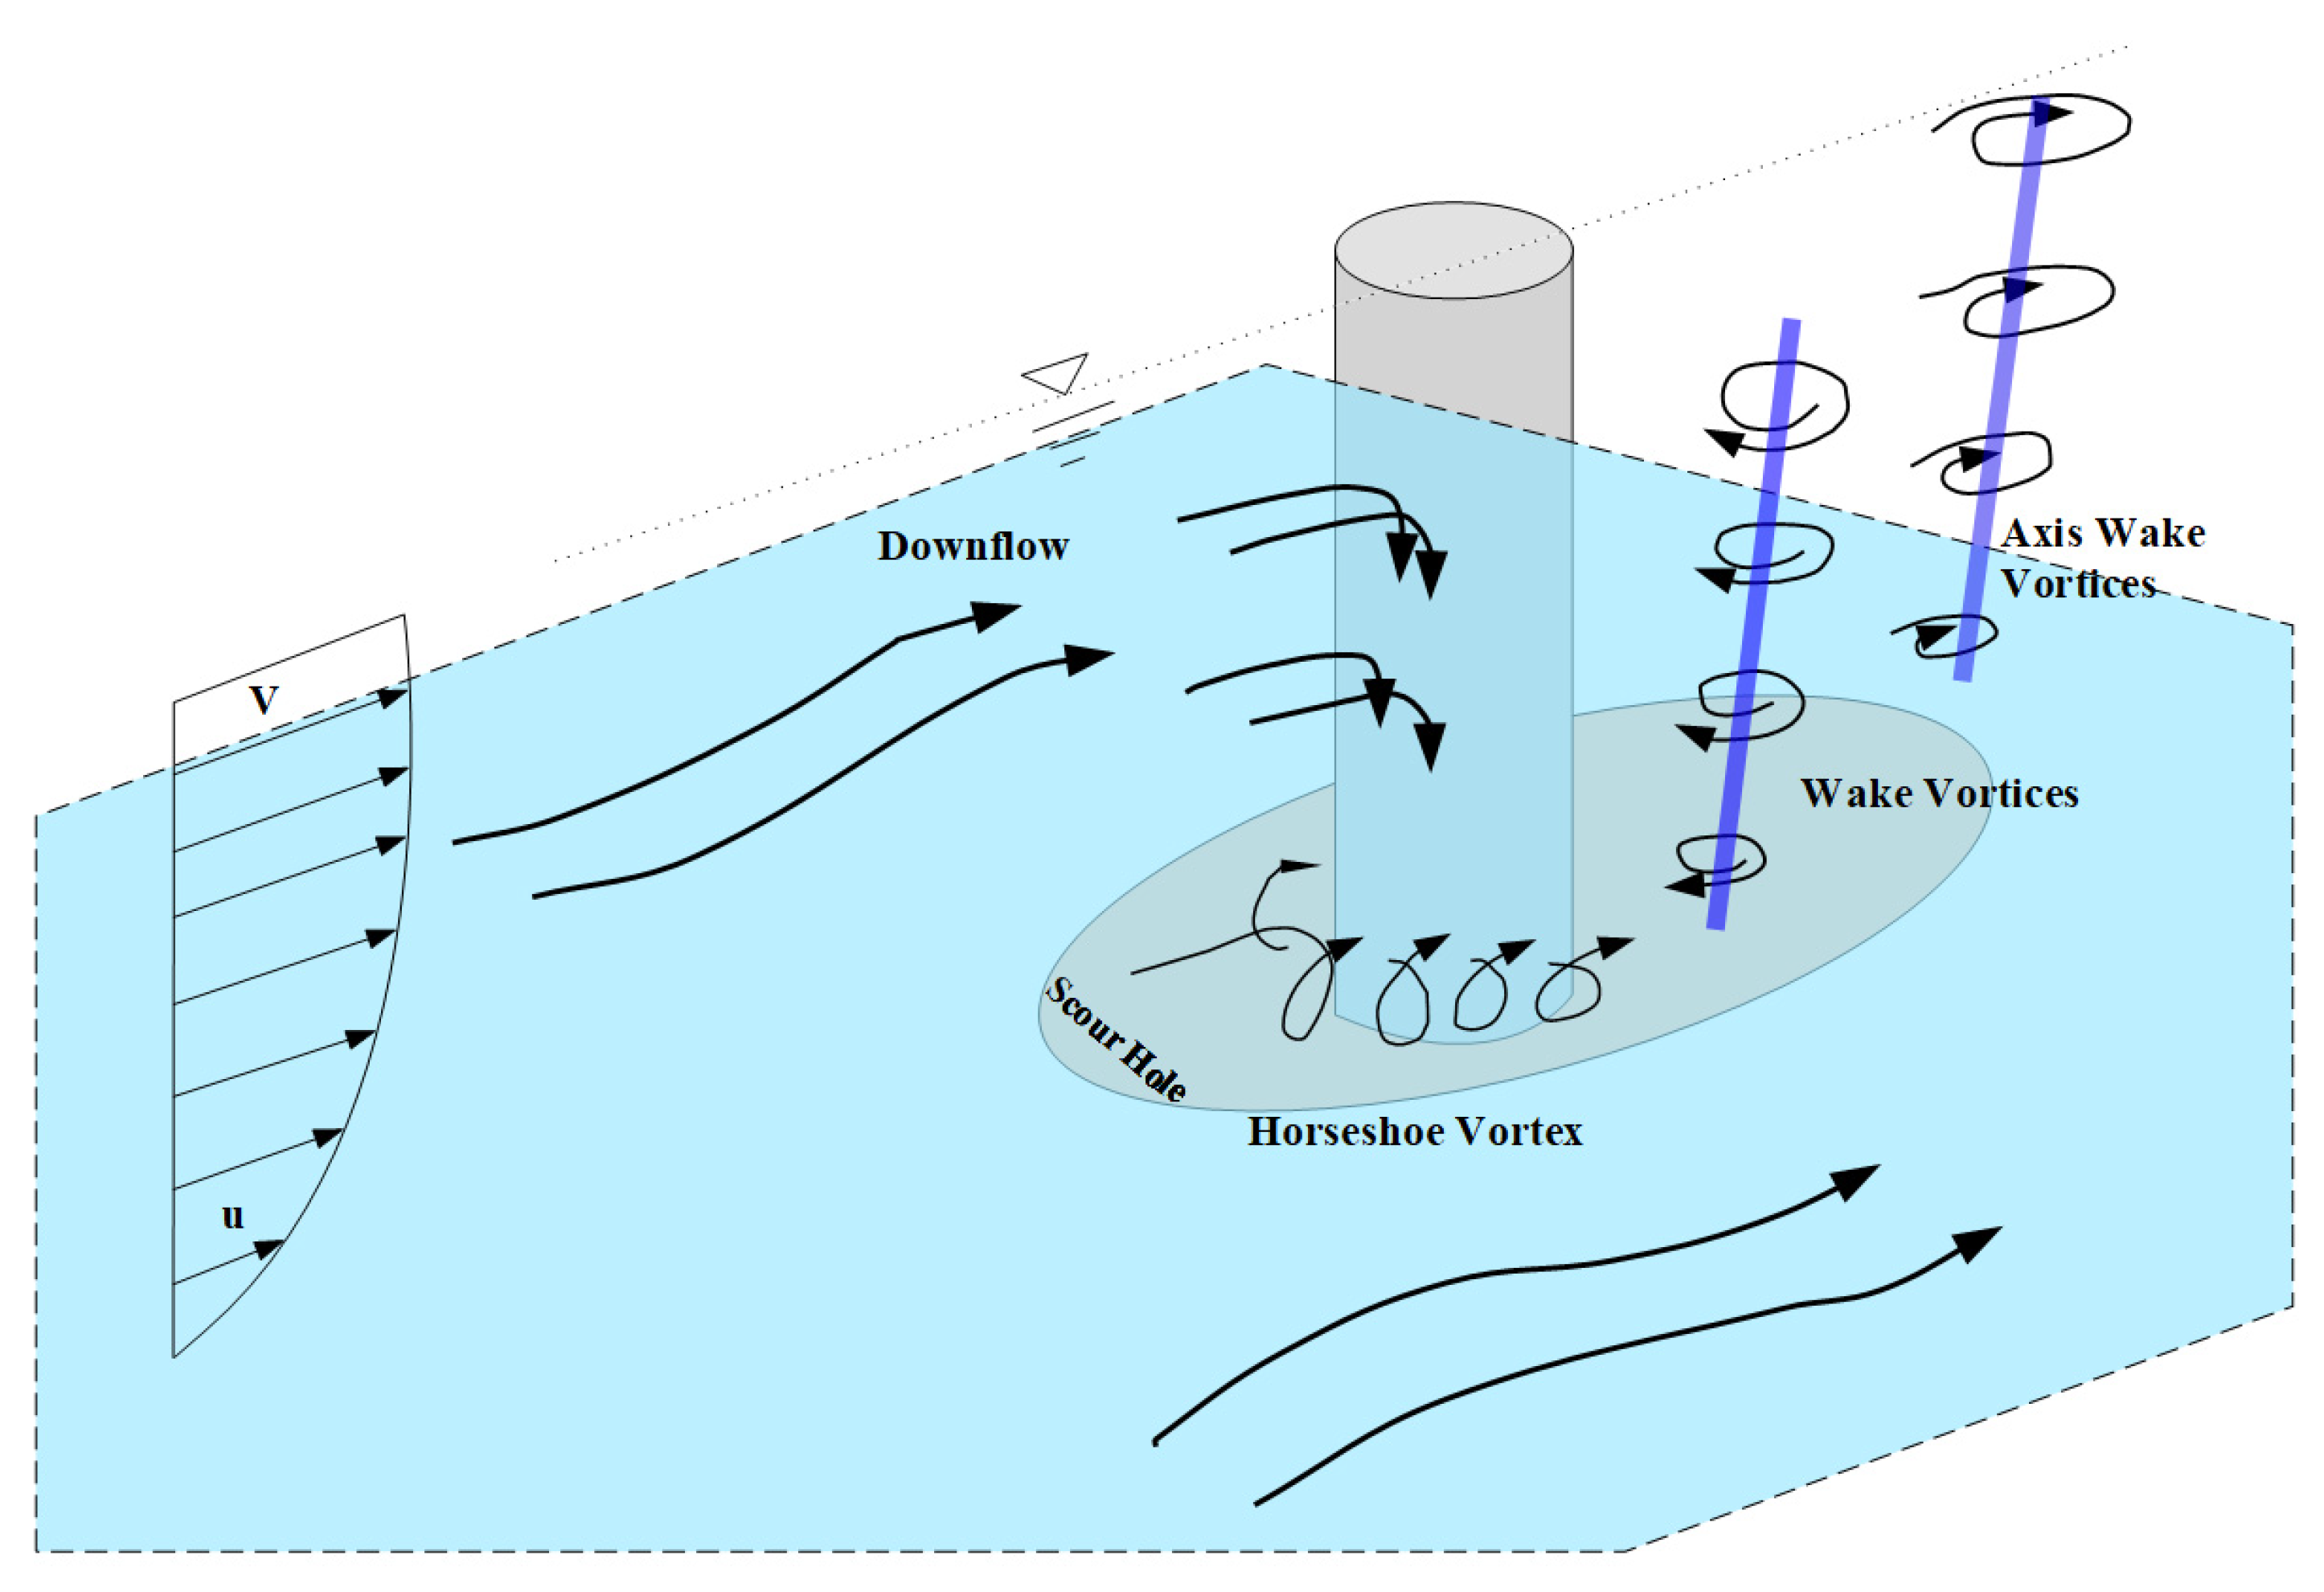
- The scour at a pile group is more extreme relative to that around a single pile, mainly due to the increase in the flow velocity of closely spaced piles resulting in a compressed horseshoe vortex.
- The very first pile at the upstream side of the pile group experiences the maximum scour. This is mainly due to the weakening of the downflow at the pile upstream and the weakening of the horseshoe vortex, which results in a reduced scour around rare piles.
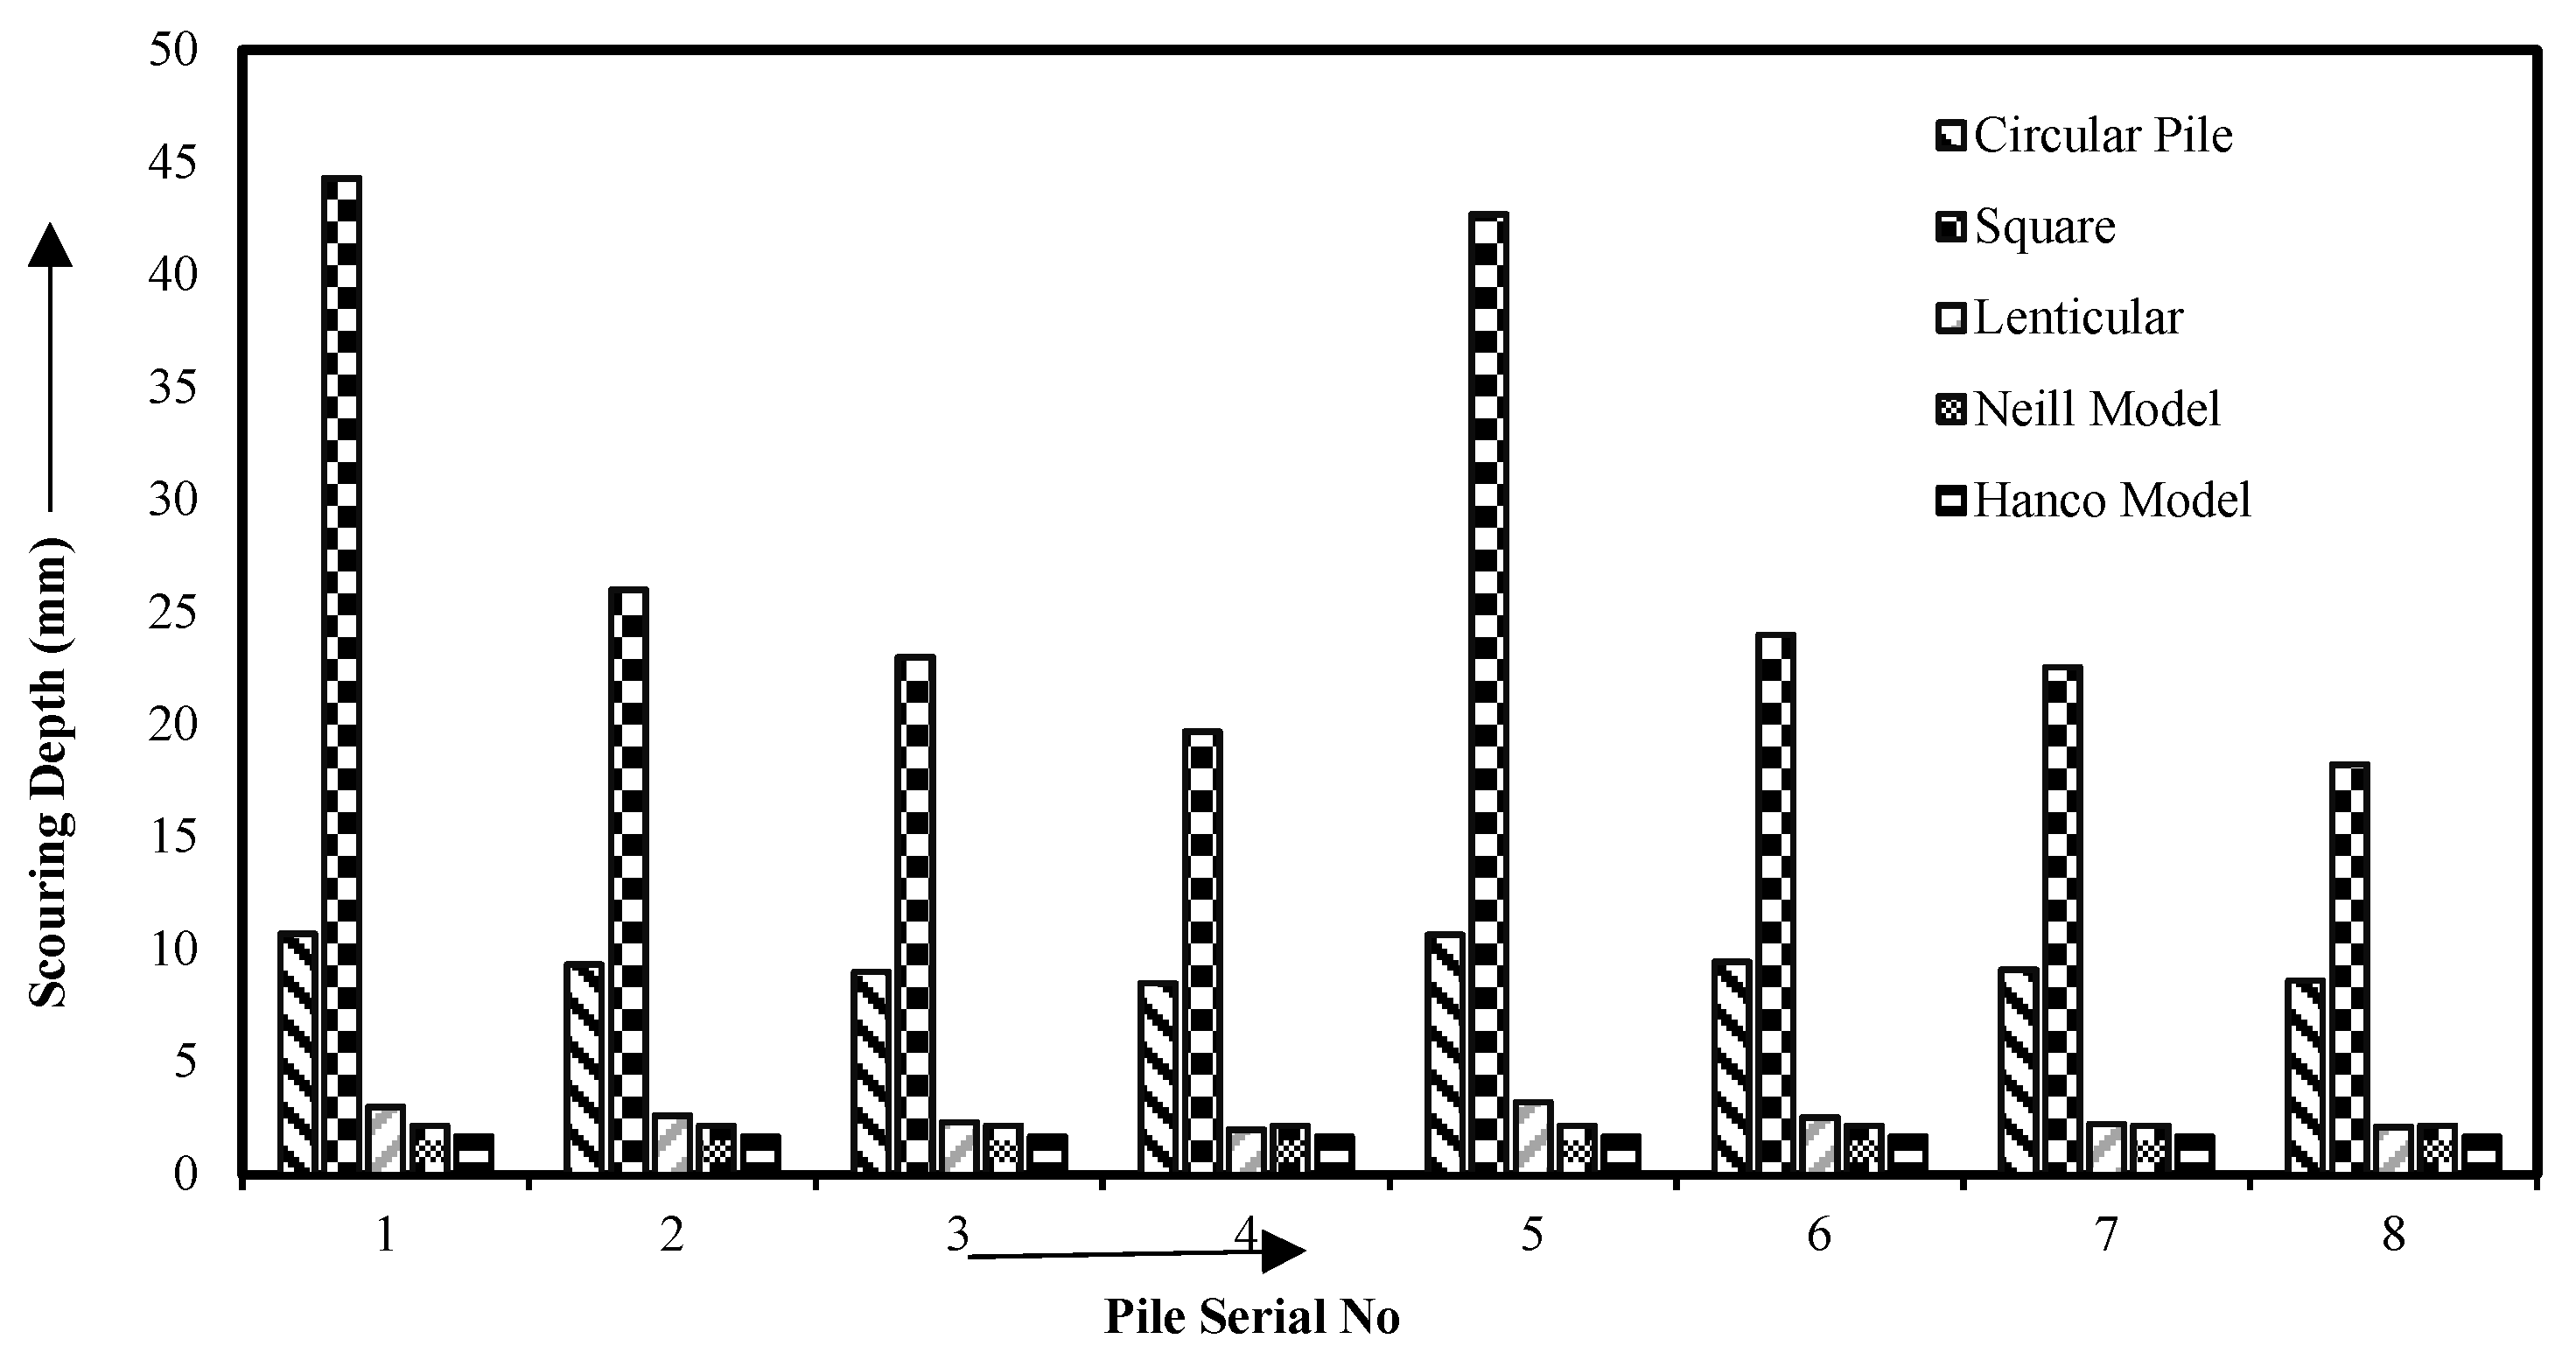
- The influence of geometry of piles has a particularly large effect on the scouring. The effect of scouring is more pronounced in the square piles, followed by the circular piles and minimal in the lenticular piles.
- The existing engineering practice of employing pier scour empirical models is not accurate enough in predicting the scour depth of piles. For example, the current study suggests that the popular Neill and Hanco models underestimate the scour depth by more than 50%.
- Given the inconsistencies between the pier scour predicting models and the experimental scour around the piles, new empirical models based only on piles scouring are needed. Furthermore, the preceding conclusions are valid for the pile groups that are aligned to the flow. For a skewed pile group, the variables influencing the local scour depth are different, thus requiring additional research.
Author Contributions
Funding
Institutional Review Board Statement
Informed Consent Statement
Data Availability Statement
Acknowledgments
Conflicts of Interest
Appendix A

| Pile No | Discharge (L s−1) | Pier Size (mm) | Flow Depth (mm) | Flow Velocity (mm s−1) | Sediment Size (d50) (mm) | Mean Scour Depth (mm) | ||
|---|---|---|---|---|---|---|---|---|
| Circular | Square | Lenticular | ||||||
| 1 | 4.25 | 25 | 65 | 222 | 0.41 | 10.70 | 44.30 | 3.00 |
| 2 | 4.25 | 25 | 65 | 222 | 0.41 | 9.33 | 26.00 | 2.62 |
| 3 | 4.25 | 25 | 65 | 222 | 0.41 | 9.00 | 23.00 | 2.32 |
| 4 | 4.25 | 25 | 65 | 222 | 0.41 | 8.50 | 19.70 | 2.00 |
| 5 | 4.25 | 25 | 65 | 222 | 0.41 | 10.65 | 42.70 | 3.23 |
| 6 | 4.25 | 25 | 65 | 222 | 0.41 | 9.45 | 24.00 | 2.55 |
| 7 | 4.25 | 25 | 65 | 222 | 0.41 | 9.11 | 22.56 | 2.25 |
| 8 | 4.25 | 25 | 65 | 222 | 0.41 | 8.61 | 18.23 | 2.12 |
| Pile No | Discharge (L s−1) | Pier Size (mm) | Flow Depth (mm) | Flow Velocity (mm s−1) | Sediment Size (d50) (mm) | Mean Scour Depth (mm) | ||
|---|---|---|---|---|---|---|---|---|
| Circular | Square | Lenticular | ||||||
| 1 | 4.25 | 25 | 65 | 222 | 0.41 | 10.22 | 33.30 | 5.23 |
| 2 | 4.25 | 25 | 65 | 222 | 0.41 | 7.34 | 18.70 | 4.67 |
| 3 | 4.25 | 25 | 65 | 222 | 0.41 | 6.35 | 17.70 | 4.00 |
| 4 | 4.25 | 25 | 65 | 222 | 0.41 | 5.39 | 14.70 | 3.46 |
| 5 | 4.25 | 25 | 65 | 222 | 0.41 | 11.00 | 34.00 | 7.00 |
| 6 | 4.25 | 25 | 65 | 222 | 0.41 | 10.30 | 22.70 | 6.37 |
| 7 | 4.25 | 25 | 65 | 222 | 0.41 | 9.63 | 19.30 | 5.89 |
| 8 | 4.25 | 25 | 65 | 222 | 0.41 | 7.44 | 18.06 | 4.09 |
| Pile No | Discharge (L s−1) | Pier Size (mm) | Flow Depth (mm) | Flow Velocity (mm/s) | Sediment Size (d50) (mm) | Mean Scour Depth (mm) | ||
|---|---|---|---|---|---|---|---|---|
| Circular | Square | Lenticular | ||||||
| 1 | 4.25 | 25 | 65 | 222 | 0.41 | 9.33 | 14.70 | 3.50 |
| 2 | 4.25 | 25 | 65 | 222 | 0.41 | 8.67 | 12.00 | 2.82 |
| 3 | 4.25 | 25 | 65 | 222 | 0.41 | 6.33 | 11.00 | 2.55 |
| 4 | 4.25 | 25 | 65 | 222 | 0.41 | 4.67 | 9.00 | 2.00 |
| 5 | 4.25 | 25 | 65 | 222 | 0.41 | 9.23 | 17.36 | 3.45 |
| 6 | 4.25 | 25 | 65 | 222 | 0.41 | 8.54 | 15.22 | 2.75 |
| 7 | 4.25 | 25 | 65 | 222 | 0.41 | 8.13 | 8.70 | 2.47 |
| 8 | 4.25 | 25 | 65 | 222 | 0.41 | 7.53 | 7.30 | 2.10 |
| Pile No | Discharge (L s−1) | Pier Size (mm) | Flow Depth (mm) | Flow Velocity (mm/s) | Sediment Size (d50) (mm) | Mean Scour Depth (mm) | ||
|---|---|---|---|---|---|---|---|---|
| Circular | Square | Lenticular | ||||||
| 1 | 4.25 | 25 | 65 | 222 | 0.41 | 11.05 | 33.78 | 5.20 |
| 2 | 4.25 | 25 | 65 | 222 | 0.41 | 10.20 | 20.70 | 4.57 |
| 3 | 4.25 | 25 | 65 | 222 | 0.41 | 9.50 | 18.30 | 3.89 |
| 4 | 4.25 | 25 | 65 | 222 | 0.41 | 7.22 | 17.06 | 3.20 |
| 5 | 4.25 | 25 | 65 | 222 | 0.41 | 10.2 | 32.8 | 5.68 |
| 6 | 4.25 | 25 | 65 | 222 | 0.41 | 7.33 | 18.7 | 5.12 |
| 7 | 4.25 | 25 | 65 | 222 | 0.41 | 6.33 | 17.7 | 4.85 |
| 8 | 4.25 | 25 | 65 | 222 | 0.41 | 5.38 | 14.7 | 4.20 |
Appendix B
| Authors | Empirical Formulas |
|---|---|
| Laursen & Toch (1956) | |
| Chitale (1962) | |
| Breusers (1965) | |
| Blench (1969) | |
| Shen et al. (1969) | |
| Hancu (1971) | |
| Coleman (1971) | |
| Breusers et al. (1977) | from Neill’s formulation (1973) |
| Jain & Fisher (1979) | from Neill’s formulation (1973) |
| Jain (1981) | from Neill’s formulation (1973) |
| Froelich (1988) | |
| Froelich Design | |
| Kothyari, Garde & Ranga (1992) | |
| Mississippi (Wilson 1995) | |
| Simplified Chinese Gao et al. (1993) | |
| Melville & Sutherland (1988) | |
| Melville (1997) | for a bridge pier |
| Melville & Coleman (2000) | total time to reach equilibrium profile |
| Melville & Kandasamy (1998) | |
| Sheppard & Miller (2006) | from Neill’s formulation (1973) |
| Sheppard et. al., (2014) | for cylindrical piers for rectangular piers |
| FDOT (Arneson et. al., 2012) | |
| HEC-18 or CSU equations | for clear-water scouring |
| Richardson et al. (1993) | |
| Richardson & Davis (1995) | Dimensionless excess velocity intensity |
| Mueller (1996) | |
| Critical velocity (Neill 1973) | using Shields parameter |
| Mueller & Wagner (2005) | |
| Molinas (2004) | |
| Molinas (2004) | |
| Ali & Karim (2002) | |
| Guo (2012) | Densiometric particle Froude number |
| Neill (1973) |
Appendix C. Discussion: Scour around Bridge Piles

References
- Johnson, P.A.; Dock, D.A. Probabilistic Bridge Scour Estimates. J. Hydraul. Eng. 1998, 124, 750–754. [Google Scholar] [CrossRef]
- Bridge Inspection and Maintenance Manual. Transit New Zealand. 2001; pp. 1–162. Available online: https://www.nzta.govt.nz/assets/resources/bridge-inspection-maintenance-manual/docs/title-pages-and-contents.pdf (accessed on 2 April 2022).
- Melville, B.W.; Coleman, S.E. Bridge Scour; Water Resources Publications: Littleton, CO, USA, 1973. [Google Scholar]
- Hjorth, P. Studies on the Nature of Local Scour; Lund Publications: Lund, Sweden, 1975. [Google Scholar]
- Melville, B.W. Local Scour at Bridge Sites. Ph.D. Thesis, University of Auckland, School of Engineering, Auckland, New Zealand, 1975. [Google Scholar]
- Dargahi, B. Controlling Mechanism of Local Scouring. J. Hydraul. Eng. 1992, 118, 504–505. [Google Scholar] [CrossRef]
- Hannah, C.R. Scour at Pile Groups. Ph.D. Thesis, University of Canterbury, Department of Civil Engineering, Christchurch, New Zealand, 1978. [Google Scholar]
- Beheshti, A.; Ataei-Ashtiani, B. Scour in the Clear Water around the Pile Groups. In Proceedings of the First National Congress of Civil Engineering, Tehran, Iran, 29 May 2004. [Google Scholar]
- Ataie-Ashtiani, B.; Beheshti, A.A. Experimental Investigation of Clear-Water Local Scour at Pile Groups. J. Hydraul. Eng. 2006, 132, 1100–1104. [Google Scholar] [CrossRef] [Green Version]
- Beg, M. Characteristics of Developing Scour Holes around Two Piers Placed in Transverse Arrangement. In Proceedings of the International Conference on Scour and Erosion (ICSE-5), San Francisco, CA, USA, 7–10 November 2010; pp. 76–85. [Google Scholar] [CrossRef]
- Movahedi, N.; Dehghani, A.; Arabi, M.; Zahiri, A. The Pile Spacing Effect Distance between the Pile Groups on the Time Development of Scour in Pile Groups Perpendicular to the Flow Direction. In Proceedings of the 11th Conference of Hydraulic, Urmia, Iran, 6 November 2012. [Google Scholar]
- Sanei, M.; Mohammadnezhad, A.A. Evaluation the Effect of the Diameter of the Cylindrical Pile on the Amount of Scour. Q. Build. Enhanc. Rehabil. Ind. 2010. [Google Scholar]
- Amini, A.; Melville, B.W.; Ali, T.M.; Ghazali, A.H. Clear-Water Local Scour around Pile Groups in Shallow-Water Flow. J. Hydraul. Eng. 2012, 138, 177–185. [Google Scholar] [CrossRef]
- Gaudio, R.; Tafarojnoruz, A.; Calomino, F. Combined Flow-Altering Countermeasures against Bridge Pier Scour. J. Hydraul. Res. 2012, 50, 35–43. [Google Scholar] [CrossRef]
- Tafarojnoruz, A.; Gaudio, R.; Calomino, F. Bridge Pier Scour Mitigation under Steady and Unsteady Flow Conditions. Acta Geophys. 2012, 60, 1076–1097. [Google Scholar] [CrossRef]
- Amini, A.; Melville, B.W.; Ali, T.M. Local Scour at Piled Bridge Piers Including an Examination of the Superposition Method. Can. J. Civ. Eng. 2014, 41, 461–471. [Google Scholar] [CrossRef]
- Amini, A.; Mohammad, T.A. Local Scour Prediction around Piers with Complex Geometry. Mar. Georesources Geotechnol. 2017, 35, 857–864. [Google Scholar] [CrossRef]
- Diab, R.; Link, O.; Zanke, U. Geometry of Developing and Equilibrium Scour Holes at Bridge Piers in Gravel. Can. J. Civ. Eng. 2010, 37, 544–552. [Google Scholar] [CrossRef]
- Das, S.; Das, R.; Mazumdar, A. Variation in Clear Water Scour Geometry at Piers of Different Effective Widths. Turkish J. Eng. Environ. Sci. 2014, 37, 97–111. [Google Scholar] [CrossRef]
- Azhari, A.; Taghipoor, R.; Alizadeh, M. Local Scour around Bridge Piers Group: Effect of Channel Arc Angle and Piles Spacing. In Proceedings of the 11th Conference of Hydraulic Iran, Urmia, Iran, 6 November 2012. [Google Scholar]
- Elnikhely, E.A. Minimizing Scour around Bridge Pile Using Holes. Ain Shams Eng. J. 2017, 8, 499–506. [Google Scholar] [CrossRef] [Green Version]
- Ali, H.M.; El Gendy, M.M.; Mirdan, A.M.H.; Ali, A.A.M.; Abdelhaleem, F.S.F. Minimizing Downstream Scour Due to Submerged Hydraulic Jump Using Corrugated Aprons. Ain Shams Eng. J. 2014, 5, 1059–1069. [Google Scholar] [CrossRef] [Green Version]
- Neill, C.R. Guide To Bridge Hydraulics; University of Toronto Press: Toronto, ON, Canada, 1973. [Google Scholar]
- Breusers, H.N.C.; Nicollet, G.; Shen, H.W. Local Scour Around Cylindrical Piers. J. Hydraul. Res. 1977, 15, 211–252. [Google Scholar] [CrossRef]
- Ferraro, D.; Tafarojnoruz, A.; Gaudio, R.; Cardoso, A.H. Effects of Pile Cap Thickness on the Maximum Scour Depth at a Complex Pier. J. Hydraul. Eng. 2013, 139, 482–491. [Google Scholar] [CrossRef]
- Melville, B.W.; Raudkivi, A.J. Effects of Foundation Geometry on Bridge Pier Scour. J. Hydraul. Eng. 1996, 122, 203–209. [Google Scholar] [CrossRef]
- Jalal, H.K.; Hassan, W.H. Effect of Bridge Pier Shape on Depth of Scour. IOP Conf. Ser. Mater. Sci. Eng. 2020, 671, 012001. [Google Scholar] [CrossRef]
- Al-Shukur, A.-H.K.; Hadi Obeid, Z. Experimental Study of Bridge Pier Shape To Minimize Local Scour. Int. J. Civ. Eng. Technol. 2016, 7, 162–171. [Google Scholar]
- Aly, A.M.; Dougherty, E. Bridge Pier Geometry Effects on Local Scour Potential: A Comparative Study. Ocean Eng. 2021, 234. [Google Scholar] [CrossRef]
- Fael, C.; Lança, R.; Cardoso, A. Effect of Pier Shape and Pier Alignment on the Equilibrium Scour Depth at Single Piers. Int. J. Sediment Res. 2016, 31, 244–250. [Google Scholar] [CrossRef]
- Moussa, A.M.A. Evaluation of Local Scour around Bridge Piers for Various Geometrical Shapes Using Mathematical Models. Ain Shams Eng. J. 2018, 9, 2571–2580. [Google Scholar] [CrossRef]
- Vijayasree, B.A.; Eldho, T.I.; Mazumder, B.S.; Ahmad, N. Influence of Bridge Pier Shape on Flow Field and Scour Geometry. Int. J. River Basin Manag. 2019, 17, 109–129. [Google Scholar] [CrossRef]
- Roy, C. Effect of Bridge Pier Geometry on Local Scouring. Int. J. Earth Sci. Eng. 2017, 10, 374–377. [Google Scholar] [CrossRef]
- Panici, D.; de Almeida, G.A.M. Influence of Pier Geometry and Debris Characteristics on Wood Debris Accumulations at Bridge Piers. J. Hydraul. Eng. 2020, 146, 04020041. [Google Scholar] [CrossRef]
- Eghbali, P.; Dehghani, A.; Arvanaghi, H.; Menazadeh, M. The Effect of Geometric Parameters and Foundation Depth on Scour Pattern around Bridge Pier. J. Civ. Eng. Urban. 2013, 3, 156–163. [Google Scholar]
- Ghodsi, H.; Najafzadeh, M.; Khanjani, M.J.; Beheshti, A. Effects of Different Geometric Parameters of Complex Bridge Piers on Maximum Scour Depth: Experimental Study. J. Waterw. Port Coast. Ocean Eng. 2021, 147, 04021021. [Google Scholar] [CrossRef]
- Khan, M.; Tufail, M.; Ajmal, M.; Haq, Z.U.; Kim, T.W. Experimental Analysis of the Scour Pattern Modeling of Scour Depth Around Bridge Piers. Arab. J. Sci. Eng. 2017, 42, 4111–4130. [Google Scholar] [CrossRef]
- Dahe, P.; Kharode, S. Evaluation of Scour Depth around Bridge Piers with Various Geometrical Shapes. Evaluation 2015, 2, 41–48. [Google Scholar]
- Gautam, P.; Eldho, T.I.; Behera, M.R. Experimental Study of Scour around a Complex Pier with Elliptical Pile-Cap. In Proceedings of the 8th International Conference on Scour and Erosion, ICSE 2016, Oxford, UK, 12–15 September 2016; pp. 759–765. [Google Scholar] [CrossRef] [Green Version]
- Ettema, R.; Kirkil, G.; Muste, M. Similitude of Large-Scale Turbulence in Experiments on Local Scour at Cylinders. J. Hydraul. Eng. 2006, 132, 33–40. [Google Scholar] [CrossRef]
- Melville, B.W.; Chiew, Y.-M. Time Scale for Local Scour at Bridge Piers. J. Hydraul. Eng. 1999, 125, 59–65. [Google Scholar] [CrossRef]
- Ghodsian, M.; Vaghefi, M. Experimental Study on Scour and Flow Field in a Scour Hole around a T-Shape Spur Dike in a 90° Bend. Int. J. Sediment Res. 2009, 24, 145–158. [Google Scholar] [CrossRef]
- Heidarpour, M.; Afzalimehr, H.; Izadinia, E. Reduction of Local Scour around Bridge Pier Groups Using Collars. Int. J. Sediment Res. 2010, 25, 411–422. [Google Scholar] [CrossRef]
- Akib, S.; Jahangirzadeh, A.; Wei, L.H.; Moniruzzaman, S.; Rahman, S. Experimental Study on the Skewed Integral Bridge by Using Crushed Concrete Geobags as Scour Protection. In Proceedings of the 6th International Conference on Scour and Erosion, ICSE6, Paris, French, 27–31 August 2012; pp. 197–203. [Google Scholar]
- Richardson, E.; Davis, S. Evaluating Scour at Bridges, 4th ed.; U.S. Department of Transportation; Federal Highway Administration: Washington, DC, USA, 2001; FHWA NHI 01-001.2001. [Google Scholar]
- AASHTO M145-91; Classif Soils Soil-Aggregate Mix Highw Constr Purp 9. American Association of State Highway and Transportation Officials: Washington, DC, USA, 2008.
- Galambos, T.V. Load and Resistance Factor Design. Eng. J. 1981, 18, 74–82. [Google Scholar] [CrossRef]
- Division THE. Ontario Highway Bridge Design Code; Highway Engineering Division: Toronto, ON, Canada, 1983. [Google Scholar]
- Canadian Standards Association (CSA). Canadian Highway Bridge Design Code; Csa S6-19 833; Canadian Standards Association (CSA): Toronto, ON, Canada, 2019. [Google Scholar]


| Sieve No | Sieve Size (mm) | Material Retained (gm) | Percent Retained | Percent Cumulative Retained | Percent Cumulative Passing |
|---|---|---|---|---|---|
| Total Amount of Sample = 500 gm | |||||
| #8 | 2.36 | 8.00 | 1.60 | 1.60 | 98.40 |
| #16 | 1.00 | 13.20 | 2.64 | 4.24 | 95.76 |
| #30 | 0.50 | 104.00 | 20.80 | 25.04 | 74.96 |
| #50 | 0.30 | 279.40 | 55.88 | 80.92 | 19.08 |
| #100 | 0.15 | 72.80 | 14.56 | 95.48 | 4.52 |
| #200 | 0.08 | 12.80 | 2.56 | 98.04 | 1.96 |
| Pan | 0.00 | 9.80 | 1.96 | 100.00 | 0.00 |
| Description | Length of Prototype (mm) | Length in Model | |
|---|---|---|---|
| (mm) | (cm) | ||
| Width of Pile Cap | 3500.0 | 115.0 | 11.5 |
| Length of Pile Cap | 7875.0 | 258.0 | 25.8 |
| Distance between the center of Pile cap and center of Pile | 600.0 | 20.0 | 2.0 |
| Horizontal center-to-center distance between the piles | 2225.0 | 73.0 | 7.3 |
| Vertical center-to-center distance between the piles | 11,125.0 | 37.0 | 3.7 |
| Diameter of the Piles | 750.0 | 25.0 | 2.5 |
| Diameter of the Pier | 1000.0 | 33.0 | 3.3 |
| Distance between the center of Pile cap and center of Pier | 1750.0 | 57.0 | 5.7 |
| Pile No | Pier Size (mm) | Flow Depth (mm) | Flow Velocity (mm/s) | Sediment Size (d50) (mm) | Scour Depth (mm) | ||||
|---|---|---|---|---|---|---|---|---|---|
| Circular (A) | Square (A) | Lenticular (B) | Neill Model | Hanco Model | |||||
| 1 | 25 | 65 | 222 | 0.41 | 10.70 | 44.30 | 5.23 | 2.18 | 1.69 |
| 2 | 25 | 65 | 222 | 0.41 | 9.33 | 26.00 | 4.67 | 2.18 | 1.69 |
| 3 | 25 | 65 | 222 | 0.41 | 9.00 | 23.00 | 4.00 | 2.18 | 1.69 |
| 4 | 25 | 65 | 222 | 0.41 | 8.50 | 19.70 | 3.46 | 2.18 | 1.69 |
| 5 | 25 | 65 | 222 | 0.41 | 10.65 | 42.70 | 7.00 | 2.18 | 1.69 |
| 6 | 25 | 65 | 222 | 0.41 | 9.45 | 24.00 | 6.37 | 2.18 | 1.69 |
| 7 | 25 | 65 | 222 | 0.41 | 9.11 | 22.56 | 5.89 | 2.18 | 1.69 |
| 8 | 25 | 65 | 222 | 0.41 | 8.61 | 18.23 | 4.09 | 2.18 | 1.69 |
Publisher’s Note: MDPI stays neutral with regard to jurisdictional claims in published maps and institutional affiliations. |
© 2022 by the authors. Licensee MDPI, Basel, Switzerland. This article is an open access article distributed under the terms and conditions of the Creative Commons Attribution (CC BY) license (https://creativecommons.org/licenses/by/4.0/).
Share and Cite
Tariq, M.; Khan, A.; Khan, M. Experimental Study of Scour Hole Depth around Bridge Pile Using Efficient Cross-Section. Appl. Sci. 2022, 12, 5205. https://doi.org/10.3390/app12105205
Tariq M, Khan A, Khan M. Experimental Study of Scour Hole Depth around Bridge Pile Using Efficient Cross-Section. Applied Sciences. 2022; 12(10):5205. https://doi.org/10.3390/app12105205
Chicago/Turabian StyleTariq, Moiz, Azam Khan, and Mujahid Khan. 2022. "Experimental Study of Scour Hole Depth around Bridge Pile Using Efficient Cross-Section" Applied Sciences 12, no. 10: 5205. https://doi.org/10.3390/app12105205
APA StyleTariq, M., Khan, A., & Khan, M. (2022). Experimental Study of Scour Hole Depth around Bridge Pile Using Efficient Cross-Section. Applied Sciences, 12(10), 5205. https://doi.org/10.3390/app12105205