Article

Food Risk Entropy Model Based on Federated Learning

1
School of Computer Science, Wuhan University, Wuhan 430072, China
2
School of Electronic and Electrical Engineering, Shanghai University of Engineering Science, Shanghai 201620, China
*
Author to whom correspondence should be addressed.
Appl. Sci. 2022, 12(10), 5174; https://doi.org/10.3390/app12105174
Submission received: 13 April 2022 / Revised: 13 May 2022 / Accepted: 18 May 2022 / Published: 20 May 2022
(This article belongs to the Special Issue Big Data and AI for Food and Agriculture)

Abstract

:
The safety of agricultural products is a guarantee of national security. The increasing variety of pesticides used on crops has led to an increasing abundance of pesticide residues in agricultural products, making pesticide residues an important factor in threatening health. Traditional indicators for evaluating the safety of agricultural products, such as pass rates and residue rates, can only qualitatively describe the level of pesticide residues. Isolated data leads to low data utilization, data is distributed between different terminals or departments and cannot be shared, while the security of private data needs to be ensured. Therefore, we propose a risk entropy model based on federated learning. The model is able to quantitatively describe the risk level of agricultural products and achieve data fusion without exposing private data in the federated learning model. In this paper, a total of 90,510 agricultural product data samples from 2015 to 2019 are collected, with each sample containing 58 indicators. The experimental results show that the developed food safety risk entropy model can quantitatively reflect the level of risk in the target region and time interval. In addition, we have developed a multidimensional data analysis tool based on federated learning, which can achieve data integration across multiple regions and departments.

1. Introduction

Although people around the world have paid more attention to food safety, it cannot be completely guaranteed [1], and countries around the world are working on various factors of food safety [2,3,4,5,6,7]. Nordhagen [8] summarized a review of the food safety perspectives and practices of Nigerian consumers and suppliers. The future of food safety in Nigeria focused on traditional markets for fruits and vegetables and less on closed survey questions and self-reported data. Qin et al. [9] introduced the current status, sources, and mitigation techniques of heavy metal pollution in agricultural soils in China. Ataei et al. [7] used the Delphi technique to investigate the main challenges to food security in rural Iran, which found eight categories as main challenges to food security: policy, economic, knowledge and information, infrastructural, cultural, access to food, climate conditions, and social challenges. In conclusion, many factors have an affect on food safety, and pesticide residues have received more and more attention as a huge threat to human health and the environment in recent years [10,11,12,13,14].
The problem of pesticide residues is a food safety and a major health issue for consumers [15,16,17,18]. In [19], the extraction and analysis of pesticide residues in different types of food from Bangladesh showed that only a few fish and most vegetable samples detected pesticide residues exceeding the maximum limit. Jacquet et al. [15] through the detection and analysis of pesticide residues of meat in some areas of Ghana, the result showed that most of the organochlorine detection was below the maximum limit, but the bioaccumulation of these pesticide residues may cause health problems. However, fruits and vegetables are an important part of our daily diet, so pesticide residues in fruits and vegetables have a great impact on our lives. Therefore, the study of pesticide residues in fruits and vegetables is also a very critical part of food safety [20].
Research on pesticide residues in fruits and vegetables has always been a hot topic in food safety. Masud [21] studied the common pesticide residues of three mango varieties collected in Multan, and the results showed that all samples were found to have a certain degree of variation in pesticide residues. Qin et al. [22] studied the pesticide residues in 123 vegetables and 130 fruits in western China and used the food safety index and risk coefficient to measure the health hazards of pesticide residues to consumers. The study showed that some pesticide residues in vegetables needed continuous monitoring. Yitian Shao [23] analyzed pesticide residue data in fruits and vegetables for 8 years in 32 major cities in my country shows that the problems of excessive pesticide residues in fruits and vegetables and banned pesticide residues are common in China.
In China, food testing institutions have been established at the national and provincial levels, and the national standards are used to determine whether the food is qualified or not. But two flaws cannot be avoided as follows,
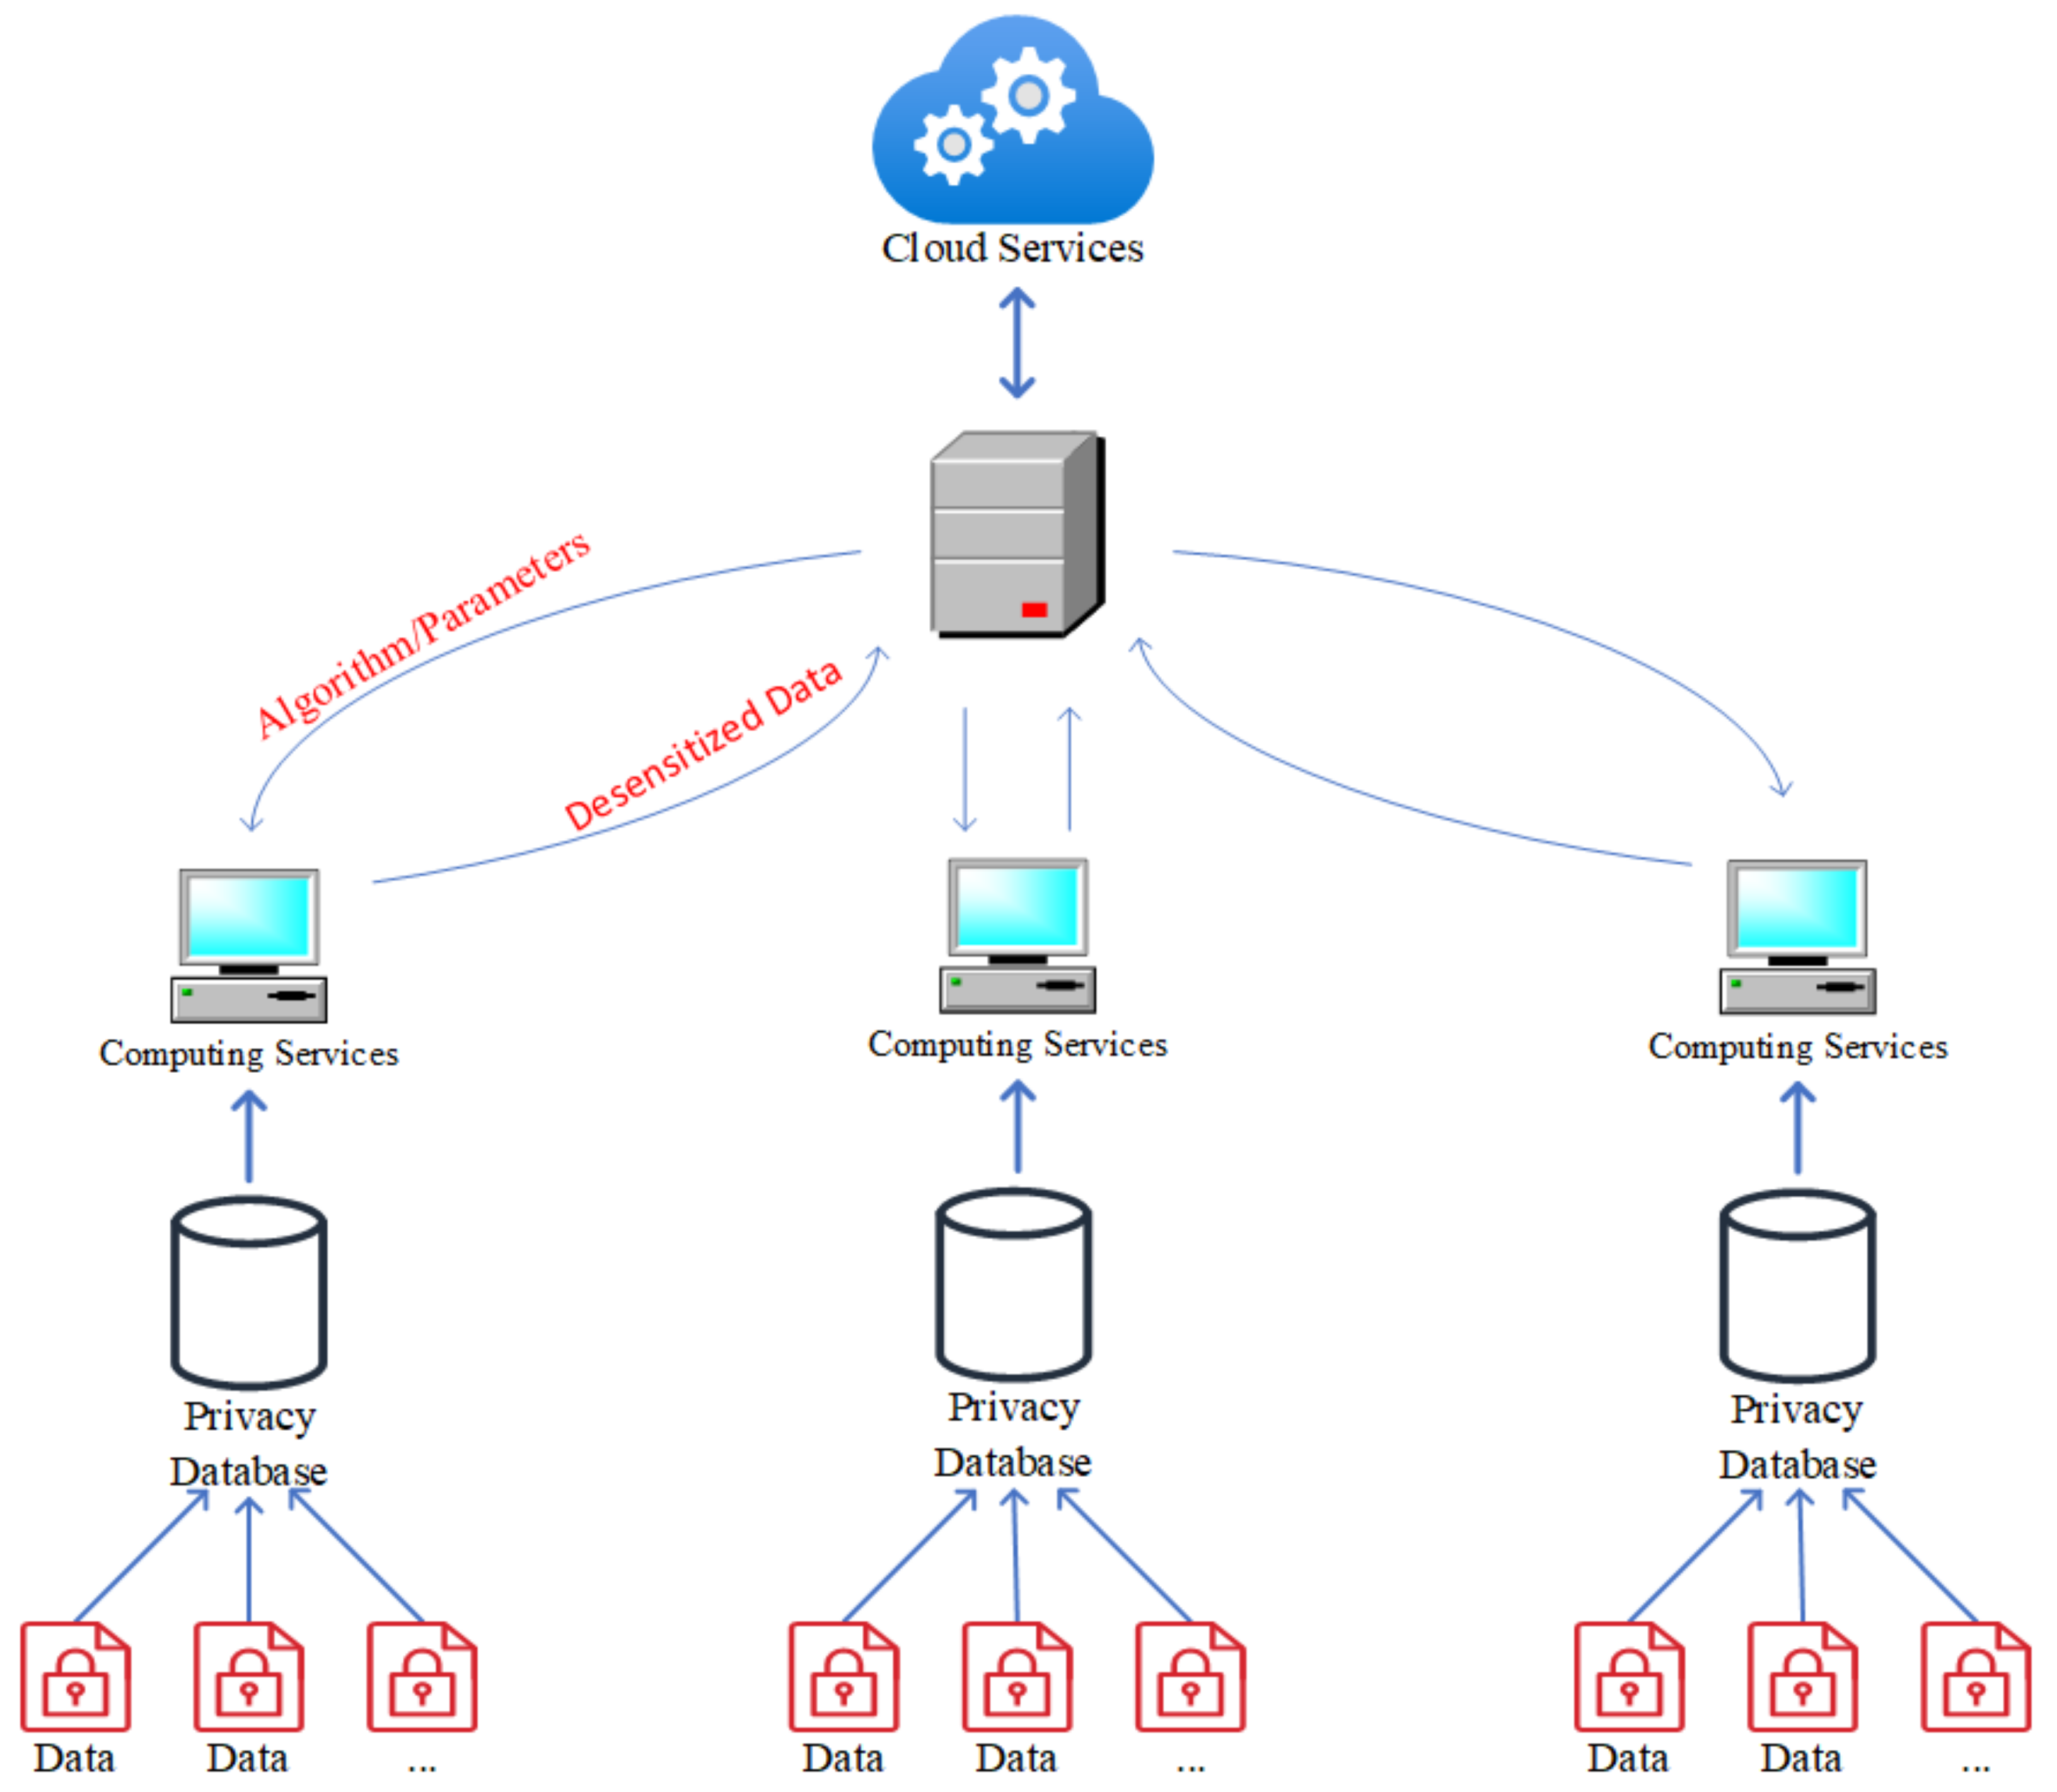
  • Data Silos: From the Figure 1, we can see that the data among various departments are private and cannot be exchanged. Hence, this has caused isolated data to form between different departments and regions. The isolated data has the significant impact on the macroscopic evaluation in food safety. The current work reflect only one aspect of risk in the area of food safety, while it is not comprehensive. Due to the protection of sampling data, the data is not fully used because that the isolation of data between various places.
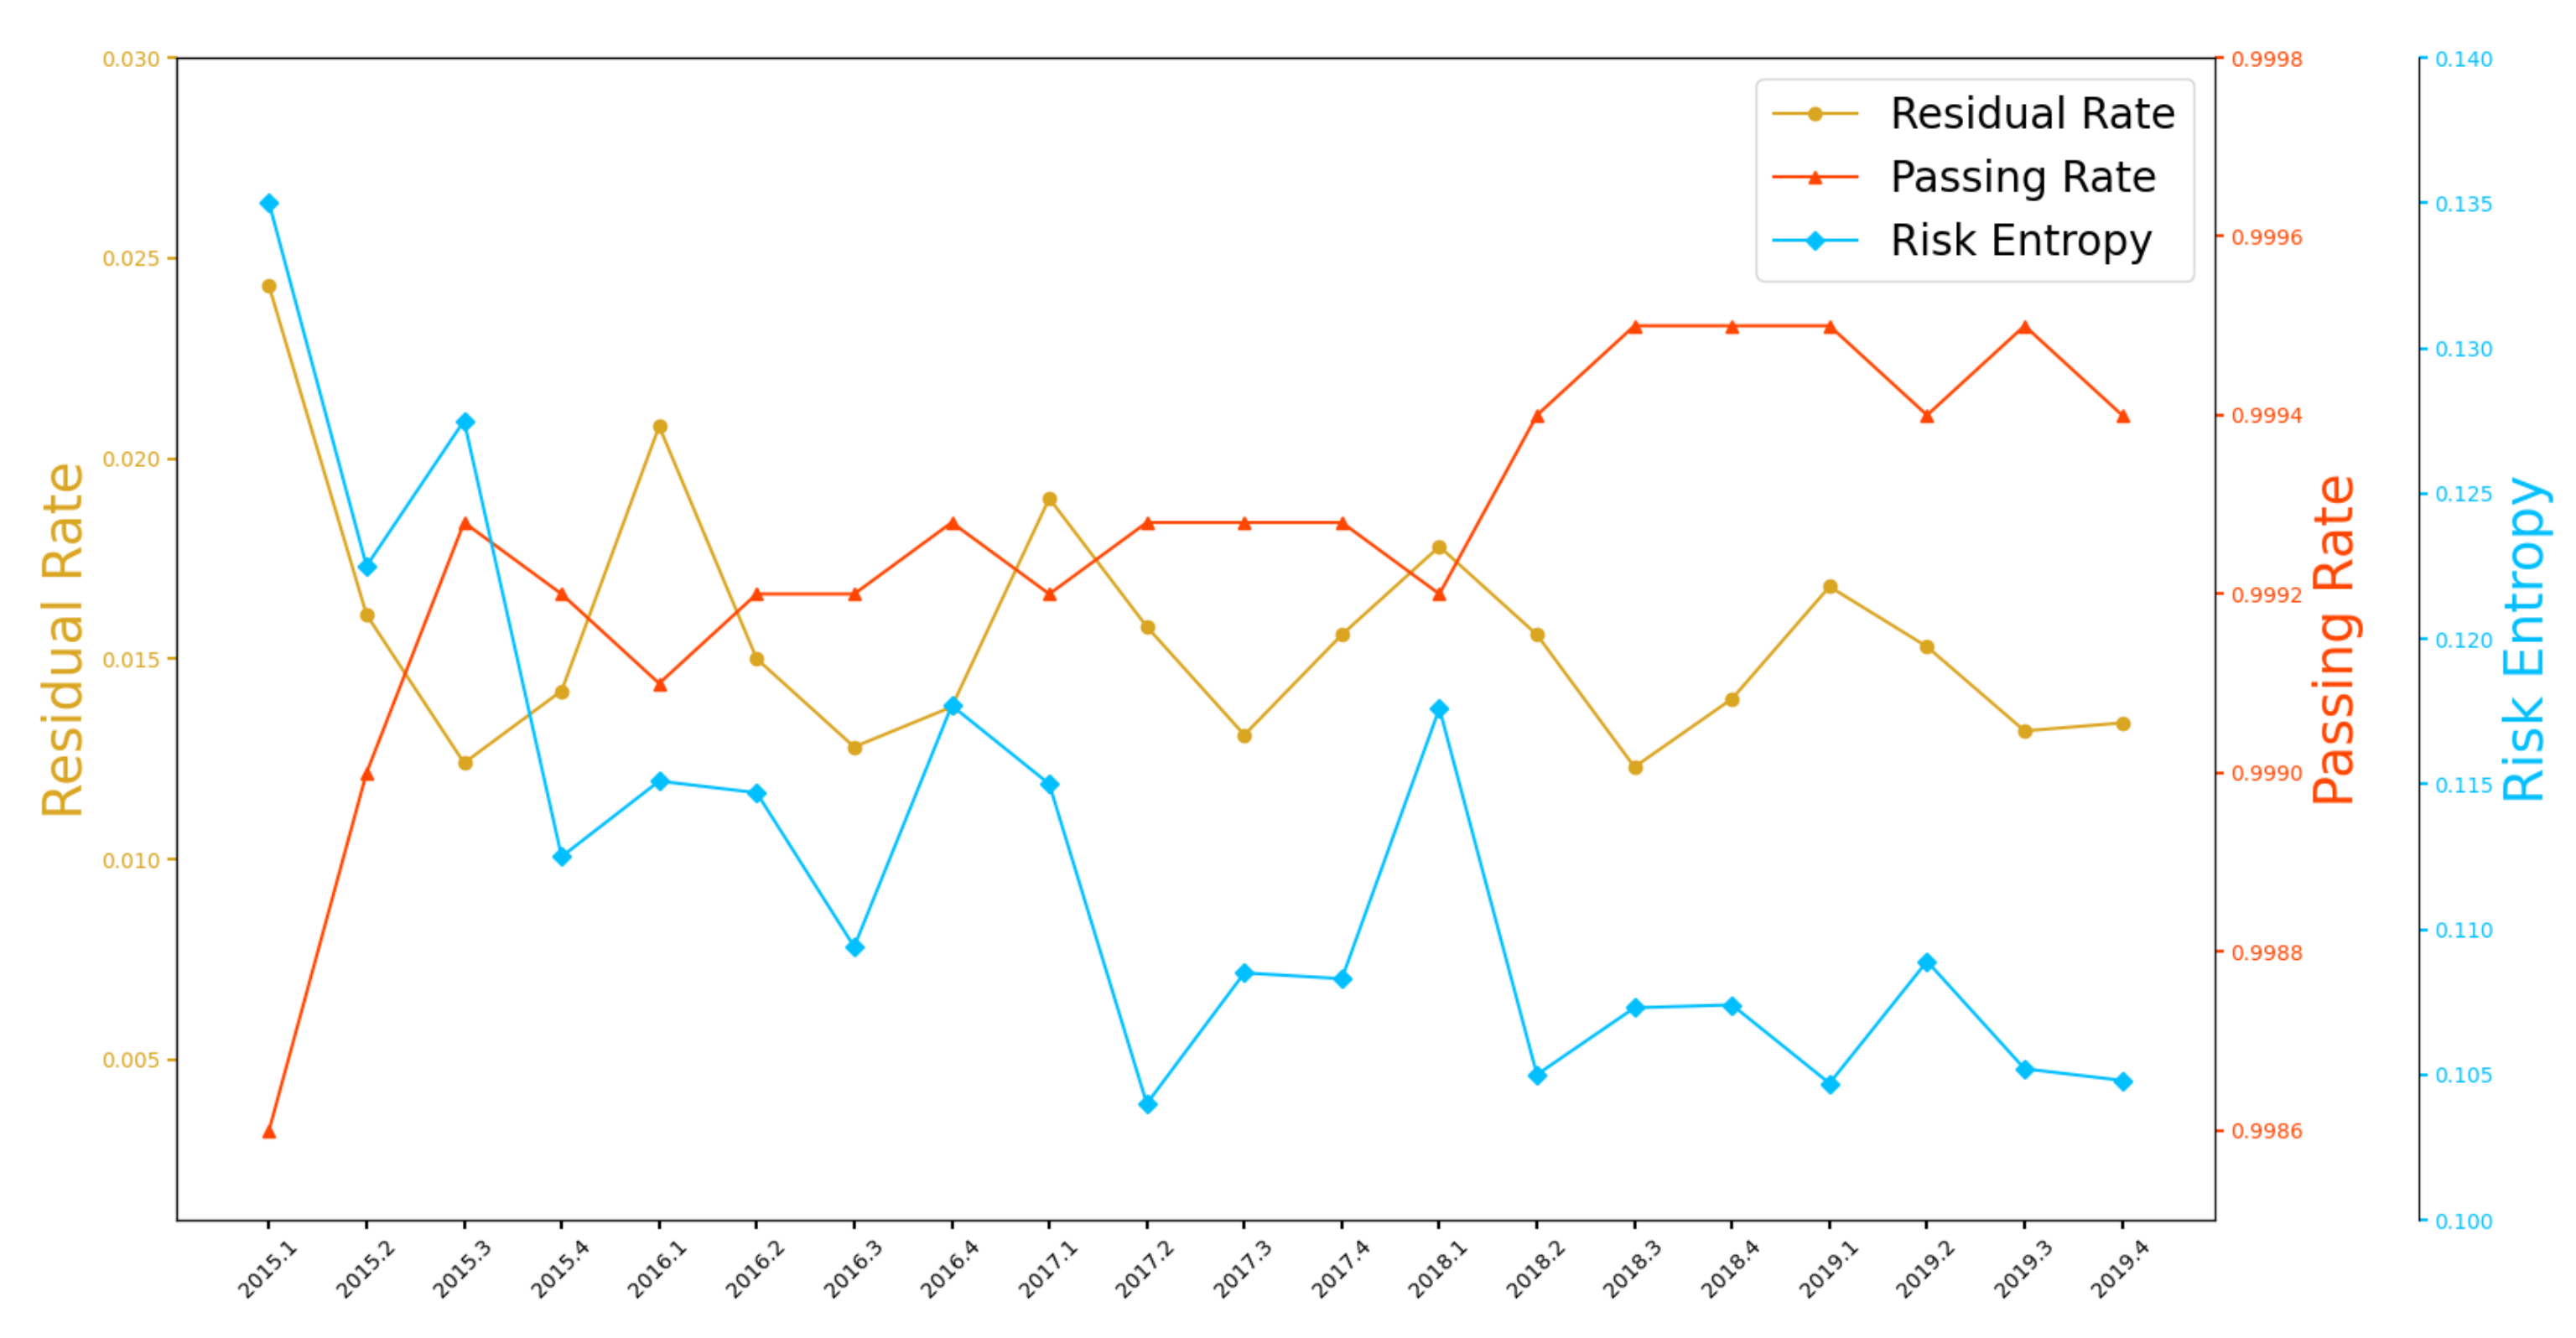
  • Quantitative Evaluation Metrics: The food testing institutions take sample at the national, provincial, and local levels, which is only a qualitative summary of pesticide residues in fruits and vegetables. There is no quantitative indicator to analyze the risk of pesticide residues of the sample. The pass rate and residue rate are common indicators for evaluating the risk of pesticide residues in food safety. In terms of the pass rate, pesticide residues are inevitable even if they pass the check. The accumulation of pesticides can also lead to risks. In terms of the residue rate, it can only qualitatively indicate the presence or absence of pesticide residues in a sample, not quantitatively indicate the level of specific residues.
To solve those problems, we have developed a risk entropy tool for food safety based on federated learning. Figure 2 shows the principle of federated learning in our method, which convert the sampling data into the quantitative analysis of pesticide residues, and our tool can protect the data between different local situations, and maximize the use of data information to build the risk entropy model.
The privacy data used in our method is the pesticide detection data for agricultural products from provincial departments. It includes 51 products and is divided into 11 categories. Each product has 58 detection indicators, and each indicator corresponds to one pesticide. Specifically, the food safety risk entropy base on federated learning in five steps as follows:
1
The federated learning server sends the calculation method, parameters, and data format of risk entropy to the clients in each department. The data format is shown in Section 4.1 in Table 1.
2
According to the standard data format, privacy data is statistically grouped by year, quarter, province, category, and product to represent the features.
3
Selecting features of different dimensions to form the privacy data within the group (e.g., year is 2019 and quarters are 1 and 2).
4
Risk entropy is calculated for the data within the group. The privacy data is calculated in the clients of each department, and the risk entropy is uploaded to the server for aggregation and macroscopic evaluation.
5
Transferring the summarized risk entropy data to the clients of each department.
The above five steps describe the process of our method, which can calculate each department risk entropy and aggregate the risk entropy in whole departments. The advantage of our method is that it can protect the privacy of original data and represent the quantitatively level of pesticide residues in agricultural products. The experimental results prove that compared with traditional risk evaluation metrics, the risk entropy of agricultural safety can quantitatively represent the risk situation of agricultural products and protect private data.
In summary, the contributions to this paper are as follows:
1
We have designed a federated learning model to solve the data gap of various departments, which can maximize the use of data to optimize the model.
2
We have designed a model for calculating the risk entropy of pesticide residues in fruits and vegetables, which can quantitatively to analyze the sampling data.
3
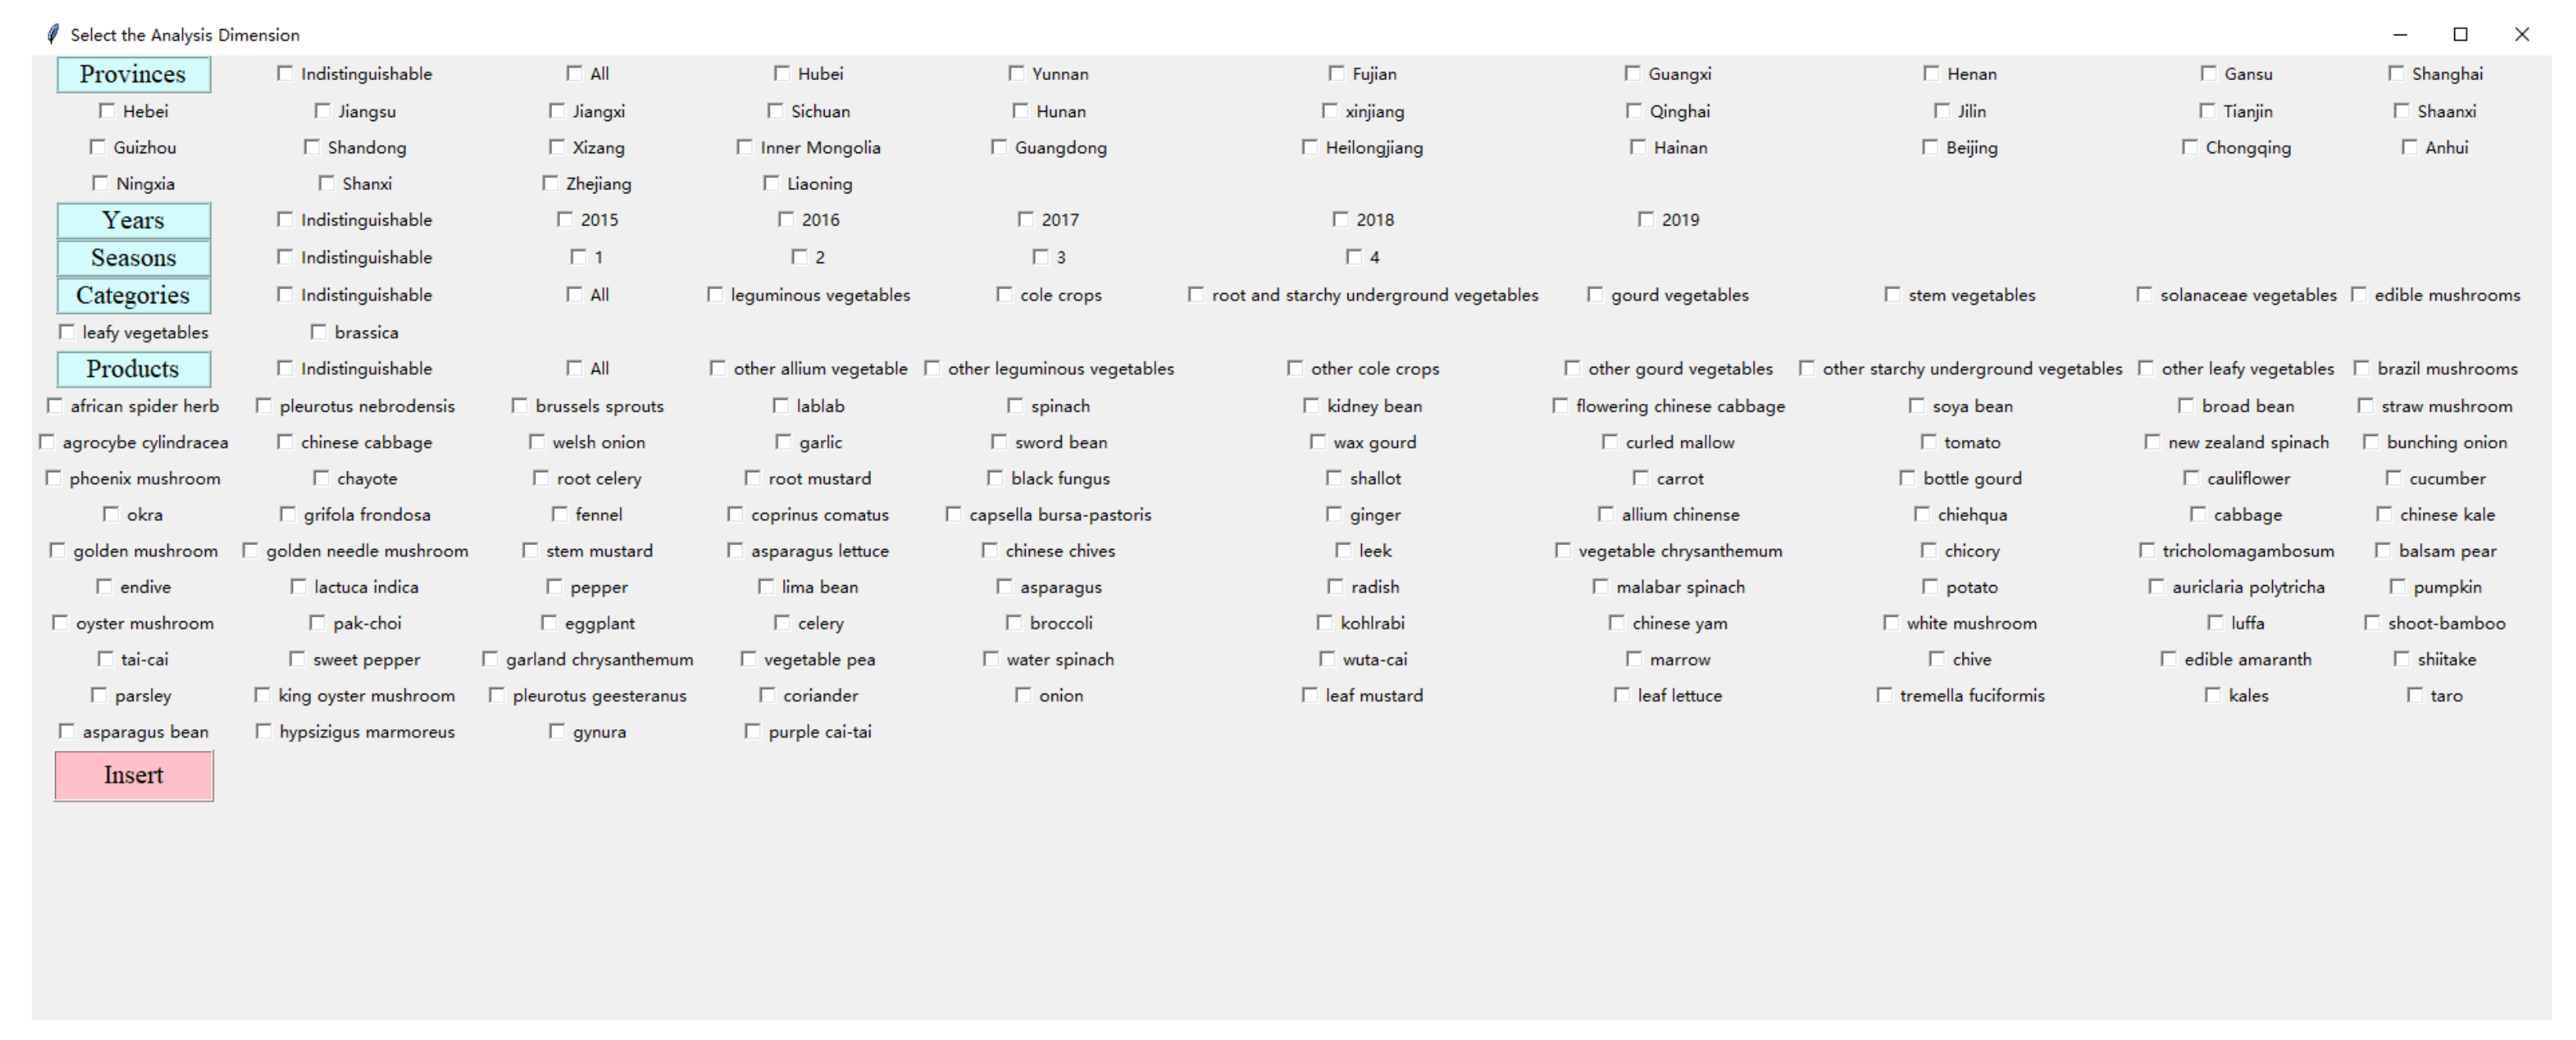
We have developed a multi-dimensional data analyzing tool to calculate the risk entropy by selecting different dimensions and categories of data automatically.
4
Our approach pioneers the latest models and provides novel insights. Notably, this paper can provide policymakers, environmental engineers, and agricultural technicians with important insights on soil pollution control and management strategies and technologies.

2. Related Work

2.1. Federated Learning

In 2016, Google first proposed the concept of federated learning [24], in which multiple clients cooperate to solve machine learning problems with the coordination of a central aggregator. It also allows the data trained in distributed computing and ensures privacy in different parts [25,26,27]. Federated learning follows the two major ideas of local computing and model transfer, reducing system privacy risks and costs brought by traditional centralized machine learning methods. Federated learning has been widely used in many industries. Long et al. [28] focused on the challenges and solutions for applying federated learning in a development banking environment. Brisimi et al. [29] proposed an iterative clustering primordial-dual splitting algorithm (CPDS) based on federated learning to predict hospitalization by analyzing information from the old electronic health records of patients. Yang et al. [24] proposed a tool that supported federated learning-driven development of computer vision applications. It helped customers develop computer vision-based security surveillance solutions for smart cities. It achieved significant efficiency gains and cost reductions, while eliminating the need to transmit sensitive data for three major enterprise customers.

2.2. Food Security

There are also many related studies on detecting and preventing food safety [30,31,32,33]. Kate et al. [34] proposed a text mining technique to identify complaints about food safety posted by citizens in the network, thereby enabling government agencies to collect more information on food safety, and demonstrating the effectiveness of the system in the real deployment. Tao et al. [35] described the applications of textual data analytics in food safety and food fraud monitoring, dietary pattern characterization, consumer opinion mining, new product development, food knowledge discovery, food supply chain management, and online food service. Its goal was to provide insights for intelligent decision-making that improves food production, food safety, and human nutrition. Bouzembrak and Marvin [36] proposed a potential Bayesian approach to food safety notices for fruits and vegetables originating from India, Turkey, and the Netherlands from 2005 to 2015, based on climatic factors, agricultural factors, and economic factors in the country of origin of the products. Identify and quantify the strength of direct relationships and interactions between food safety and other factors. Geng et al. [37] proposed an early warning method based on a deep radial basis function (DRBF) neural network fused with analytic hierarchy process (AHP). The method experiments on the sterilized milk data in the food safety inspection data of a province in China, and the results showed that the DRBF models have good generalization ability and effect for complex food safety inspection data.

3. The Quantitative Evaluation Method Based on Risk Entropy
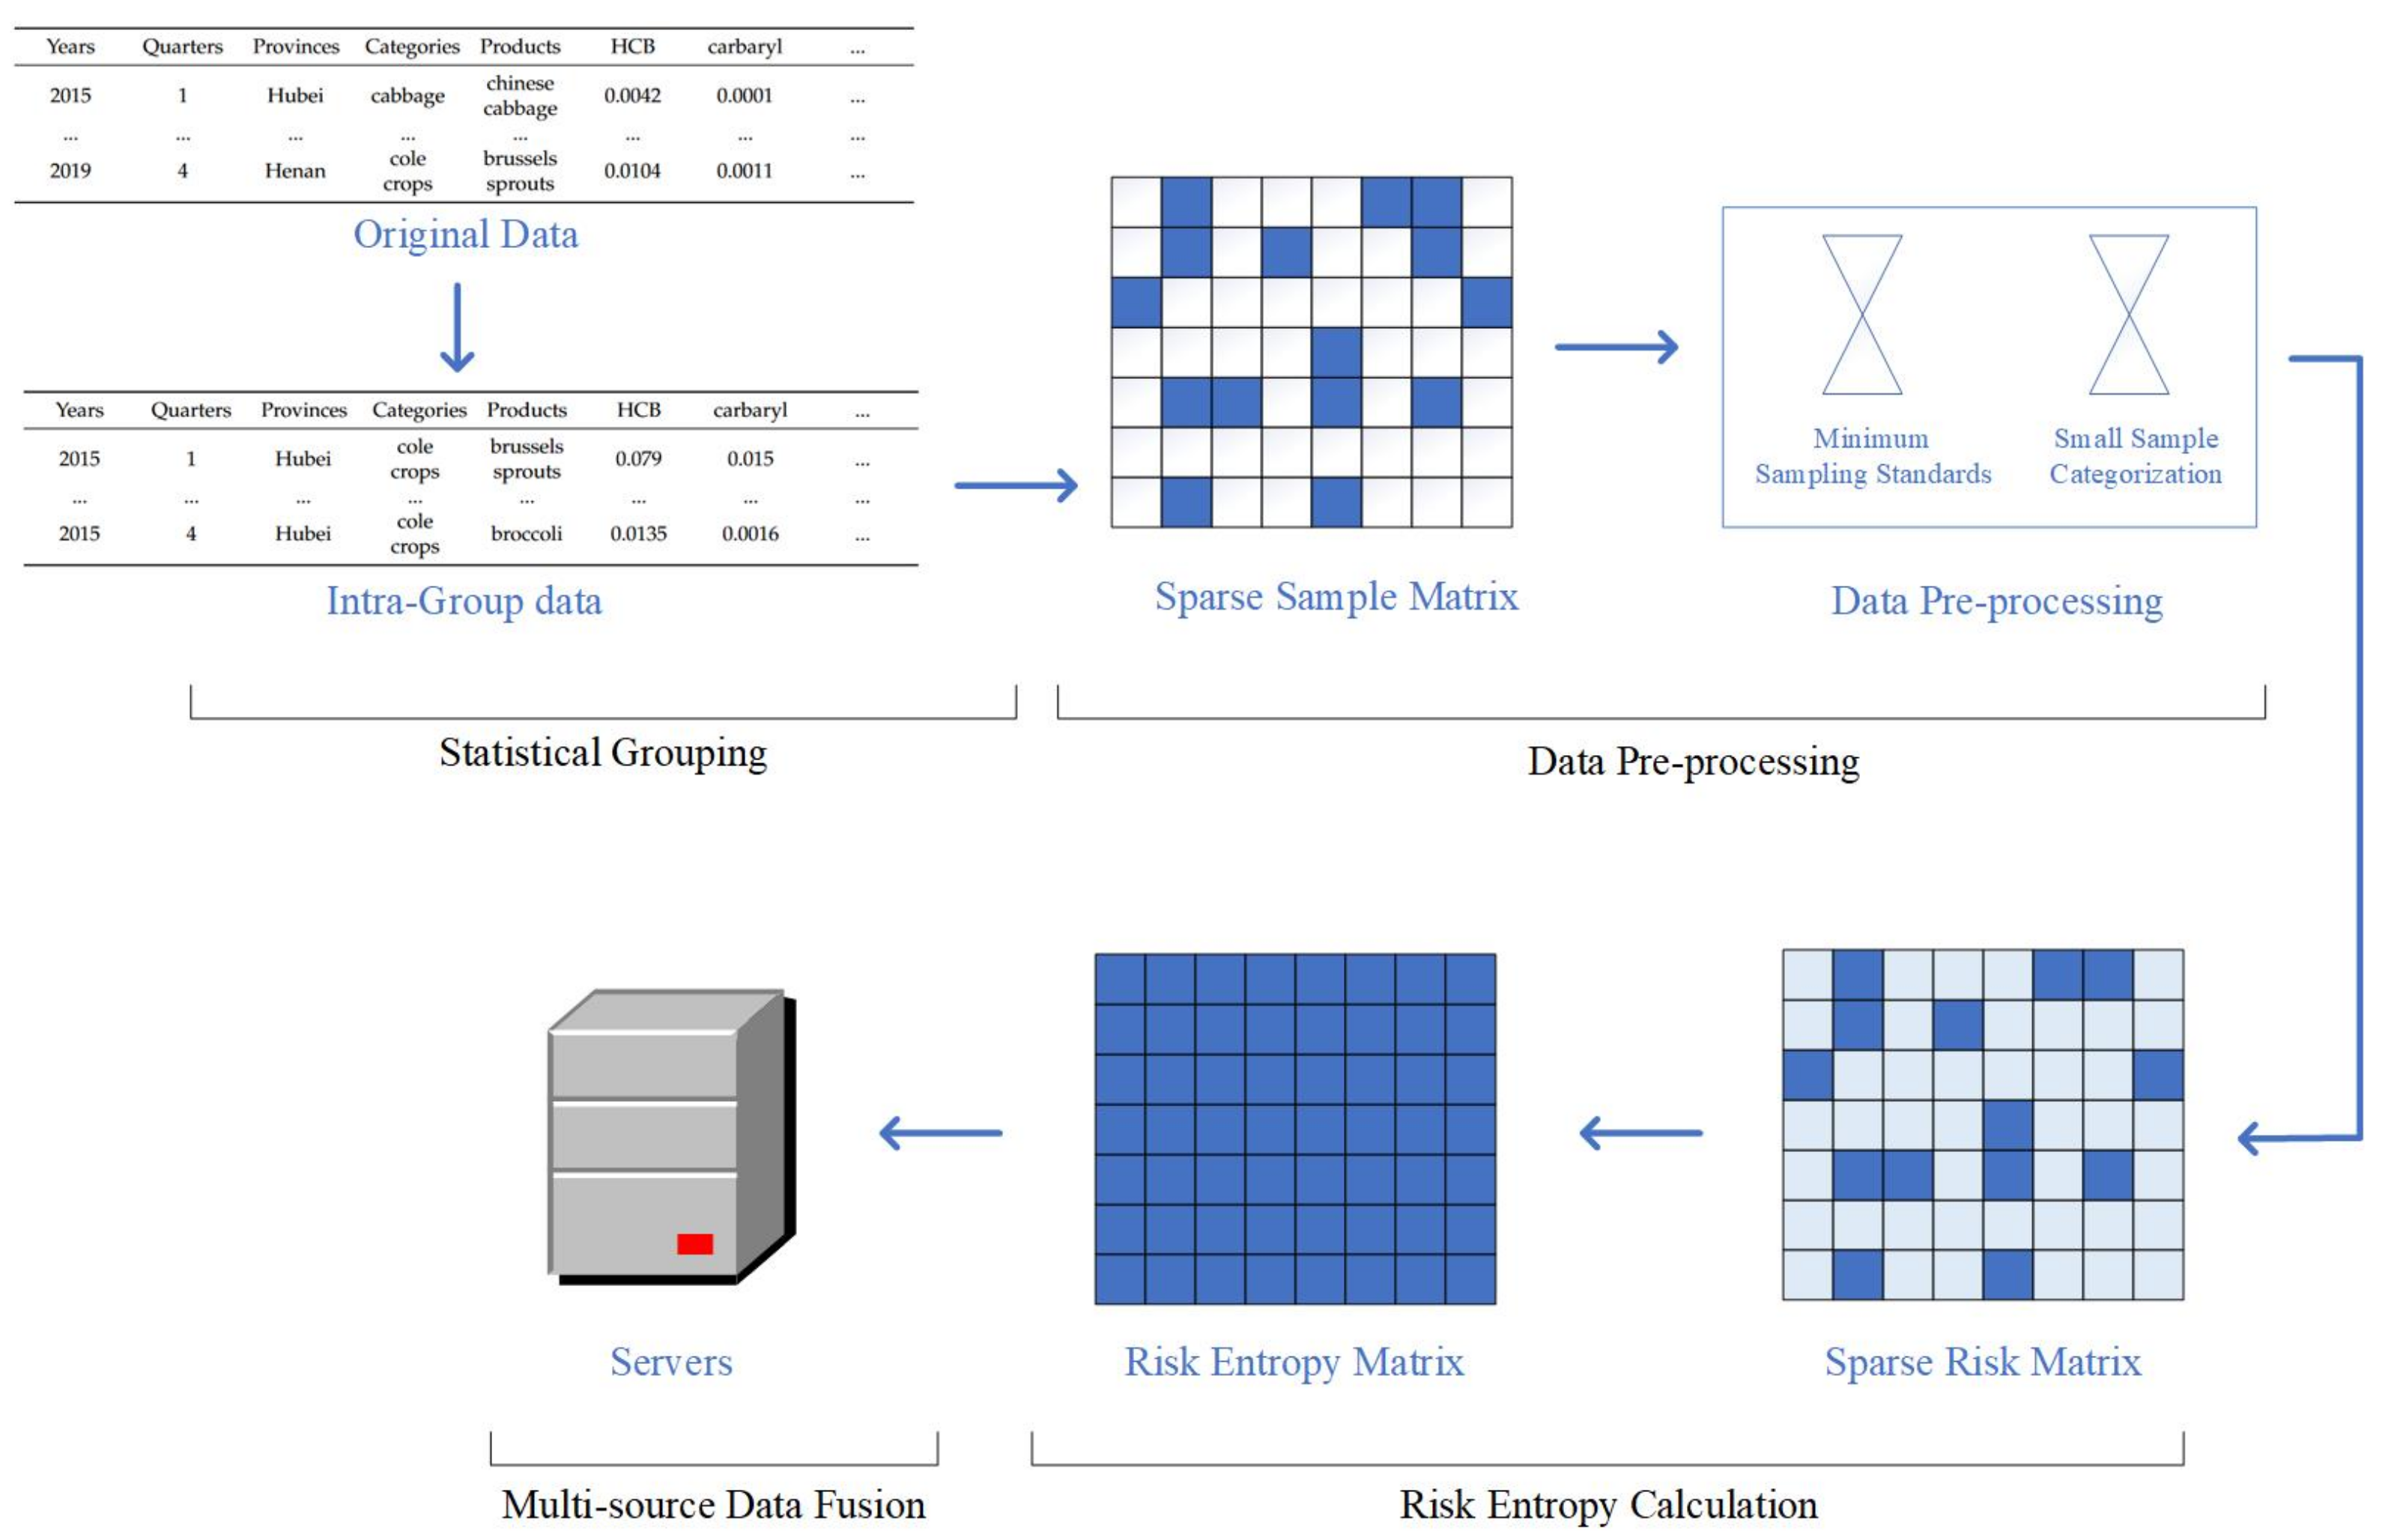
3.1. Workflow

Figure 3 shows the risk entropy model of multi-departments agricultural products based on federated learning. The model is divided into four parts, which are statistical grouping, data pre-processing, risk entropy calculation, and data fusion. The working principle is detailed in this section.

3.2. Statistical Grouping

Our dataset has the five dimensions information, which are years, province, quarters, categories, and products, respectively. We can choose the dimensions we want as the features of the statistical group. Take the dimensions of years and quarters as an example, the statistical group will be calculated the risk entropy by the dimension of years and quarters. We can choose different dimensions as the features of the statistical group according to our actual needs, and can reflect the dependence between the data of different dimensions. In this paper, we select three dimensions as the features of statistical grouping to study, which are years, quarters, and products, individually.

3.3. Data Pre-Processing

It is assumed that the statistical grouping contains total of N samples, p indicators, and k agricultural products, and the sampling size of the i-th agricultural product is n i , i = 1 k n i = N . Some of these agricultural products have a relatively small sample size, and the randomness of individual samples is inaccurate overall. Therefore, in order to make the risk entropy interpretable while avoiding the effect of randomness, we set a minimum sample size X. We define a separate category, called the other category, and categorize relatively small quantities of produce n i into this category when n i < X . By the above operation, we generate a matrix M, which consists of the names of the agricultural products as rows, the pesticide residue indicators as columns, and the sampling data as elements x, as follows,
M = x 11 x 12 . . . x 1 p x 21 x 22 . . . x 2 p . . . . . . . . . . . . x n i 1 x n i 2 . . . x n i p
The elements in the matrix M have two values, one is “Not Residue (NR)” and the other is the residual value. Due to the high sparsity of the sample data, most of the elements in the matrix M take the value of “NR”. For subsequent analysis, the “NR” value in the matrix M can be replaced by 1/2 LOD value (LOD is the minimum residual limit). To avoid confusion, the substituted matrix is still denoted as M.

3.4. Risk Entropy Calculation

Entropy is a thermodynamic concept used to measure the degree of disorder in a physical system. The lower the entropy, the more active the microscopic particles in the system; the higher the entropy, the more stable the movement of the microscopic particles in the system. Shannon [38] proposed the concept of “information entropy” to measure the information contained in the system. Therefore, this paper attempts to propose the concept of “risk entropy” to solve the problem of risk measurement of agricultural products and testing indicators.
We have collected the n samples, each sample contains p detection indicators, x l j is the l-th sample, the detection value of the j-th indicator ( l = 12 , . . . , n ; j = 1 , 2 , . . . , p ).
r l j = x l j s l j
where s l j is the standard value of the limit; r l j is a dimensionless ratio, which is a quantitative measure of the potential risk of the l-th sample, the j-th index is a quantitative measure of the potential risk of the l-th sample and the j-th indicator. The risk entropy can be defined as:
e l j = 1 + c l = 1 n i h l j l n ( h l j )
c = 1 l e n ( n i )
h l j = r l j l = 1 n i r l j
We note that if the value of x l j is 0, then the values of r l j and h l j are also 0. It will cause the risk entropy e l j to be calculated incorrectly. Therefore, 1/2 LOD is used above to replace “ND”. All risk entropy values are formed into a risk matrix E R l × j :
E = e 11 e 12 . . . e 1 p e 21 e 22 . . . e 2 p . . . . . . . . . . . . e n i 1 e n i 2 . . . e l p
where each row represents a sample and each column represents a detection indicator.
Risk entropy is used as data masking that is a quantitative evaluation of the product metrics. Hence, the risk entropy matrix is uploaded to the federated learning server for data fusion.

3.5. Multi-Departments Data Fusion

The federated learning server can transmit the risk entropy algorithm to clients in different departments. These clients use their own data to calculate risk entropy and aggregate it in the server. Based on protecting the privacy and security of sensitive data, it enables data fusion and efficient utilization in different departments.
As seen above, risk entropy can quantitatively evaluate the safety of a product as a way to identify potential risks. In addition, risk entropy is a cumulative macroscopic broad metric. In the federated learning server, data fusion is performed based on the risk entropy matrix E uploaded by departments. The formula is as follows:
L i = j = 1 p w i j e i j
where w i j [ 0 , 1 ] is the weight and j = 1 p w i j = 1 . The weight w is taken by the entropy weight method.

4. Experimental Setup

4.1. Dataset

In this paper, the dataset comes from the agricultural products quality and safety risk monitoring information system, which supports data collection and sharing, and establishes a database for agricultural product quality and safety. The collected data is labeled with information of five dimensions and 58 pesticide residue detection results (DR). Table 1 shows the data format, which has 181 products and contains 90,510 data from 2015 to 2019. The minimum sampling size is set to 100, and all products are classified into 11 categories according to NY/T3177-2018 agricultural products classification rules.

4.2. Experimental Results

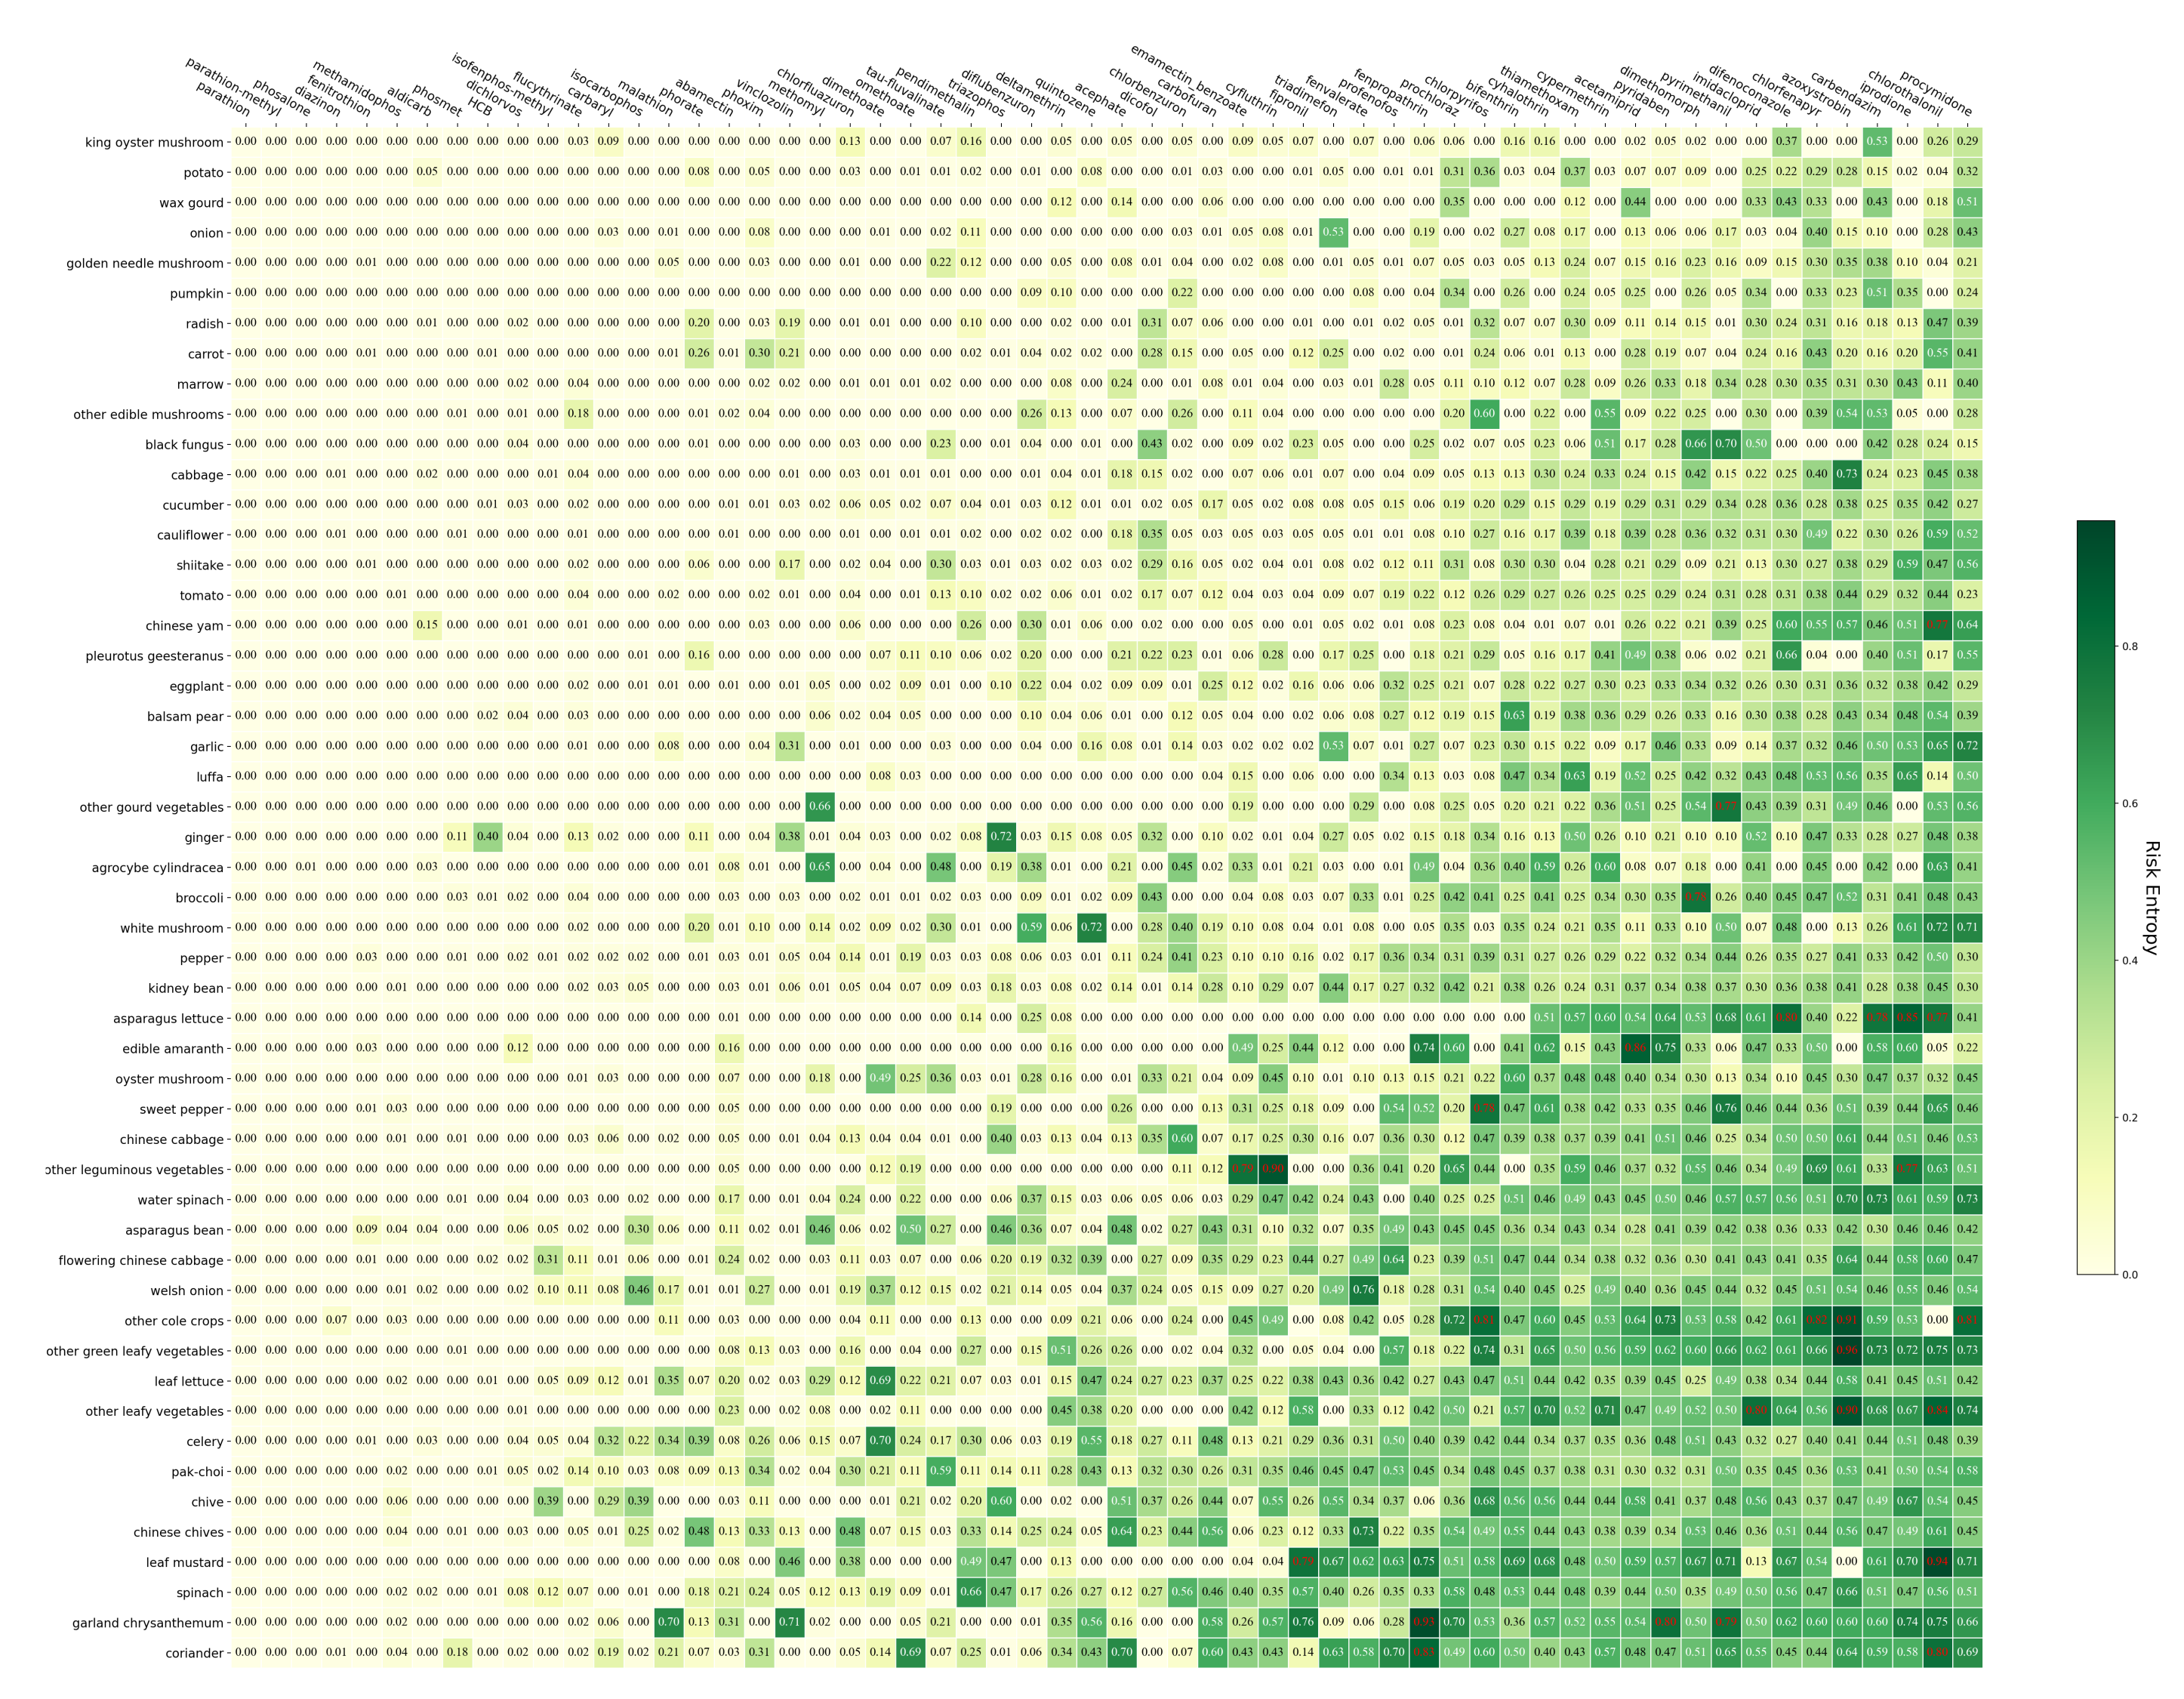
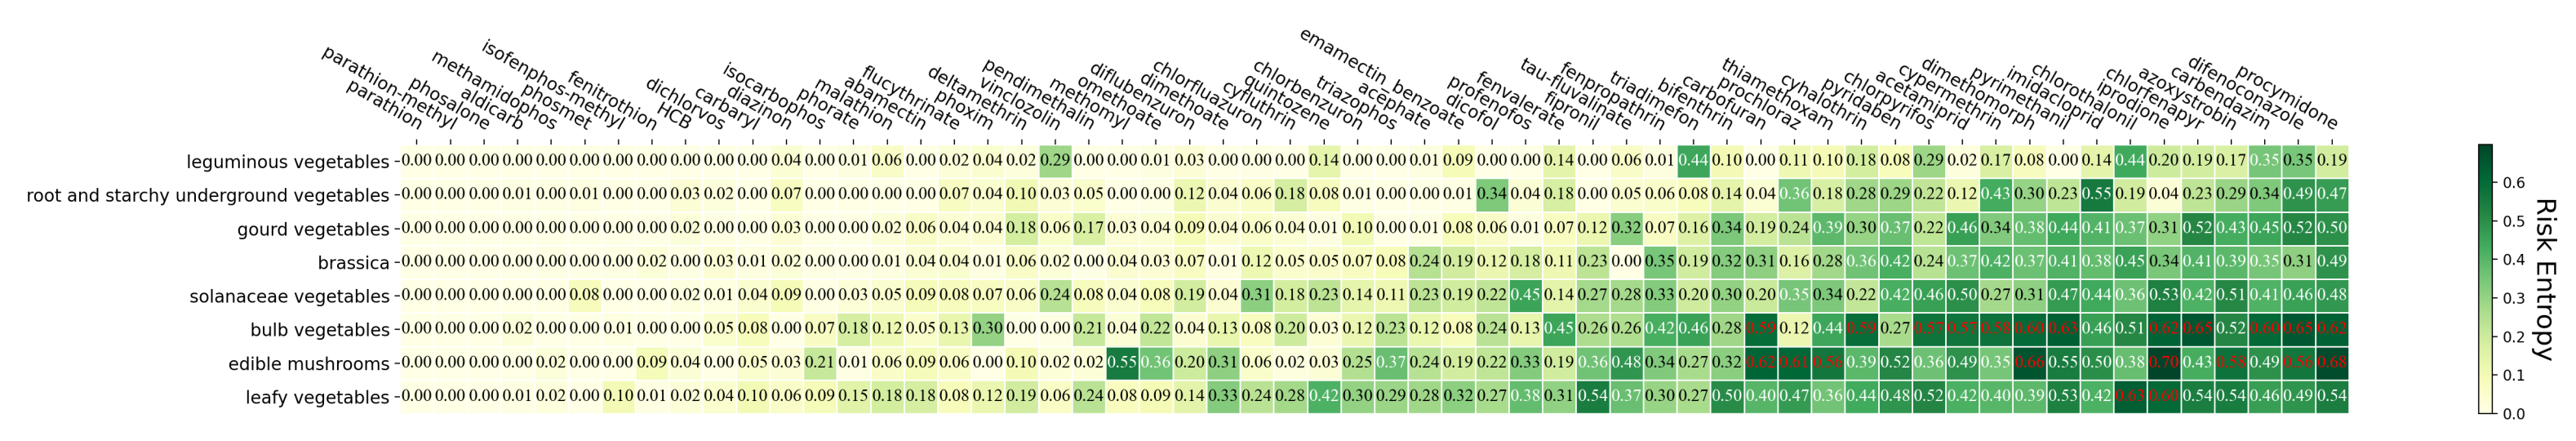
4.2.1. The Risk Entropy of Pesticide Residues

The risk entropy and detection indicators are shown in Figure 4, and the residual rate and detection indicators are shown in Figure 5. The horizontal axis contains 58 pesticide detection indicators, and the vertical axis contains 51 agricultural products. In order to better observe the distribution of the risk entropy and find “products + indicators” with high-risk. The high-risk products are placed below and the detection indicators are placed on the right by the value of the risk entropy.
We can find that there are obvious differences between Figure 4 and Figure 5. The following example illustrates the differences clearly. The residual rate of carbendazim in white mushrooms are up to 34.40 % , but the residues in the vast majority of samples are in the safe range. In other words, although the residual rate is high, the risk is not serious, and the risk entropy is only 0.26. In contrast, the residual rate of “leaf mustard + chlorothalonil” is only 1.28 % , and the risk entropy is up to 0.94. The reason for this phenomenon is that the residues of mustards with chlorothalonil are very large, and if the product is unfortunately eaten, it will lead to a serious food safety threat.
It can be seen from the above example that the residual rate can only qualitatively indicate whether the product corresponds to a residue of the test indicator. In fact, residue levels are critical in food safety risks. Current evidence supports the view that risk entropy can quantitatively describe potential risks in products and metrics, and that risk scales can be identified with greater accuracy than traditional metrics.

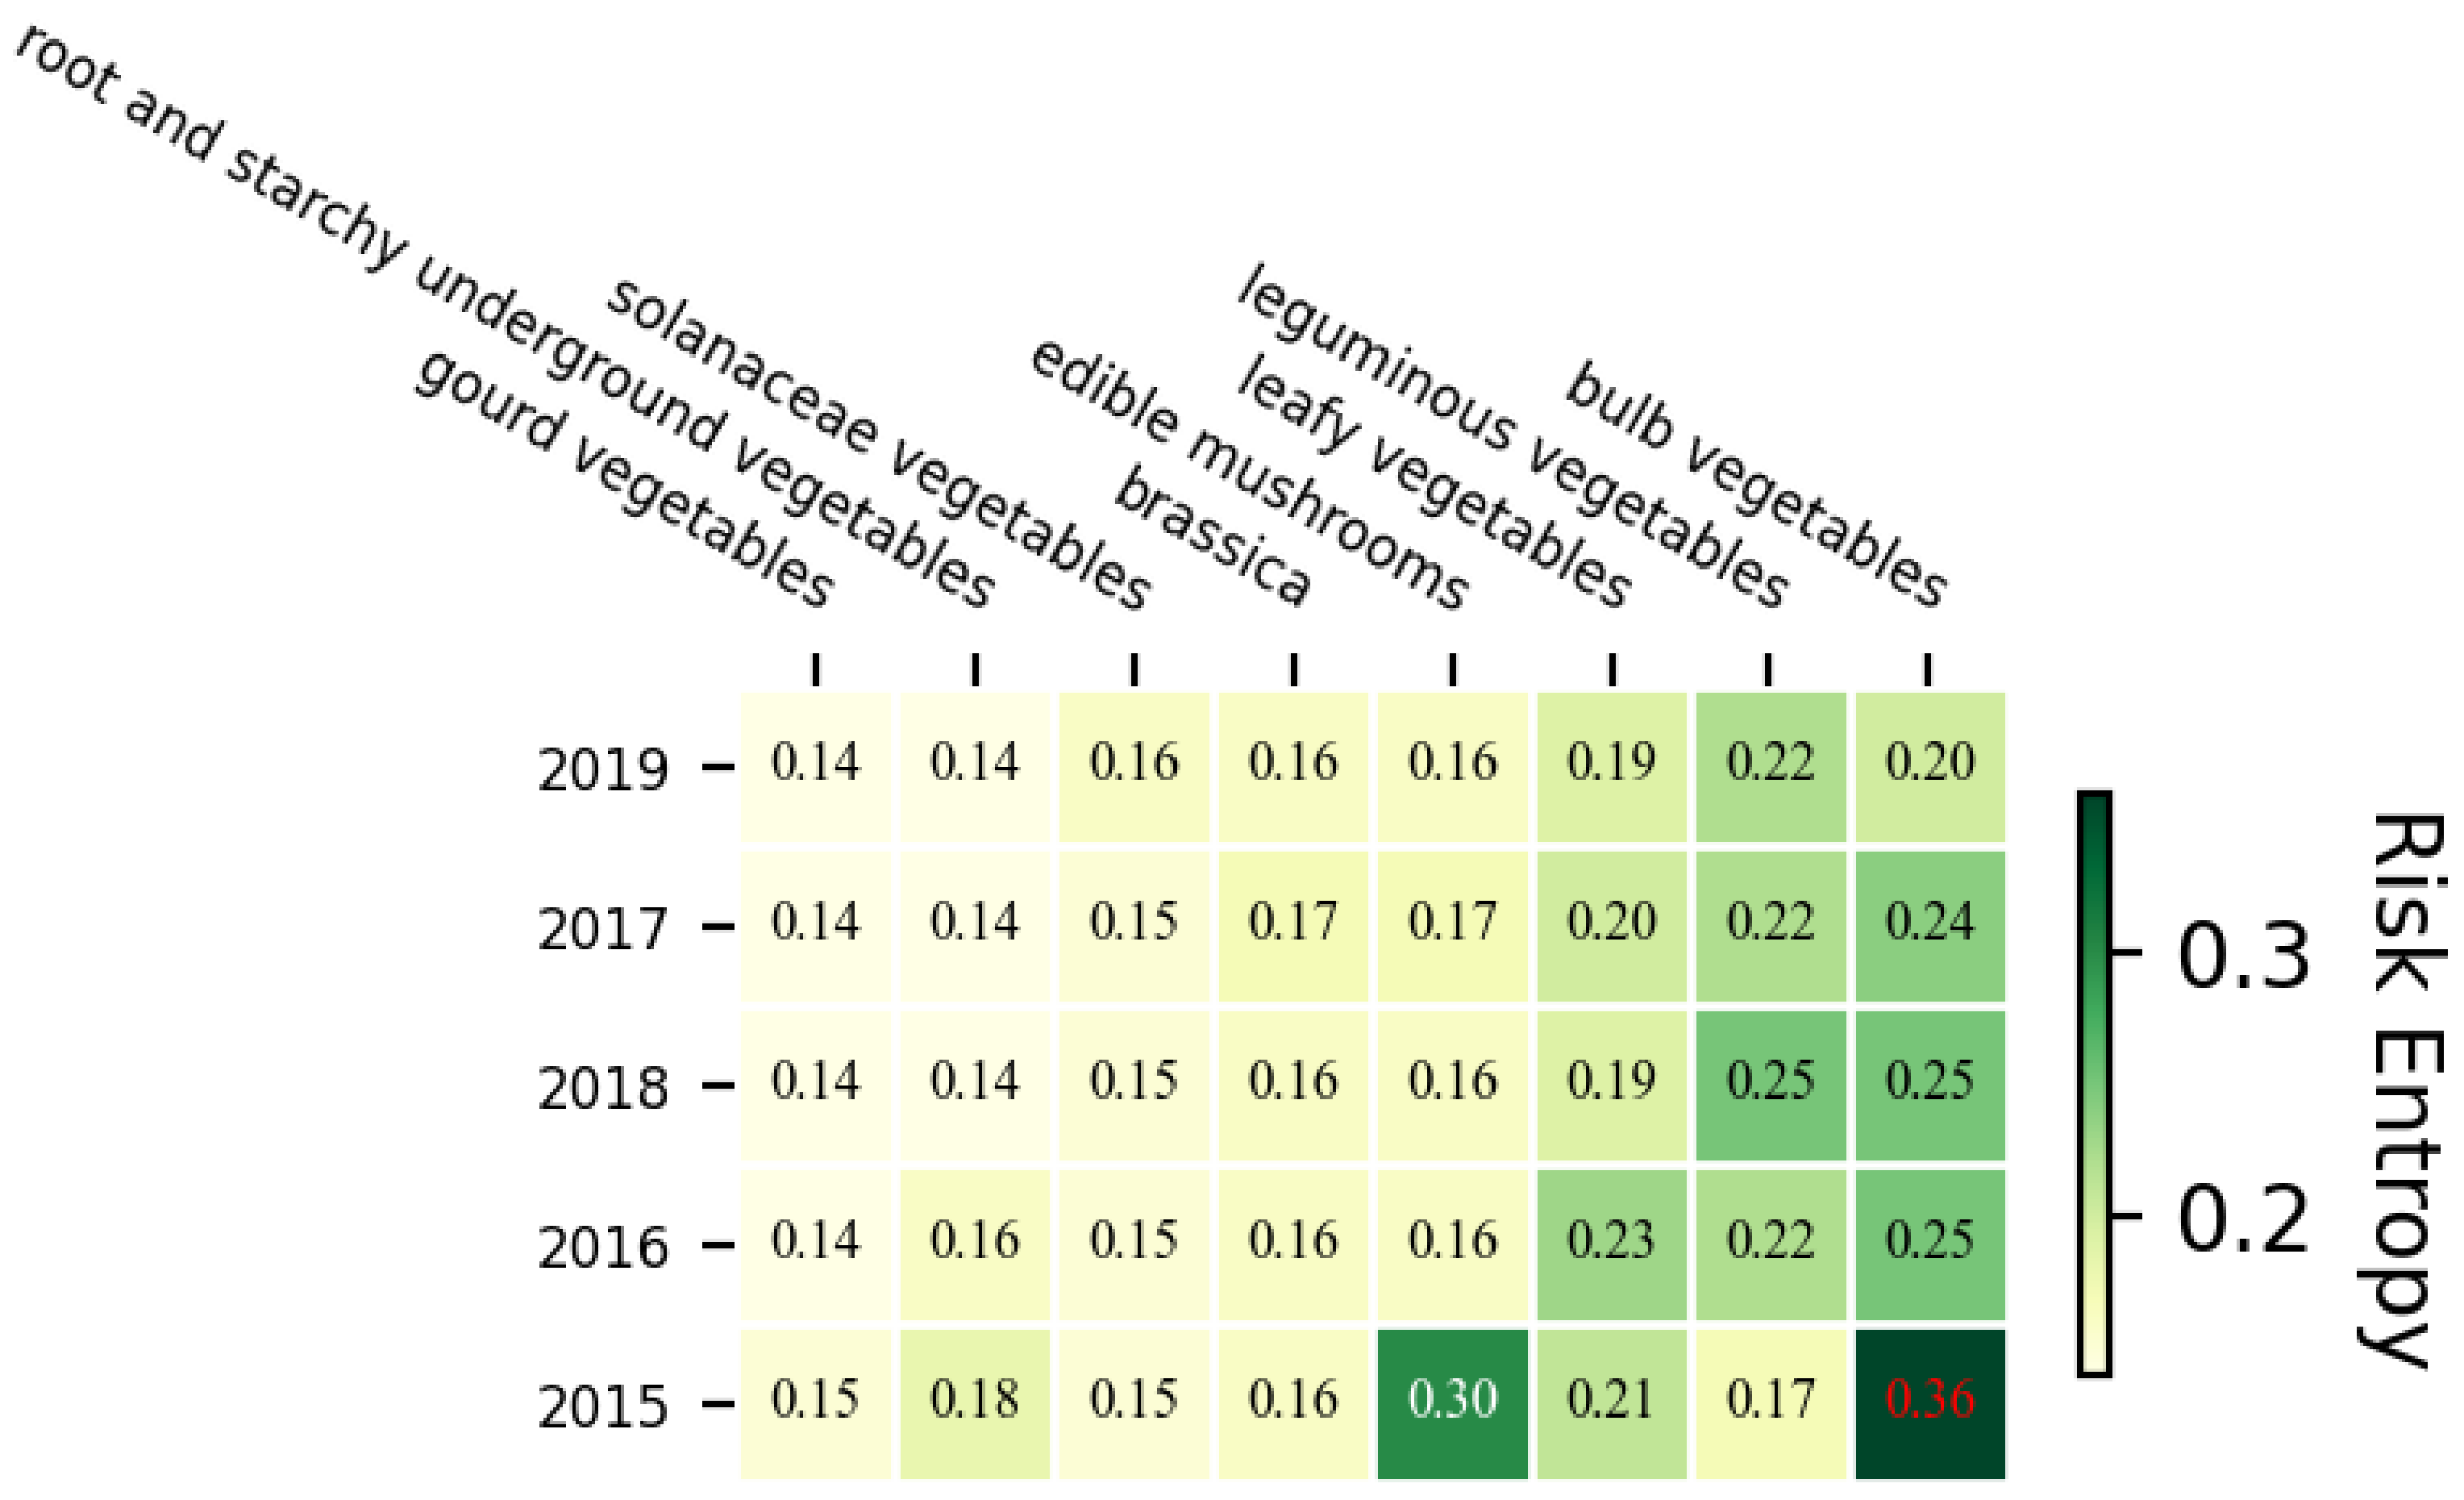
4.2.2. Overall Evaluation

Figure 6 shows the summary of data for each quarter from 2015 to 2019, including risk entropy, residue rate, and pass rate. Generally, it can be observed that the pass rate is gradually increasing, the residual rate is decreasing, and the corresponding risk entropy is decreasing every year. It is worth mentioning that risk entropy is very sensitive to risk perception. For example, in the first quarter of 2018, compared with the previous quarter, there is a slight decrease in the pass rate while the residual rate increased slightly. At this time, the risk entropy will be significantly increased and a risk warning will be issued. Therefore, risk entropy can help relevant departments to capture risks and issue early warnings.

4.2.3. The Multi-Dimensional Data Analysis Tool

We have developed “the Multi-dimensional Data Analysis Tool”. The risk entropy of the data within the group can be calculated by concise operation. The tool is shown in Figure 7. After selecting the data for analysis, clicking ‘Insert’ will calculate the risk entropy and generate result.
In order to illustrate the effects of the tool, it is divided into three sections. First, observe the risk entropy of ‘Year + Category’. The province is ‘Hubei’, the years are ‘2015, 2016, 2017, 2018, 2019’ and the category is ‘All’. Figure 8 shows the corresponding calculation results that the trend of risk entropy for all categories is decreasing annually. In 2015, the risk entropy of ‘root and starchy underground vegetables’, ‘gourd vegetables’, ‘edible mushrooms’, and ‘bulb vegetables’ are the highest of the five years, achieving 0.18, 0.15, 0.30, and 0.36, respectively. Therefore, we must focus on agricultural products in 2015.
Next, we will observe the entropy of risk for each category specifically in 2015. We select the province as ‘Hubei’, the year is ‘2015’ and the category is ‘All’. The risk entropy of ‘Category + Indicator’ can be clearly seen in Figure 9. Among the indicators for edible mushrooms, Cysticercus has the highest risk value of 0.70. In addition, carbendazim, benconazole and pyrimethanil are at higher risk. Future work could focus on optimization of the high-risk ‘category + indicator’.
Finally, we pay attention to ‘Product + Indicator’ in Figure 10. After selecting the province as ’Hubei’, the year as ‘2015’, and the product as ‘All’, most of the risks are concentrated on the indicators of ’chlorothalonil’, ’azoxystrobin’, ’iprodione’, ‘carbendazim’, and ‘procymidone’. The risk entropy of azoxystrobin in water spinach is 0.89. The risk entropy of azoxystrobin in flowering chinese cabbage is 0.88. The risk entropy of chlorothalonil and iprodione in other green leafy vegetables are 0.89 and 0.88, respectively. In future work, we must focus on these agricultural products of indicators.

5. Threats of Validity

Threats to internal validity come from implementation errors in experiments. Leveraging off-the-shelf third-party libraries (https://github.com/OpenMined/PySyft (accessed on 28 January 2021)) to implement the federated learning model may mitigate these threats. Threats to external validity come from incomplete data. The data set comes from the Agricultural Product Quality and Safety Risk Monitoring Information System, including 90,510 product data from 2015 to 2019, and each datum has 58 pesticide residue indicators. However, these 58 indicators cannot fully represent the risks of agricultural products, and more indicators of pesticide residues should be measured. Threats to construct validity mainly focus on the rationality of evaluation indicators. This paper designs a new risk assessment method: food safety risk entropy. The role of food safety risk entropy is described from the aspects of the macro-level, micro-level, timeline, and so on. These can make our analysis of experimental results more rigorous.

6. Conclusions and Future Work

6.1. Conclusions

Food safety is the focus of social work and the guarantee of national development. The safety of agricultural products is the most critical component in food safety. The evaluation indicators of traditional agricultural products (e.g., pass rate, residue rate) can only qualitatively represent the pesticide residues in the agricultural product and the qualitative indicators do not directly reflect the degree of risk in food. The purpose of this study is to devise a method to quantify risk and assess risk in existing agricultural products. This paper proposes a method called food safety risk entropy based on federated learning. This method clusters data with similar characteristics through statistical grouping and introduces the concept of ‘entropy’ in thermodynamics to quantify risk. The federated learning model is used to aggregate isolated data and ensure the security of data. Further, we verify 90,510 products in China and compare the effect of traditional indicators (residual rate and qualified rate). The experimental results show that the risk entropy is sensitive to pesticide residues in agricultural products and can be used as a new evaluation indicator for agricultural products. In summary, this paper contributes as follows: First, a novel method is introduced for food safety risk assessment. Second, we develop the federated learning methods to integrate isolated data between departments and regions. Third, our method ensures the security of private data and the results can be shared globally. Fourth, a multi-dimensional data analysis tool is developed, which provides a convenient way for a non-professional person to use.

6.2. Future Work

This research can be improved in the following aspects in the future: First, only 58 pesticide residue indicators are included in the product data. These indicators are not comprehensive, and more comprehensive data should be collected for risk assessment in the future. Second, products with the sampling size of less than 100 are classified as other categories in this study. However, it does not mean that these products are not important. More relevant data should be collected and added to the data set to ensure the generality of the experimental results. Finally, the research data in this paper comes from the agricultural products, and cannot directly represent the risk to human health. Actual risks include the ability of the body to metabolize different pesticide residues. This is an interesting question that could be usefully explored in further research. Despite its limitations, the research provides new ideas in the field of food safety.

Author Contributions

Conceptualization, Y.C. and J.Y.; methodology, Y.C.; software, Y.C.; validation, J.Y. and Z.W.; formal analysis, Y.C.; investigation, J.Y.; resources, Z.W.; data curation, Y.C.; writing—original draft preparation, Y.C. and J.Y.; writing—review and editing, J.L. and B.H.; visualization, Y.C.; supervision, J.L. and Z.W.; project administration, Z.W.; funding acquisition, J.L. All authors have read and agreed to the published version of the manuscript.

Funding

This work is supported by the National Key R&D Program of China under Grant 2018YFC1604000.

Institutional Review Board Statement

Not applicable.

Informed Consent Statement

Not applicable.

Data Availability Statement

Not applicable.

Conflicts of Interest

The authors declare no conflict of interest.

References

  1. Borchers, A.; Teuber, S.S.; Keen, C.L.; Gershwin, M.E. Food safety. Clin. Rev. Allergy Immunol. 2010, 39, 95–141. [Google Scholar] [CrossRef] [PubMed]
  2. Zhang, T.; Min, W.; Yang, J.; Liu, T.; Jiang, S.; Rui, Y. What If We Could Not See? Counterfactual Analysis for Egocentric Action Anticipation. In Proceedings of the Thirtieth International Joint Conference on Artificial Intelligence, Montreal, QC, Canada, 19–27 August 2021; pp. 1316–1322. [Google Scholar]
  3. Tirado, M.C.; Clarke, R.; Jaykus, L.; McQuatters-Gollop, A.; Frank, J. Climate change and food safety: A review. Food Res. Int. 2010, 43, 1745–1765. [Google Scholar] [CrossRef]
  4. Ehuwa, O.; Jaiswal, A.K.; Jaiswal, S. Salmonella, food safety and food handling practices. Foods 2021, 10, 907. [Google Scholar] [CrossRef] [PubMed]
  5. Maurya, A.; Prasad, J.; Das, S.; Dwivedy, A.K. Essential oils and their application in food safety. Front. Sustain. Food Syst. 2021, 5, 133. [Google Scholar] [CrossRef]
  6. Cheng, W.; Tang, X.; Zhang, Y.; Wu, D.; Yang, W. Applications of metal-organic framework (MOF)-based sensors for food safety: Enhancing mechanisms and recent advances. Trends Food Sci. Technol. 2021, 112, 268–282. [Google Scholar] [CrossRef]
  7. Ataei, P.; Sadighi, H.; Izadi, N. Major challenges to achieving food security in rural, Iran. Rural. Soc. 2021, 30, 15–31. [Google Scholar] [CrossRef]
  8. Nordhagen, S. Food safety perspectives and practices of consumers and vendors in Nigeria: A review. Food Control 2022, 134, 108693. [Google Scholar] [CrossRef]
  9. Qin, G.; Niu, Z.; Yu, J.; Li, Z.; Ma, J.; Xiang, P. Soil heavy metal pollution and food safety in China: Effects, sources and removing technology. Chemosphere 2021, 267, 129205. [Google Scholar] [CrossRef]
  10. Wang, T.; Wang, S.; Cheng, Z.; Wei, J.; Yang, L.; Zhong, Z.; Hu, H.; Wang, Y.; Zhou, B.; Li, P. Emerging core–shell nanostructures for surface-enhanced Raman scattering (SERS) detection of pesticide residues. Chem. Eng. J. 2021, 424, 130323. [Google Scholar] [CrossRef]
  11. Oo, L.M.; Aung, N.Z. A simple and efficient method for automatic strawberry shape and size estimation and classification. Biosyst. Eng. 2018, 170, 96–107. [Google Scholar] [CrossRef]
  12. Sørensen, L.B.; Møller, P.; Flint, A.; Martens, M.; Raben, A. Effect of sensory perception of foods on appetite and food intake: A review of studies on humans. Int. J. Obes. 2003, 27, 1152–1166. [Google Scholar] [CrossRef] [PubMed] [Green Version]
  13. Hu, B.; Pu, H.; Sun, D.W. Multifunctional cellulose based substrates for SERS smart sensing: Principles, applications and emerging trends for food safety detection. Trends Food Sci. Technol. 2021, 110, 304–320. [Google Scholar] [CrossRef]
  14. Tuglo, L.S.; Agordoh, P.D.; Tekpor, D.; Pan, Z.; Agbanyo, G.; Chu, M. Food safety knowledge, attitude, and hygiene practices of street-cooked food handlers in North Dayi District, Ghana. Environ. Health Prev. Med. 2021, 26, 1–13. [Google Scholar] [CrossRef] [PubMed]
  15. Jacquet, F.; Butault, J.P.; Guichard, L. An economic analysis of the possibility of reducing pesticides in French field crops. Ecol. Econ. 2011, 70, 1638–1648. [Google Scholar] [CrossRef] [Green Version]
  16. Chen, Z.; Tao, Y. Food safety inspection using “from presence to classification” object-detection model. Pattern Recognit. 2001, 34, 2331–2338. [Google Scholar] [CrossRef]
  17. Harris, M. Comment on Vayda’s review of good to eat: Riddles of food and culture. Hum. Ecol. 1987, 15, 511–517. [Google Scholar] [CrossRef]
  18. Henson, S.; Caswell, J. Food safety regulation: An overview of contemporary issues. Food Policy 1999, 24, 589–603. [Google Scholar] [CrossRef] [Green Version]
  19. Rahman, M.; Hoque, M.S.; Bhowmik, S.; Ferdousi, S.; Kabiraz, M.P.; van Brakel, M.L. Monitoring of pesticide residues from fish feed, fish and vegetables in Bangladesh by GC-MS using the QuEChERS method. Heliyon 2021, 7, e06390. [Google Scholar] [CrossRef]
  20. Darko, G.; Acquaah, S.O. Levels of organochlorine pesticides residues in meat. Int. J. Environ. Sci. Technol. 2007, 4, 521–524. [Google Scholar] [CrossRef] [Green Version]
  21. Masud, T. Determination of pesticides residues in selected varieties of mango. Pak. J. Nutr. 2002, 1, 41–42. [Google Scholar]
  22. Qin, G.; Chen, Y.; He, F.; Yang, B.; Zou, K.; Shen, N.; Zuo, B.; Liu, R.; Zhang, W.; Li, Y. Risk assessment of fungicide pesticide residues in vegetables and fruits in the mid-western region of China. J. Food Compos. Anal. 2021, 95, 103663. [Google Scholar] [CrossRef]
  23. Yitian Shao, Y.W. Pesticide Residues and Government Regulation in China—Evidence from Pesticide Residues in Fruits and Vegetables. Agric. Sci. Technol. 2021, 22, 42–49. [Google Scholar]
  24. Yang, Q.; Liu, Y.; Cheng, Y.; Kang, Y.; Chen, T.; Yu, H. Federated learning. Synth. Lect. Artif. Intell. Mach. Learn. 2019, 13, 1–207. [Google Scholar] [CrossRef]
  25. Zhang, C.; Xie, Y.; Bai, H.; Yu, B.; Li, W.; Gao, Y. A survey on federated learning. Knowl.-Based Syst. 2021, 216, 106775. [Google Scholar] [CrossRef]
  26. Wei, K.; Li, J.; Ding, M.; Ma, C.; Yang, H.H.; Farhad, F.; Jin, S.; Quek, T.; Poor, H.V. Federated Learning with Differential Privacy: Algorithms and Performance Analysis. IEEE Trans. Inf. Forensics Secur. 2019, 15, 3454–3469. [Google Scholar] [CrossRef] [Green Version]
  27. Liu, Y.; Huang, A.; Luo, Y.; Huang, H.; Yang, Q. FedVision: An Online Visual Object Detection Platform Powered by Federated Learning. Proc. AAAI Conf. Artif. Intell. 2020, 34, 13172–13179. [Google Scholar] [CrossRef]
  28. Long, G.; Tan, Y.; Jiang, J.; Zhang, C. Federated learning for open banking. In Federated Learning; Springer: Berlin/Heidelberg, Germany, 2020; pp. 240–254. [Google Scholar]
  29. Brisimi, T.S.; Chen, R.; Mela, T.; Olshevsky, A.; Paschalidis, I.C.; Shi, W. Federated learning of predictive models from federated electronic health records. Int. J. Med. Inf. 2018, 112, 59–67. [Google Scholar] [CrossRef]
  30. Hou, Q.; Min, W.; Wang, J.; Hou, S.; Zheng, Y.; Jiang, S. FoodLogoDet-1500: A Dataset for Large-Scale Food Logo Detection via Multi-Scale Feature Decoupling Network. In Proceedings of the 29th ACM International Conference on Multimedia, Newark, NJ, USA, 27–30 June 2021; pp. 4670–4679. [Google Scholar]
  31. Liu, X.; Min, W.; Mei, S.; Wang, L.; Jiang, S. Plant disease recognition: A large-scale benchmark dataset and a visual region and loss reweighting approach. IEEE Trans. Image Process. 2021, 30, 2003–2015. [Google Scholar] [CrossRef]
  32. Min, W.; Liu, L.; Wang, Z.; Luo, Z.; Wei, X.; Wei, X.; Jiang, S. Isia food-500: A dataset for large-scale food recognition via stacked global-local attention network. In Proceedings of the 28th ACM International Conference on Multimedia, Seattle, WA, USA, 12–16 October 2020; pp. 393–401. [Google Scholar]
  33. Jiménez, A.R.; Jain, A.K.; Ceres, R.; Pons, J.L. Automatic fruit recognition: A survey and new results using range/attenuation images. Pattern Recognit. 1999, 32, 1719–1736. [Google Scholar] [CrossRef]
  34. Kate, K.; Negi, S.; Kalagnanam, J. Monitoring food safety violation reports from internet forums. In e-Health–For Continuity of Care; IOS Press: Amsterdam, The Netherlands, 2014; pp. 1090–1094. [Google Scholar]
  35. Tao, D.; Yang, P.; Feng, H. Utilization of text mining as a big data analysis tool for food science and nutrition. Compr. Rev. Food Sci. Food Saf. 2020, 19, 875–894. [Google Scholar] [CrossRef] [Green Version]
  36. Bouzembrak, Y.; Marvin, H.J. Impact of drivers of change, including climatic factors, on the occurrence of chemical food safety hazards in fruits and vegetables: A Bayesian Network approach. Food Control 2019, 97, 67–76. [Google Scholar] [CrossRef]
  37. Geng, Z.; Shang, D.; Han, Y.; Zhong, Y. Early warning modeling and analysis based on a deep radial basis function neural network integrating an analytic hierarchy process: A case study for food safety. Food Control 2019, 96, 329–342. [Google Scholar] [CrossRef]
  38. Shannon, C.E. A mathematical theory of communication. ACM SIGMOBILE Mob. Comput. Commun. Rev. 2001, 5, 3–55. [Google Scholar] [CrossRef]
Figure 1. The data silos.
Applsci 12 05174 g001
Figure 2. Federated learning model.
Applsci 12 05174 g002
Figure 3. Workflow of risk entropy.
Applsci 12 05174 g003
Figure 4. Heat map of the risk entropy of pesticide, the row labels are the names of 51 agricultural products and the columns are labelled with 58 indicators of pesticide residue detection. Darker colours indicate higher values of the risk entropy.
Applsci 12 05174 g004
Figure 5. Heat map of the residual rate of pesticide, the row labels are the names of 51 agricultural products and the columns are labelled with 58 indicators of pesticide residue detection. Darker colours indicate that a greater proportion of the sample was detected for the corresponding pesticide.
Applsci 12 05174 g005
Figure 6. Overall evaluation.
Applsci 12 05174 g006
Figure 7. The multi-dimensional data analysis platform.
Applsci 12 05174 g007
Figure 8. Heat map of the risk entropy of ‘Year + Category’, row labels are years, from 2015 to 2019 and column labels are 8 agricultural categories. Darker colours indicate higher values of the risk entropy.
Applsci 12 05174 g008
Figure 9. Heat map of the risk entropy of ‘Categoriy + Indicator’, the row labels are the names of 8 agricultural categories and the columns are labelled with 58 indicators of pesticide residue detection. Darker colours indicate higher values of the risk entropy.
Applsci 12 05174 g009
Figure 10. Heat map of the risk entropy of ‘Product + Indicator’, the row labels are the names of 31 agricultural products and the columns are labelled with 58 indicators of pesticide residue detection. Darker colours indicate higher values of the risk entropy.
Applsci 12 05174 g010
Table 1. Standard data format.
YearsQuartersProvincesCategoriesProductsDR 1 DR 58
20224Hubeileafy vegetablesChinese cabbage0.0050.001
Publisher’s Note: MDPI stays neutral with regard to jurisdictional claims in published maps and institutional affiliations.

