1. Introduction
Carbon dioxide (CO) is one of the most important gases in several technologically and sociopolitically relevant fields, like combustion and exhaust gas technology, breath gas analysis, agriculture, or pharmaceutical and food processing industry. CO monitoring, storage, reduction, transport, and conversion technologies have become increasingly important, in particular as CO gas is considered to be the primary anthropogenic greenhouse gas, accounting for the utmost part of the recent human contribution to the greenhouse effect.
Recent progress in optoelectronics has triggered the use of quantum cascade lasers (QCLs) for spectroscopic laser absorption techniques in gas sensing applications [
1,
2]. CO
gas is suited for such methods due to high extinction cross sections of its vibrational–rotational transitions in the mid-infrared spectral range. A key property of these techniques is their non-invasive character, that is, the sensor devices do not require direct contact to the medium of interest. Quantum cascade laser-based absorption spectroscopy (QCLAS) thus uniquely combines several major advantages, such as high sensitivity, exceptional time-resolution, and the possibility to perform real-time in situ measurements. In recent years, QCLAS has proved to be an essential probe of CO
in, e.g., biomedical breath analysis [
3,
4,
5,
6,
7], the investigation of plasma and combustion processes [
8,
9], or environmental and atmospheric gas sensing [
10,
11,
12,
13].
Vibrational–rotational cross sections of gases are generally sensitive to temperature, of which CO by no means is an exception. As a result, the quantification of CO gas concentration from specific spectral absorption lines is subject to a certain inaccuracy if the instant temperature of the medium is unknown. From an application point of view, this issue is particularly relevant if the system under investigation experience strong dynamic variations in gas temperature too fast to be tracked by conventional temperature sensing devices like platinum resistance thermometers and thermocouple elements. An inherent disentanglement in the determination of CO concentration and temperature by laser spectroscopy would thus support efforts in resolving fast changes of these parameters in real-time with high precision, as required for instance in online measurements of CO as biomarker in exhaled air for clinical testing, etc.
In the present paper, we report on a proof-of-concept study of a QCL-based absorption method that is optimized to measure temperature
and CO
concentration of gas mixtures in a range close to room temperature on a nanosecond time scale. The method employs strong CO
absorption lines with opposite temperature dependence which are probed by a single nanosecond frequency down chirped IR pulse of a distributed feedback QCL operated in intrapulse mode [
14] with scanning rates up to ∼40 kHz. We demonstrate measurements on simulated breath gas flow and discuss the method with respect to potential improvements.
2. Methods
The method presented in this work focuses on a sensitive determination of the CO
gas temperature in the room temperature region, that is why particularly temperature sensitive rovibrational CO
transitions are selected to be probed. CO
absorption spectra of the selected lines with frequencies within 2349 to 2352 cm
as obtained from HITRAN simulations [
15] are shown in
Figure 1.
The major absorption lines at about 2351.45 and 2349.92 cm are due to the R(2) and R(0) rotational transitions of the fundamental asymmetric stretching vibration ((), respectively. The lower-energy level of these transitions is the vibrational ground state of the CO molecules. Absorption lines with minor intensity originate from the R(16)−R(21) rotational transitions of so-called “hot bands” of the asymmetric CO stretching mode, where the initial states of the transitions are already excited in the bending mode (). The lower-energy states of these hot band transitions are higher in energy than the fundamental ground state transitions by 773 to 846 cm. The basic principle of our temperature measurements relies on the Boltzmann-like population of the fundamental and hot band transitions, while the hot bands increase in intensity with increasing temperature, the R(2) and R(0) transitions at 2351.45 and 2349.92 cm show decreasing intensity with increasing temperature. This opposite temperature dependence is the key property for the high sensitivity of the method presented. To the best of our knowledge, the selected CO transitions have not been used for QCL-based temperature sensing so far. For this purpose the transitions are particularly well suited, as (i) high temperature sensitivity can be achieved due to the opposite temperature dependence, (ii) cost-effective sensors with simple design may be developed as absorption line intensities are sufficient for direct absorption spectroscopy, and (iii) other atmospheric gases, such as H2O, CO, NO, NOx, and hydrocarbons, have low interferences with the selected CO2 absorption spectrum. Importantly, the frequencies of all selected transitions lie within the tuning range of commercial distributed feedback quantum cascade lasers (∼2 cm−1).
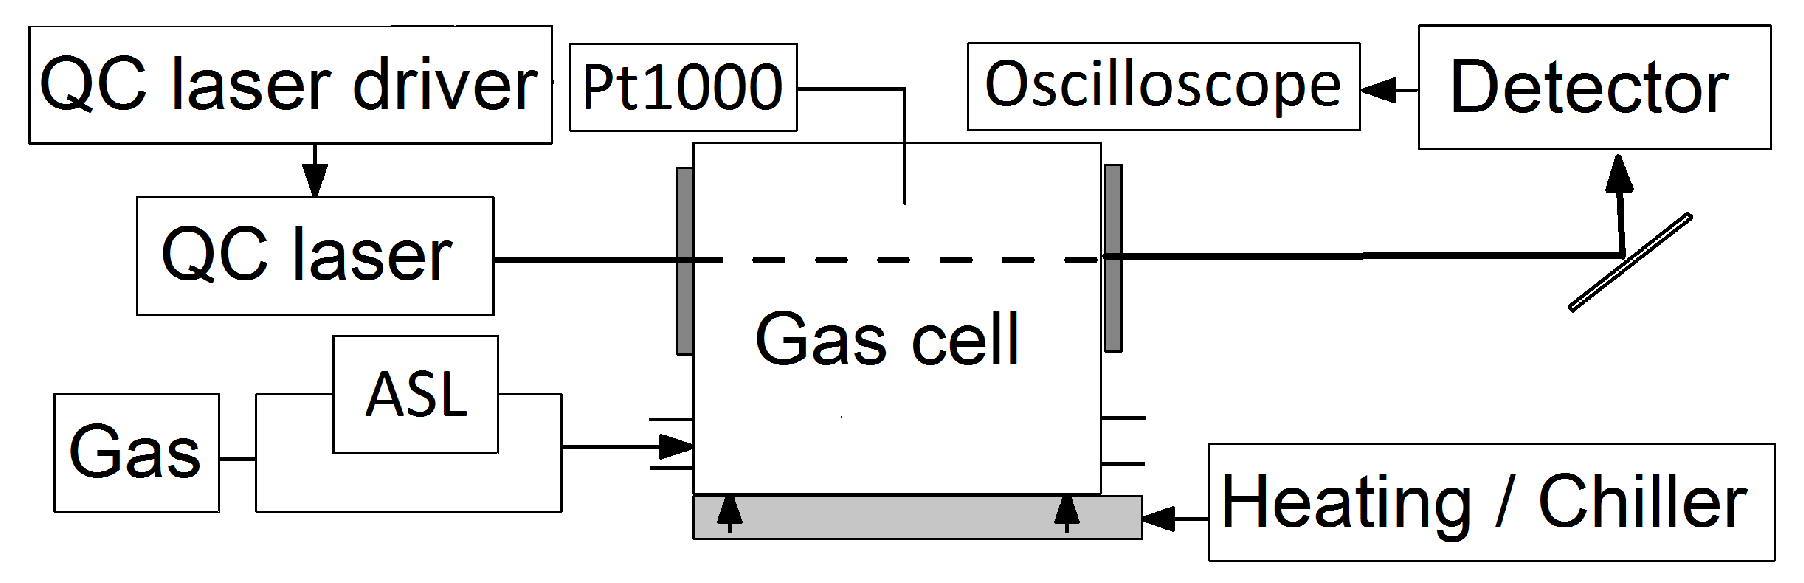
The fundamental scheme of the experimental setup is shown in
Figure 2. A pulsed distributed feedback Peltier-cooled QCL (Alpes lasers, #sb6804) with a frequency tuning range of about 2349.5–2353.4 cm
−1 and a nominal average power of ∼1 mW is used to probe the CO
2 vibrational–rotational transitions mentioned above. The laser is operated by a commercial QCL driver system (Q-MACS embedded, neoplas control GmbH, Greifswald, Germany).
The laser beam is collimated by a single-side anti-reflection-coated ZnSe lens and focused through a home-made heatable aluminum gas cell on a fast HgCdZnTe (MCT) detector (Q-MACS IRDM-1GA neoplas control GmbH, Vigo PVI-4TE-10.6×1-TO8 detector element, bandwidth 3–200 MHz, wedged BaF2 window). The gas cell comprises two 1 mm thick anti-reflection-coated sapphire windows and is equipped with a gas in- and outlet for loading with gas samples. The inner volume of the gas cell has a dimension of 8 × 188 × 48 mm3, where mm equals the laser beam path length in the gas cell. Heating is achieved by water conducted through pipes drilled in the housing of the gas cell and controlled by a thermostat (Julabo CF31). For reference temperature measurements, two Pt1000 sensors (class 1/3 DIN B) with an accuracy of K and a response time, , of ≤4 s are mounted close to the center of the gas cell. In the following, given Pt1000 values represent the mean value of these Pt1000 sensors.
Two different types of measurements were conducted: (i) “static” measurements, where the gas cell with loaded sample gas was closed and the gas temperature was regulated by the thermostat, and (ii) “dynamic” measurements, where the samples gas continuously flowed through the gas cell. For the latter, heating of the gas was achieved by an upstream metal foam electrical resistance heater and the gas flow was controlled by a computer programmed breath simulator (ASL 5000, Ingmar Medical Ltd., Pittsburgh, PA, USA). For both types of measurements, CO:N gas mixtures with CO mole fractions of 1.5, 3 or 5% (uncertainty: 5% relative) and pure N were used as sample and reference gas, respectively.
In order to record spectra, the thermal time-dependent frequency down-chirp of the QCL laser pulse is used (intrapulse mode, see, e.g., Refs. [
14,
16]). Unless noted otherwise, measurements were performed with a pulse width of 500 ns and 20 kHz pulse repetition rate. The detector signal was captured by a digital oscilloscope (Agilent InfiniVision DSO-X 3104A, bandwidth 1 GHz) and uploaded to the computer for synchronous data processing. As the data transfer rate to the computer was too low to capture the detector signal of each single laser pulse event, we have proceeded to an average of 512 sweeps for each recorded spectrum. In this way, spectral scans and, in turn, temperature measurements are obtained with a sampling rate of about 5–8 Hz. Measurements with shorter integration times will be briefly discussed at the end of this work.
3. Results and Discussion
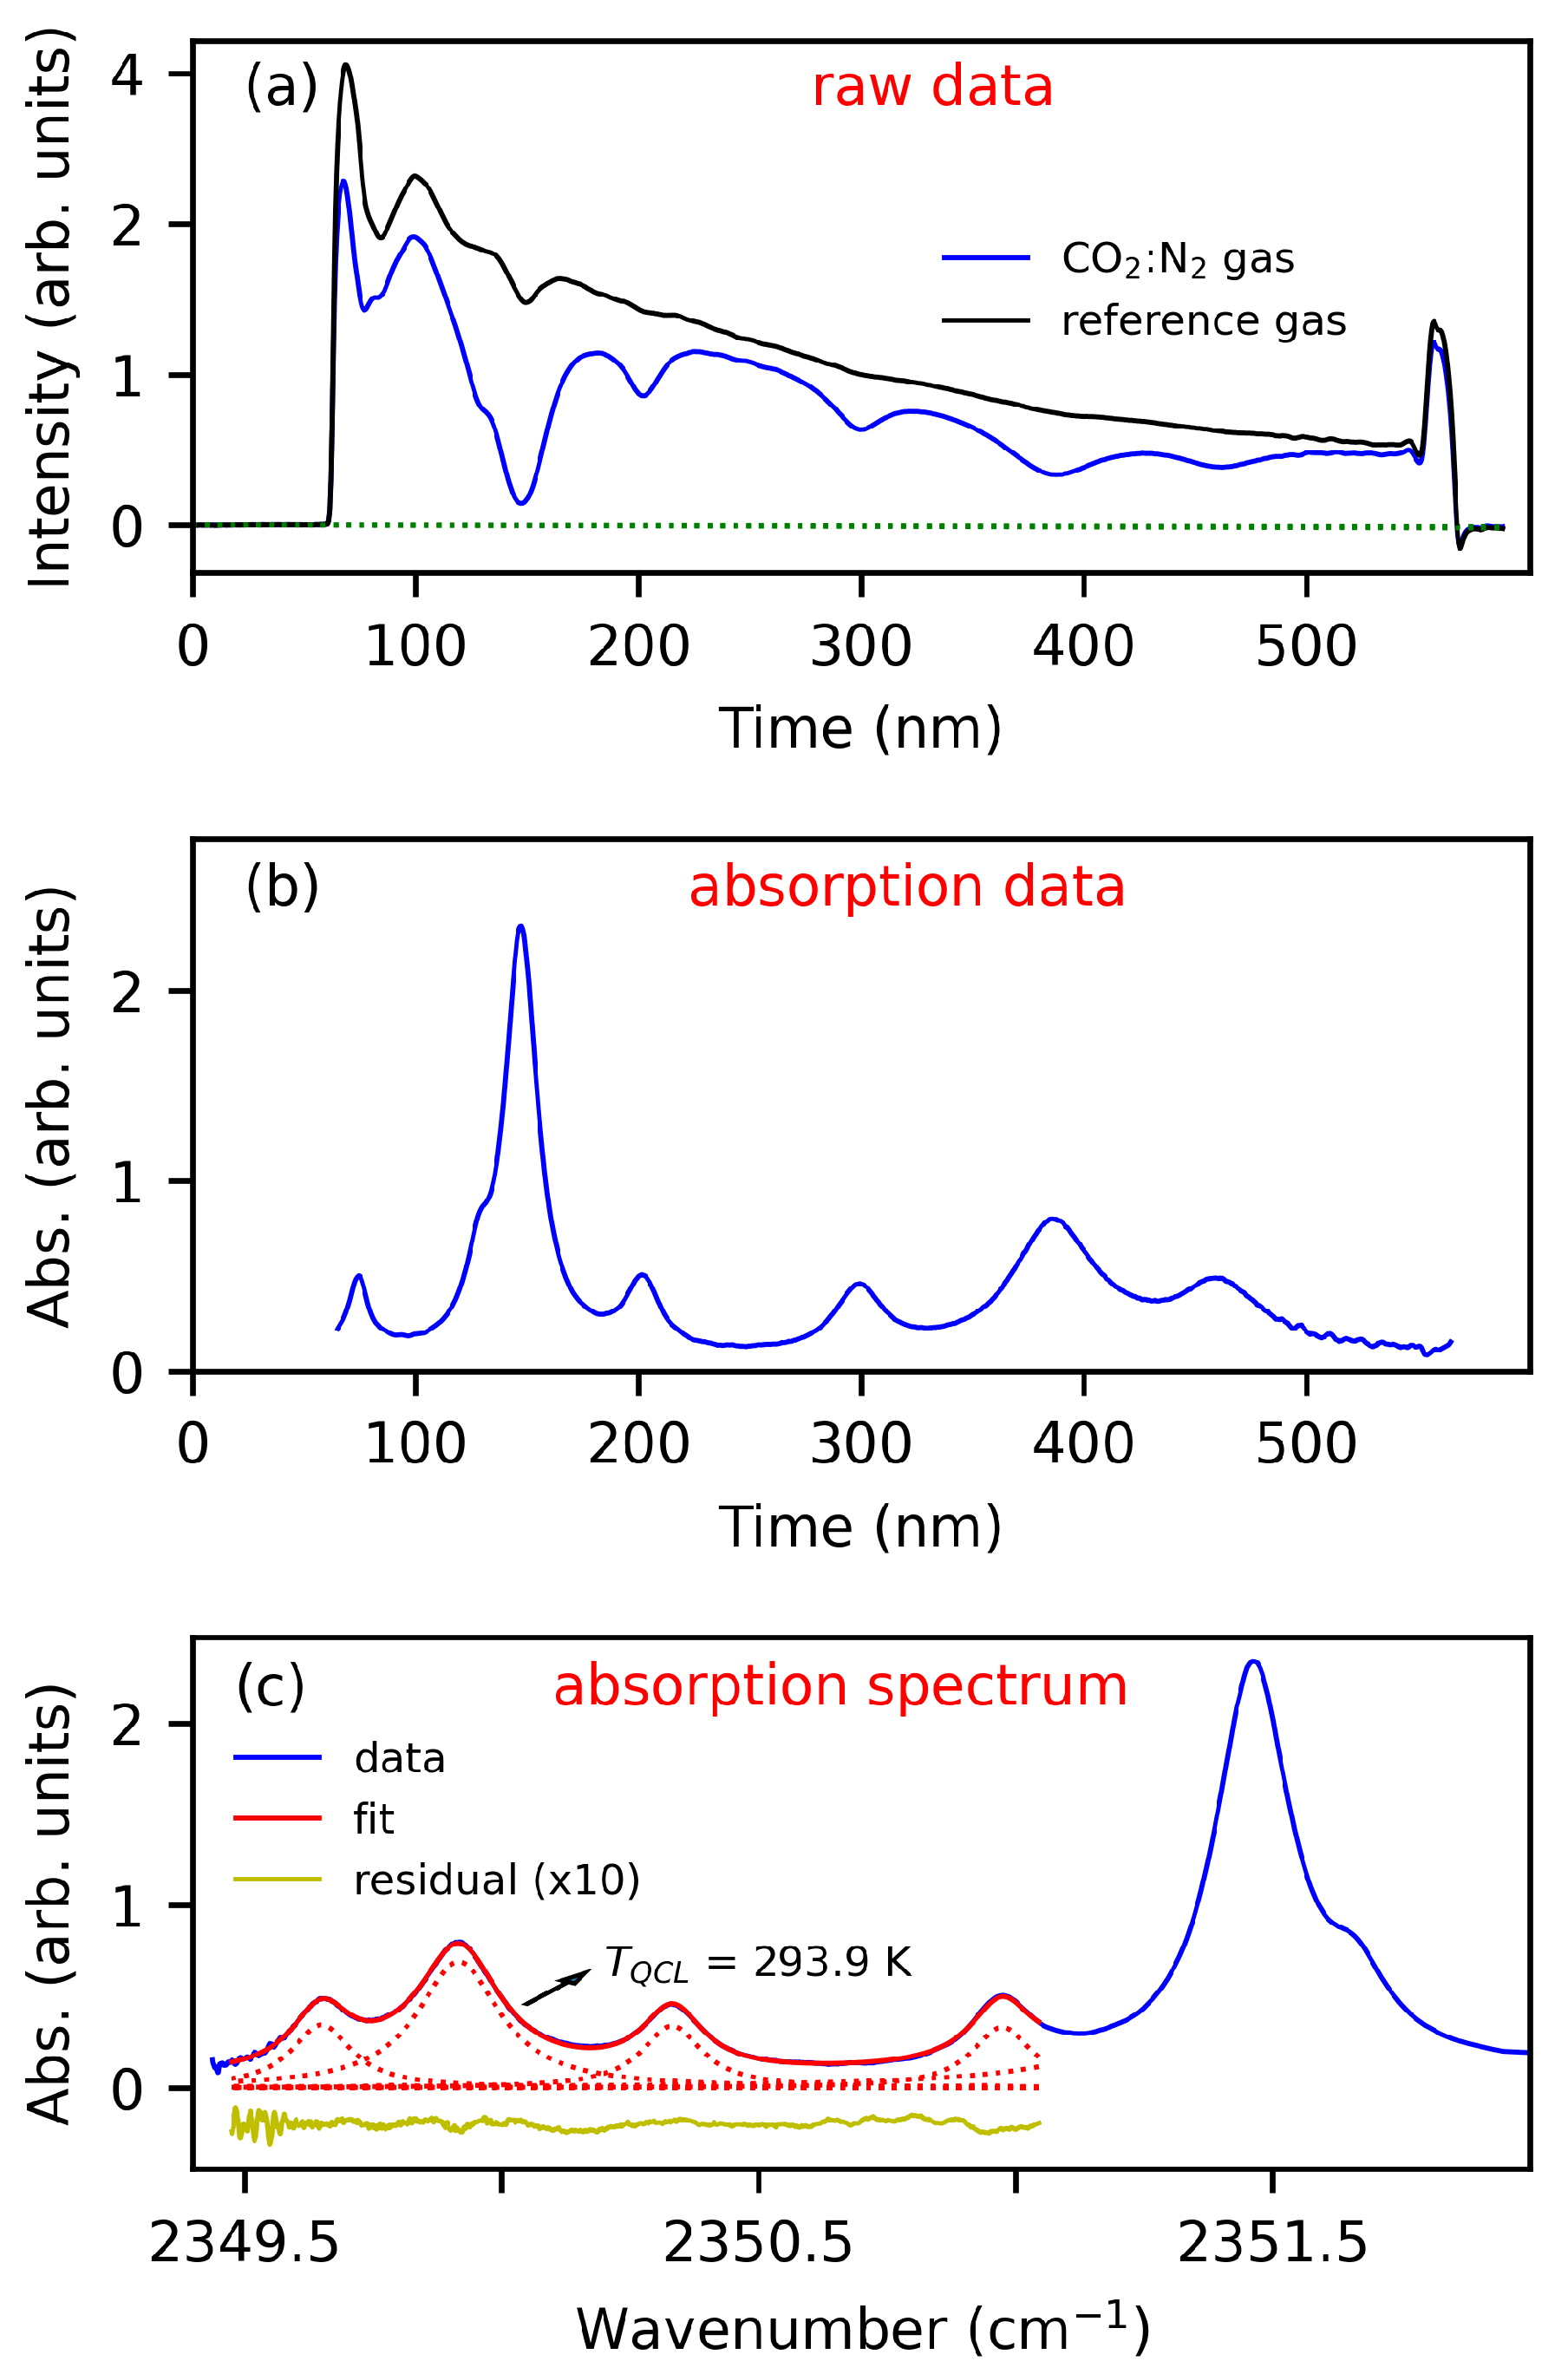
Figure 3a shows exemplary intensity spectra subsequently recorded on sample gas (
, blue) and reference gas (
, black).
From these two time domain spectra, the sample gas temperature and CO
concentration is obtained in a multi-step fitting algorithm, which is also illustrated in
Figure 3:
(i) Linear baseline correction of the measured sample gas and reference gas spectrum—see dotted green lines in section (a).
(ii) Calculation of absorption from the corrected sample gas and reference gas spectra and Beer-Lambert’s law, —see section (b).
(iii) Conversion of the absorption spectrum from time-domain to frequency-domain by a fourth-order polynomial—see blue curve in section (c). Note that the abscissae of time-domain and frequency-domain spectra are inverted as the laser experiences a frequency down chirp with pulse time. The coefficients of this polynomial are included as free parameters in the fitting routine. Initial guess values were obtained from comparison of CO peak positions in the absorption spectrum to the HITRAN database.
(iv) Fitting of the absorption spectrum using a Levenberg–Marquardt least-squares algorithm—see section (c) and the explanations below. The gas temperature and CO concentration are included in the fitting procedure as a free parameter. The best-fit values of these parameters represent the final value of the sensing technique, hereafter labeled as (“QCLAS temperature”) and .
The simulation of temperature-dependent absorption spectra in the fitting algorithm of step (iv) is based on Boltzmann statistics. The ratio
R of the integrated absorption coefficients of two single absorption lines is then given by,
where
and
are the spectral line intensity at a given temperature
and the lower-state energy of the transition
j, respectively, and have been taken from the HITRAN database [
15]. Terms from stimulated emission have been neglected here, which for our purposes is well justified for temperatures below 400 K. For the fitting procedure applied to the experimental absorption spectra in step (iv), several simplifying assumptions were made: (a) the shape of single absorption lines is fully Lorentzian, (b) peak positions of CO
absorption lines are fixed to its HITRAN values at standard conditions for temperature and pressure [
15], (c) the full width at half maximum (FWHM) of all CO
absorption lines is equal within the same class of transitions (fundamental or hot band transitions) and, thus, independent of the rotational states, and (d) only transitions with spectral line intensities
cm/molecule and line positions in the range 2347–2353 cm
are included in the fitting procedure. While these simplifications make the simulation and fitting process significantly more stable and efficient, induced systematic deviations are generally less than 0.2 K for all measurements discussed in the present work. Further, a parameter for an offset in the absorption spectrum was included in the fitting procedure in order to account for baseline variations in the experimental data. The presented algorithm has a total number of ten free parameters, representing the coefficients of frequency calibration from step (iii) (5 parameters), the offset in absorption spectrum (1), CO
gas concentration
(1), FWHMs of the fundamental and hot band transitions (2), and gas temperature
(1). The results of the fitting algorithm applied to the exemplary spectra from
Figure 3a are presented by the red solid line in
Figure 3c.
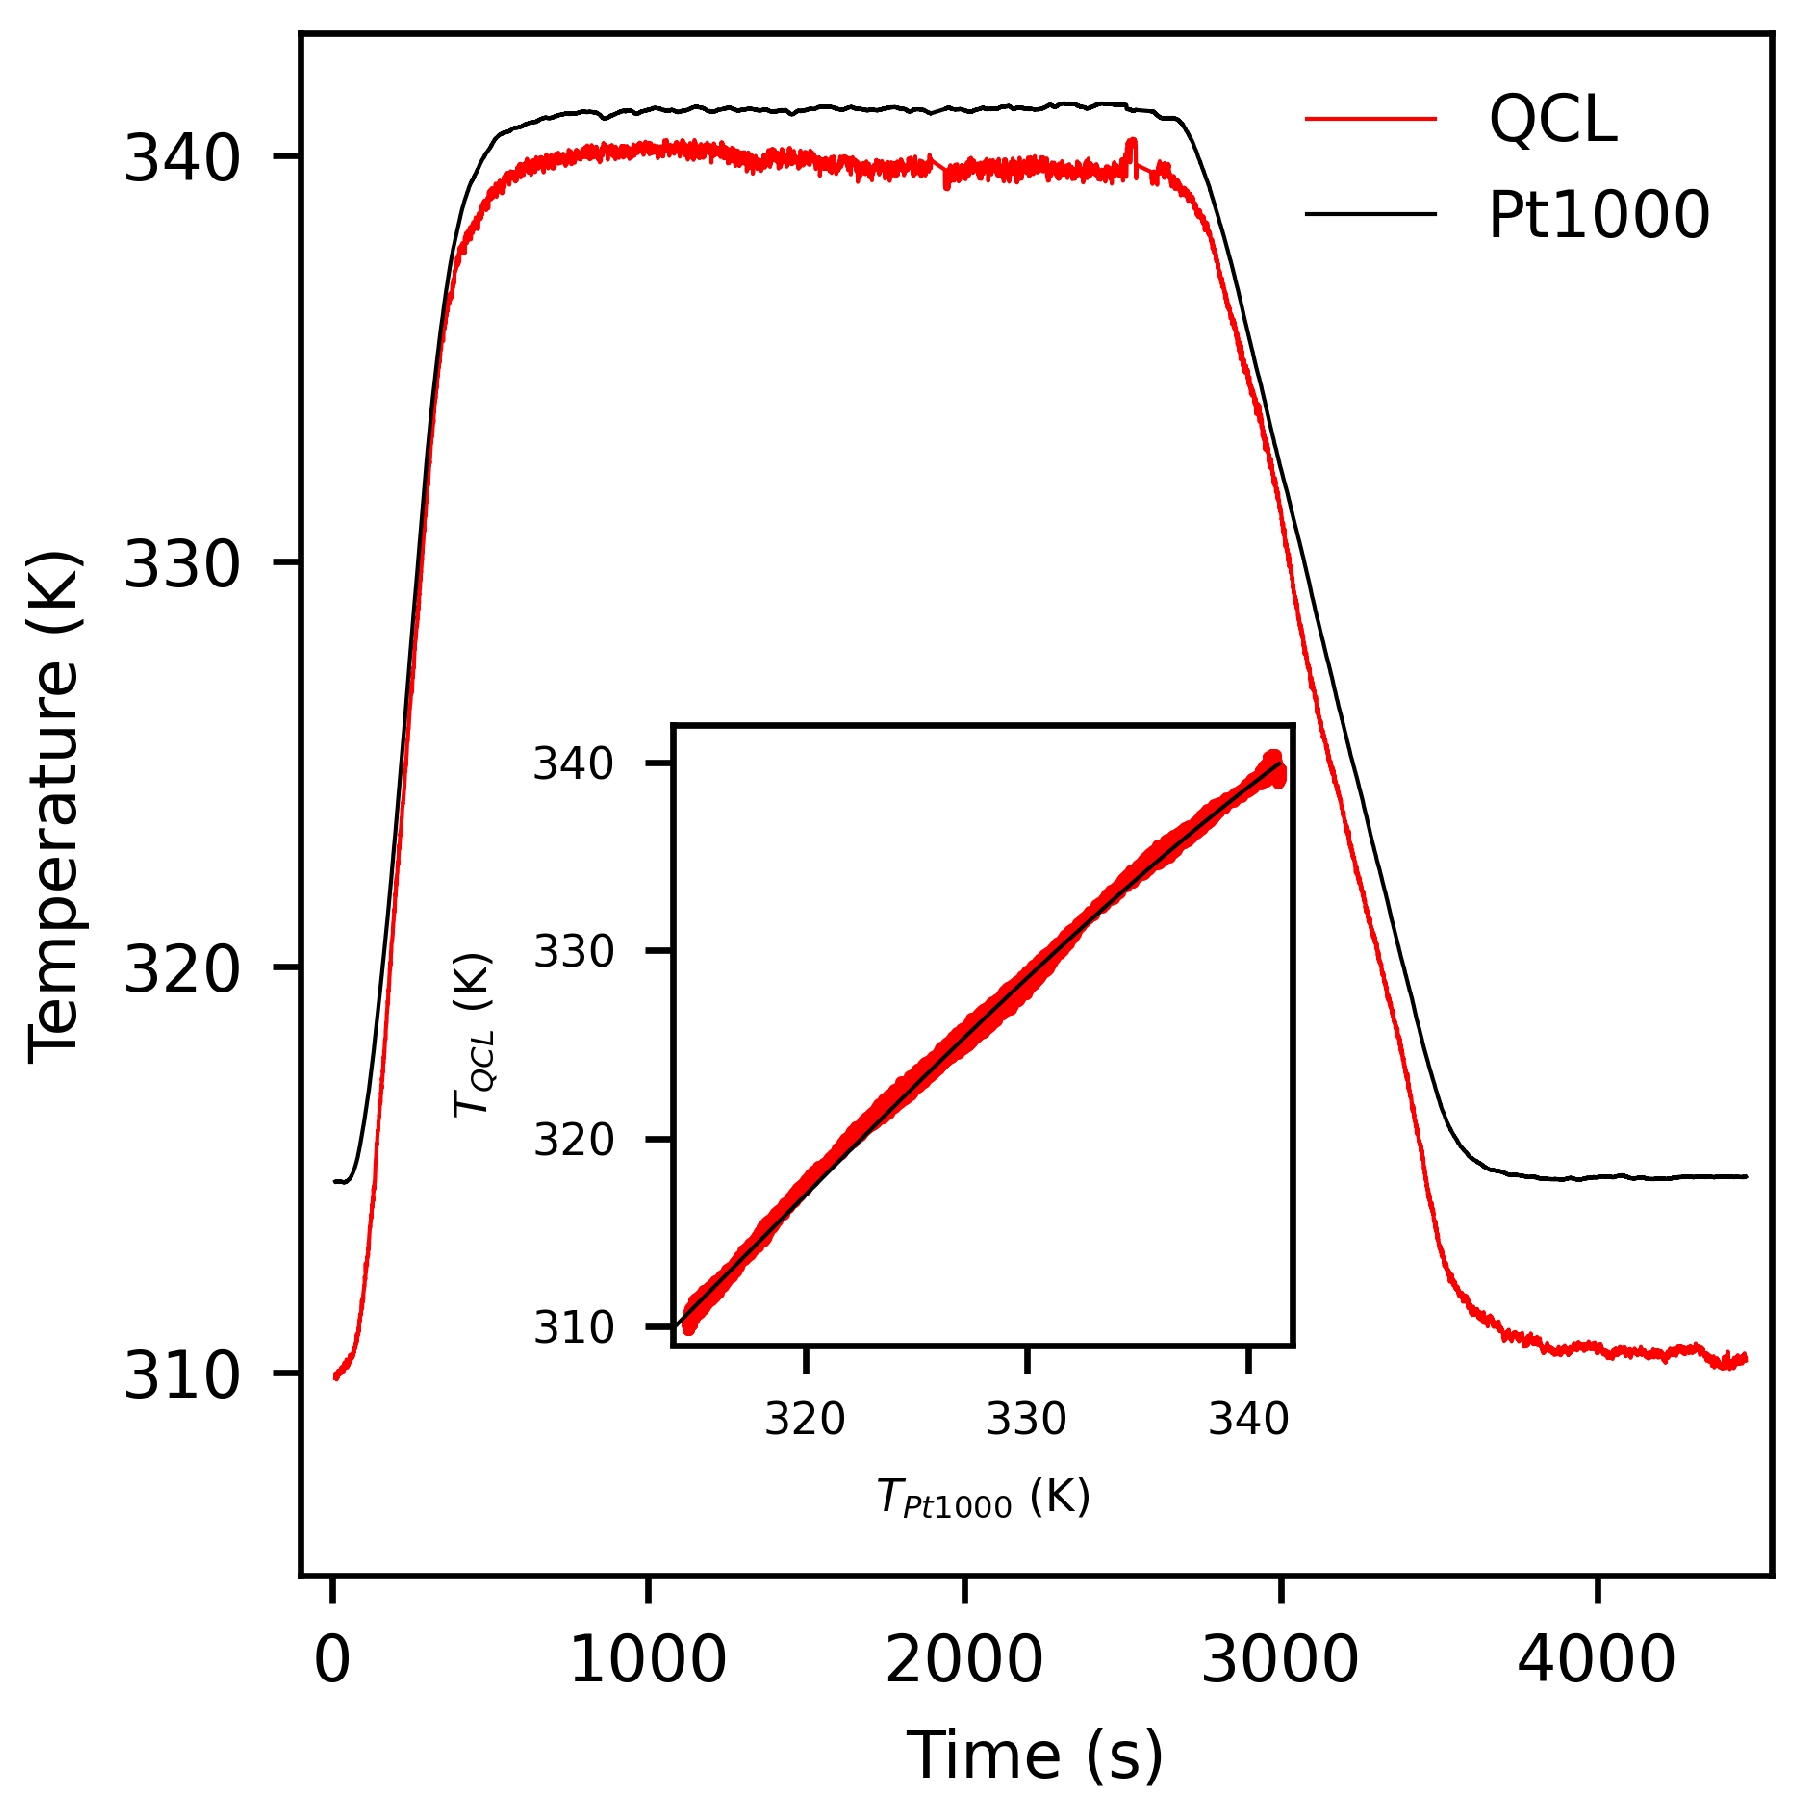
Figure 4 compares the results of our QCL-based temperature sensing technique with the Pt1000 sensor data (
) obtained on a representative “static” heating circle with 5% CO
sample gas.
Evidently, the QCLAS temperature values deviate significantly from the values measured with the Pt1000 device. The inset in
Figure 4 shows the correlation between
and
. As can be seen, the two signals are almost linearly related with slight contributions of quadratic order (best fit: black solid line). Some aspects have to be considered in order to explain the discrepancy between
and
: firstly, intrapulse QCL spectra are generally disturbed from their ideal behavior as a result of the instantaneous QCL laser line width as well as the limited electronic bandwidth of the detection system [
17,
18]. The magnitude of this effect is directly correlated with the down chirp rate of the QCL. Since the chirp rate decreases toward the end of the laser pulse, absorption spectra are less disturbed in the low frequency range. For our measurements, we indeed find that spectra are affected by the detector system response and thus
strongly depends on the choice of pulse section, where the fitting algorithm should be applied. Limiting the fitting section to a small range at the end of the pulse will generally result in a higher accuracy of
, however, at the cost of statistical certainty. Secondly, uncertainties in spectroscopic parameters used to calculate the temperature from Equation (
1) may lead to systematic errors in
. The line-strength parameter
have a stated minimum uncertainty of 20%, whereas the uncertainty in the lower-state energies
is not given [
15]. The correlation between
and
given in
Figure 4 is, within the accuracy of our measurement, independent of the sample and day-to-day variances and thus can be used as an inherent calibration in order to correct for the above-mentioned systematic errors in
.
A further issue to be considered is non-uniform temperature fields in the gas cell. Given that the QCL spectra are line-of-sight measurements,
inherently represents an averaged temperature with contributions from the center and the boundary area of the gas cell, while
probes the temperature at a rather localized position close to its center with a slow response to temperature variations. The discrepancy between
and
is particularly strong for strongly non-static conditions, as seen for instance in the heat-up and cool-down processes from
Figure 4. This finding supports the conclusion that temperature gradients in the gas cell contribute to offsets between
and
.
The
data are also subjected to low-frequency drift variations of <1 K (see, e.g., the time range 3800–4200 s in
Figure 4). An Allan-variance analysis of our data (not shown) reveals that drift effects become more dominant than white or 1/f noise for time constants higher than about 10 s. We found that this system drift is predominantly caused by two phenomena: variations in pulse characteristics due to thermal or electronic drifts of the quantum cascade laser (pulse drift noise) and interference due to internal reflections of the laser beam at optical components. The former case generally leads to both, instabilities in intensity and shifts in the frequency scale of the absorption spectra, while the latter case leads to unstable periodic fringes. Pulse drift noise is often encountered in QCL spectroscopy and may be widely avoided when a dual-beam setup with permanent sample and reference measurement is used. The interference from internal reflections most presumably originate from the collimating ZnSe lens and/or the BaF
detector window and may be reduced by more sophisticated anti-reflection coating design.
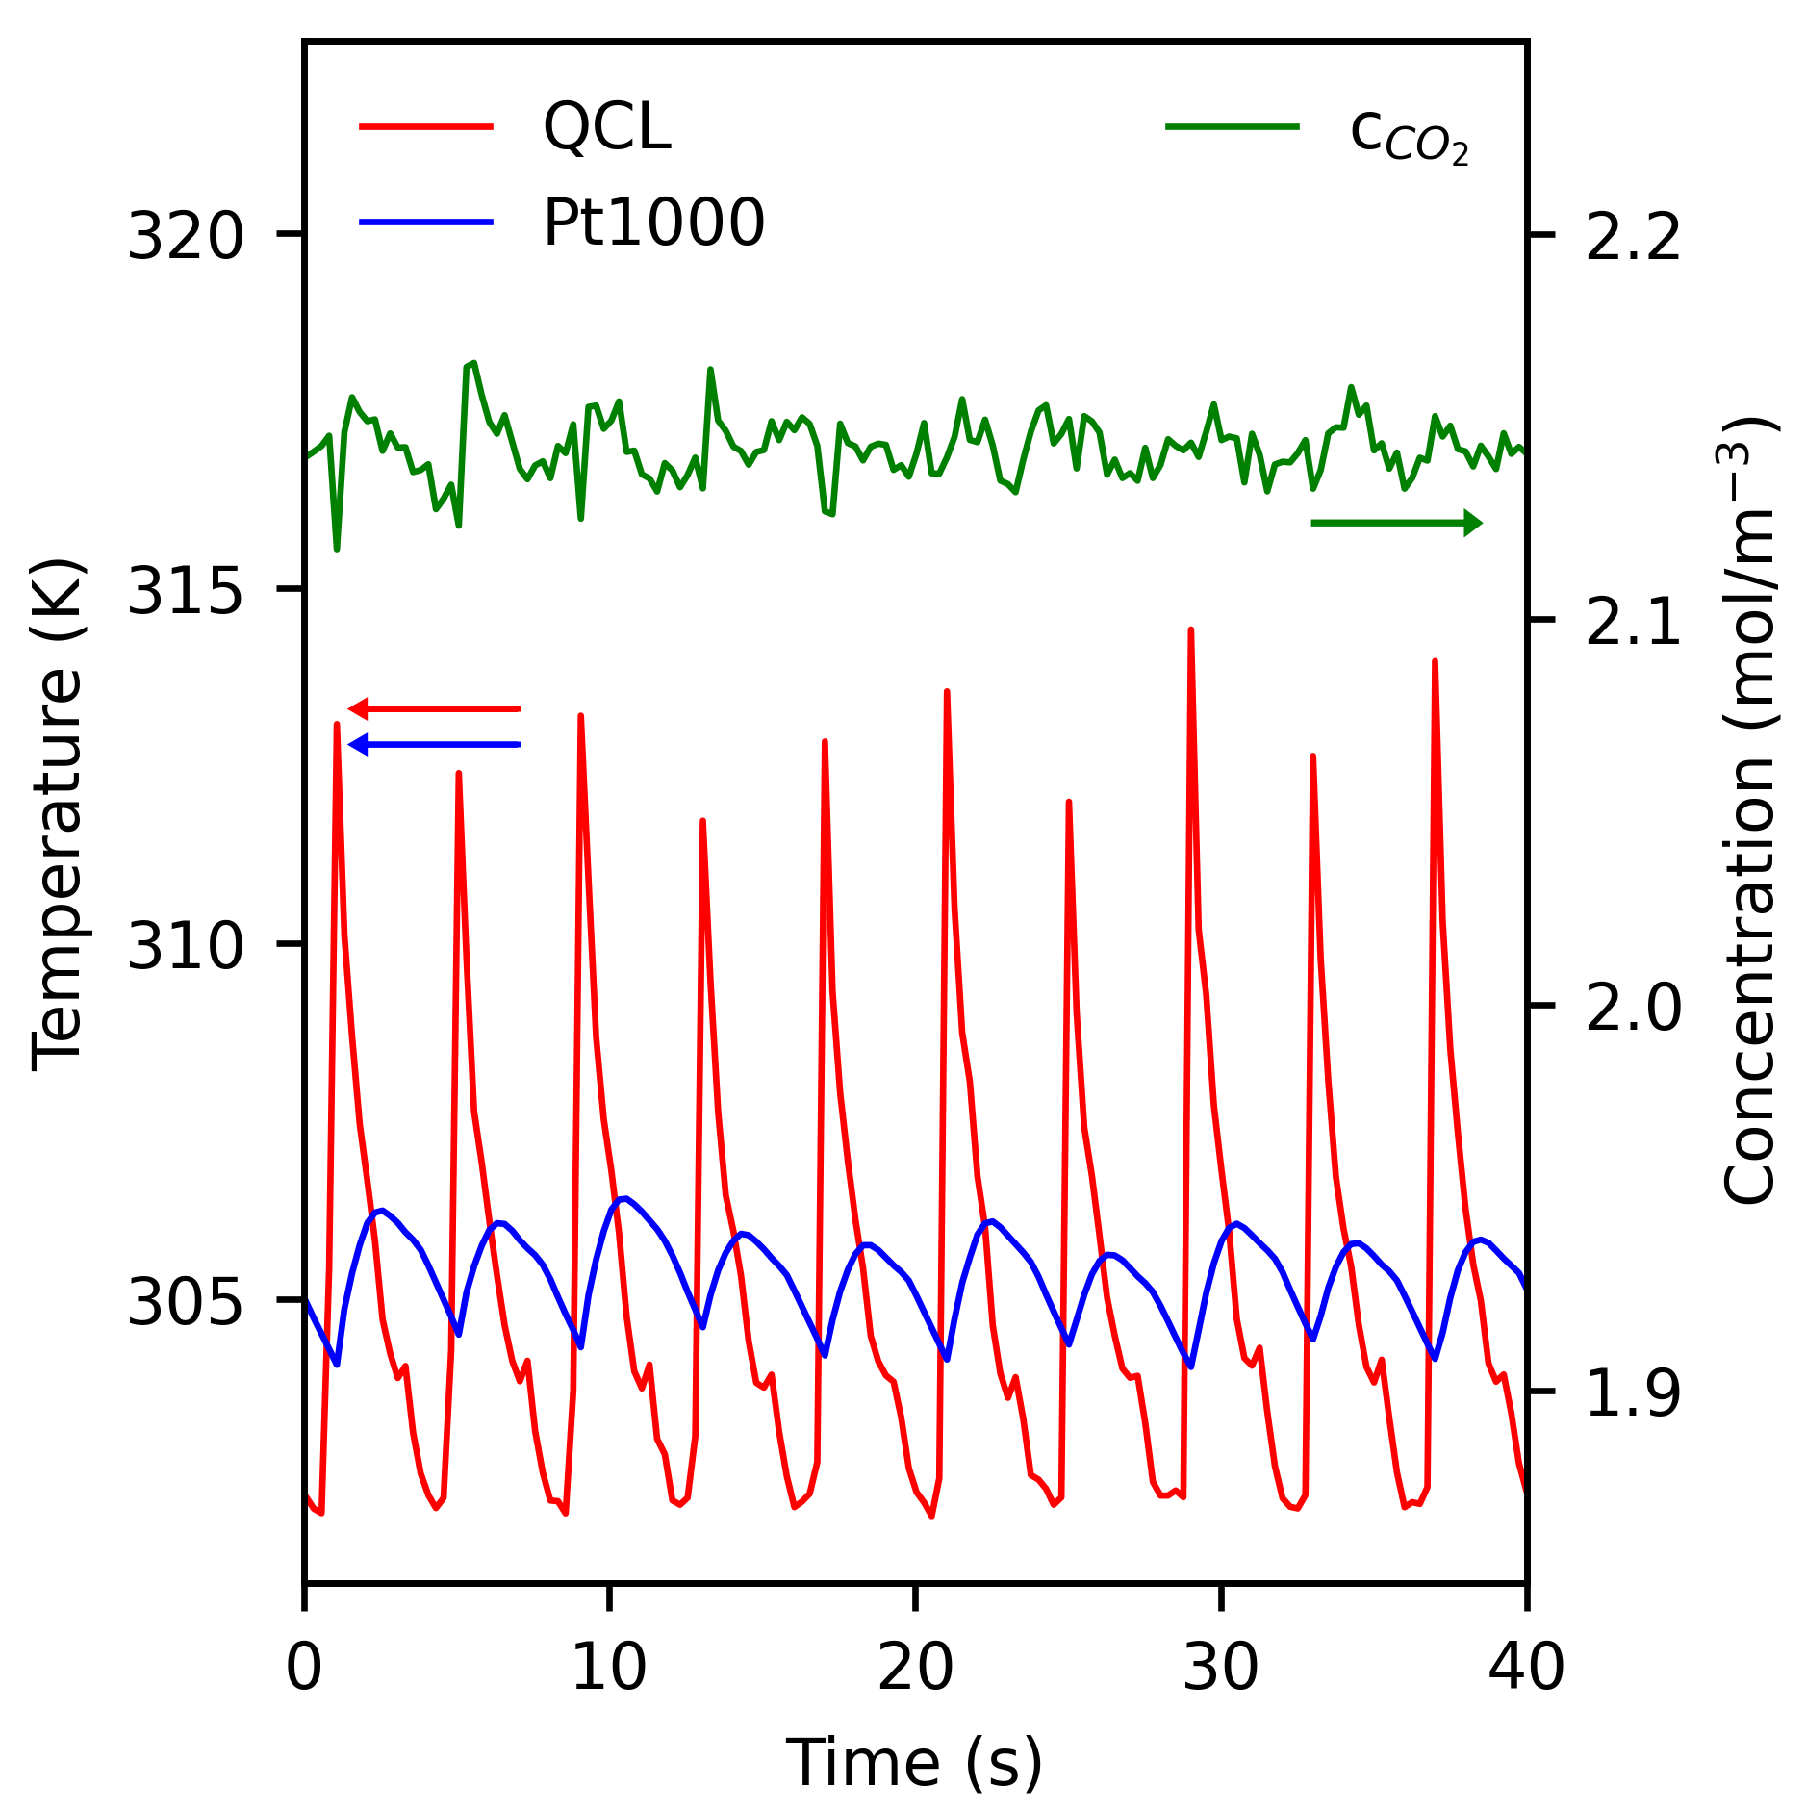
Two of the key properties of QCL based devices is exceptional short response time and high time resolution. For our setup, these benefits can be demonstrated for measurements where the process under study occurs on a time-scale shorter than the time constant of system drift. As an example, we discuss “dynamic” measurements on simulated breath flow.
Figure 5 shows representative results obtained on measurements with 5% CO
sample gas. The QCLAS and Pt1000 temperatures show a distinctively different behavior which can be consistently explained by their different capabilities to resolve short-time processes. Evidently, the breath-circle related temperature variations can be clearly resolved by our chirped QCL technique. On the contrary, the Pt1000 temperature data are affected by a significantly slower response-time as a result of inherent thermal inertia. Notably, the small temperature hop seen in the
data in periods of decreasing temperature at about 304 K is caused by an inherent mechanism in the breath simulator device and can also not be resolved by the Pt1000 sensor.
Figure 5 also shows the CO
concentration obtained by the presented QCL technique. A mean concentration of
mol/m
is obtained, which corresponds to a volume fraction of ∼4.8% if a behavior according to the ideal gas law is assumed. Importantly, the CO
concentration determined is independent of the actual gas temperature although the CO
transitions probed by our setup are highly temperature-sensitive. This result demonstrates that the method can also effectively be used as a temperature-insensitive probe of the CO
concentration.
In the presented measurements, the sampling rate of our QCL technique was deliberately set to about 6 Hz in order to allow for simultaneous data transfer, storage and analysis. The fundamental upper limit for the sampling rate, however, is given by the maximum repetition rate of the pulsed QCL. The results of preliminary single-pulse measurements (no averaging) with similar experimental conditions to the ones from
Figure 3 and
Figure 4 indicate that the temperature noise is dominantly affected by electronic noise of the detector system. For these single-pulse measurements, we obtain a statistical uncertainty in
of about 1 K.
The strength of the QCL method presented is in situ sensing on systems with highly dynamic temporal temperature variations on time scales of about milliseconds to seconds that are too fast to be resolved by conventional temperature sensors and/or lead to strongly inhomogeneous temperature fields. Previous works towards the application of mid-IR QCLs as temperature sensors have focused on gases at elevated temperatures in plasma and combustion processes. These studies include, for instance, the intrapulse measurements on CH
and NO-admixed air plasma performed by van Helden et al. [
19] and Hübner [
20], respectively. Chrystie et al. applied an intrapulse operated QCL to achieve highly time-resolved temperature measurements on CO molecules in shock tubes at typical combustion temperatures (800−2500 K) and pressures (1−3 atm) [
21]. This study reports a precision (1
) of 0.9% for the measured temperature at an effective sampling rate of 1 MHz. Vanderover et al. [
22], Uddi et al. [
23] and Spearrin et al. [
8,
9] used continuous-wave QCLs to probe the temperature in systems of CO, H
2O, and CO
2, respectively. Contrarily to these and several other works related to high-temperature gas environments, reports on fast measurements in the room temperature range are scarce [
20]. The QCL method discussed may help to meet growing demands for such measurements in fields like breath gas analysis [
3] and biomedical diagnostics [
24], online car exhaust monitoring [
25], atmospheric research [
26], the detection of explosives [
27], process control in pharmaceutical industry, or food processing technology.
Another important application example is the characterization of the change in gas temperature with respect to the refractometry used for a new density-based realization of the Pascal which is currently in the focus of the industrial and metrological communities in cause of the redefined SI units (see, e.g., Ref. [
28]). Here, gas temperatures are essential and vary due to thermodynamic effects (
pV-work). Recent simulations revealed a design-dependent heating of the gas by more than 50 K followed by a decay with sub-second time constants [
29]. The presented QCLAS technique is ideal for validating these simulations due to its non-invasive character and excellent time resolution.


 ,
, 