Article

Analysis on Flow and Temperature Field of High-Power Magnetorheological Fluid Transmission Device

1
School of Mechanical and Electrical Engineering, Xuzhou University of Technology, Xuzhou 221018, China
2
School of Mechatronic Engineering, China University of Mining and Technology, Xuzhou 221116, China
*
Authors to whom correspondence should be addressed.
Appl. Sci. 2022, 12(10), 5044; https://doi.org/10.3390/app12105044
Submission received: 6 April 2022 / Revised: 11 May 2022 / Accepted: 16 May 2022 / Published: 17 May 2022

Abstract

:
Aiming to solve the problem of high-power magnetorheological fluid transmission heat dissipation, a new type of magnetorheological fluid drive disk is designed. The characteristics of the flow field and temperature field of high power MR fluid transmission devices are analyzed. Meanwhile, the influence of factors, such as rotating speed, inlet velocity, inlet position, diameter and number of magnetic columns, on the flow field are also investigated. Furthermore, the distribution characteristics of the ultimate slip power and the transient temperature field are obtained. The experimental platform of an MR fluid transmission device was established, and the torque transfer performance and heat dissipation performance were tested. The experimental results show that the device has good heat dissipation performance and can transfer high-power torque.

1. Introduction

Magnetorheological (MR) fluid is a novel type of intelligent material [1,2,3]. MR fluid is composed of soft magnetic particles, carrier fluid and additives [4,5,6,7]. The rheological effect of MR fluid is that it can flow freely without a magnetic field. Under the action of a magnetic field, MR fluid is solidified and can transfer a certain shear force [8,9,10,11]. MR fluid is characterized by a fast response, simple control and strong anti-interference ability [12,13,14,15]. MR transmission technology with MR fluid as a working medium has broad application prospects in the soft start, soft brake and step-less speed regulation of mechanical equipment [16,17,18,19].
An MR transmission device will generate a lot of heat due to wall slip during operation, resulting in the fact that its maximum transmission power is usually restricted by heat dissipating performance. Scholars have carried out a lot of research to investigate the effect of temperature on the transmission characteristics of MR devices and improve the heat dissipation performance of the MR transmission devices.
Weiss et al. [20] found that when the temperature increases from −40 °C to 150 °C, the dynamic yield stress and viscosity resistance of MR fluids decrease by 10% and 95%, respectively. Gordaninejad et al. [21] established a thermal analysis model of MR Damper, and tested the relationship between temperature and damping force. Results show that the damping force decreases sharply with the increase in temperature. Through experimental studies, Wiehe et al. [22] found that the increase in temperature had a negative impact on the durability of MR fluids, which would lead to significant attenuation of transmission torque. Wang et al. [23] proposed a multidisk MR fluid actuator. Simulation and experiment results show that the temperature of MR fluid increases linearly with the time in the slip and loaded states, and the greater the slip power is, the faster the temperature rises. Chen et al. [24] studied the influence of temperature on the properties of MR fluid, and the experiment showed that shear yield stress decreased with the increase in temperature. Francesco et al. [25] investigated the effect of temperature on the torque transmission characteristics of an MR experimentally. Results show that compared to 20 °C, the transmitted torque was reduced by about 20% at 80 °C. Tian et al. [26] investigated the influence of temperature on the stability of torque transmission by MR fluid. Yang et al. [27] formulated a theoretical model for slip differential heat between two neighboring particles of MRFs in shear and squeeze modes. The proposed model can satisfactorily describe the main micro-characteristics of the slip differential heat of MRFs in shear and squeeze modes. Ashok et al. [28] investigated the temperature effect of MR fluid on performance while the damper is working. Results show that the saturation magnetization of the particles was reduced by 57% at higher temperatures (127 °C). Wang et al. [29] analyzed the heating and cooling mechanism of an MR clutch and proposed an auxiliary clutch cooling liquid cooling method. The results show that the increase in temperature leads to the decrease in viscous torque and total output torque. Huang et al. [30] put forward the method of internal circulation cooling. The coolant can rotate with the rotating sleeve, and the coolant can further flow into the brake near the MR fluid, thereby achieving an improved cooling effect. Du et al. [31] chose to add an aluminum foil bubble insulation material with a low thermal conductivity in the cavity between the electromagnetic coil and the MRF to avoid rapid temperature rise. Results show that the rate of increase in the MRF temperature in the working area of the damper with the insulation material could be reduced by 57.4%.
Most of these studies focus on the influence of temperature rise on MR fluid transmission performance, but there is still no effective method for heat dissipation of MRF transmission under high-power conditions. Therefore, it is an urgent problem to find an effective heat dissipation method for the application of high-power and high-torque magnetorheological transmission.
In this paper, a novel high-torque MR fluid transmission device with hollow discs and magnetic conductive columns adopted for heat dissipation is designed to address the challenging heat dissipation issue. The fluid-temperature coupling characteristics of the MR transmission device have been simulated by using ANSYS-CFX software. Besides, the influence of temperature on the transmission torque of MR transmission devices has been studied on an experimental platform. The simulation and experimental results can provide a reference for the popularization and application of high-power MR fluid transmission devices.

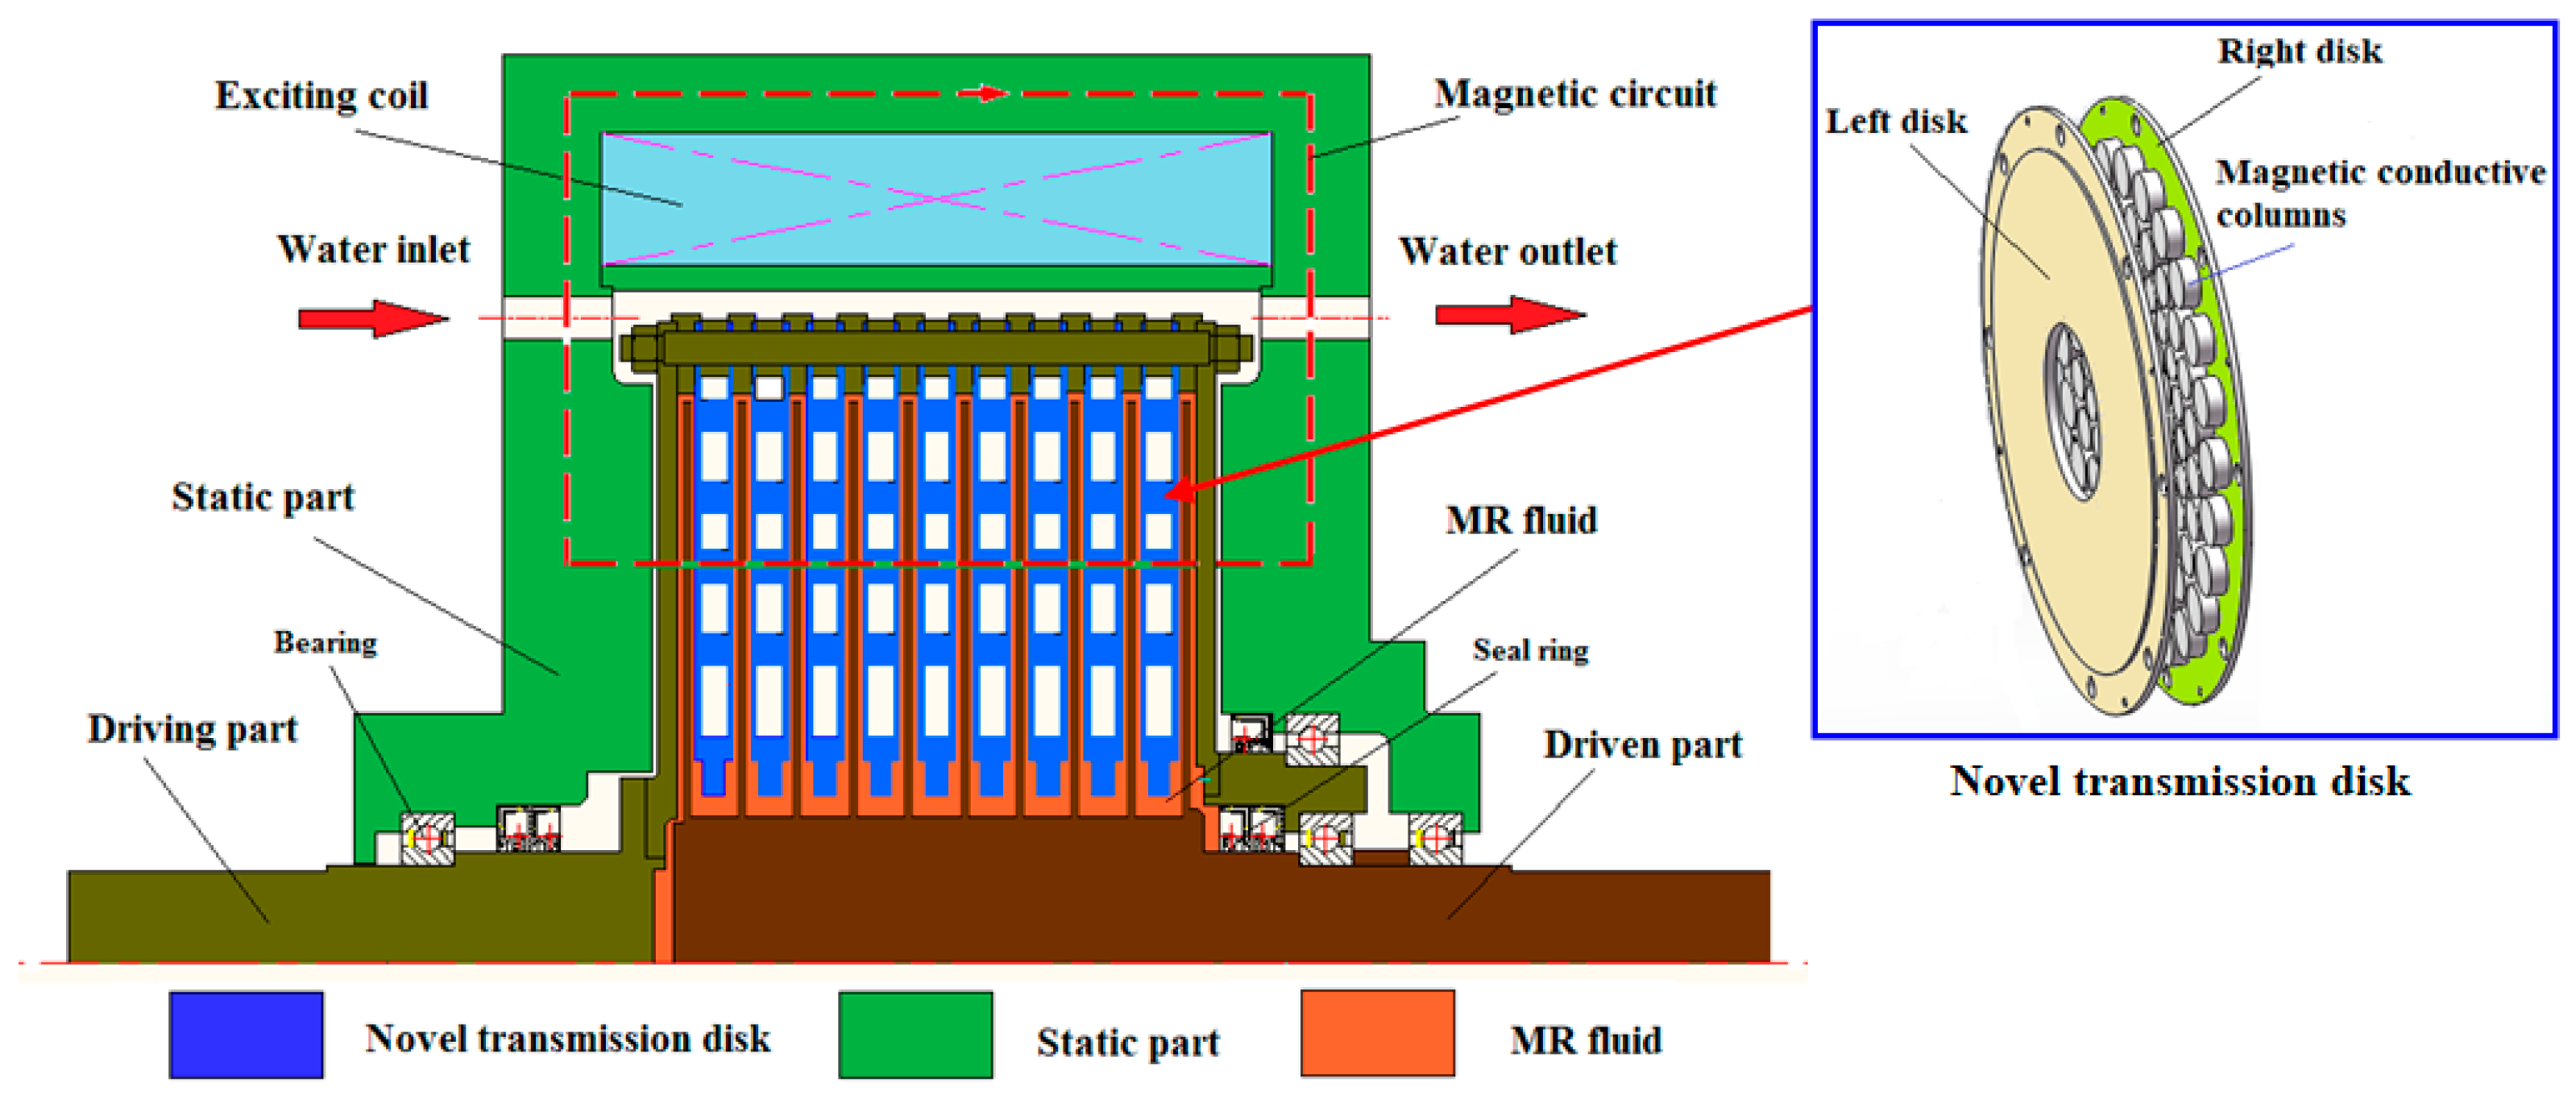
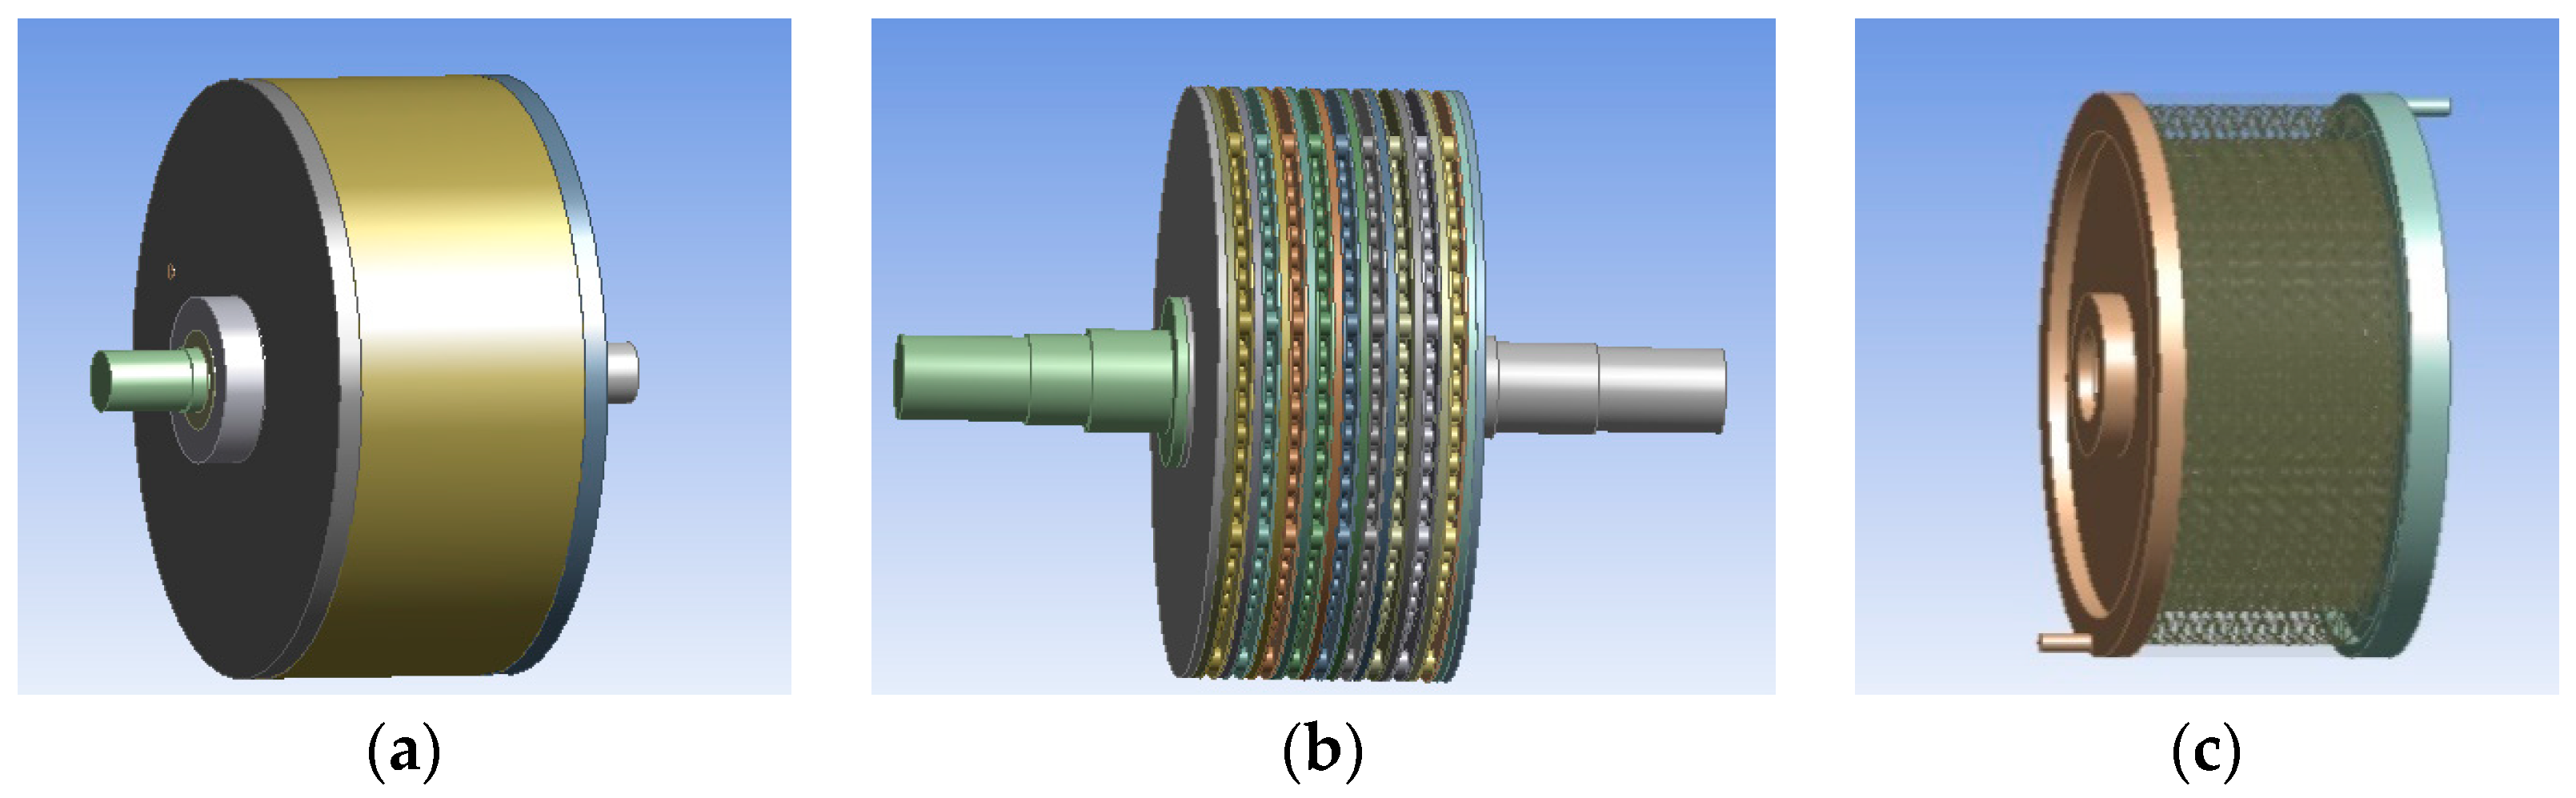
2. Design of MR Fluid Transmission Model
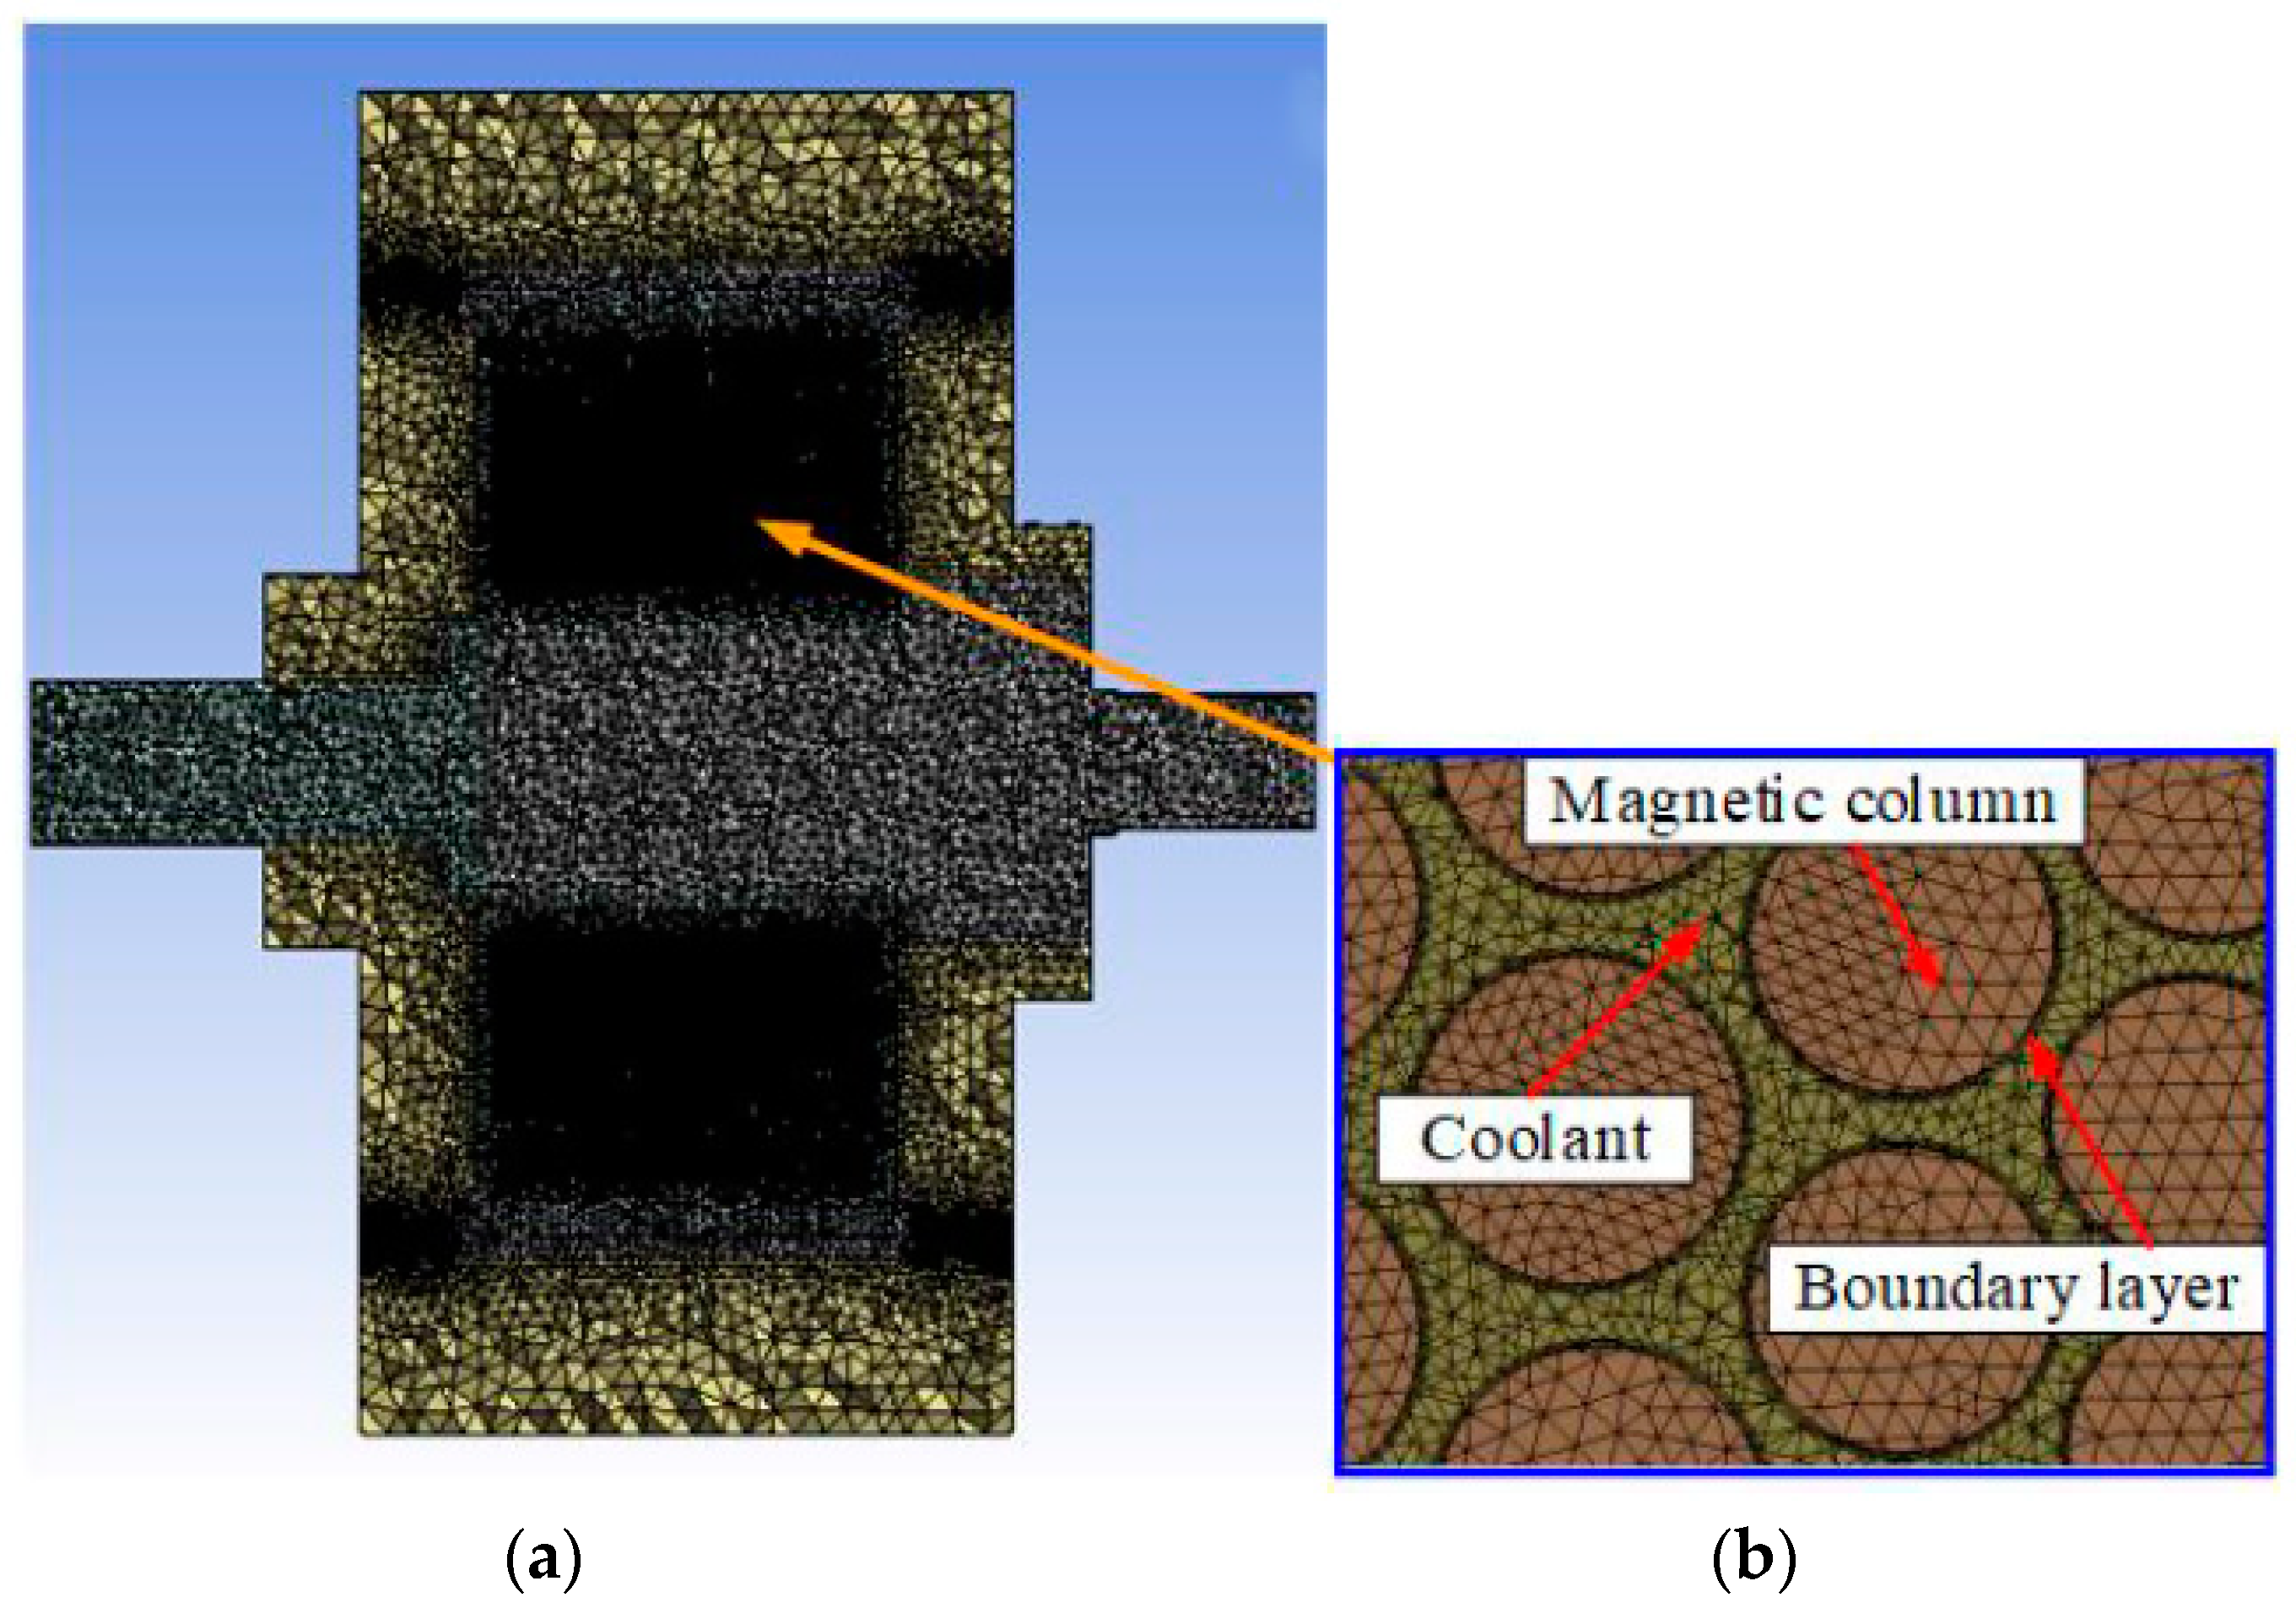
The main heat generation reason for the MR fluid transmission device is that the MR fluid slips and generates heat, which is mainly distributed in the transmission disc. The high-power MR fluid transmission device adopts a multi-disc transmission structure, as shown in Figure 1. A group of strong magnetic conductivity columns is arranged in the transmission disk, and the coolant is filled with a hollow area, so as to realize rapid heat dissipation of the device during operation. It is necessary to analyze the flow field and temperature field in order to obtain the heat dissipation effect and its influencing factors, and the analysis model is also established, as shown in Figure 2. Where Figure 2a is the whole model of the device, Figure 2b is the rotating domain, and Figure 2c is the coolant fluid domain.

3. Meshing

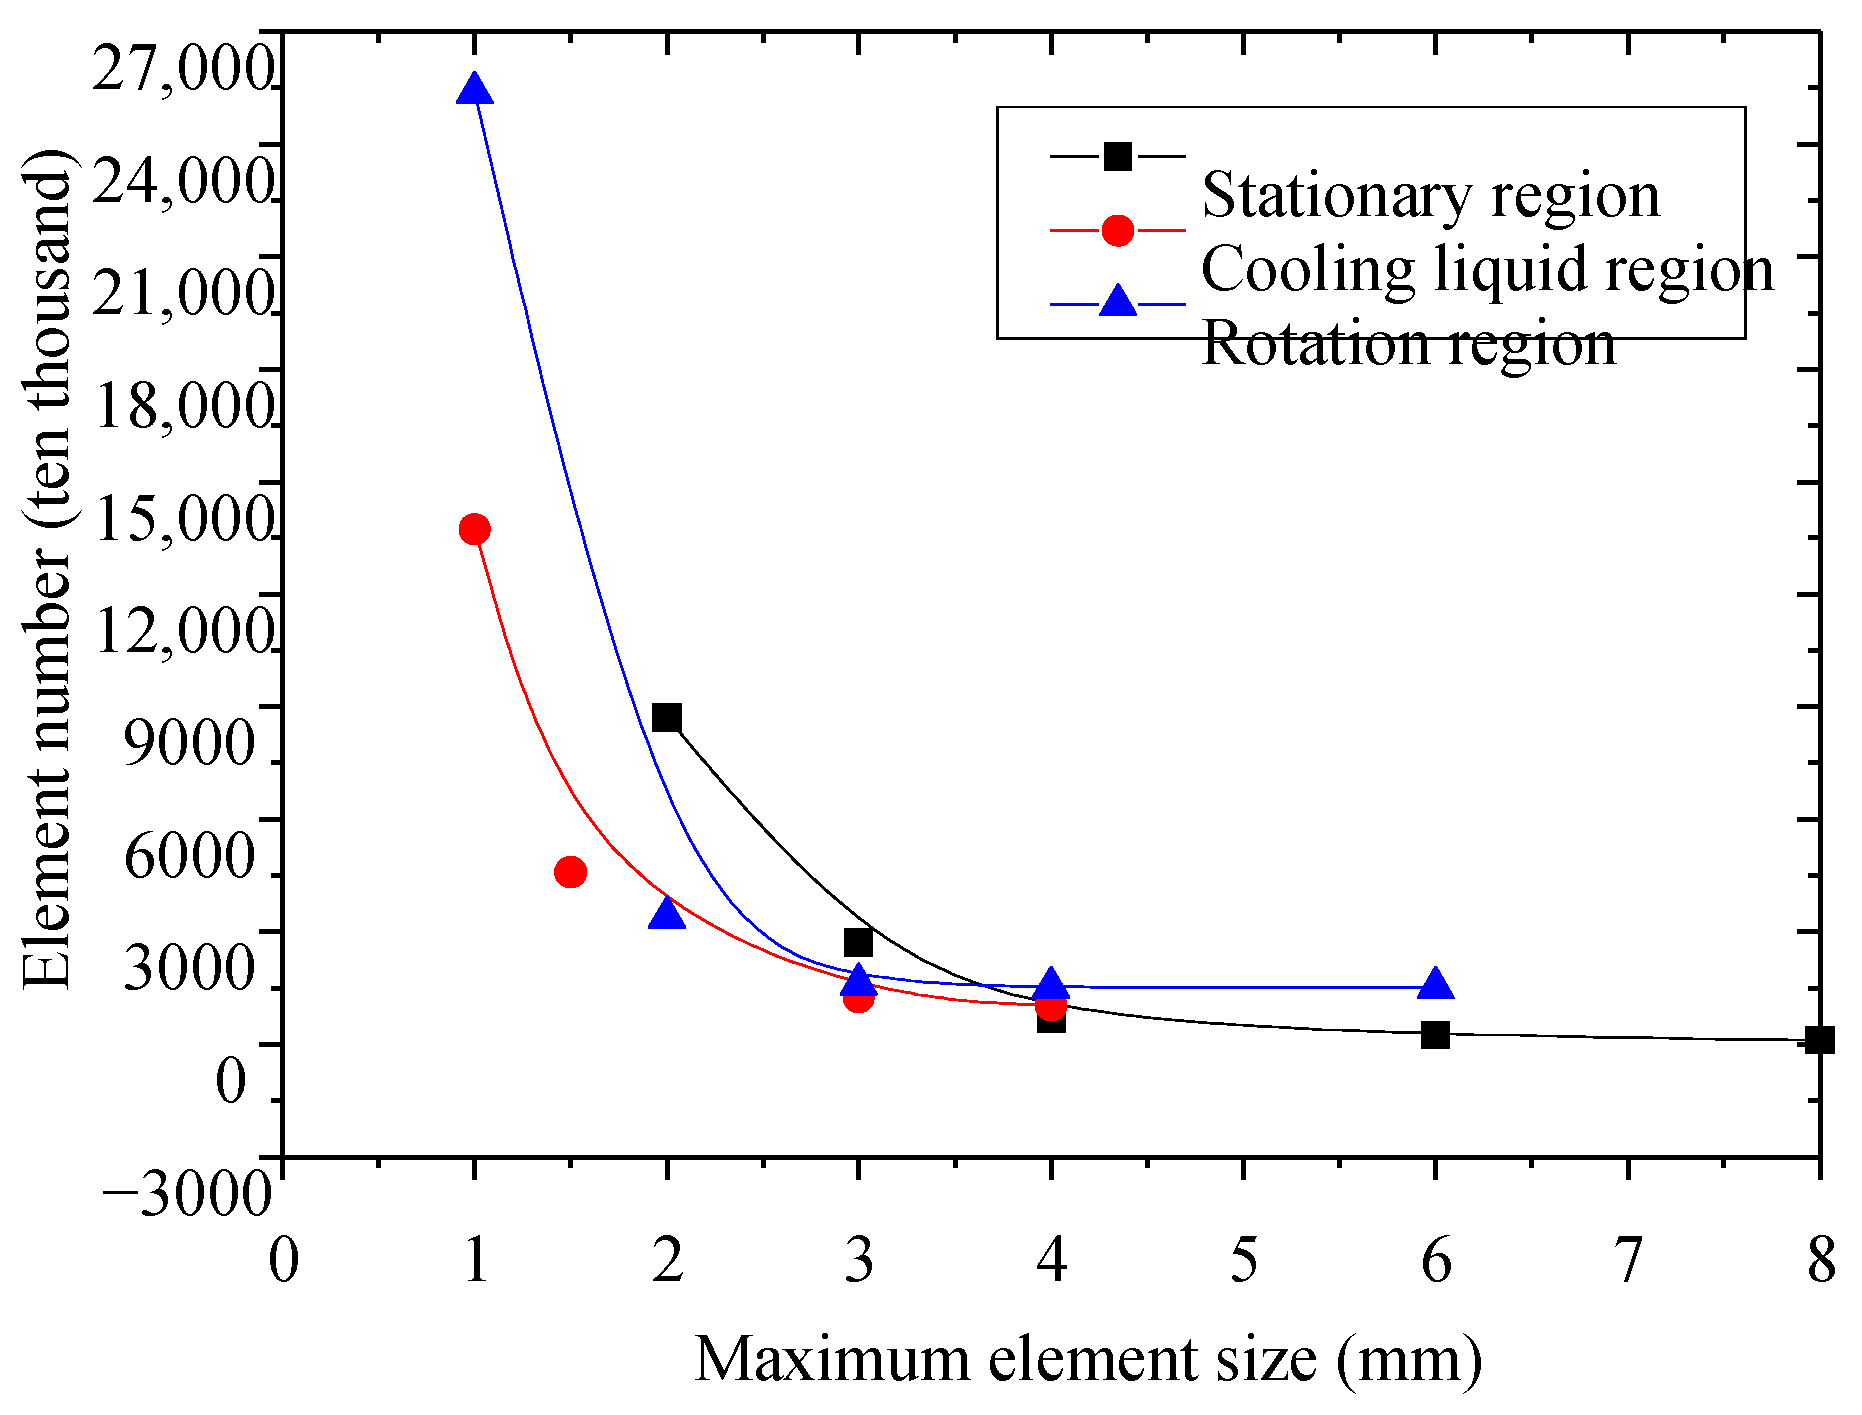
3.1. Meshing Parameters Setting

It is important to set reasonable meshing parameters for an MR transmission device, which can lead to more accurate and efficient analysis. Generally speaking, denser meshes can result in higher calculating accuracy. However, calculating time and computer capacity require that there should not be too dense a grid. Figure 3 shows the relationship between the element number and the maximum element size of meshes.
It can be seen that the number of meshes increases rapidly with the decrease in the maximum mesh size, of which the variation presents an exponential form approximately.
For the stationary domain, there are 1.09 million, 2.48 million, 6.76 million and 27.09 million meshes when the maximum sizes of meshes are 8.0 mm, 6.0 mm, 4.0 mm and 3.0 mm, respectively. The number of meshes is even as high as 87.19 million, with a maximum mesh size of 2.0 mm, which is of great quantity. However, only heat conduction calculation is carried out in the stationary domain during heat flow analysis. Therefore, a mesh size of 8.0 mm is adopted, with the calculating velocity and computer capacity taken into account.
In the coolant fluid domain, there is a large number of fluid-solid coupling surfaces caused by the contact with magnetic column groups in the rotating domain. Besides, meshes in the boundary should be denser, resulting in a large number of meshes. There are 10.35 million, 12.52 million, 45.91 million and 137.3 million meshes when the maximum mesh size is 4.0 mm, 3.0 mm, 1.5 mm and 1.0 mm, respectively. Considering that the local mesh refinement has been carried out in the fluid-solid coupling boundary, the maximum mesh size of the coolant domain is set to 4.0 mm.
In the case of the rotating domain, there are 15.44 million, 15.13 million, 16.13 million, 33.87 million and 25.37 million meshes when the maximum mesh size is 6.0 mm, 5.0 mm, 4.0 mm, 2.0 mm and 1.0 mm, respectively. It is noted that there is no significant difference in the mesh number with mesh sizes of 4.0 mm, 5.0 mm and 6.0 mm. Therefore, the maximum mesh size of 4.0 mm is the best choice in the rotating domain.

3.2. Local Mesh Refinement

Boundary meshes should be generated near the fluid-solid interface for high accuracy calculation. The instruction ‘Inflation’ is applied to refine the meshes in the boundary. Furthermore, ‘Geometry’ is used to select the fluid-solid coupling surface for the following parameters: thickness of 0.5 mm; number of three; and growth rate of 1.2.
Besides, there are two thin fluid domains with a thickness of 0.5 mm between the rotating-disc group and stationary part, which cannot be meshed with the above parameters, so that local mesh refinement should be carried out. A total of 115 million, 27.33 million, 17.53 million and 15.33 million meshes are generated in the fluid domain when the size of meshes are 0.2 mm, 0.5 mm, 0.75 mm and 1.0 mm, respectively. The size of the local meshing is set to 0.75 mm based on the importance of the position.

3.3. Meshing Results

Figure 4 shows the mesh distribution of the MR transmission device, and through the instruction ‘New Section Plane’, the internal meshes can also be obtained, as shown in Figure 4. Moreover, the meshes of the coolant and magnetic columns are partially enlarged.

4. Factors Affecting Distribution of Coolant Flow Field

Computational Fluid Dynamics (CFD) is a method for solving differential equations of fluid flow by numerical calculation to obtain the discrete distribution of flow field in a continuous area, and then simulate various physical phenomena related to fluid flow. The flow of any fluid conforms to three fundamental laws, and these three fundamental laws can be described by mathematical equations in integral/differential form.
The law of conservation of mass:
Integral form:
t Ω ρ d Ω + S ρ V · n d s = 0
Differential form:
ρ t + · ( ρ V ) = 0
where, ρ is the density, Ω is the control body of the integral equation, d Ω = d x d y d z , S = Ω is the surface of the control body, V is the velocity vector of the fluid movement.
The law of momentum conservation:
Integral form:
t Ω ρ V d Ω + S ( ρ V V + p I ) · n d s = Ω ρ F d Ω + S τ · n d S
Differential form:
( ρ V ) t + · ( ρ V V + p I ) = ρ F + · τ
where, F is the external force, I is the unit tensor, p is the pressure, τ is the viscous stress tensor.
The law of conservation of energy:
Integral form:
t Ω ρ E d Ω + S ( ρ E + p ) V · n d S = Ω ρ F · V d Ω + S ( τ · V + k T ) · n d S
Differential form:
ρ E t + · [ ( ρ E + p ) V ] = ρ F · V + · ( k T ) + · ( τ · V )
where, E is the total energy, and k is the heat conduction coefficient.
In this paper, ANSYS CFX software is used to analyze the flow field and temperature field of high-power MR transmission device. In this section, the influence characteristics of rotation velocity, inlet velocity, inlet position, diameter and number of magnetic columns and other parameters on flow field distribution are investigated. The working domain is divided into fluid domain, solid domain and rotating solid domain. The parameters settings are shown in Table 1.

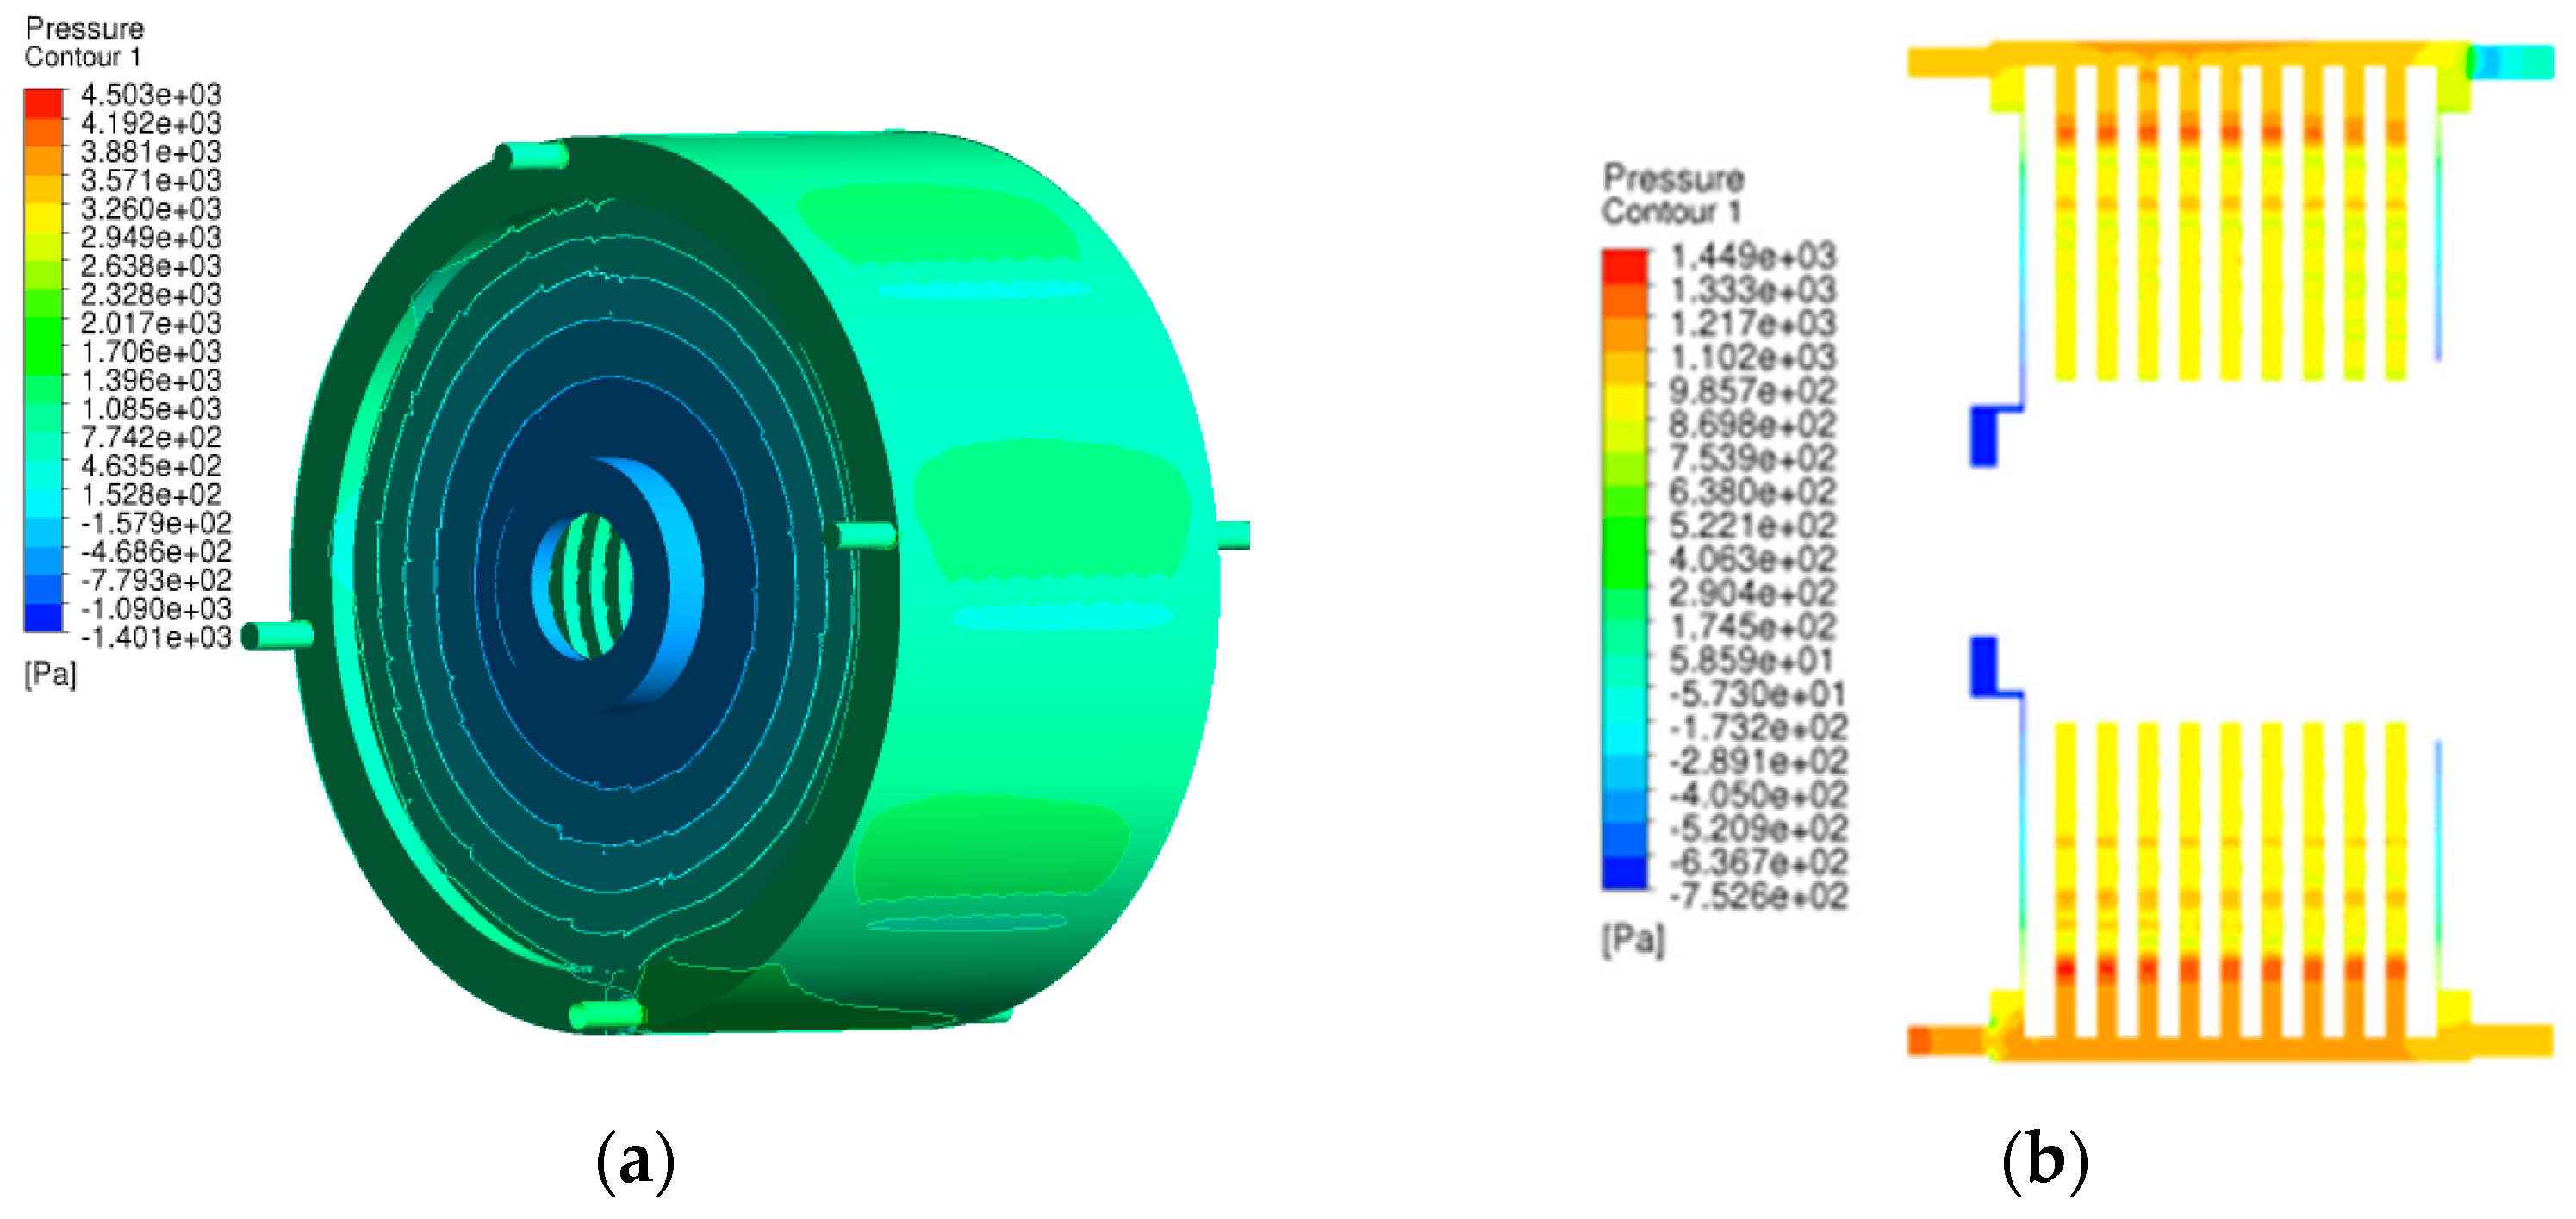
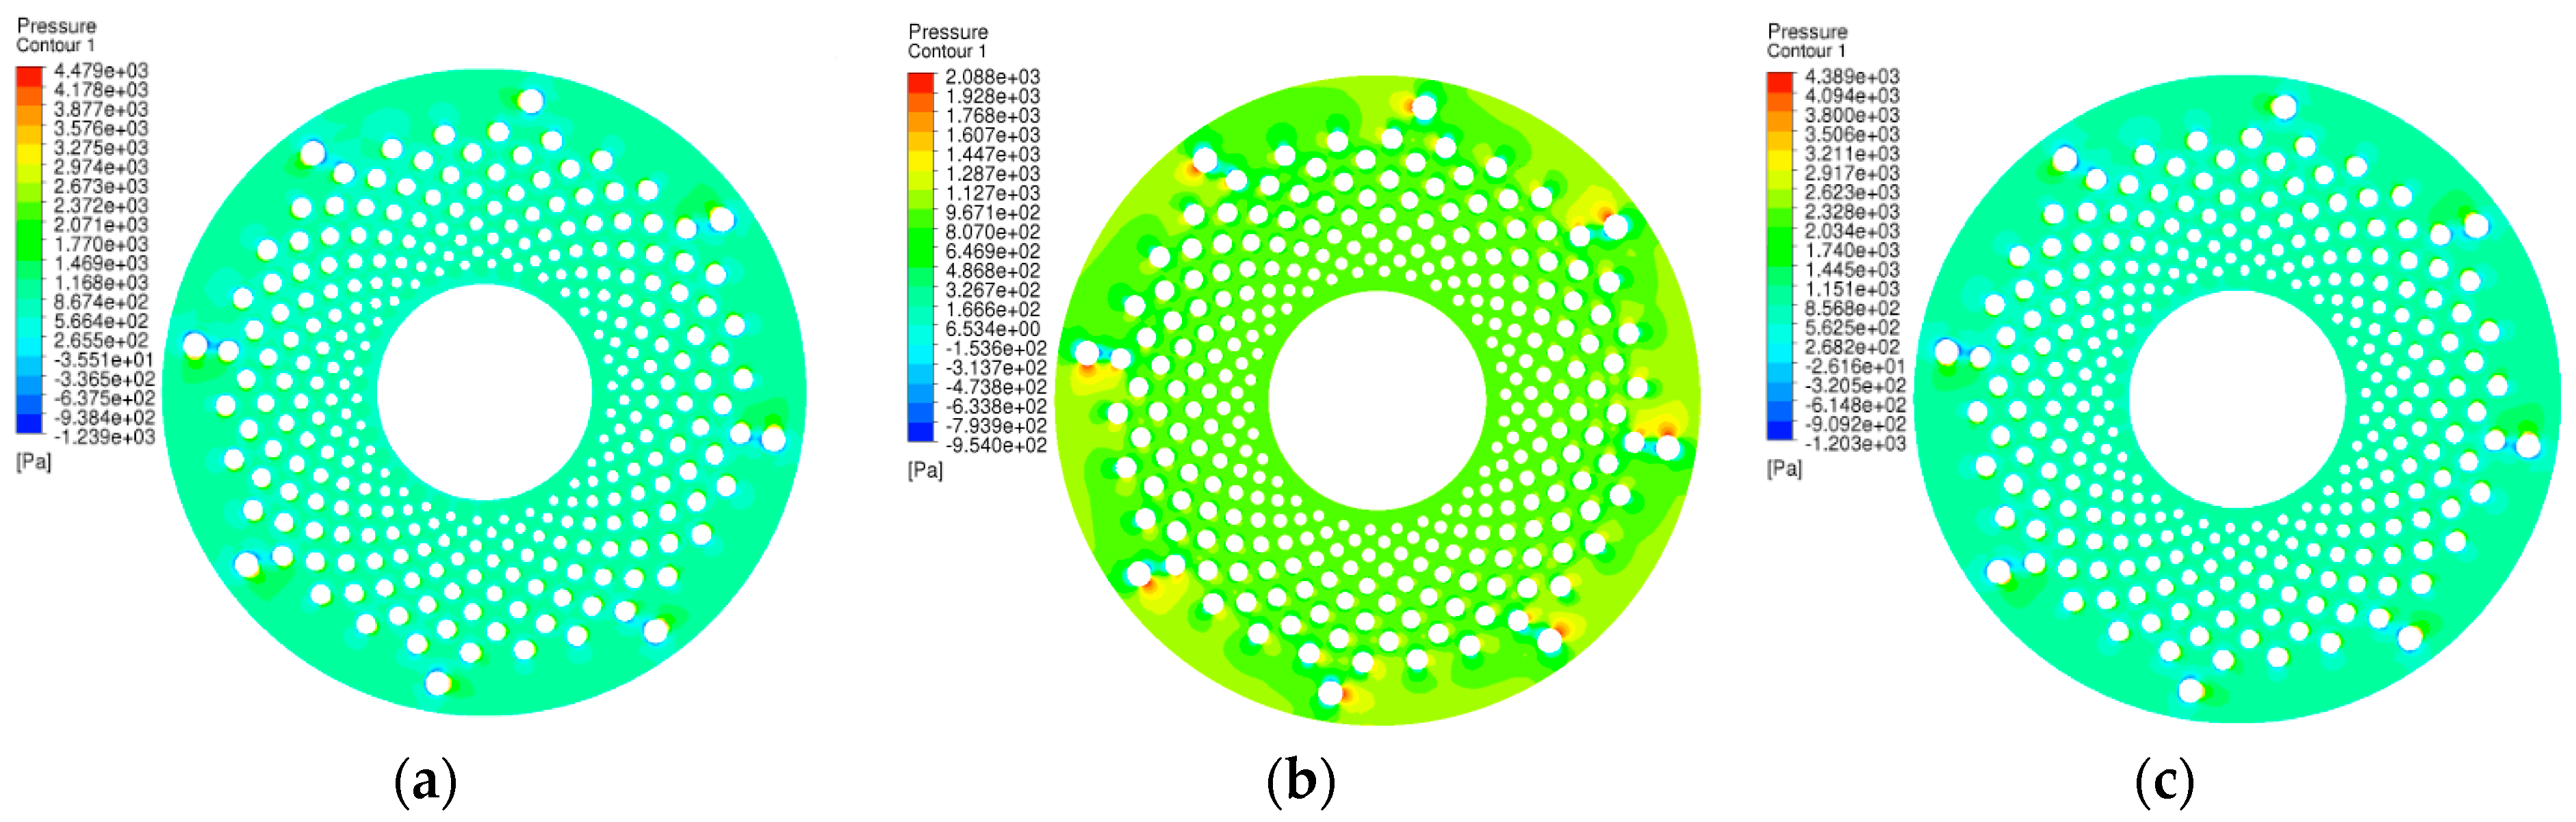
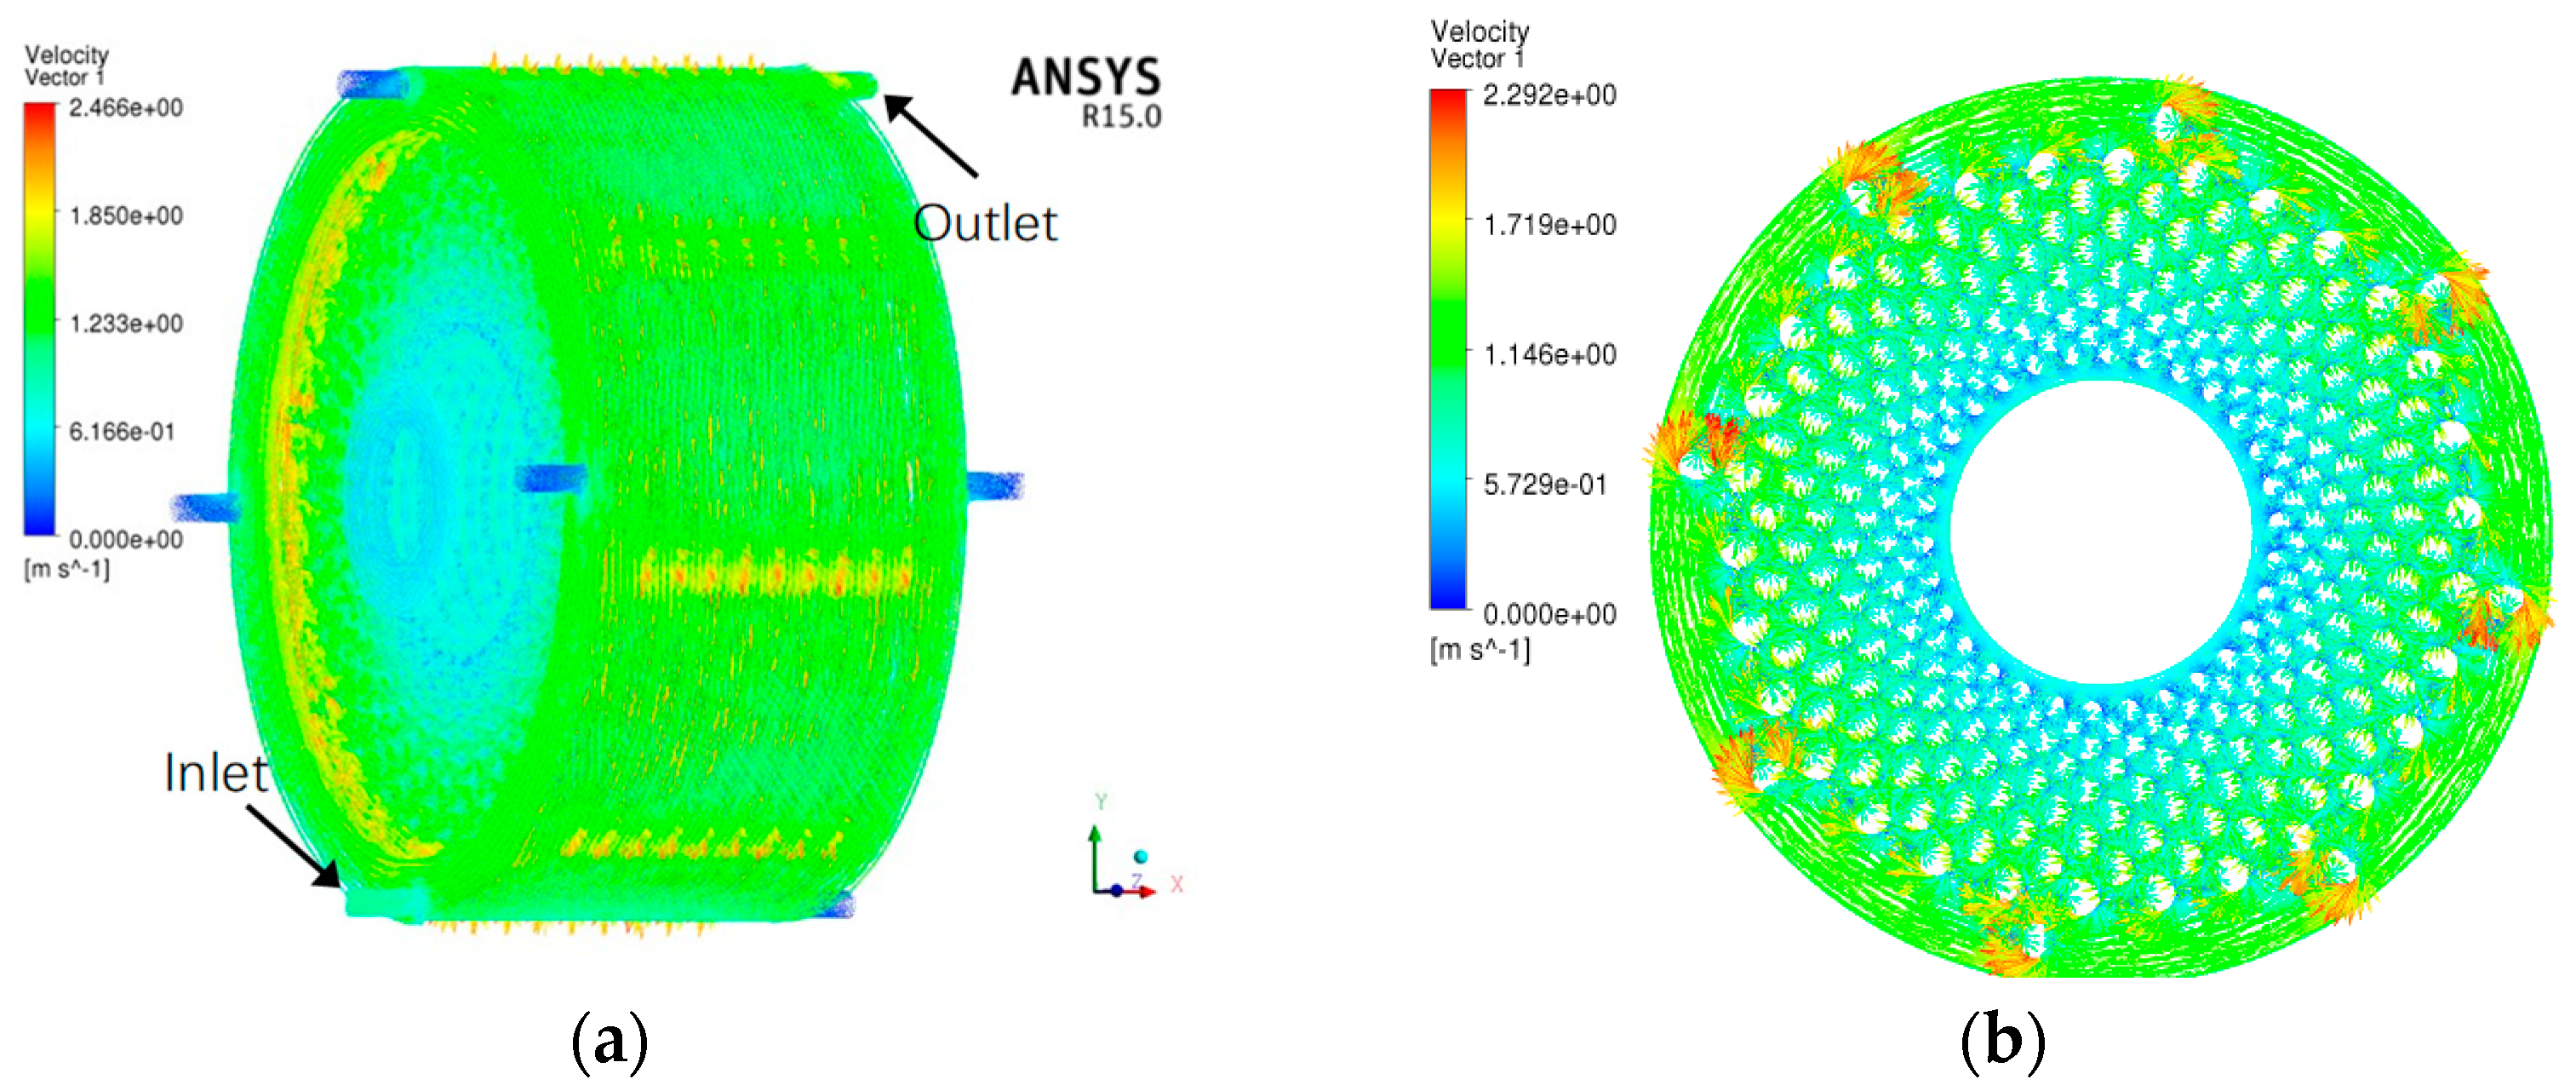
4.1. Global Distribution of Coolant Pressure Field

Cooling hydraulic field affects velocity distribution and structural strength, so it is necessary to study its distribution characteristics and obtain the distribution cloud map of the cooling hydraulic field. We set the coolant inlet speed as 1 m/s and the speed of the drive disc group as 100 r/min. Figure 5 and Figure 6 show the distribution contour of the coolant pressure field. Figure 5a is the pressure contour of coolant on the whole, and Figure 5b is the transverse pressure contour of coolant. Figure 6 is the pressure contour of the cooling gap in different longitudinal sections. Figure 6a is the rightmost side of gap, Figure 6b is the middle side of gap, and Figure 6c is the leftmost side of gap.
As can be seen from Figure 5 and Figure 6:
(a) The pressure field of coolant distributes uniformly on a whole. The lowest pressure of −1.4 kPa appears at the left end of the coolant, where the rotating eddy current occurs. The maximum pressure is only 4.5 kPa as a result of the lower rotating speed setting, located at magnetic columns, which has little influence on the strength of the structure;
(b) The pressure at the inlet is usually higher than that at the outlet, but its value is only 1.4 kPa, which requires a smaller working pressure of the coolant pump. Both the highest and lowest coolant pressure appears at the connecting columns of discs. Pressure in the perpendicular direction of rotation is higher than that at around the surrounding pressure on account of the impact from the coolant;
(c) It is obvious that the pressure field of the coolant distributes unevenly in the same cooling gap. The maximum pressure at both ends is evidently higher than that at the middle, owing to the strong impact of coolant on the wall, which contributes to the rapid dissipation of wall heat.

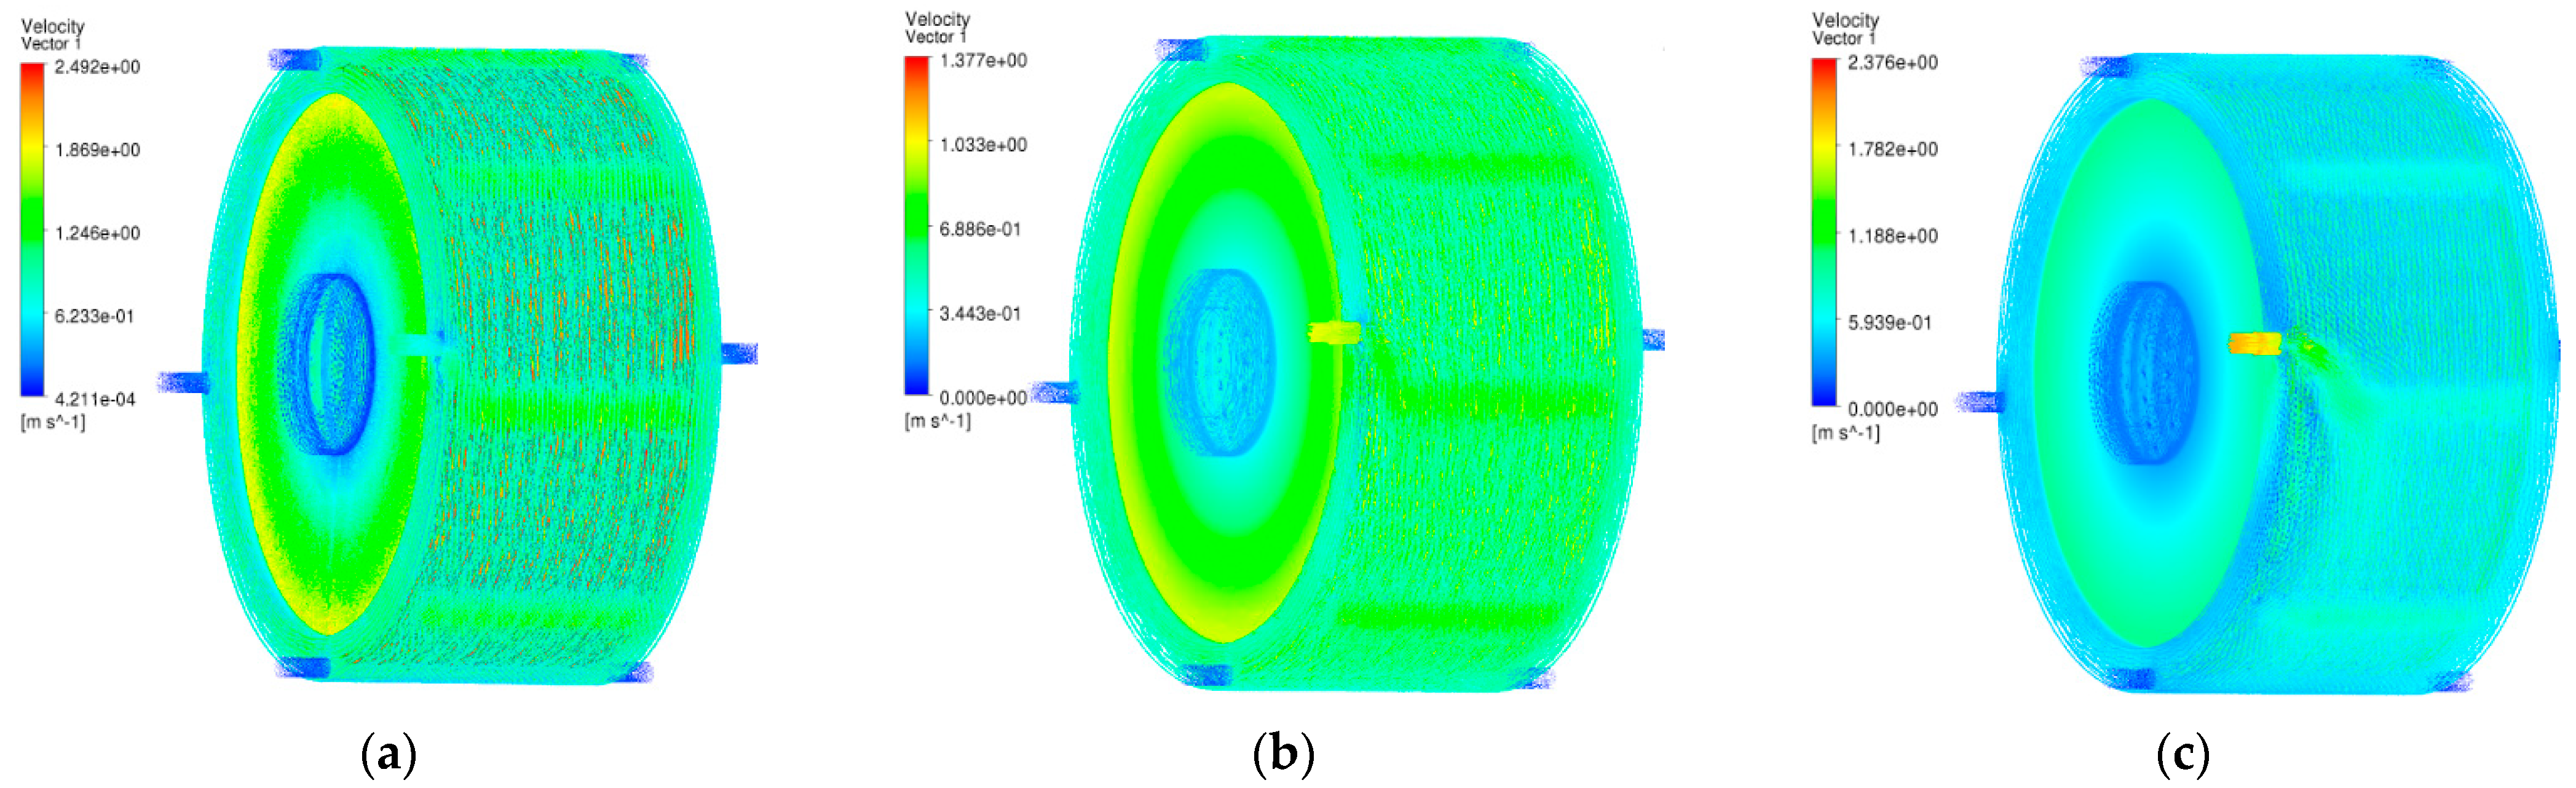
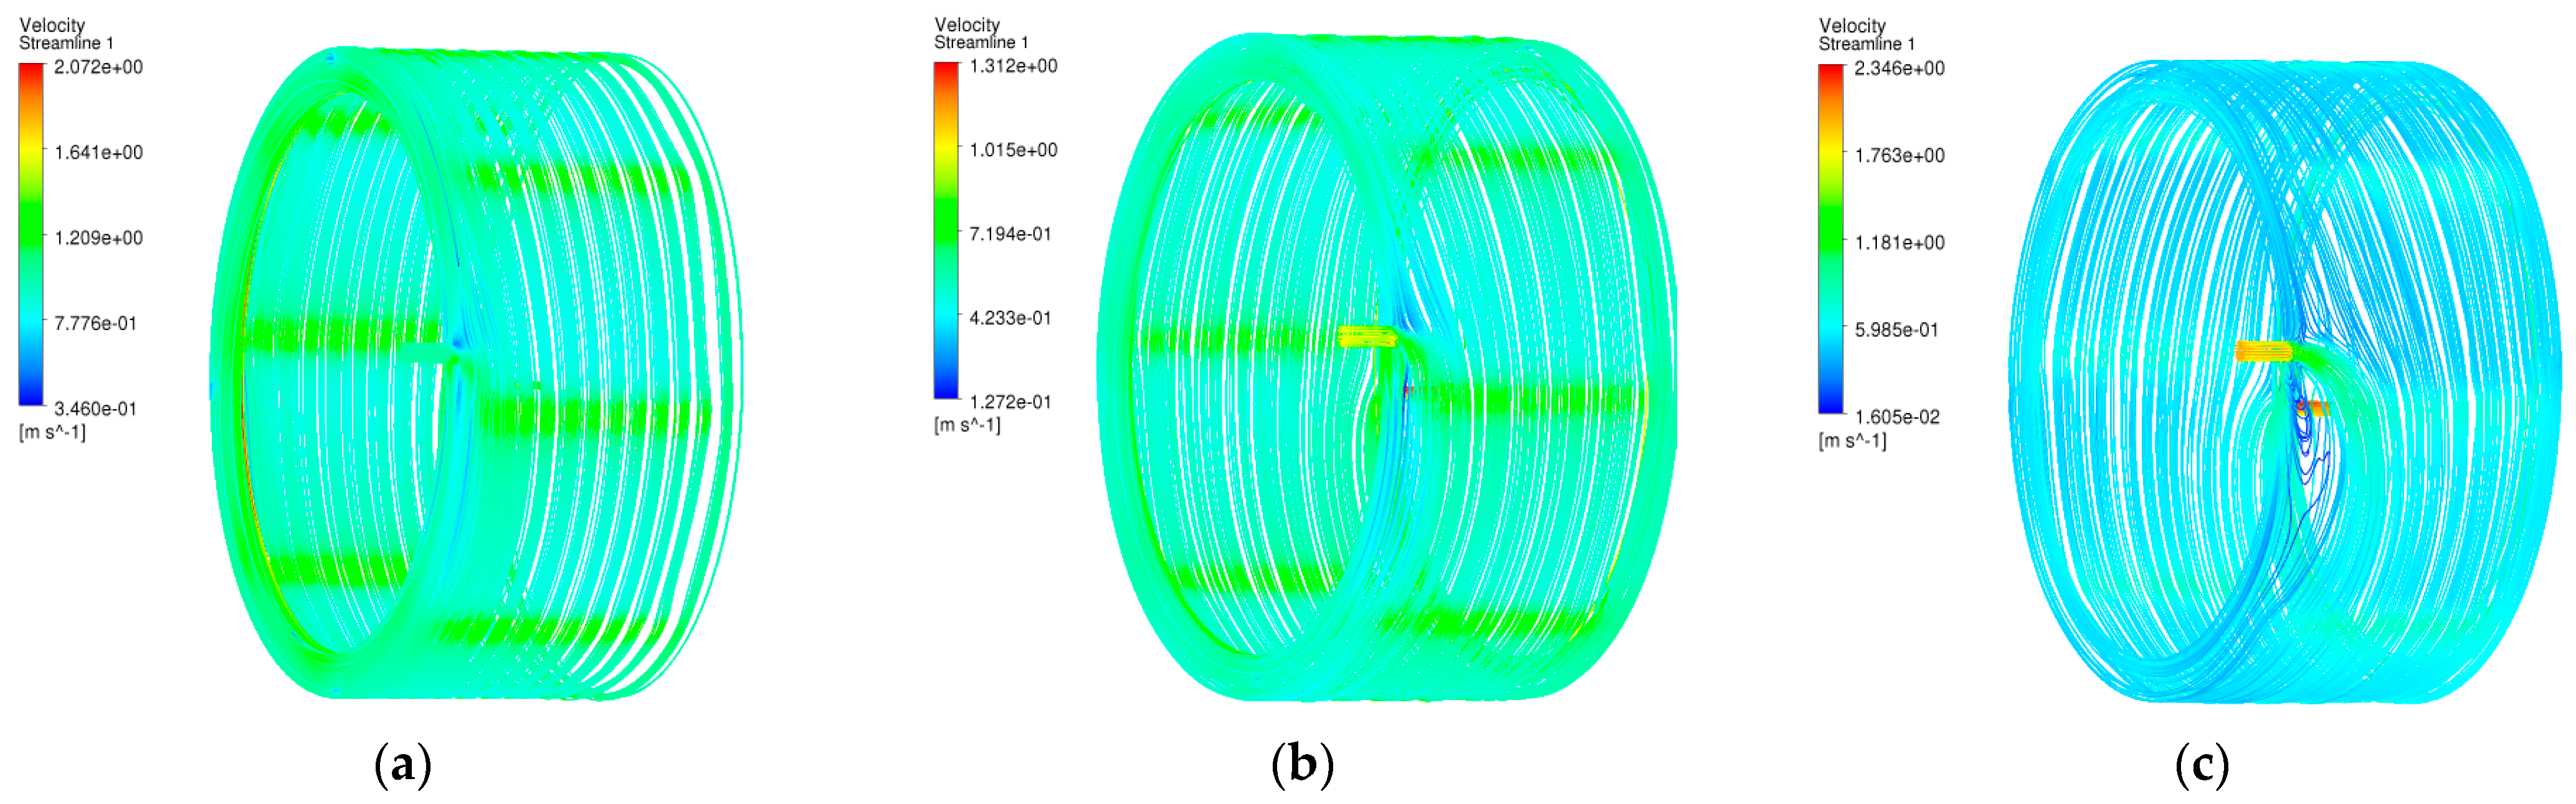
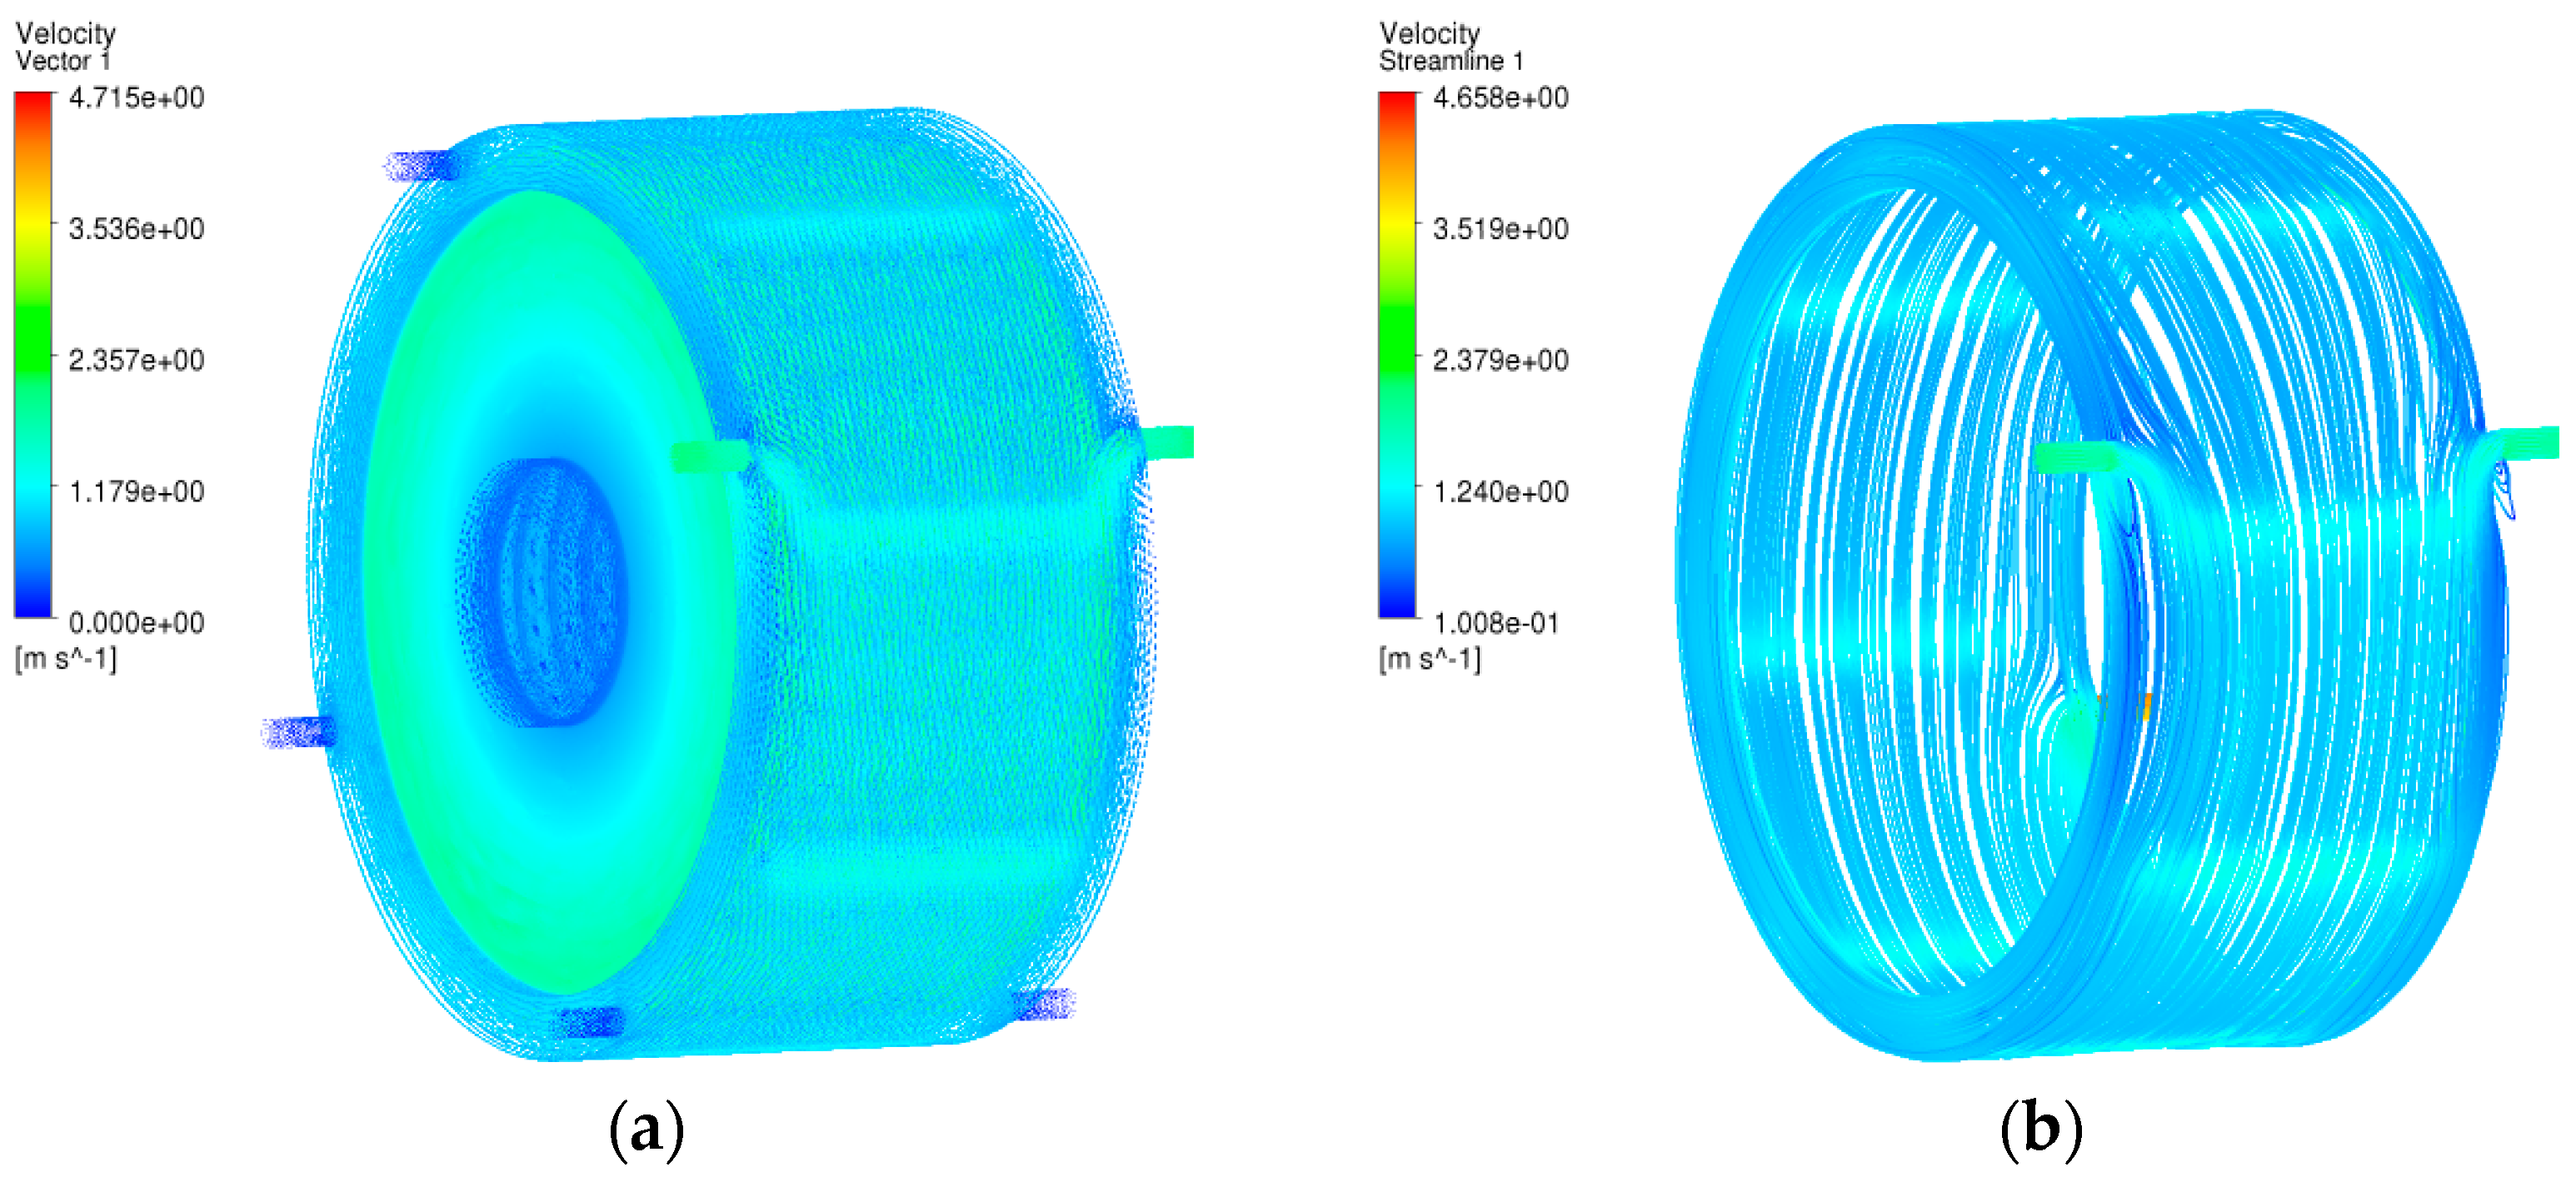
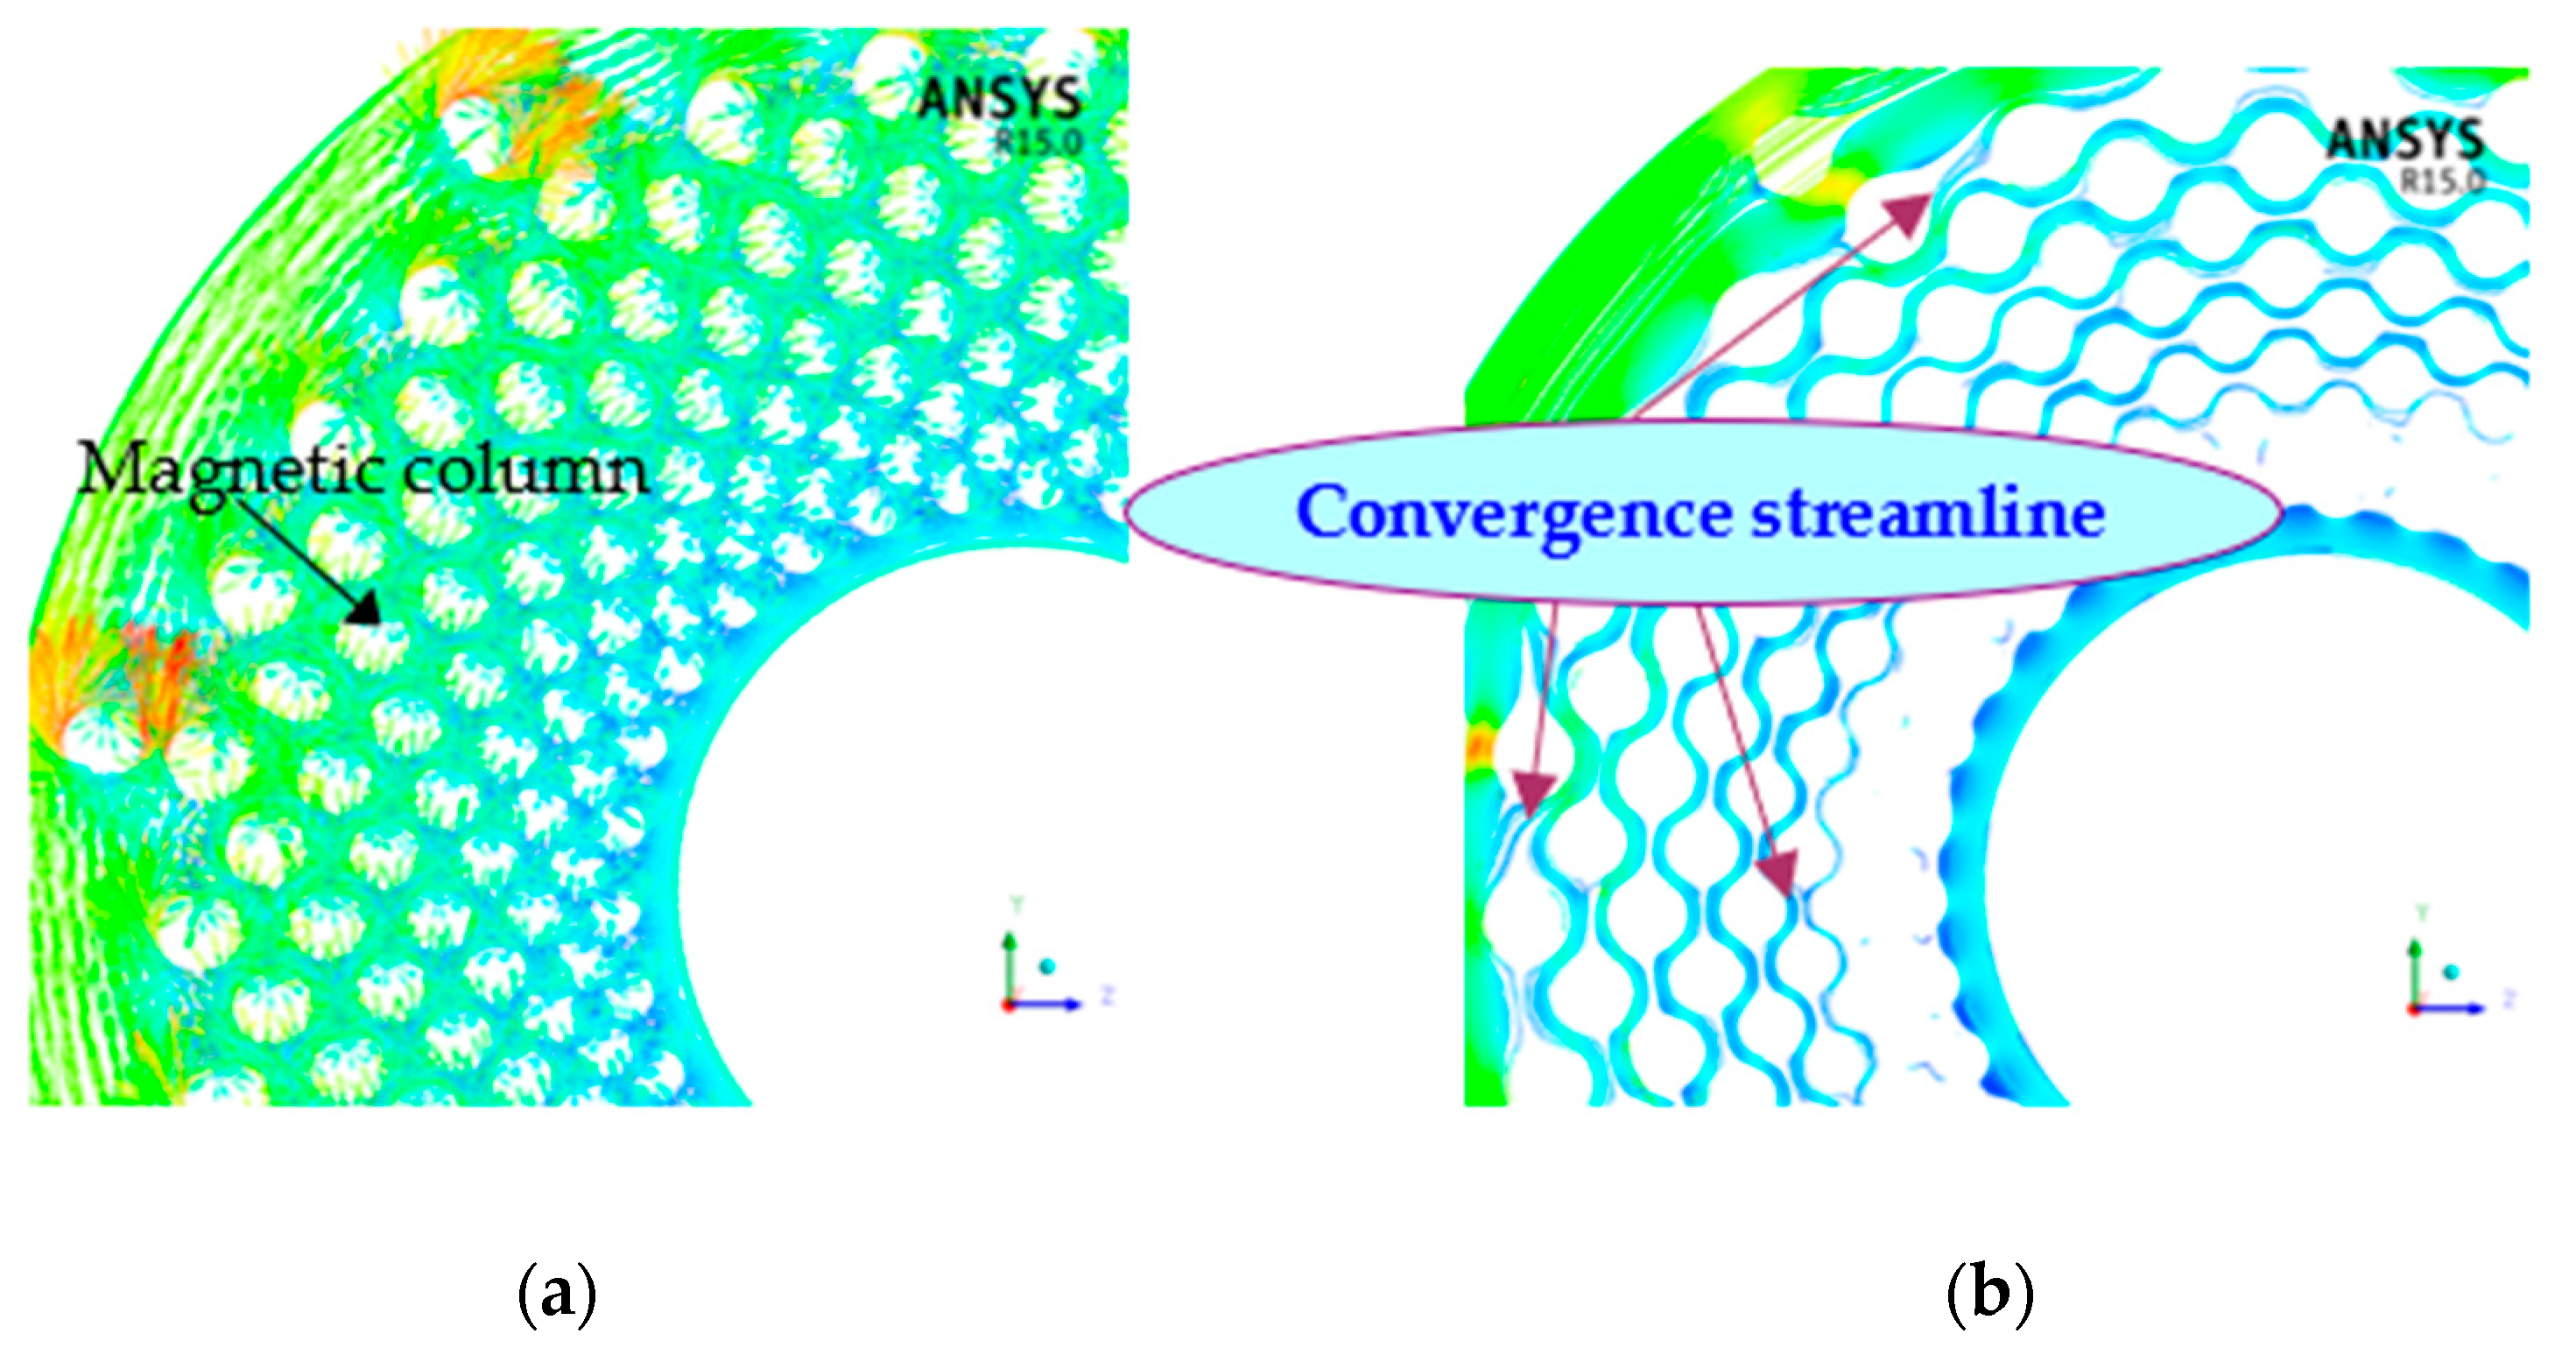
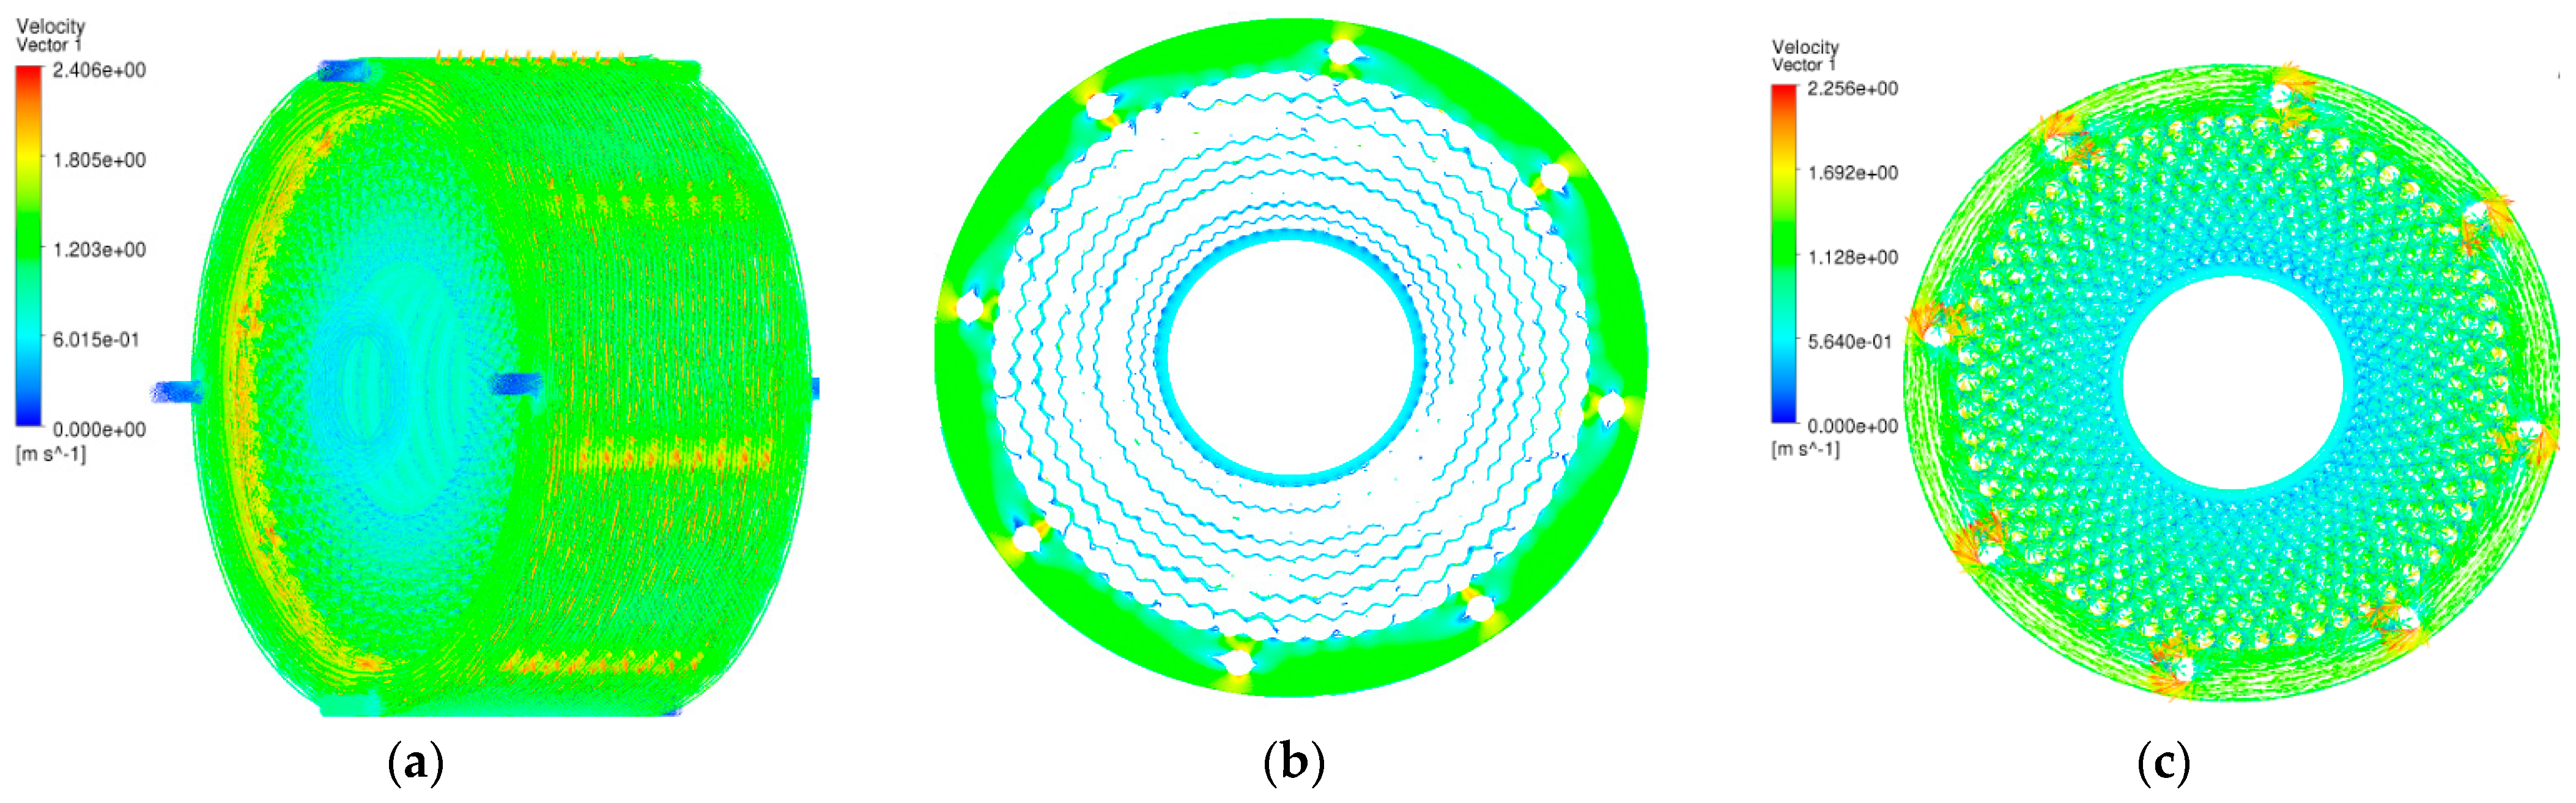
4.2. Factors Affecting Distribution of Coolant Flow Field

4.2.1. Rotating Speed and Inlet Velocity

The rotating speed of the discs group is set as 50 r/min, 100 r/min and the inlet velocity is set as 1.0 m/s and 2.0 m/s, respectively. Figure 7 and Figure 8 show the distribution of the coolant flow field under various working conditions, where Figure 7 is the velocity vector contour of the coolant, and Figure 8 is the velocity streamline contour of the coolant around the discs group.
As can be seen from Figure 7 and Figure 8:
(a) The velocity field of the coolant distribution is almost the same under different working conditions with the inlet velocity constant. Besides, the maximum velocity increases with rotating speed. It can be 2.49 m/s when the rotating speed is only 100 r/min. The maximum velocity will reach up to 12.5 m/s with a rotating speed of 500 r/min. At this time, the serious impact of the coolant will lead to some power loss;
(b) The velocity field of the coolant distribution is almost the same as well, when the rotating speed is constant. There are different impacts on the rotating fluid around the discs group as a result of the different inlet velocity. Great impact, caused by the inlet velocity, will interfere with the rotation of fluid near the inlet, which can even lead to low-velocity eddy;
(c) The influence of the inlet velocity on the coolant is up to the ratio between the inlet velocity and the rotating speed. The larger ratio will result in the fact that the rotating fluid is blocked more seriously. However, the influence of the inlet velocity on the whole velocity field is usually small, since fluid generally rotates at a higher speed.

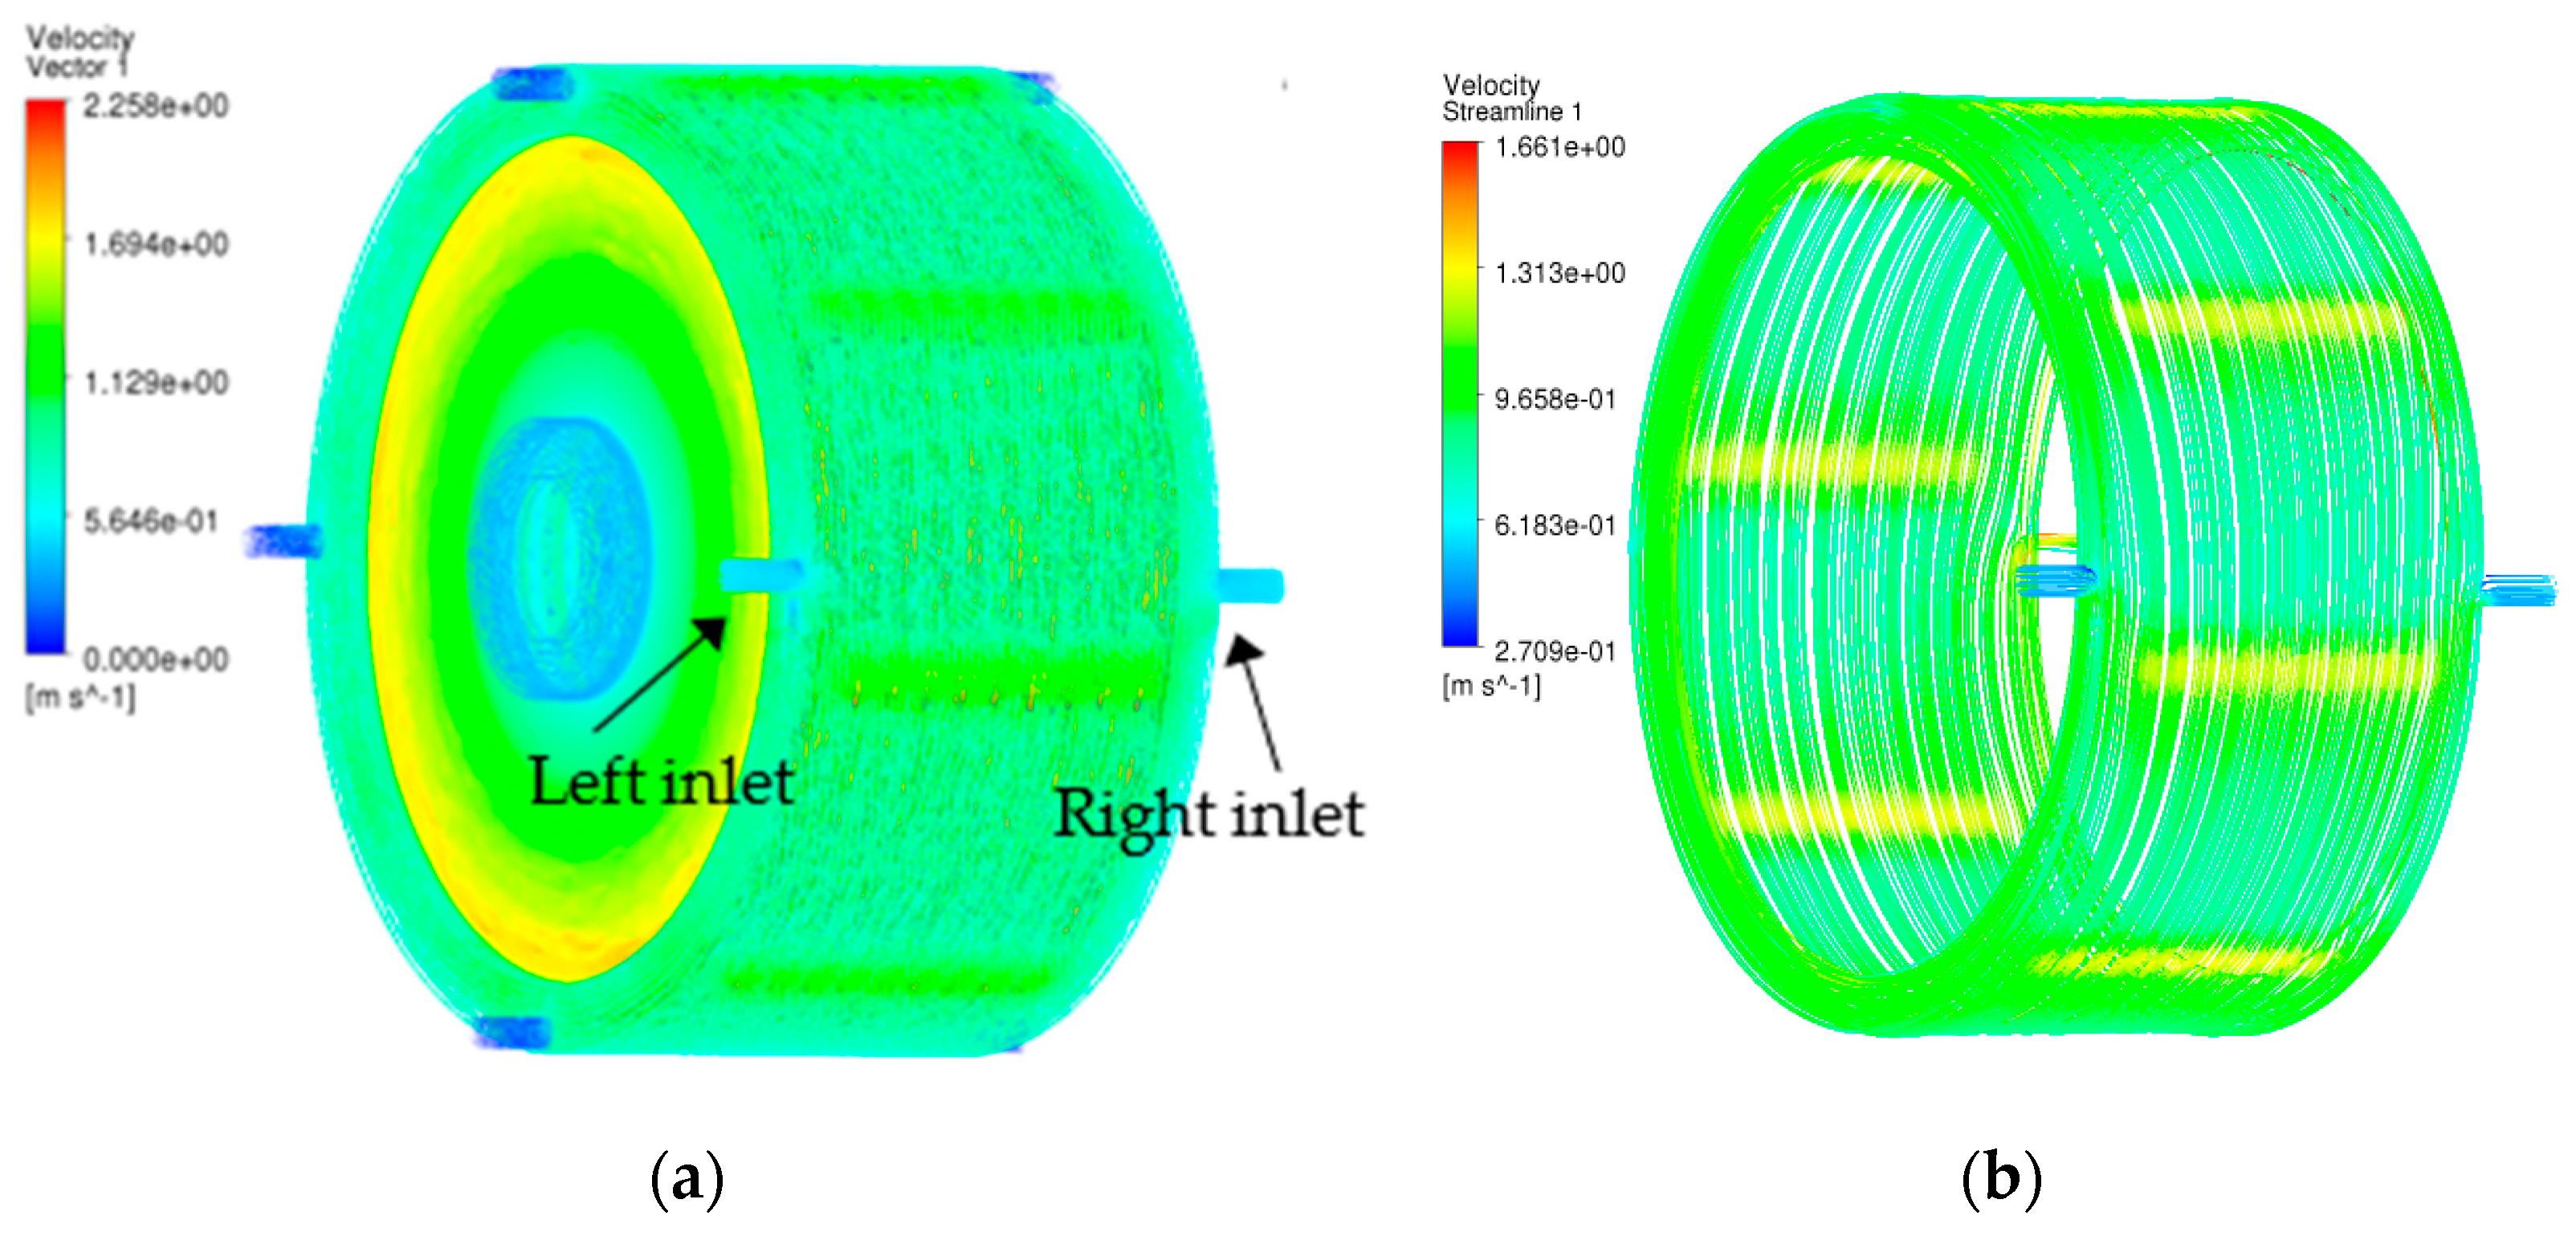
4.2.2. Inlet Position

The inlet position can also affect the distribution of the coolant velocity field, especially when there is an obvious velocity difference between the inlet velocity and the rotating speed.
The distribution of the coolant velocity field is shown in Figure 9 and Figure 10 after the following parameters are set: (a) One inlet is added opposite the outlet; (b) Rotating speed is 100 r/min; (c) Both inlet velocities are set to be the same, at 0.5 m/s and 2.0 m/s, respectively.
It can be seen from Figure 9 that the streamline of the left inlet is still spiraling when the inlet velocity is 0.5 m/s. However, the streamline of the right inlet exits directly through the right side of the discs group owing to the low-velocity inlet, which is adverse to heat dissipation. Besides, the streamline of the right inlet still concentrates at the right end of the discs group, although the inlet velocity in Figure 10 is increased to 2.0 m/s. Compared to Figure 9, the streamline of the right inlet only moves slightly to the left. There is no significant difference in the distribution of the flow field between the two kinds of inlet velocities, and the increase in the right inlet cannot significantly change the flow field of the coolant as well.

4.2.3. Diameter of Magnetic Columns

Two millimeters are added to the original diameter of all magnetic columns. Meanwhile, the rotating speed of the discs group is still 100 r/min and the inlet velocity is 1.0 m/s. The coolant distribution of the velocity field is obtained, as shown in Figure 11. Figure 11a is the vector contour of the coolant velocity field on the whole. Figure 11b is the velocity vector contour of the cooling gap. In addition, to show the velocity distribution of the cooling gap clearly, the contour of the velocity vector and the streamline is amplified, as shown in Figure 12.
It is found that in comparison with the velocity field of the coolant shown in Figure 11 and Figure 12, before the size was increased, the distribution rule of the coolant velocity field is almost the same, while the flow channel becomes narrow with an increase in the diameter of magnetic columns. The velocity vector distributes in a disorderly manner around the magnetic columns in Figure 11b and Figure 12a, indicating a greater turbulent flow, which will lead to better heat dissipation. Moreover, there are streamlines intersecting in the flow channel around the different layers of magnetic columns, as shown in Figure 12b, which indicates that the heat exchange of the coolant occurs between the inside and around the discs. The process can take away the heat in the discs, improving the efficiency of heat dissipation.
The above analysis shows that the magnetic column with a larger diameter, while it reduces the contact area between the coolant and the discs, causes heat accumulation in the work gap. Therefore, the diameter of magnetic columns should be optimized.

4.2.4. Number of Magnetic Columns

The number of single-ring magnetic columns is doubled to 60. Meanwhile, the rotating speed of the discs is still 100 r/min and the inlet velocity is 1.0 m/s. Figure 13 shows the velocity distribution of the coolant in the above working condition. Figure 13a is the vector contour of the coolant velocity field on the whole. Figure 13b,c are the vector contour and streamline contour in the cooling gap.
From Figure 13, it seems that what occurs is the number of magnetic conducting columns that the coolant distributes, are distributed in a more disorderly manner, with a variable flowing direction, which benefits the heat exchange with the wall. However, the narrow flow channel of the coolant does harm to the overall heat dissipation. It shows the same rule as the influence of the diameter. The optimal number of magnetic columns needs to be further studied as well.

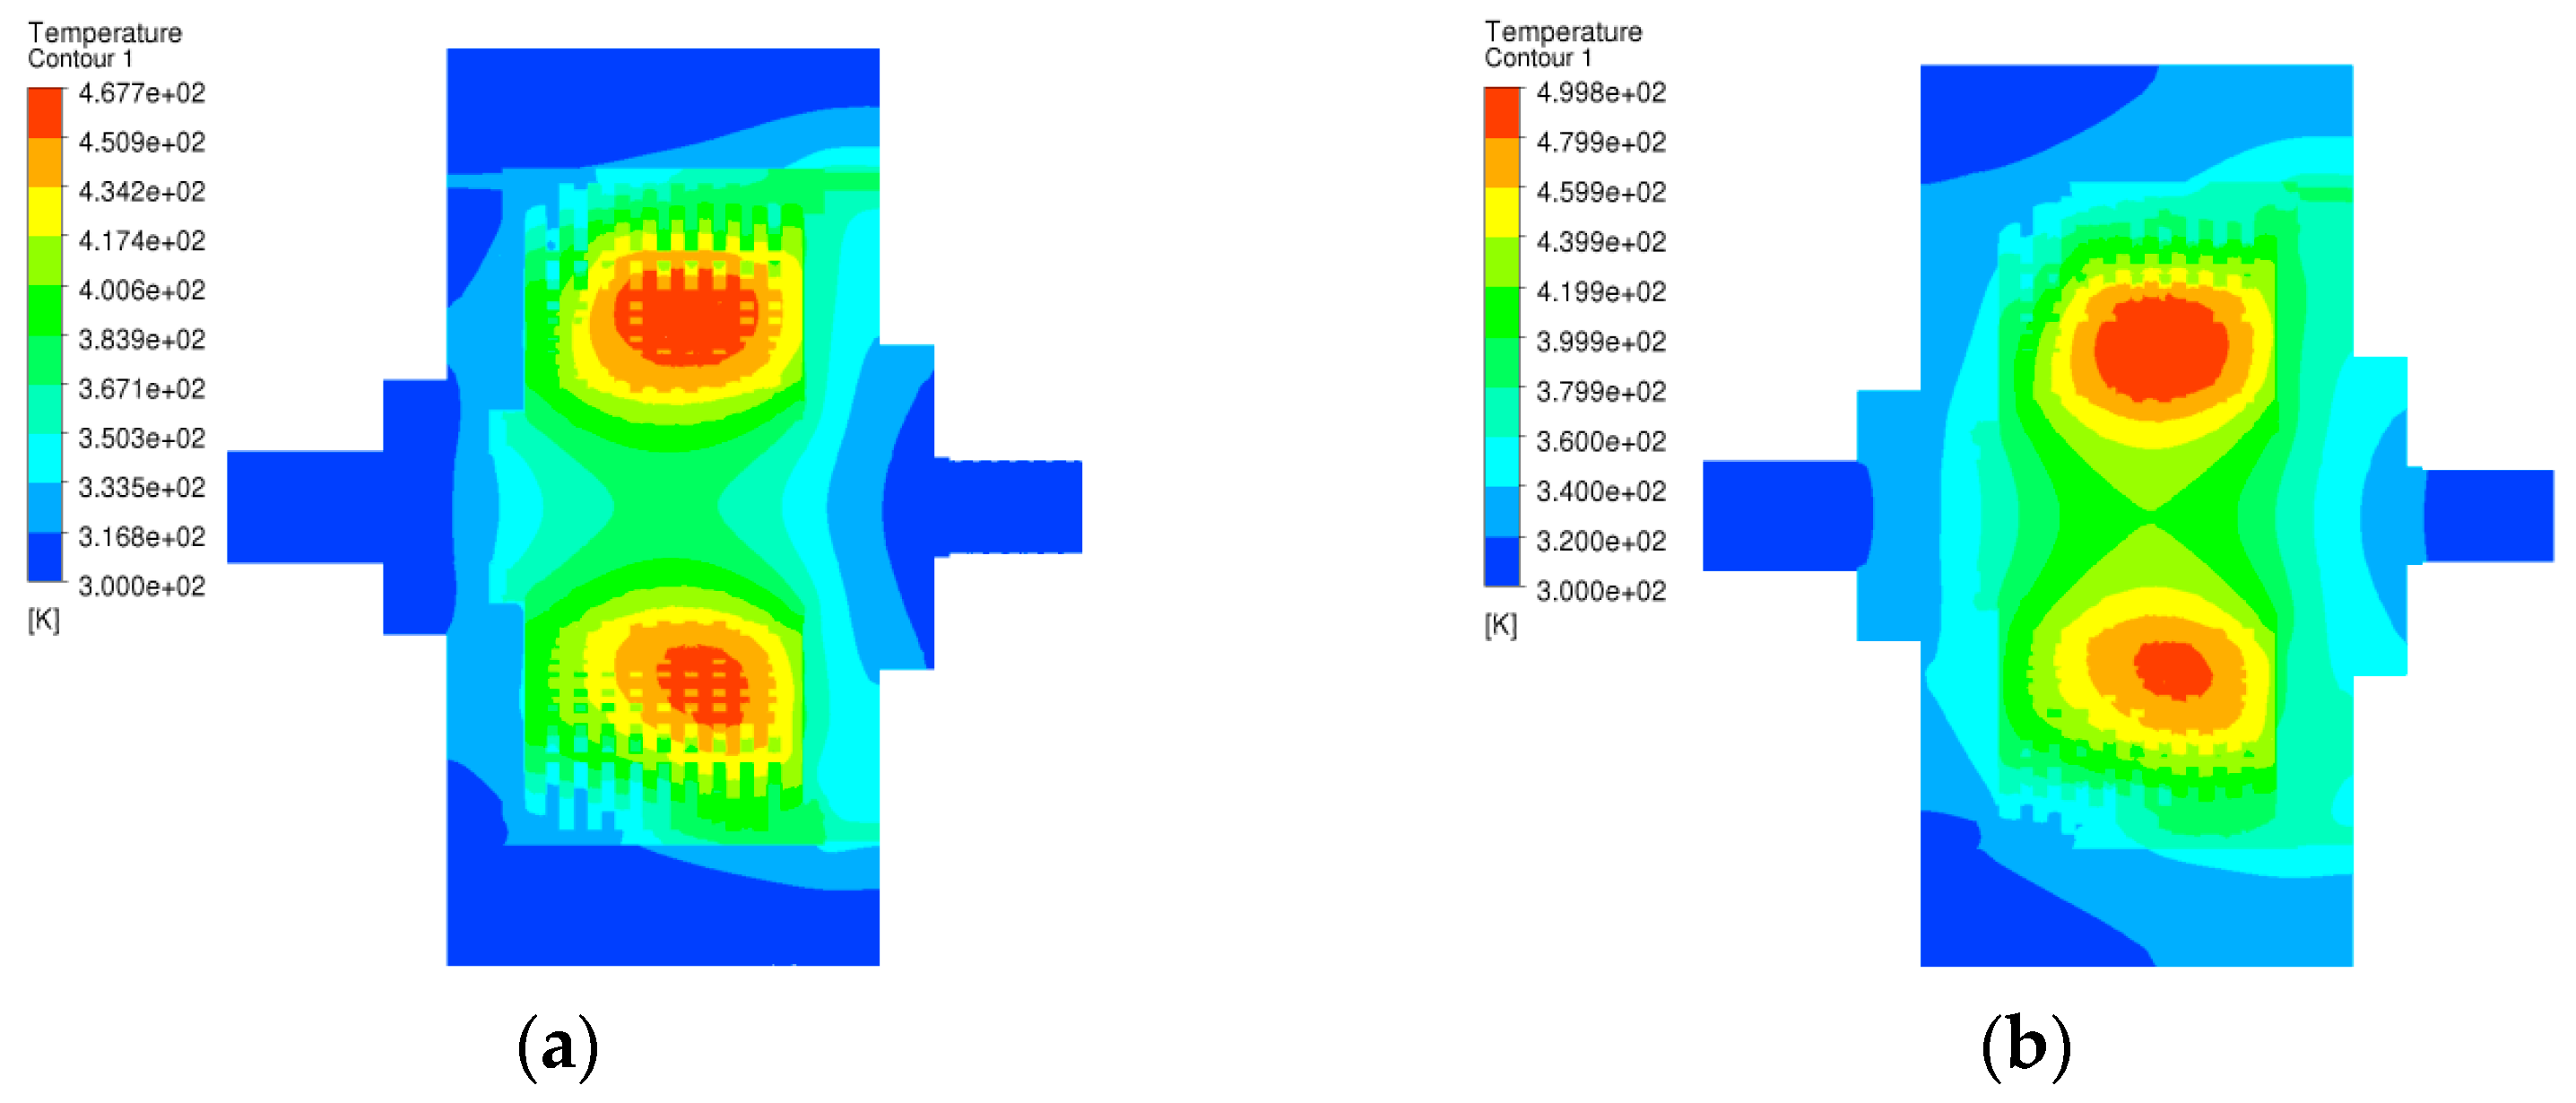
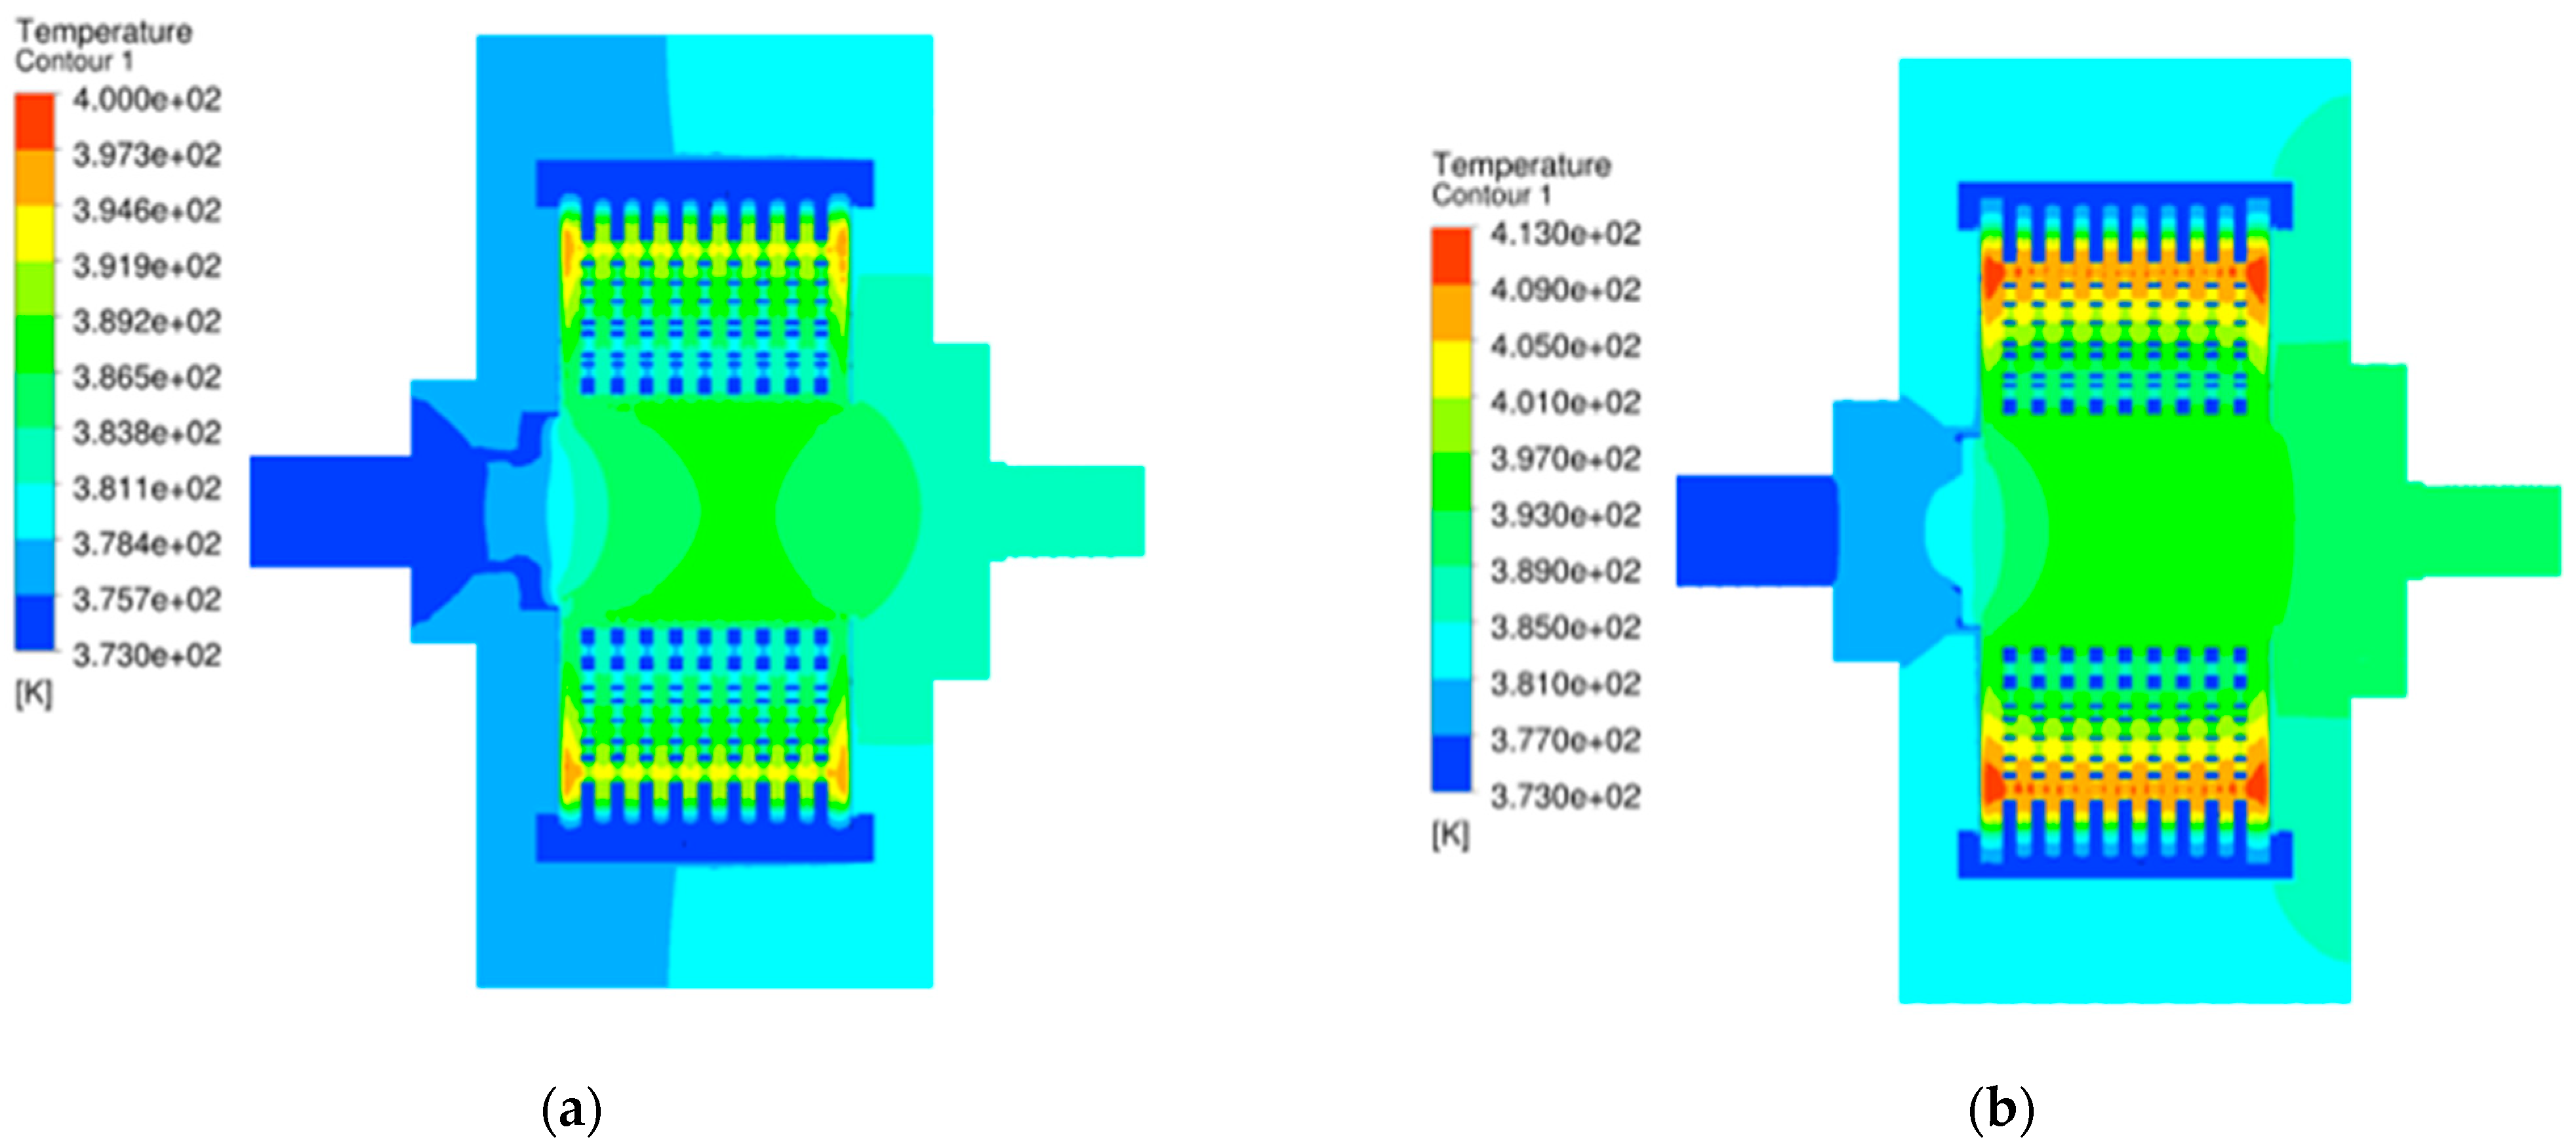
5. Temperature Field Analysis of MR Transmission Device

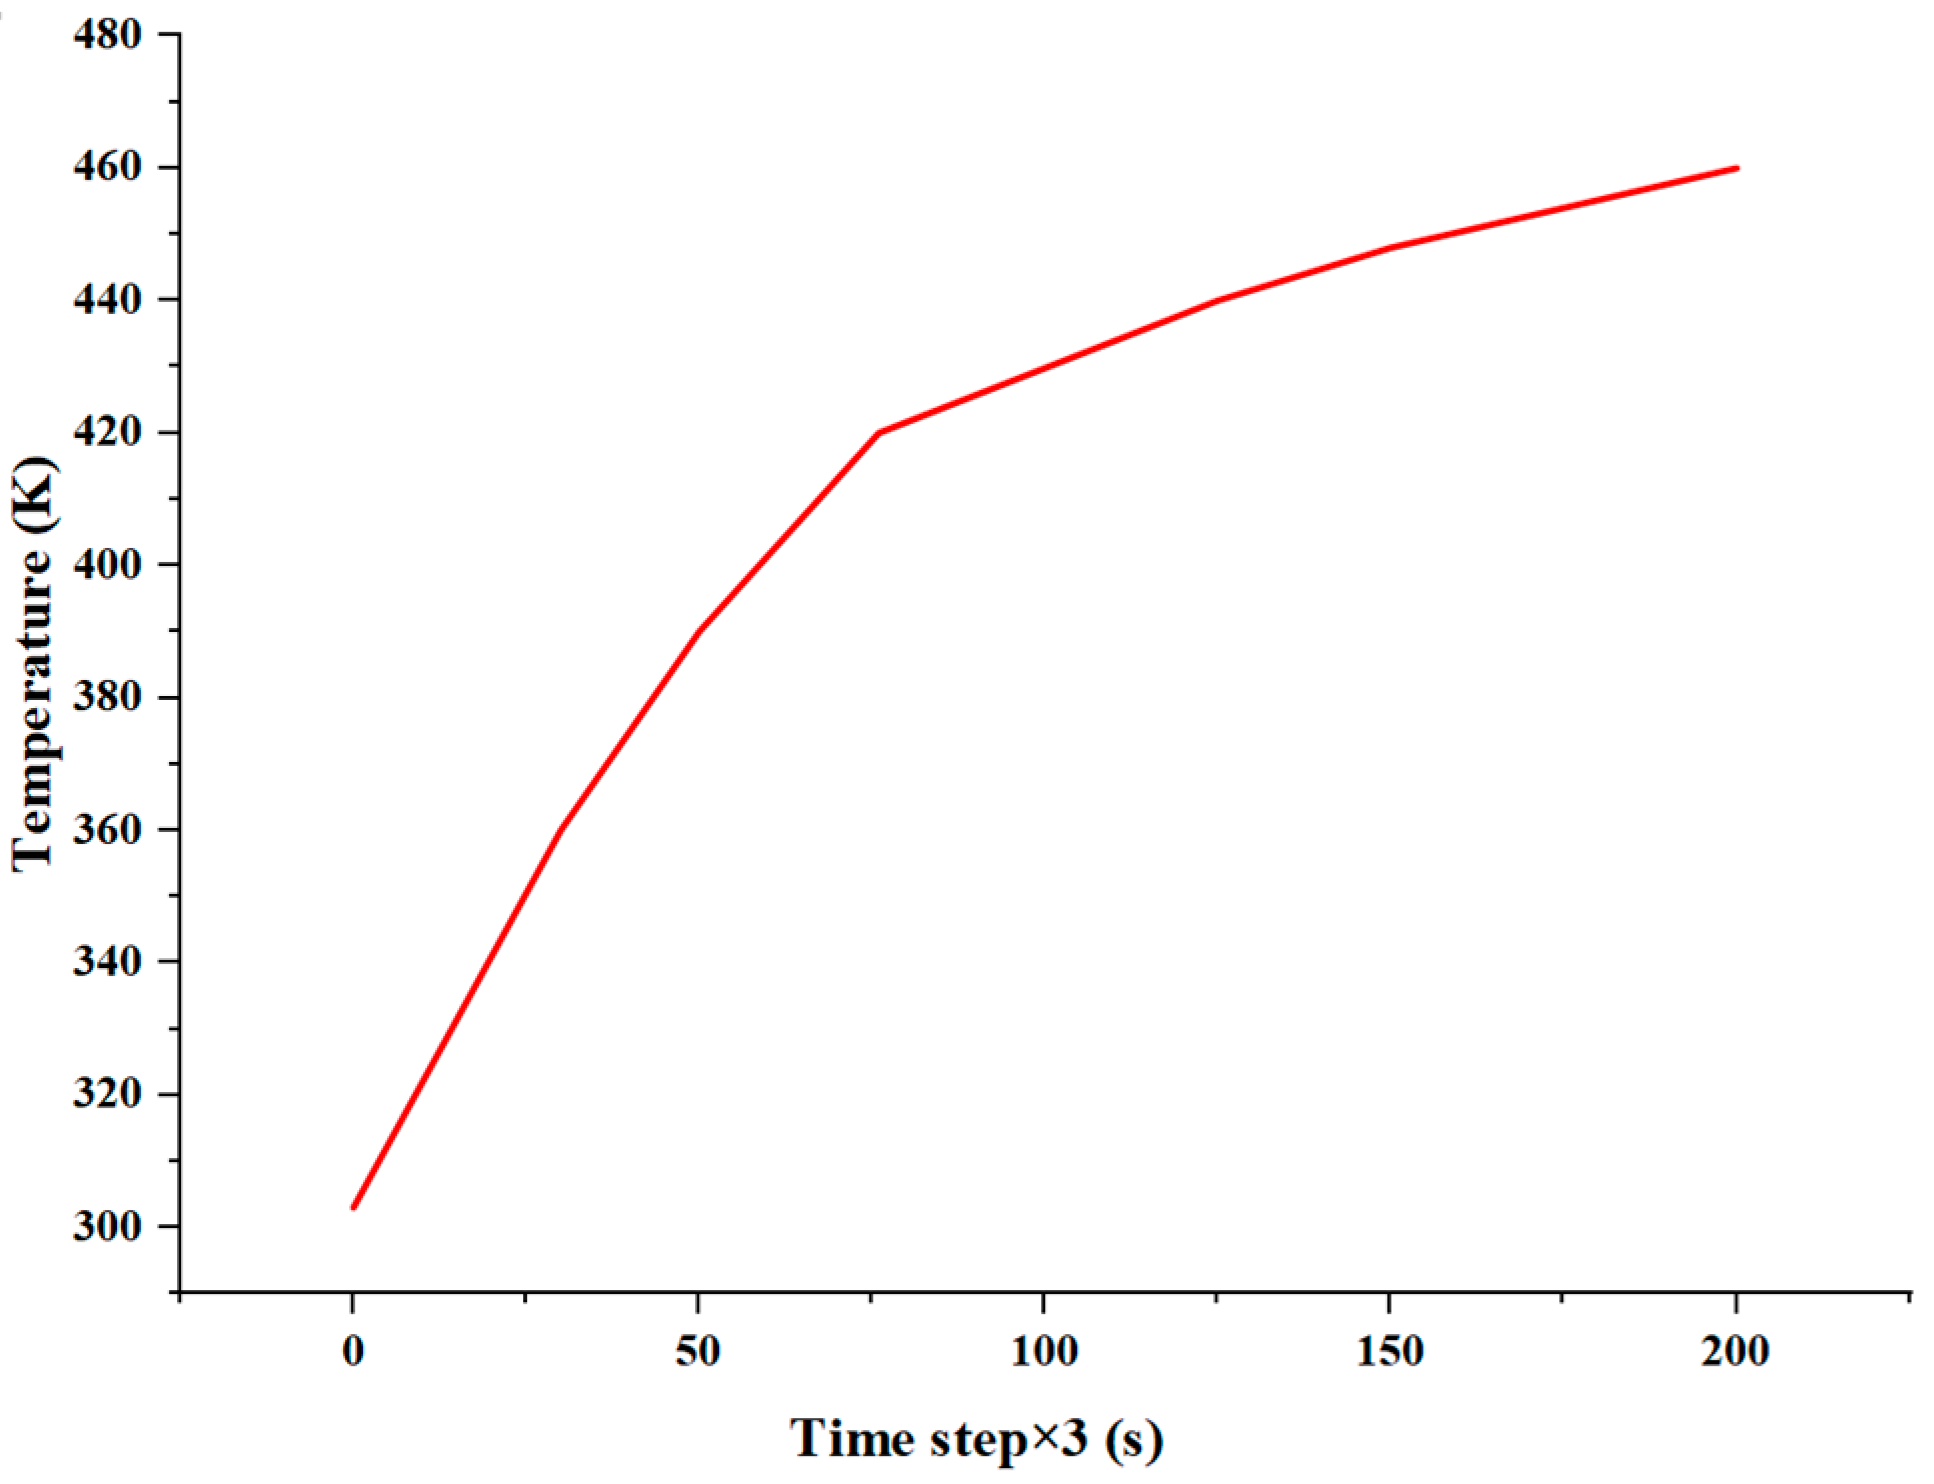
5.1. Analysis of Transient Temperature Field

As shown in Figure 14 and Figure 15, to explore the temperature variation rule of the magnetorheological transmission device with time, the transient temperature field is analyzed. The temperature distribution of the device at 240 s and 460 s is obtained by the cooling fluid inlet speed of 1 m/s, the driving disk speed of 100 r/min, and the slip power of 100 kW. The temperature signal was obtained at the working gap of 0.245 mm from the center of the driving disk, and the temperature change curve was obtained.
It can be seen from Figure 14 and Figure 15 that the temperature of the MR fluid transmission device increases with the increase in working time, and the rising rate gradually tends to be gentle. The highest temperature appears in the working area of the MR transmission device.

5.2. Analysis of Temperature Field in Ultimate Slip Power

The temperature of the coolant can easily reach its phase transition point when the coolant is of poor liquidity. The temperature field of the MR transmission device, as in the above case, is shown in Figure 16. At this time, the number of single-circle magnetic columns is 60, and the slip power is 200 kW. Meanwhile, the heat transferring coefficient is, respectively, set as 10,000 and 2500 to simulate the coolant flow during the phase transition. Even in the case of low heat transferring, the maximum temperature of the device is 413 K, less than the maximum permissible temperature of the MR fluid, which indicates that the device can still transmit power of 200 kW under the condition of poor heat dissipation. It should be pointed out that the above analysis is carried out when the cooling gap is filled with the coolant, but the maximum slip power will decrease as there is less coolant in the cooling gap when it rotates at high speed.

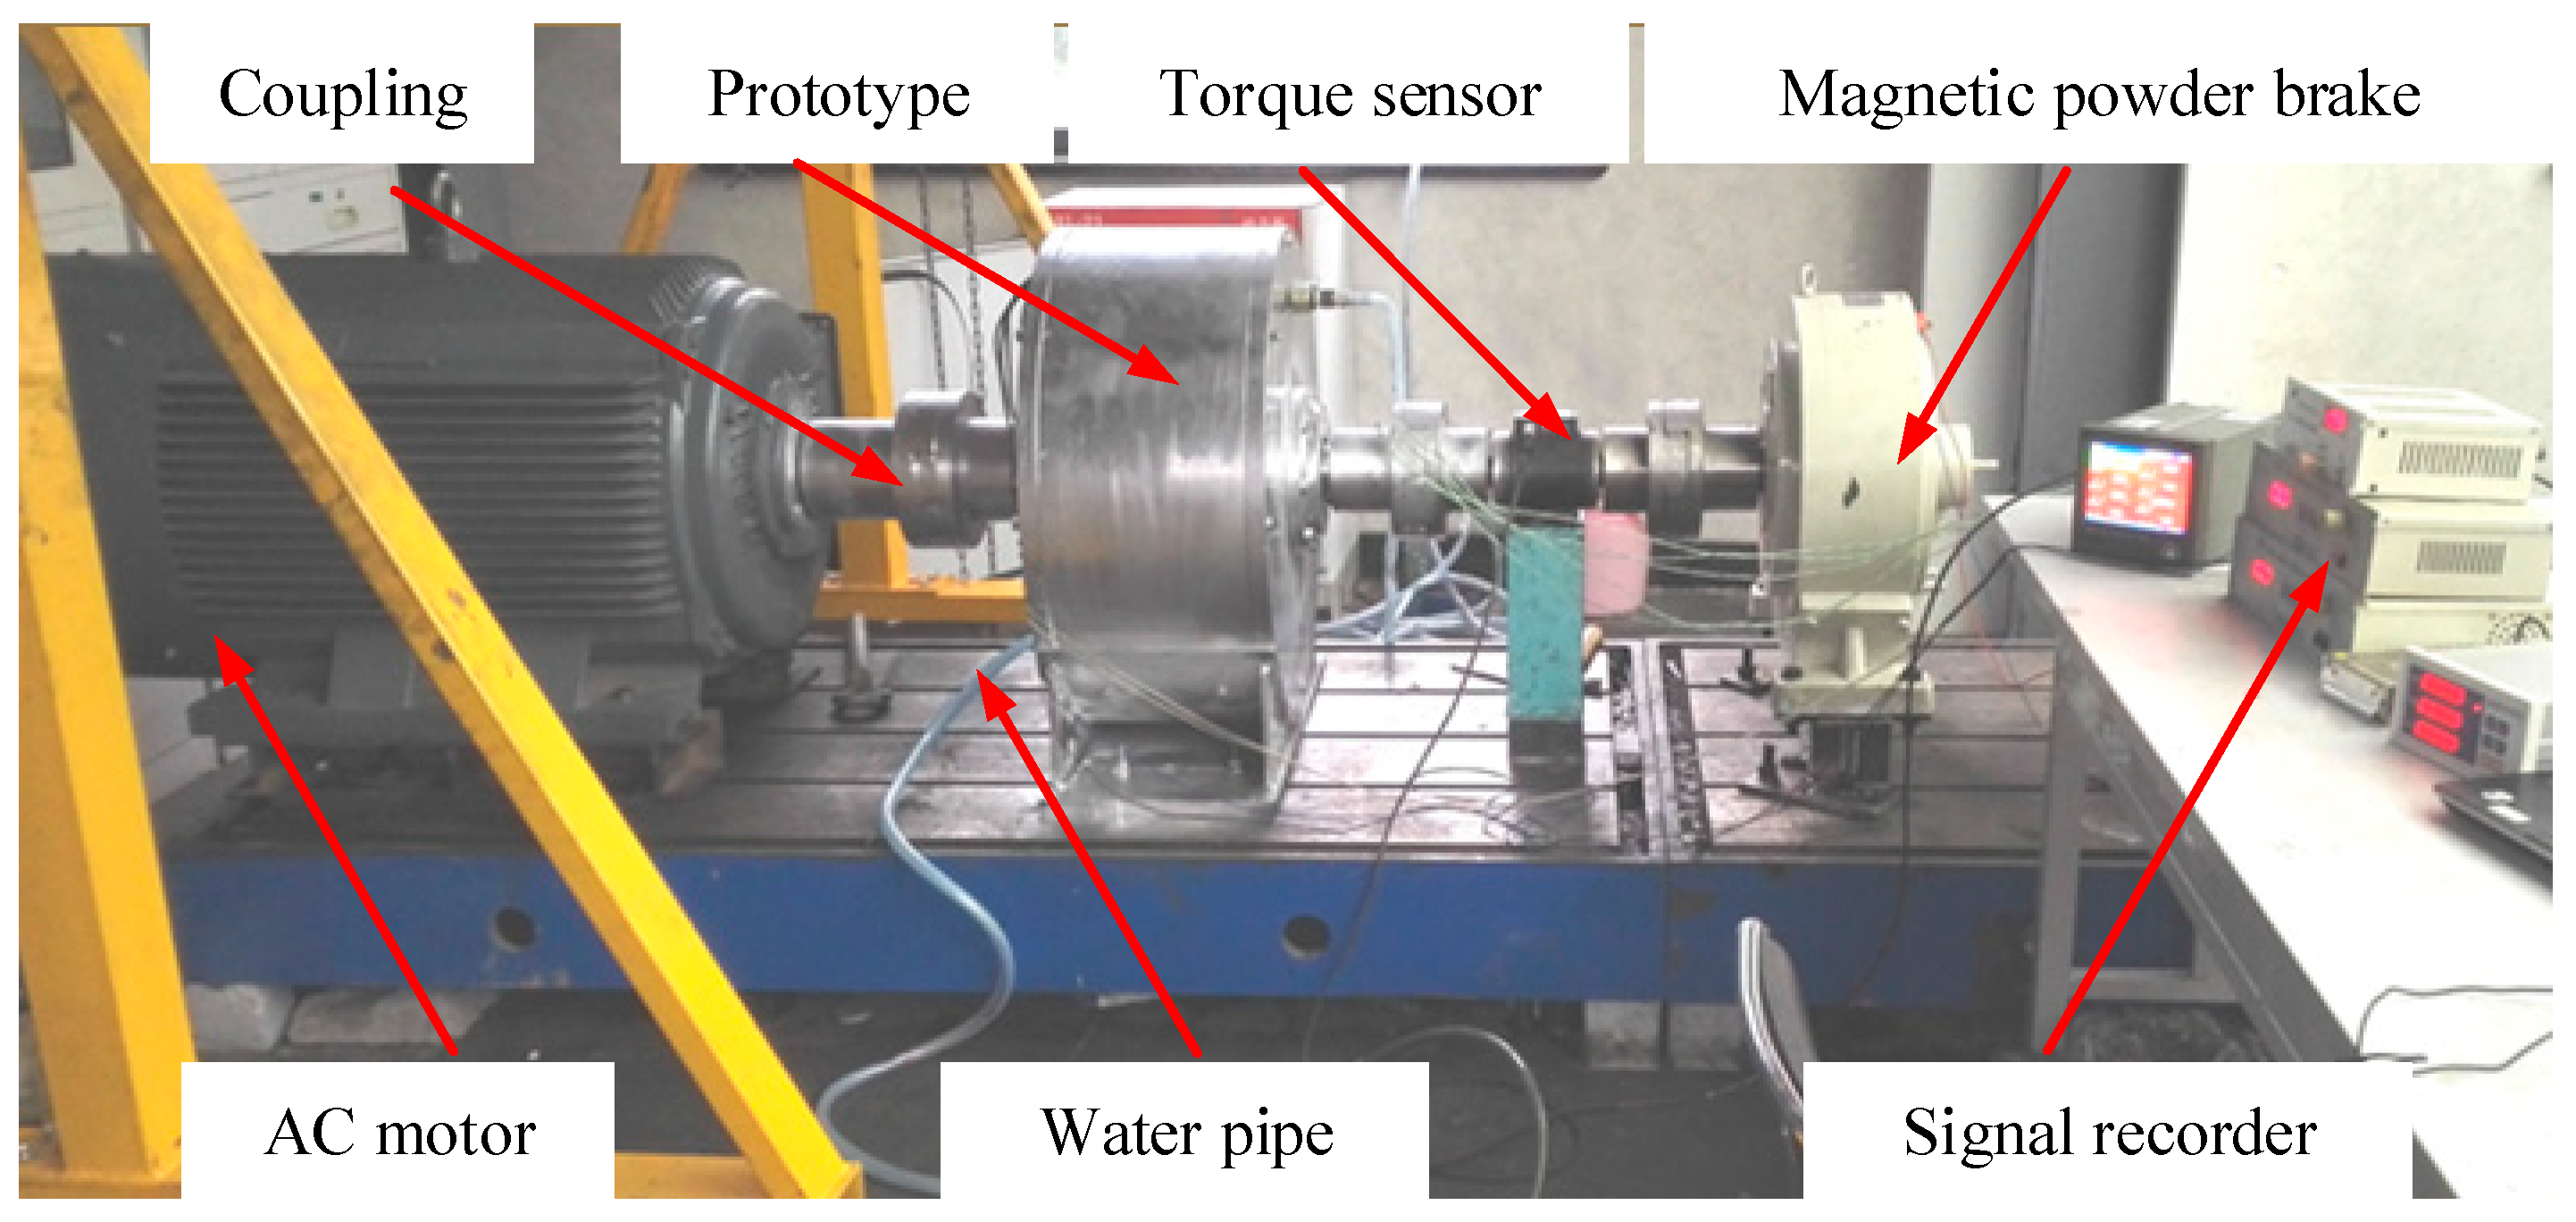
6. Experiments and Discussions

6.1. Experimental System

In order to investigate the transmission performance and temperature rise characteristics of a high power MR fluid transmission device experimentally, the experimental platform is built to carry out the experiment of transmission performance. As shown in Figure 17, the experiment system consists of an AC motor, Prototype, Torque sensor, Magnetic powder brake, Signal recorder and water pipe. The power of the AC motor is 90 kW and the transmitted power is 200 Kw when the slip speed is 1000 r/min.

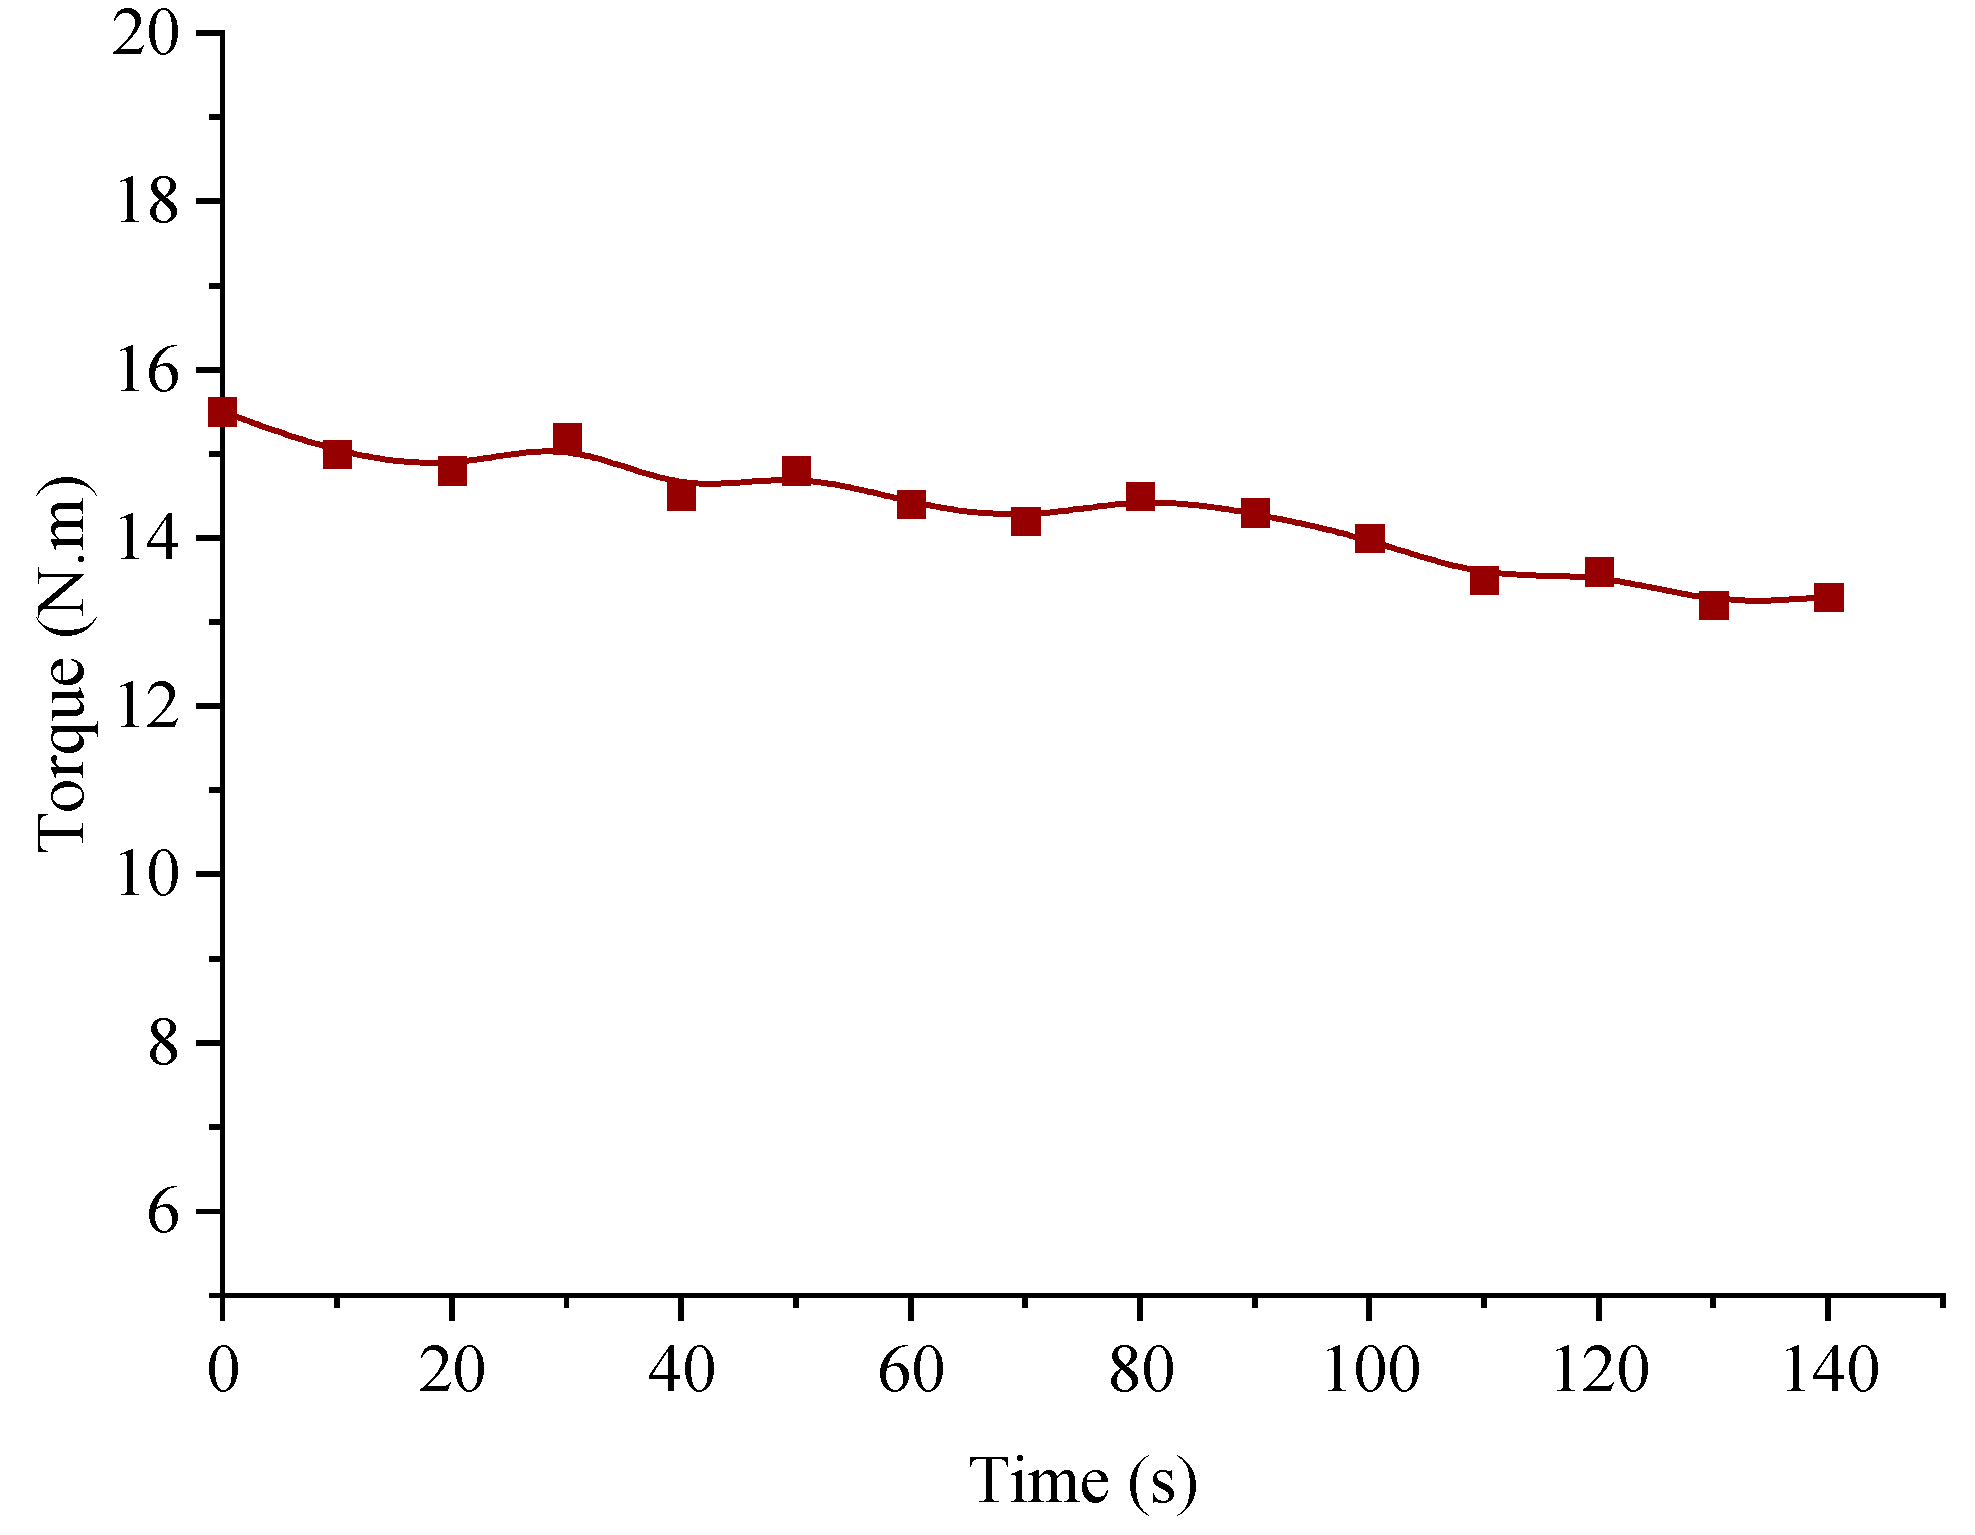
6.2. No-Load Characteristics

The motor is regulated by the inverter at a low speed (2 Hz) and the exciting current is set as 0 A. The magnetic powder brake is in the braking state with the exciting current of 2 A. The torque of the MR transmission device at low rotating speed is measured by a torque and speed sensor, as shown in Figure 18.
As can be seen from Figure 18, the no-load torque of the high-power MR transmission device fluctuates only around 15 N.m, which is much smaller than the theoretical transmittable torque. The reason for the difference is that the driving and driven components are in flexible contact with smaller zero-field friction through MR fluids, and the transmittable torque at ultra-low speeds of 2 Hz mainly comes from the friction of the seals and bears between the driving and driven components. As the no-load operation continues, the transmittable torque decreases slightly, mainly due to the silicone oil in the MR fluid entering and lubricating the seal components.

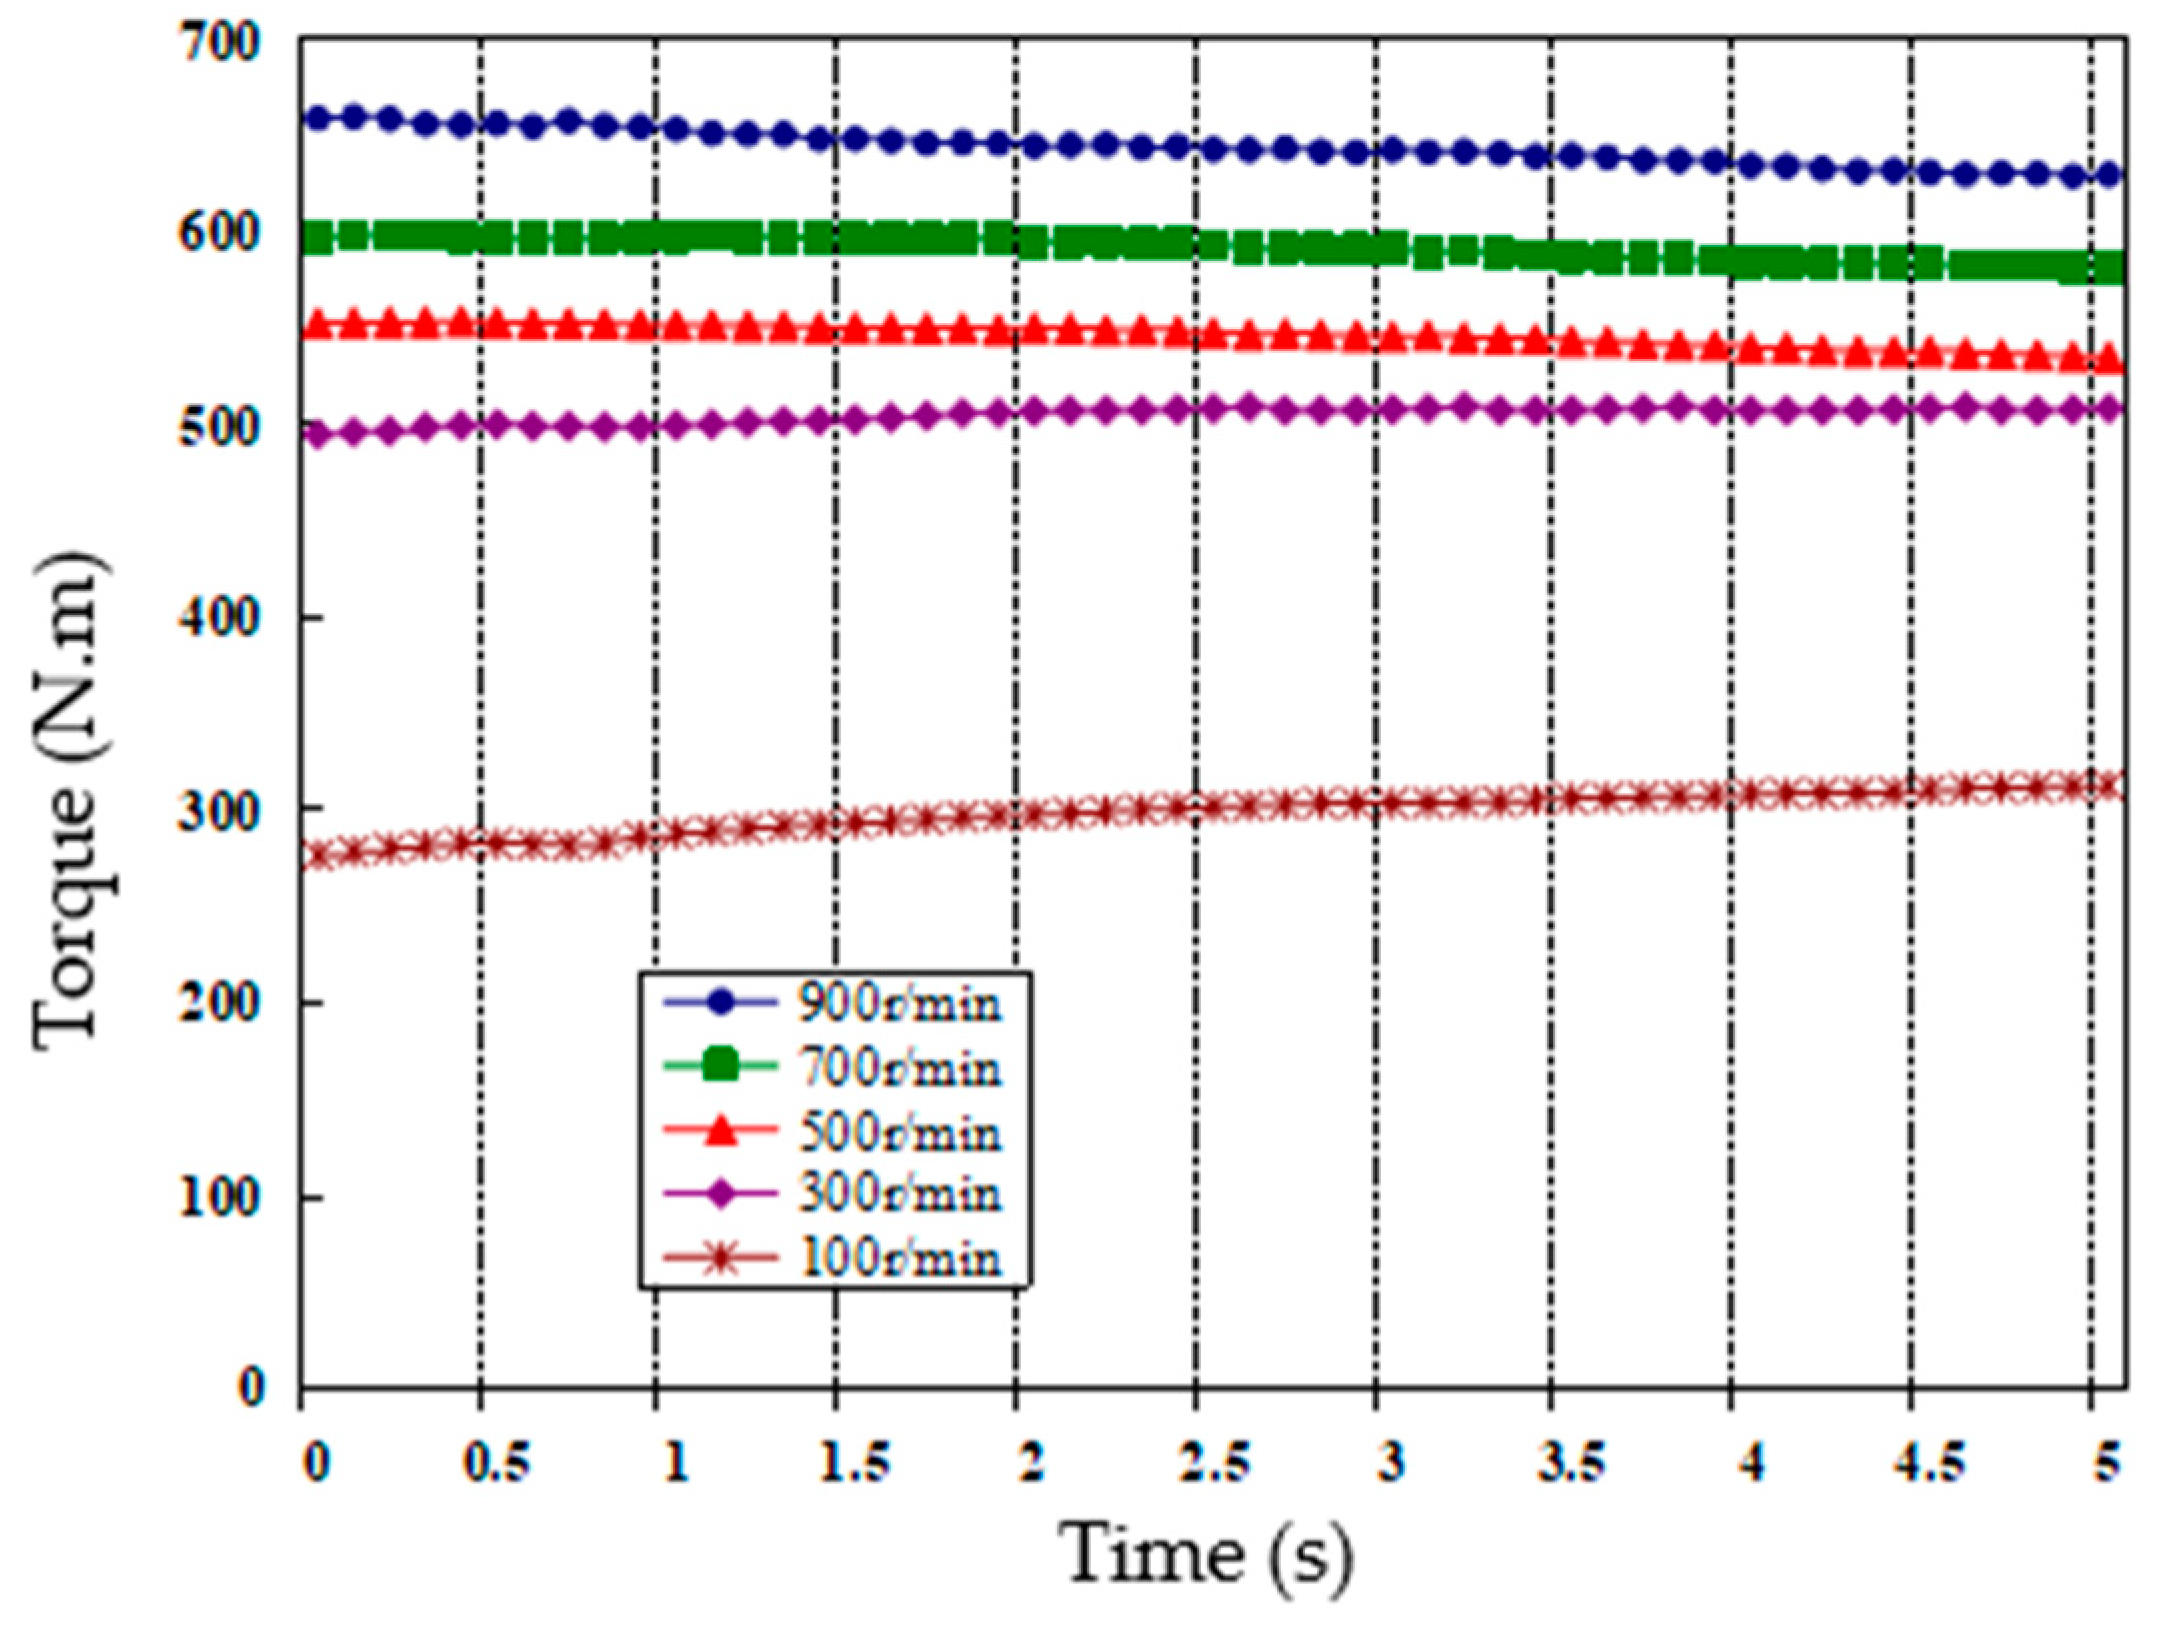
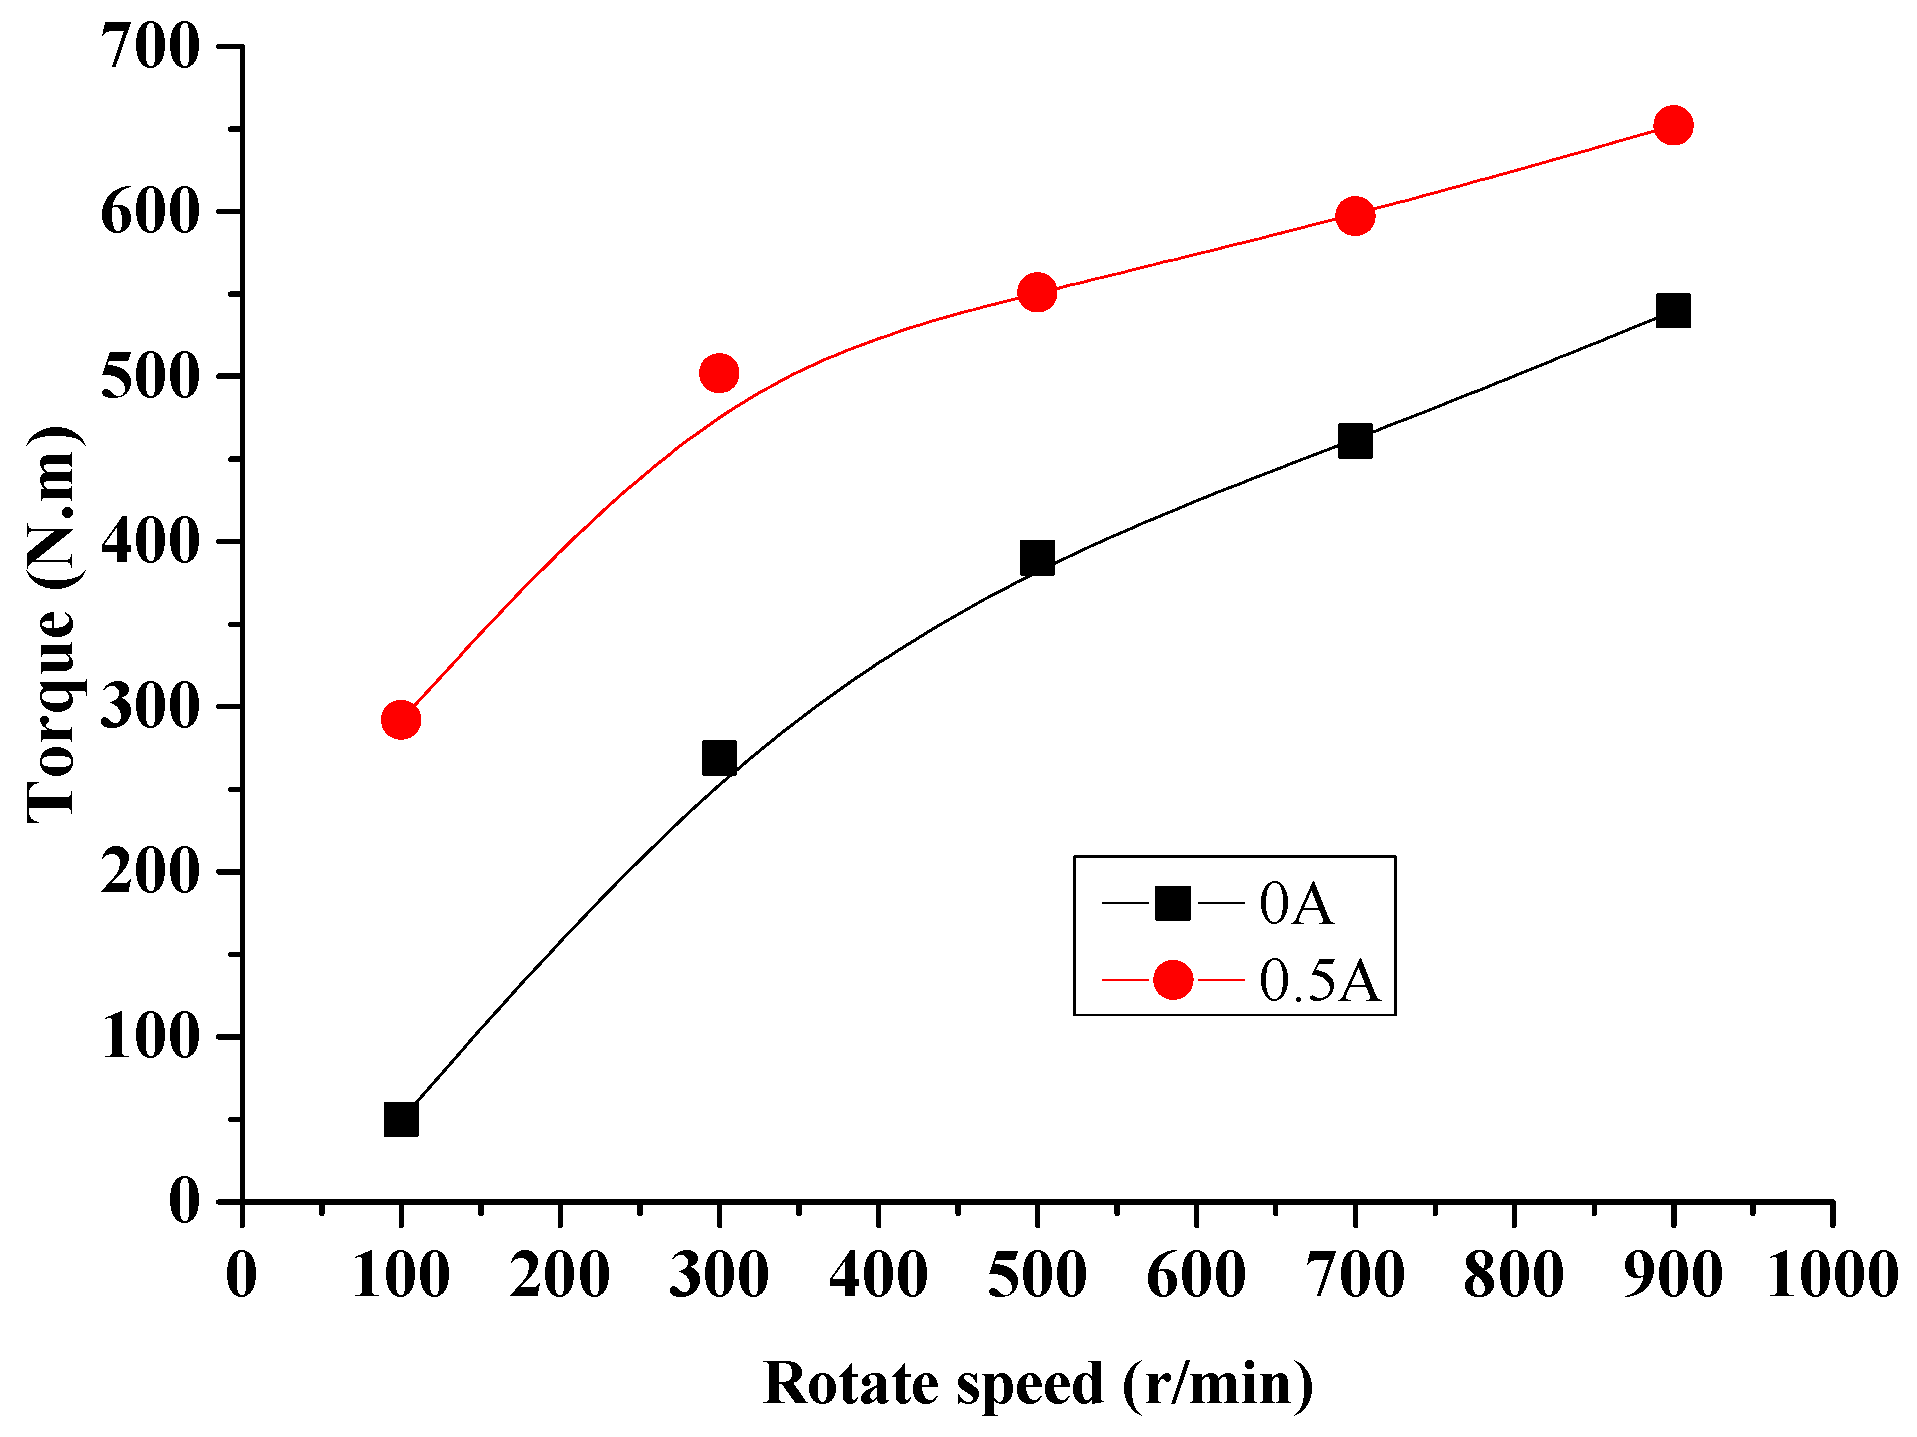
6.3. Rotating Speed Characteristics

The relationship between torque and the slip rotating speed of the transmission device is obtained, as shown in Figure 19 and Figure 20, where the exciting coil current is 0 A and 0.5 A, the slip rotating speed is 100 r/min, 300 r/min, 500 r/min, 700 r/min and 900 r/min, respectively.
It can be seen from Figure 19 and Figure 20 that, in general, the transmittable torque of the transmission device increases with the enhancement of rotating speed. As there is no exciting current and the rotating speed is 100 r/min, 300 r/min, 500 r/min, 700 r/min and 900 r/min, and the viscous torque of the device reaches 50 N.m, 260 N.m, 390 N.m, 460 N.m and 540 N.m, respectively. With the exciting current applied, the torque transmitted by MR fluid is always higher than that without exciting current at different rotating speeds. At rotate speeds higher than 300 r/min, the transmittable torque increases by about 150 N.m with the exciting current applied. At lower speeds, the transmittable torque increases even more due to the enhanced hydraulic torque caused by the disc deflection. Besides, under the above five working conditions, the magneto-induced torque at 0.5 A is 50%, 30%, 27%, 25% and 23%, respectively. The percentage of magneto-induced torque decreases with the increase in rotation speed, which will weaken the torque controllability of MR transmission devices.
As also can be seen from Figure 19, the transmittable torque is always constant at lower slip speeds as the transmittable torque fluctuates less when the temperature increases slowly at a lower slip power. However, the transmittable torque at a rotating speed higher than 500 r/min decreases obviously with the running time as the temperature rises quickly with the increase in slip power. The constant torque characteristics deteriorate, leading to a difficult control of transmittable power.

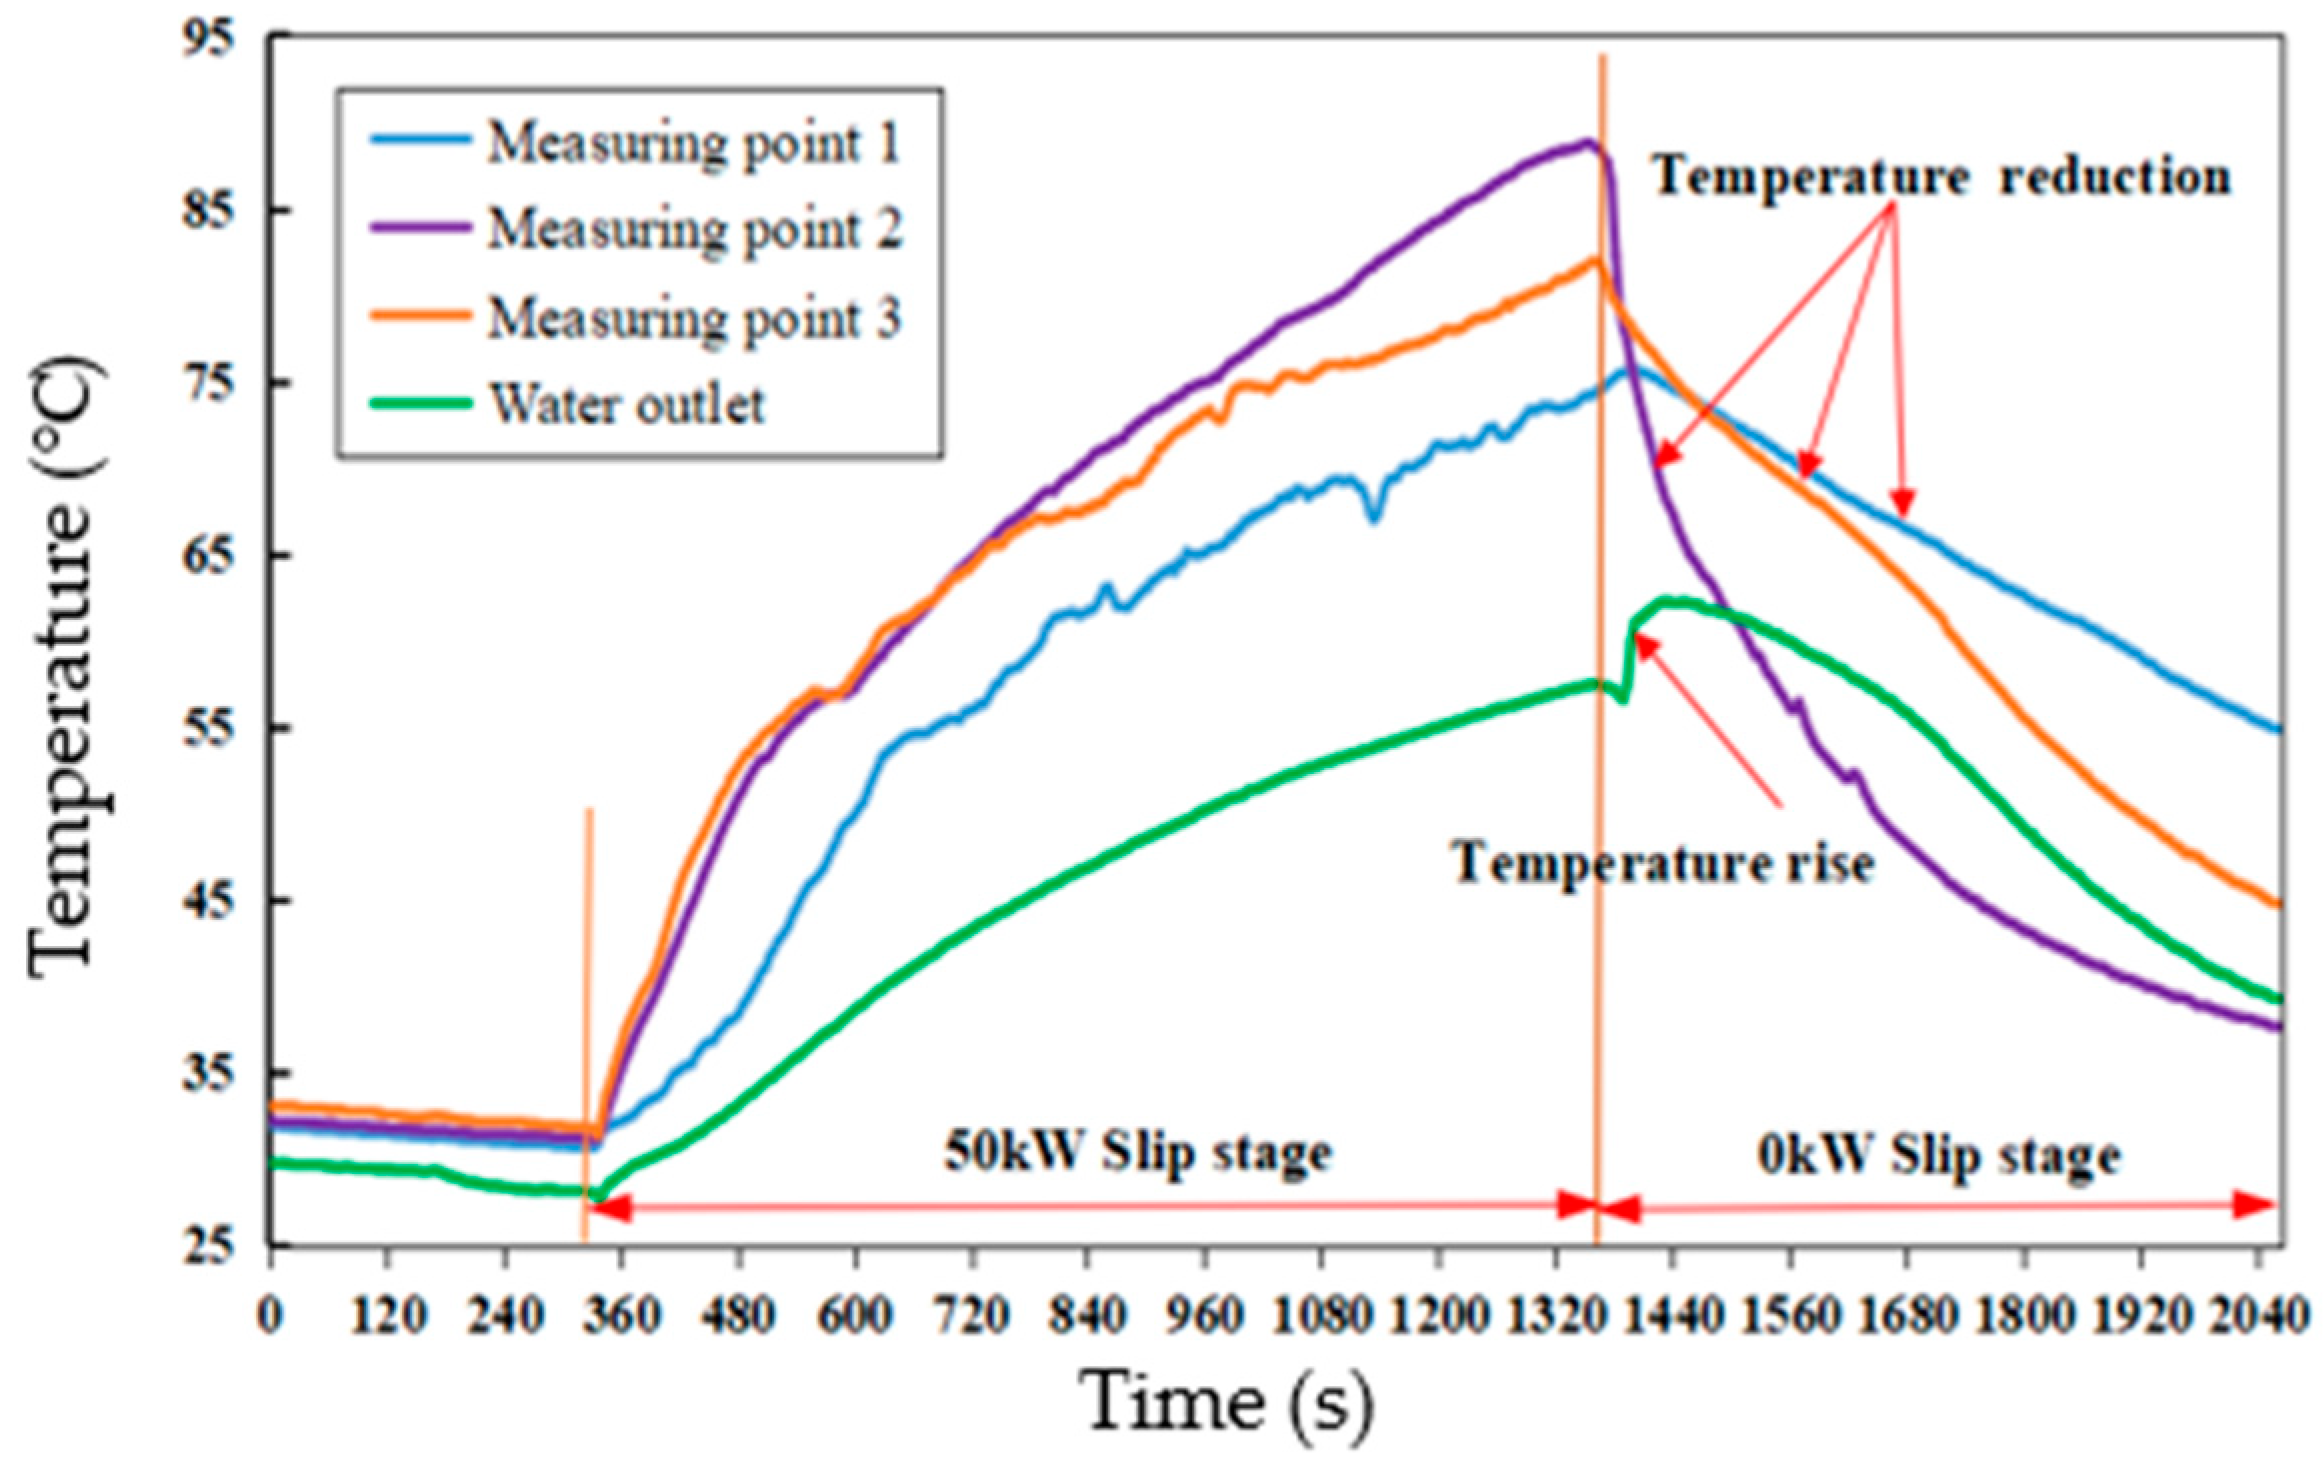
6.4. Influence of Slip Power and Rotating Speed on Heat Dissipation

The slip power of the MR transmission device is 50 kW by adjusting the exciting current when the motor velocity is 500 r/min. Besides, the coolant flow maintains at 0.72 m3/h. Figure 21 shows the temperature of the coolant outlet and three internal monitoring points, where the radius of point one, two and three is 111 mm, 150 mm and 189 mm, respectively.
In the 50 kW slip stage, due to the heat generated by slip, the temperature of each internal measuring point rises rapidly, and the temperature of the cooling water outlet also rises accordingly. In the 0 Kw slip stage, there is no slip and heat generation, and the temperature of each point inside drops rapidly due to the action of the cooling water. The highest temperature is 88 °C, at point two. Under the working condition of the rotating speed of 500 r/min, the temperature obviously take a step up, mainly due to the speed increase leading to the difficulty the cooling water has in moving into the permeability group cooling gap increasing dramatically. After the device stops, the coolant quickly enters the cooling gap and takes away a large amount of heat, causing the temperature rise of the water outlet.

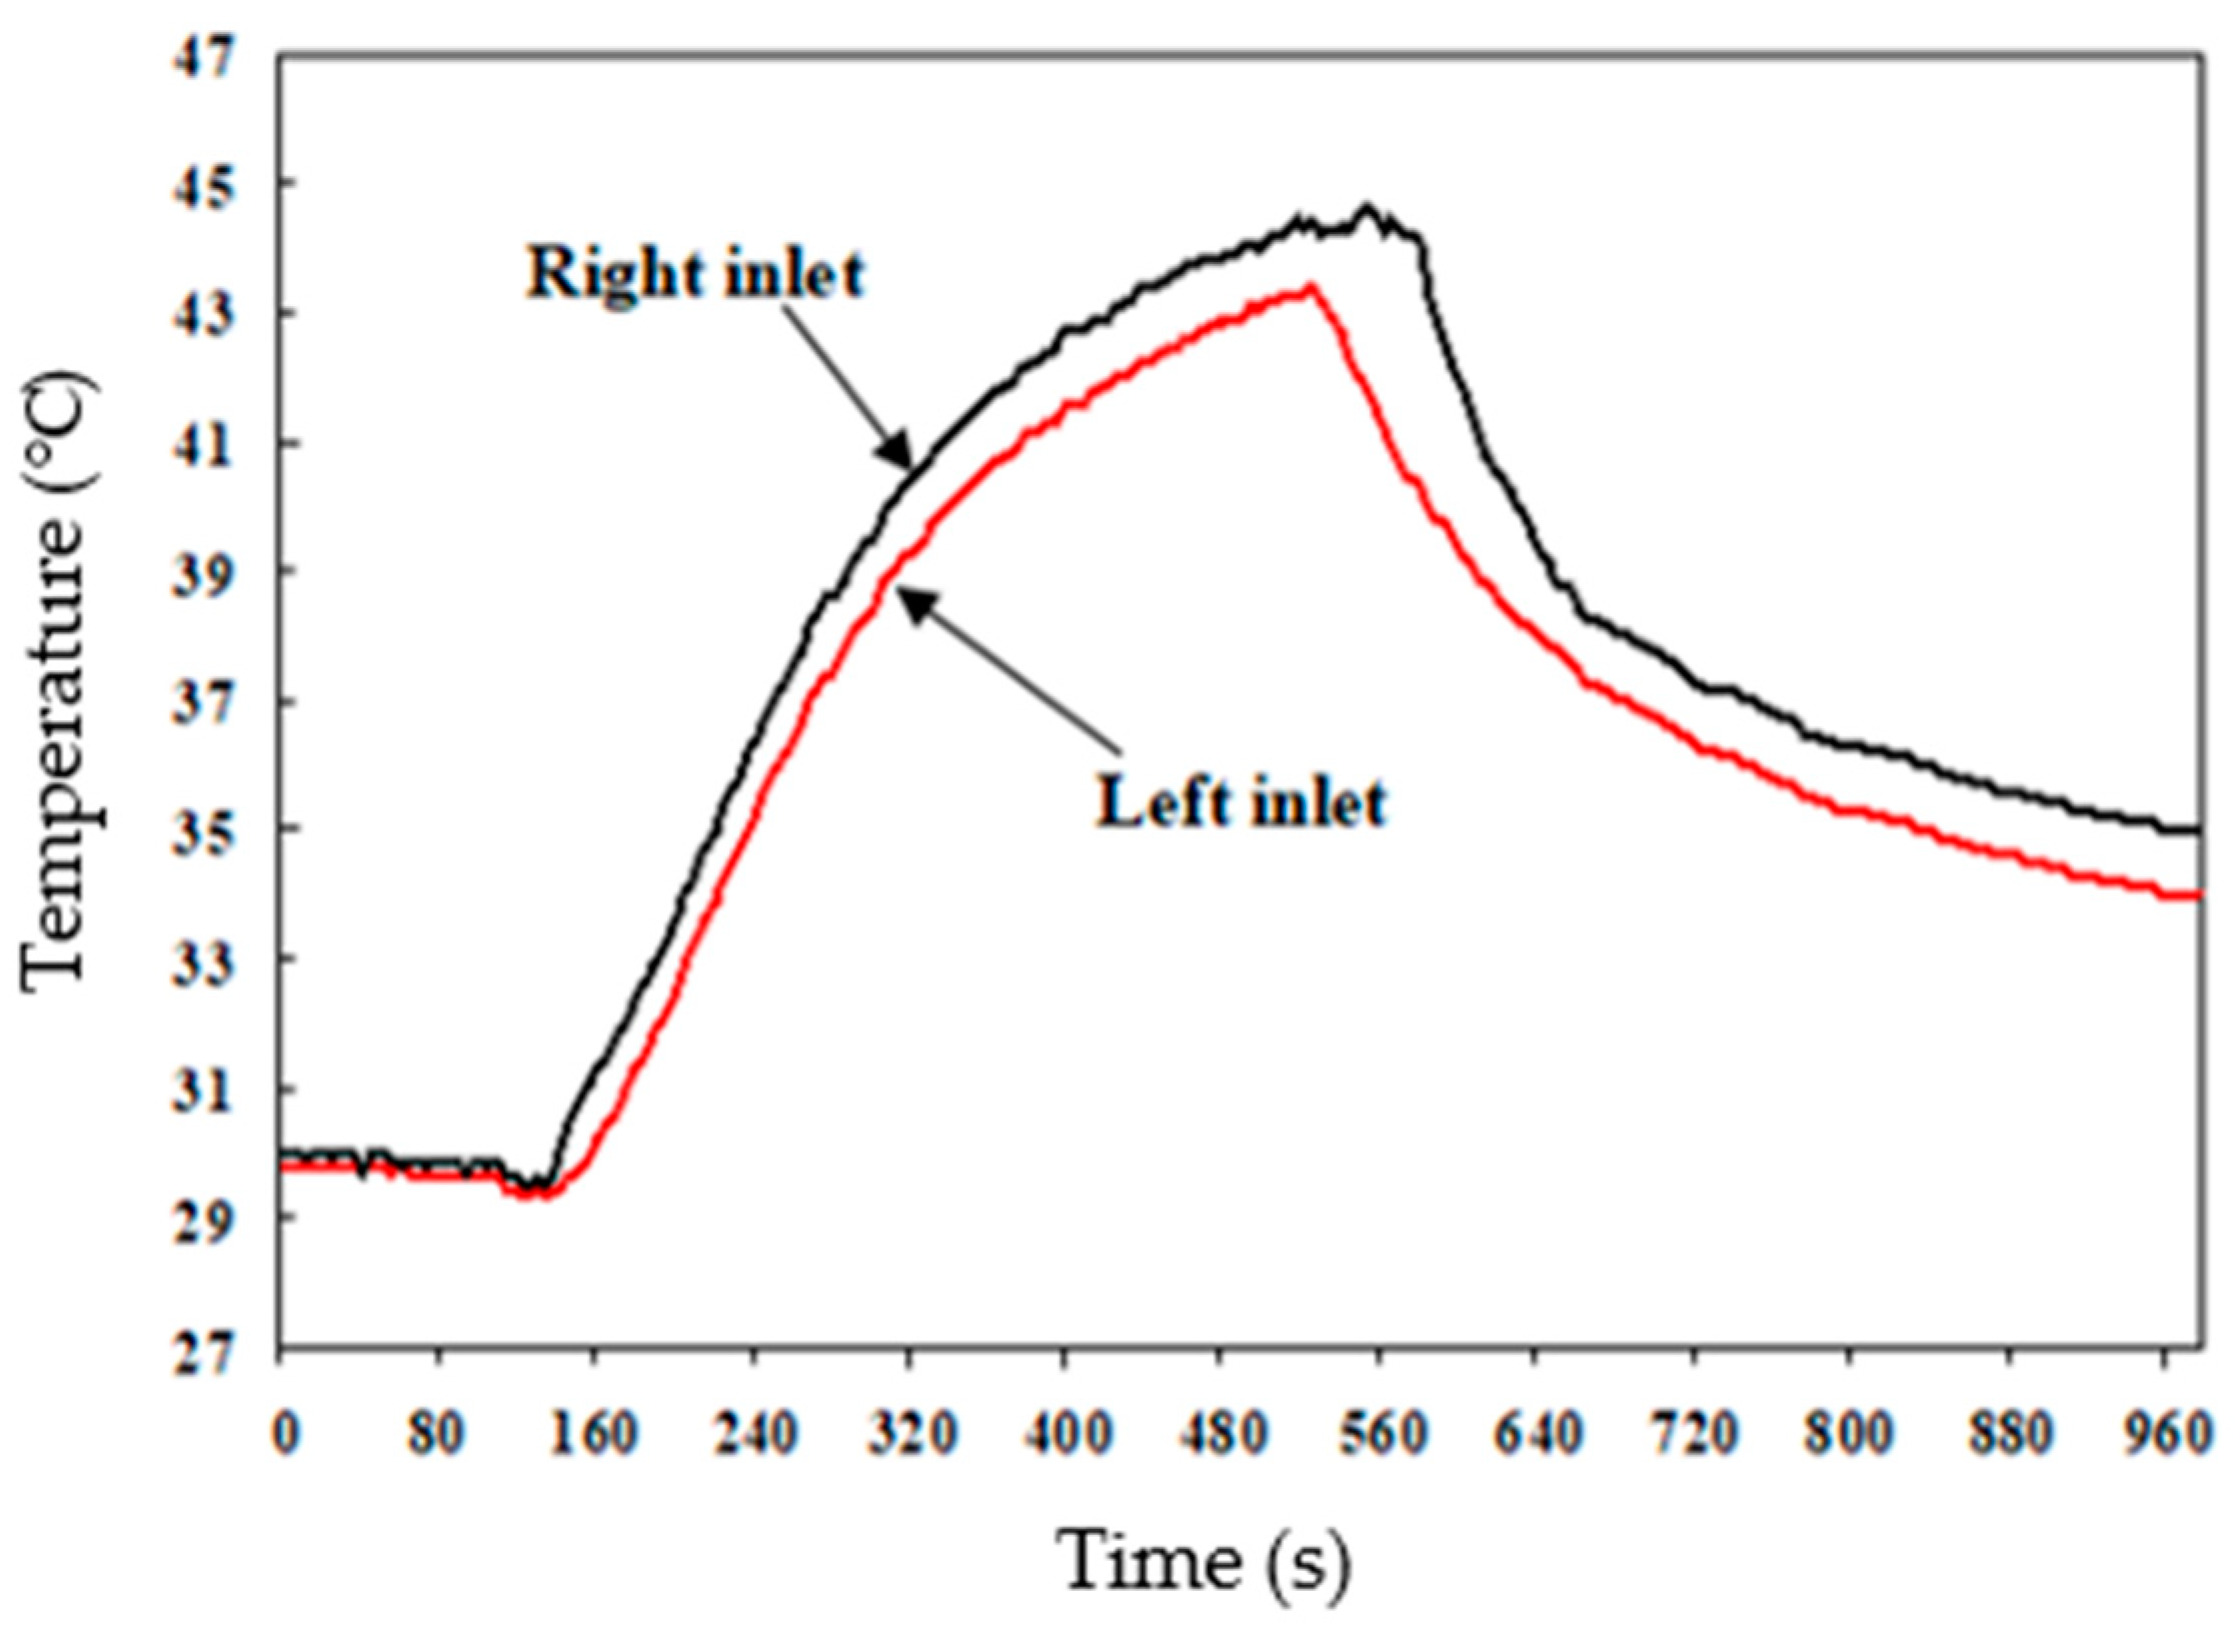
6.5. Influence of Inlet Position

All inlets in the above experiments are all on the left side of the MR transmission device. The inlet is set on the corresponding position of the right side to investigate the influence of the inlet position. The speed of motor is set as 100 r/min, and the slip power is 10 kW. Figure 22 shows the temperature curve of the internal monitoring point three when coolant flows into the device from the inlets on different sides. There is no significant difference between the two temperature curves, of which the maximum difference is only 1.5 °C. The temperature of monitoring point three is slightly higher when the coolant flows through the right inlet as the coolant preferentially flows out from the outlet at the right side due to the hindrance of the internal rotating fluid when it flows through the inlet at right side, and this is consistent with the simulation results in Figure 10.

7. Conclusions

(a) The distribution characteristics of the cooling hydraulic force field are obtained: the minimum pressure and maximum pressure both appear at the connecting column, which are −1.4 kpa and 4.5 kpa, respectively. In the same cooling gap, the pressure at both ends is significantly higher than the middle pressure, which can achieve rapid heat dissipation. The influencing factors of the distribution characteristics of the flow field are analyzed. The distribution of the velocity field of the coolant is similar at different speeds and different inlet velocities. The impact force is proportional, and the position of the inlet has no obvious influence on the flow field of the coolant. The increase in the diameter and number of magnetic columns is conducive to rapid heat dissipation;
(b) The distribution characteristics of the temperature field under transient and ultimate slip power and the influencing factors of the temperature of MR fluid are obtained. At the same time, the limit of the slip power under rapid heat dissipation and phase change heat dissipation is obtained. The results show that the transmission power can still reach 200 kW, even under poor heat dissipation conditions;
(c) Further research can be carried out to enhance steady-state slip power. For instance, a new heat dissipation system could be designed to inject the coolant directly into the cooling gap as it is the key to dissipating heat efficiently, it being paramount that the coolant flows rapidly into cooling gap, while the flowing coolant mainly relies on the discs rotating in the existing method. Furthermore, we can further prepare MR fluid with a higher temperature range.

Author Contributions

Conceptualization, X.W., Z.T. and F.X.; methodology, X.W. and Z.T. software, X.W.; validation, X.W. and Z.T.; formal analysis, X.W.; investigation, X.W., J.J. and Z.T.; resources, X.W. and Z.T.; data curation, X.W. and Z.T.; writing—original draft preparation, X.W., Z.T., Y.G. and H.L.; writing—review and editing, X.W., Y.G., H.L. and Z.T.; visualization, X.W., J.J. and H.L.; super-vision, X.W., Z.T. and F.X.; project administration, X.W., Z.T. and F.X.; funding acquisition, X.W. and Z.T. All authors have read and agreed to the published version of the manuscript.

Funding

This research was funded by the National Natural Science Foundation of China (52005426, 51875560), Jiangsu Natural Science Foundation (BK20190155) and the Priority Academic Program Development of Jiangsu Higher Education Institutions.

Institutional Review Board Statement

Not applicable.

Informed Consent Statement

Not applicable.

Data Availability Statement

Not applicable.

Acknowledgments

The authors would like to gratefully acknowledge the National Natural Science Foundation of China (52005426, 51875560), Jiangsu Natural Science Foundation (BK20190155) and the Priority Academic Program Development of Jiangsu Higher Education Institutions. The authors would like to thank the editors and reviewers for their valuable comments and constructive suggestions.

Conflicts of Interest

The authors declare no conflict of interest. The funders had no role in the design of the study; in the collection, analyses, or interpretation of data; in the writing of the manuscript, or in the decision to publish the results.

References

  1. Wu, X.F.; Huang, C.H.; Tian, Z.Z. Development of a novel magnetorheological fluids transmission device for high-power applications. Smart Mater. Struct. 2019, 28, 05502. [Google Scholar] [CrossRef]
  2. Liu, X.H.; Wang, L.F.; Lu, H. A study of the effect of nanometer Fe3O4 addition on the properties of silicone oil-based magnetorheological fluids. Mater. Manuf. Process. 2015, 30, 204–209. [Google Scholar] [CrossRef]
  3. Rabbani, Y.; Ashtiani, M.; Hashemabadi, S.H. An experimental study on the effects of temperature and magnetic field strength on the magnetorheological fluid stability and MR effect. Soft Matter. 2015, 11, 4453–4460. [Google Scholar] [CrossRef] [PubMed]
  4. Widodo, P.J.; Budiana, E.P.; Ubaidillah, U.; Imaduddin, F. Magnetically-Induced Pressure Generation in Magnetorheological Fluids under the Influence of Magnetic Fields. Appl. Sci. 2021, 11, 9807. [Google Scholar] [CrossRef]
  5. Chen, W.J.; Huang, J.; Yan, Y. Research on the Transmission Performance of a High-Temperature Magnetorheological Fluid and Shape Memory Alloy Composite. Appl. Sci. 2022, 12, 3228. [Google Scholar] [CrossRef]
  6. Cheng, H.; Lim, T.; Kim, S. Sound insulation effect of magnetorheological fluid as a function of magnetic field strength and direction. Mater. Res. Lett. 2022, 10, 310–317. [Google Scholar] [CrossRef]
  7. Zhao, D.; Zhao, J.B.; Zhao, Z.H. Design and experimental study of the porous foam metal magnetorheological fluid damper based on built-in multi-pole magnetic core. J. Intell. Mater. Syst. Struct. 2022, 31, 687–703. [Google Scholar] [CrossRef]
  8. Liu, X.M.; Shi, Y.; Xu, J. Parameters tuning approach for proportion integration differentiation controller of magnetorheological fluids brake based on improved fruit fly optimization algorithm. Symmetry 2017, 9, 109. [Google Scholar] [CrossRef] [Green Version]
  9. Hato, M.J.; Choi, H.J.; Sim, H.H. Magnetic carbonyl iron suspension with organoclay additive and its magnetorheological properties. Colloids. Surf. A 2011, 377, 103–109. [Google Scholar] [CrossRef]
  10. Arief, I.; Mukhopadhyay, P.K. Magnetorheology in CoNi nanoplatelet-based MRFs: Effect of platelet orientation and oscillatory shear. J. Magn. Magn. Mater. 2019, 479, 326–331. [Google Scholar] [CrossRef]
  11. Luong, Q.V.; Jo, B.H.; Hwang, J.H.; Jang, D.S. A Supervised Neural Network Control for Magnetorheological Damper in an Aircraft Landing Gear. Appl. Sci. 2022, 12, 400. [Google Scholar] [CrossRef]
  12. Zhu, X.C.; Jing, X.; Cheng, L. Magnetorheological fluid dampers: A review on structure design and analysis. J. Intell. Mater. Syst. Struct. 2012, 28, 839–873. [Google Scholar] [CrossRef]
  13. Li, H.P.; Jonkkari, I.; Sarlin, E. Temperature effects and temperature-dependent constitutive model of magnetorheological fluids. Rheol. Acta. 2021, 60, 719–728. [Google Scholar] [CrossRef]
  14. Tian, Z.Z.; Chen, F.; Wu, X.F. A novel preparation process for magnetorheological fluid with high sedimentation stability. Mater. Manuf. Process. 2016, 31, 2030–2036. [Google Scholar]
  15. Rizzo, R. An innovative multi-gap clutch based on magneto-rheological fluids and electrodynamic effects: Magnetic design and experimental characterization. Smart Mater. Struct. 2017, 26, 015007. [Google Scholar] [CrossRef] [Green Version]
  16. Acharya, S.; Saini, T.; Kumar, H. Determination of optimal magnetorheological fluid particle loading and size for shear mode monotube damper. J. Braz. Soc. Mech. Sci. 2019, 41, 392. [Google Scholar] [CrossRef]
  17. Lu, C.D.; Wu, M.F.; Wen, D.H. Experimental study on magnetorheological (MR) jet polishing of mould free surface. Key Eng. Mater. 2012, 500, 287–290. [Google Scholar]
  18. Nguyen, Q.H.; Choi, S.B. Optimal design of an automotive magnetorheological brake considering geometric dimensions and zero-field friction heat. Smart Mater. Struct. 2010, 19, 115024. [Google Scholar] [CrossRef]
  19. Li, G.; Ruan, Z.Y.; Gu, R.H. Fuzzy Sliding Mode Control of Vehicle Magnetorheological Semi-Active Air Suspension. Appl. Sci. 2021, 11, 10925. [Google Scholar] [CrossRef]
  20. Weiss, K.D.; Duclos, T.G. Controllable fluids: The temperature dependence of post-yield properties. Int. J. Mod. Phys. 1994, 8, 3015–3032. [Google Scholar] [CrossRef]
  21. Gordaninejad, F.; Breese, D.G. Heating of magnetorheological fluid dampers. J. Intell. Mater. Syst. Struct. 1999, 10, 634–645. [Google Scholar] [CrossRef]
  22. Wiehe, A.; Kieburg, C.; Mass, J. Temperature induced effects on the durability of MR fluids. J. Phys. Conf. Ser. 2013, 412, 012017. [Google Scholar] [CrossRef]
  23. Wang, D.M.; Hou, Y.F. Design and experimental evaluation of a multidisk magnetorheological fluid actuator. J. Intell. Mater. Syst. Struct. 2013, 24, 640–650. [Google Scholar] [CrossRef]
  24. Chen, F.; Tian, Z.Z.; Wang, J. Influence of temperature on the performance of magnetorheological fluid. J. Funct. Mate. 2014, 45, 015707. [Google Scholar]
  25. Francesco, B.; Paola, F. Temperature Effect on the Torque Characteristic of a Magnetorheological Clutch. Mech. Sci. Mater. Struct. 2015, 22, 150–158. [Google Scholar]
  26. Tian, Z.Z.; Wu, X.F.; Xiao, X.M. Influence of Temperature on Torque Transmission Stability of Magnetorheological Fluid. J. Magn. 2018, 23, 529–535. [Google Scholar] [CrossRef]
  27. Yang, J.; Chen, S.; Huang, J. Micro-analysis of slip differential heat of magnetorheological fluids based on micromechanics and microstructures. Mater. Res. Express 2019, 6, 065708. [Google Scholar] [CrossRef]
  28. Ashok, K.K.; Hemantha, K.; Arun, M. Influence of temperature on magnetorheological fluid properties and damping performance. Smart Mater. Struct. 2022, 31, 055018. [Google Scholar]
  29. Wang, D.M.; Zi, B.; Zheng, Y.S. An investigation of thermal characteristics of a liquid-cooled magnetorheological fluid-based clutch. Smart Mater. Struct. 2015, 24, 055020. [Google Scholar] [CrossRef]
  30. Huang, H.; Chen, S.; Chen, K. Novel magnetorheological brake with self-protection and water cooling for elevators. J. Mech. Sci. Technol. 2018, 32, 1955–1964. [Google Scholar] [CrossRef]
  31. Du, C.B.; Zeng, F.N.; Liu, B. A novel magnetorheological fluid damper with a heat insulation function. Smart Mater. Struct. 2021, 30, 075001. [Google Scholar] [CrossRef]
Figure 1. Schematic diagram of novel-high power MR transmission device.
Applsci 12 05044 g001
Figure 2. Model of novel-high power MR transmission device: (a) Geometric model of MR fluid power transmission device; (b) Rotating part model; (c) Main water-cooling channel model.
Applsci 12 05044 g002
Figure 3. Mesh numbers under different maximum mesh sizes.
Applsci 12 05044 g003
Figure 4. Meshing results of MR transmission device: (a) Internal grid; (b) Local grid of magnetic column coolant.
Applsci 12 05044 g004
Figure 5. Pressure contour of coolant: (a) Global pressure contour; (b) Pressure contour in transverse section.
Applsci 12 05044 g005
Figure 6. Pressure contour of coolant in cooling gap: (a) Rightmost side; (b) Middle side; (c) Leftmost side.
Applsci 12 05044 g006
Figure 7. Velocity vector of coolant under different rotating speed and inlet velocity: (a) 100 r/min, 1.0 m/s; (b) 50 r/min, 1.0 m/s; (c) 50 r/min, 2.0 m/s.
Applsci 12 05044 g007
Figure 8. Velocity streamline of the coolant around discs under different rotating speed and inlet velocity: (a) 100 r/min, 1.0 m/s; (b) 50 r/min, 1.0 m/s; (c) 50 r/min, 2.0 m/s.
Applsci 12 05044 g008
Figure 9. Velocity field of the coolant on both sides of the inlet (inlet velocity 0.5 m/s): (a) Velocity vector contour, 1.0 m/s; (b) Peripheral streamline contour.
Applsci 12 05044 g009
Figure 10. Velocity field of the coolant on both sides of the inlet (inlet velocity 2.0 m/s): (a) Velocity vector contour, 1.0 m/s; (b) Peripheral streamline contour.
Applsci 12 05044 g010
Figure 11. Velocity field of the coolant with the diameter of the magnetic column increasing: (a) Vector contour of the global velocity field; (b) Vector contour of the velocity in the cooling gap.
Applsci 12 05044 g011
Figure 12. Amplified contour of the velocity vector and the streamline: (a) Amplified contour of the velocity vector in the cooling gap; (b) Amplified contour of the streamline in the cooling gap.
Applsci 12 05044 g012
Figure 13. Contour of the velocity vector and the streamline with an increase in the magnetic columns: (a) Global contour of the velocity vector; (b) Contour of the streamline in the cooling gap; (c) Contour of the velocity vector in the cooling gap.
Applsci 12 05044 g013
Figure 14. Transient temperature of the MR transmission device: (a) 240 s; (b) 460 s.
Applsci 12 05044 g014
Figure 15. Temperature variation curve of the measuring point in the working gap.
Applsci 12 05044 g015
Figure 16. Temperature distributing under phase-change cooling condition: (a) Heat transfer coefficient 10,000 W / ( m 2 · K ) ; (b) Heat transfer coefficient 2500 W / ( m 2 · K ) .
Applsci 12 05044 g016
Figure 17. Experiment system.
Applsci 12 05044 g017
Figure 18. No-field torque variation.
Applsci 12 05044 g018
Figure 19. Torque variation in the MR fluid device under different rotation speeds (exciting current is 0.5 A).
Applsci 12 05044 g019
Figure 20. Relationship between torque and rotate speed.
Applsci 12 05044 g020
Figure 21. Influence of slip power and rotating speed on temperature rise (Slip power 50 kW, rotating speed 500 r/min).
Applsci 12 05044 g021
Figure 22. Influence of the inlet position on the temperature rise.
Applsci 12 05044 g022
Table 1. Working field parameter setting.
TypeParameterSetting
Fluid domainMaterialWater (1 atm)
Heat TransferThermal Energy
Turbulencek-ε model
Wall TypeSmooth Wall (No Slip)
Solid domainMaterialSteel
Domain MotionRotating
Heat TransferThermal Energy
Wall TypeWall
Heat Transfer Coefficient10 W/(m2·K)
Outside Temperature300 K
Rotating solid domainMaterialSteel
Domain MotionRotating
Heat TransferThermal Energy
Publisher’s Note: MDPI stays neutral with regard to jurisdictional claims in published maps and institutional affiliations.

